Sample Category Title
Fed Bullard: Too early to claim inflation has peaked
St. Louis Fed President James Bullard said in an MNI interview, "we may see some relief in the headline CPI tomorrow but the reason we tend to track core PCE inflation is exactly because we ignore the energy price movement on the way up but also on the way down."
"I would like to see improvements across a range of indicators of inflation, not just one measure ticking down a little bit but clear and convincing evidence," he said, adding that it's going to be "much harder" to get core factors to turn around.
Bullard still wants to get interest rates to 3.75-4.00% range by the end of the year. "I think the destination is a little bit higher than what I would have thought even a couple months ago because inflation has continued to broaden out and doesn't look like it's turning the corner at least based on the evidence we have today... I think it's too early to make the claim that inflation has peaked."
Technical Outlook and Review
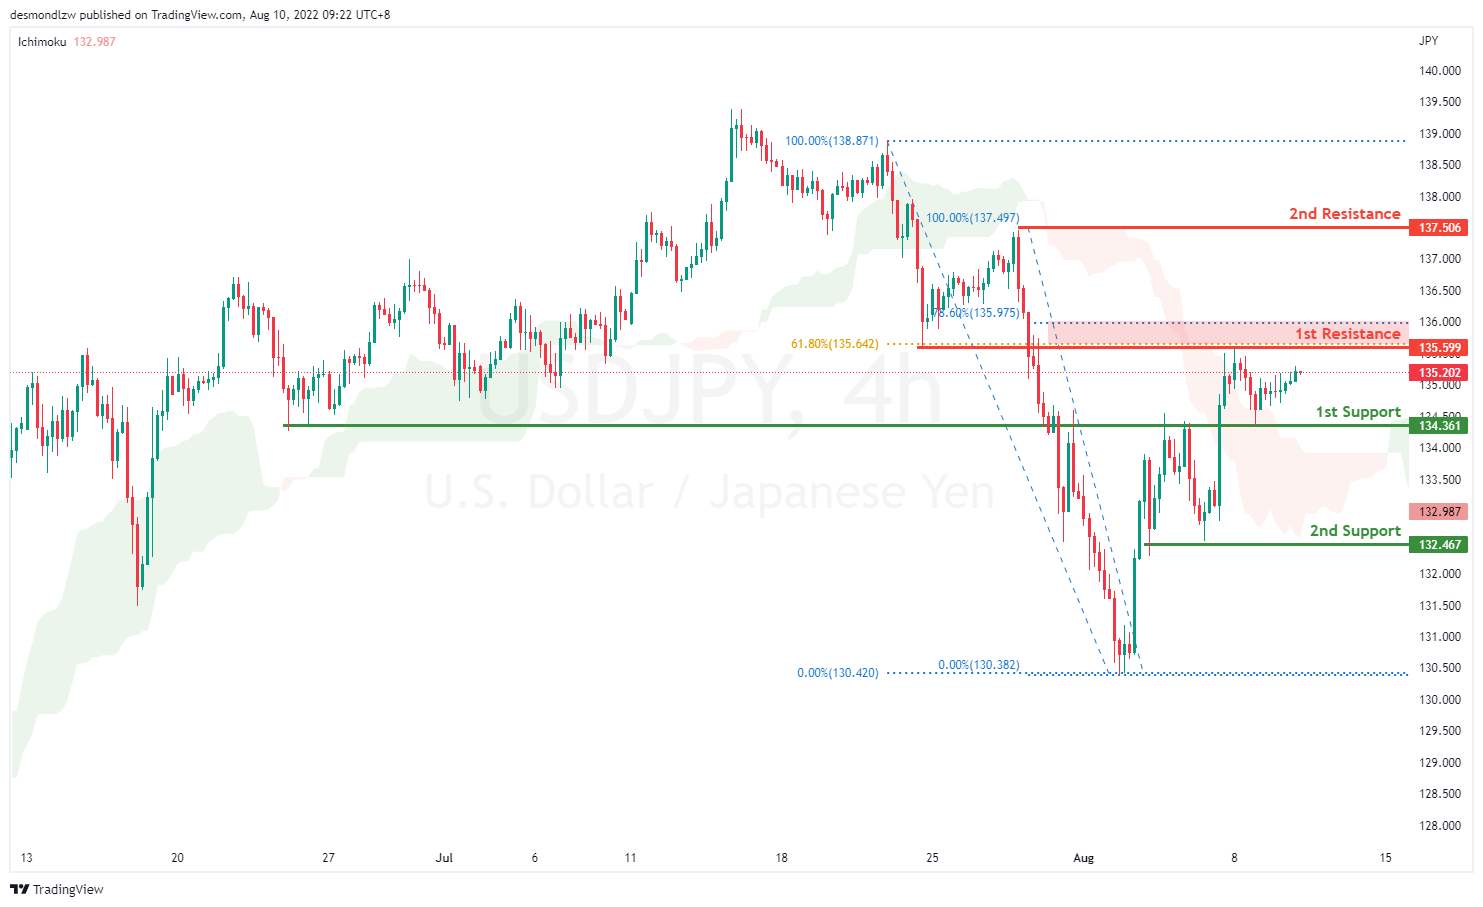
USD/JPY:
On the H4, price is still bullish biased as it fails to pull back to the first support the previous session. It is currently moving towards the first resistance at 135.599 which coincides with the 61.8% Fibonacci retracement and the previous swing low. If price breaks this level, it will move up to test at the second resistance which is the previous swing high at 137.506. Alternatively, price could pull back to test at the first support 134.361 which is the previous swing low
Areas of consideration:
- H4 time frame, 1st resistance at 135.599
- H4 time frame, 1st support at 134.361
DXY:
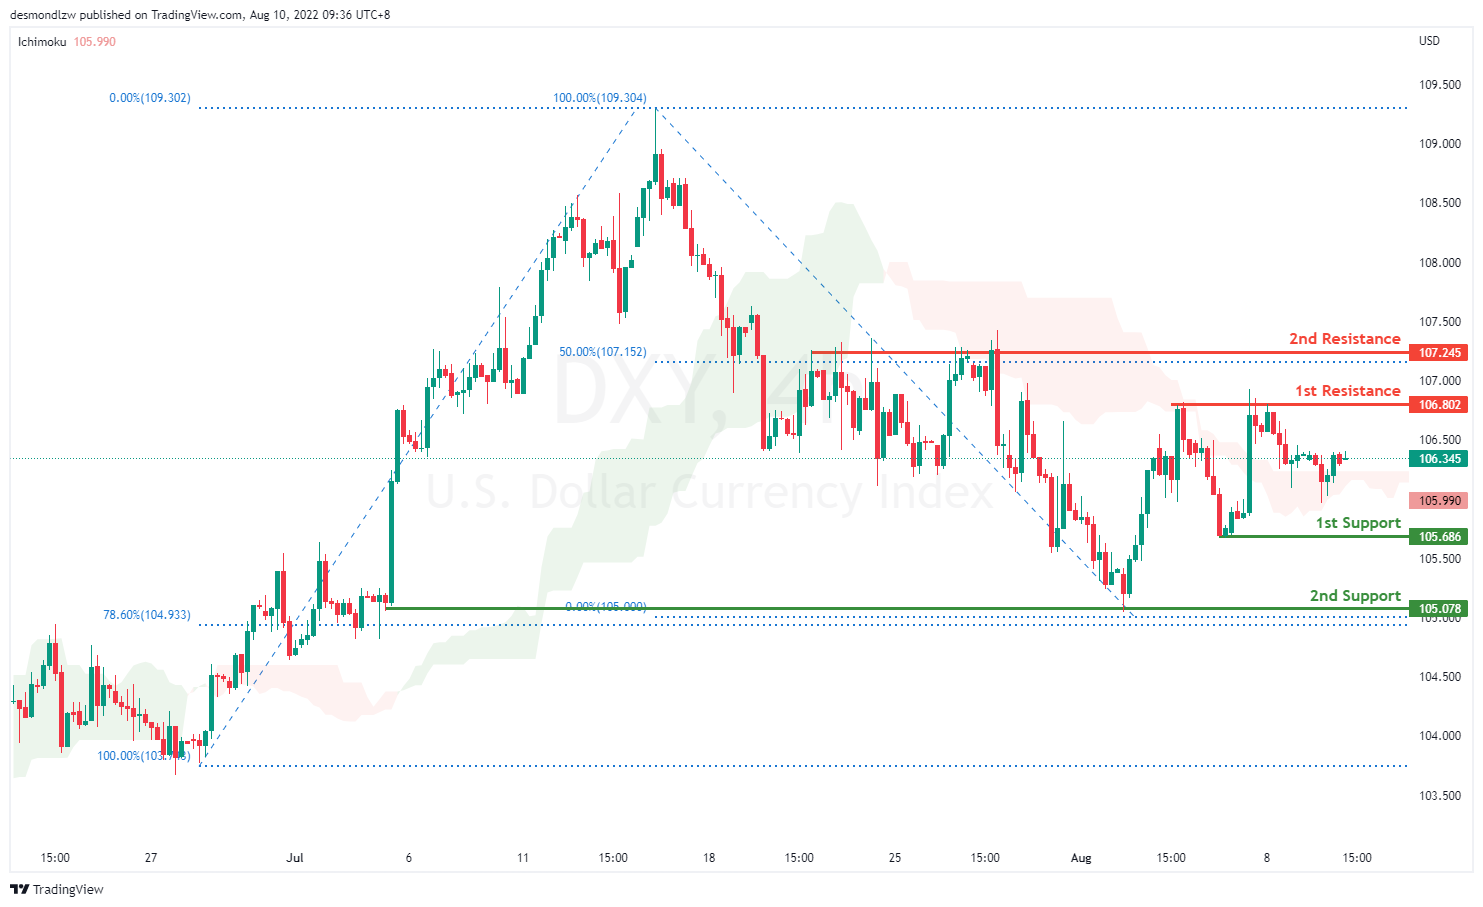
On the H4, prices have broken the descending trend into a bullish biased trend. Prices look like it’s going to test at the first resistance 106.802 where the previous swing high sits. If prices break the first resistance it will confirm a bullish momentum and prices will continue to move in an ascending trend towards the second resistance at 107.245 where the 50% fibonacci retracement sits. If prices rejects the first resistance and continues in the descending trend, it will test at the first support 105.686 and then the second support at previous swing low 105.078
Areas of consideration:
- H4 time frame, 1st resistance at 106.802
- H4 time frame, 1st support at 105.686
EUR/USD :
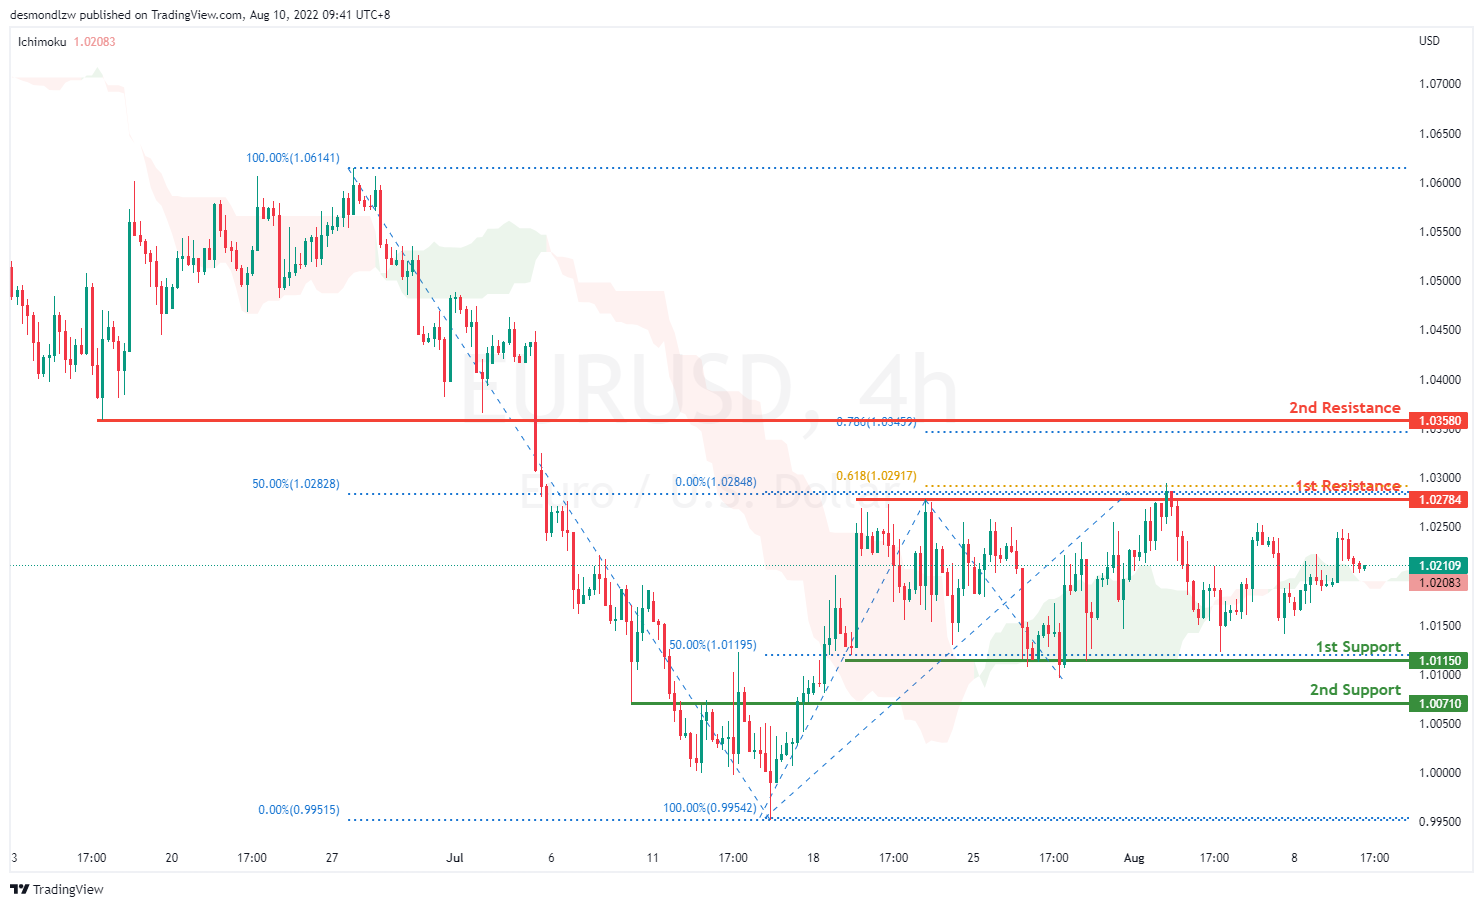
On the H4, prices have broken the bearish trend moving into a slightly bullish biased trend. Price is ranging and it seems like it’s going back to test the first resistance at 1.02784 where the 61.8% fibonacci projection and 50% retracement sits. If prices break the first resistance, it will pull back further to test at the second resistance at 1.035. Alternatively, price might test the 1st support at 1.011
Areas of consideration :
- H4 1st resistance at 1.027
- H4 1st support at 1.011
GBP/USD:
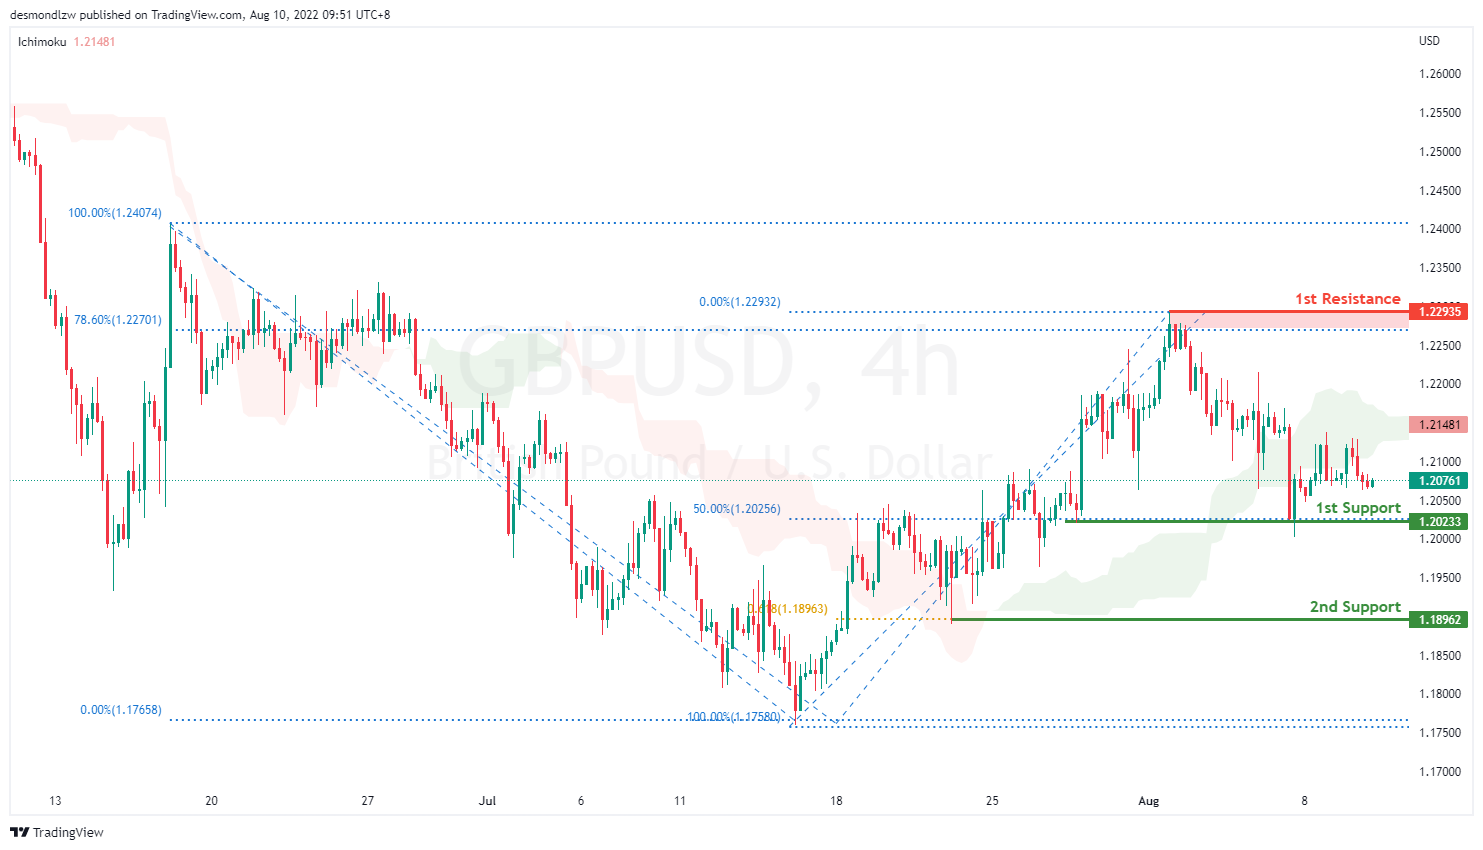
On the H4, with prices breaking the ascending channel we are now slightly bearish biased. Price is now moving toward the first support at 1.202 which coincides with 50% Fibonacci retracement. If price break supports and confirms downside trend, we would expect downside momentum to carry price to 2nd support at 1.189 61.8% Fibonacci projection. Alternatively, price could bounce back to test at 78.6% Fibonacci retracement at 1.229
Areas of consideration:
- H4 1st resistance at 1.229
- H4 1st support at 1.202
USD/CHF:
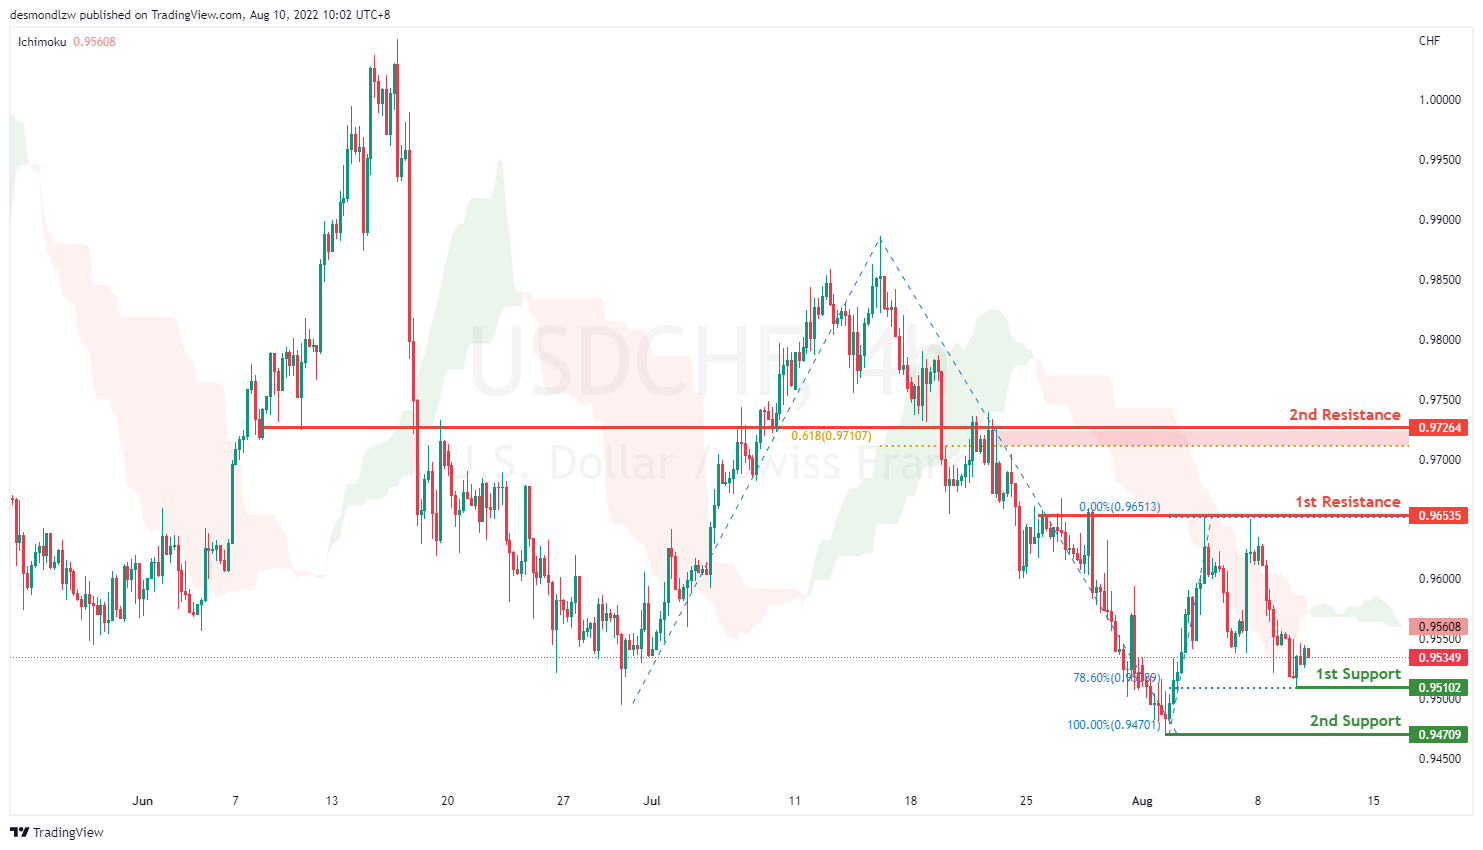
On the H4, prices have signalled a slightly bearish momentum as it rejected the 1st resistance at 0.965 which is also the precious swing highs. Prices are moving toward the first support at 0.951 where the 78.6% fibonacci retracement sits. If price continues with the downward momentum, it will bring price to the previous swing low at 0.947. 50% Fibonacci retracement to test at the 1st support 0.955 23.6% fibonacci retracement. If prices break this key level, it will pull back further to test at the second support at 0.947. Alternatively price could test 1st resistance 0.963 subsequently the second resistance at 0.972 where the 61.8% fibonacci projection and previous swing low levels sit
Areas of consideration
- H4 1st resistance at 0.963
- H4 1st support at 0.951
XAU/USD (GOLD):
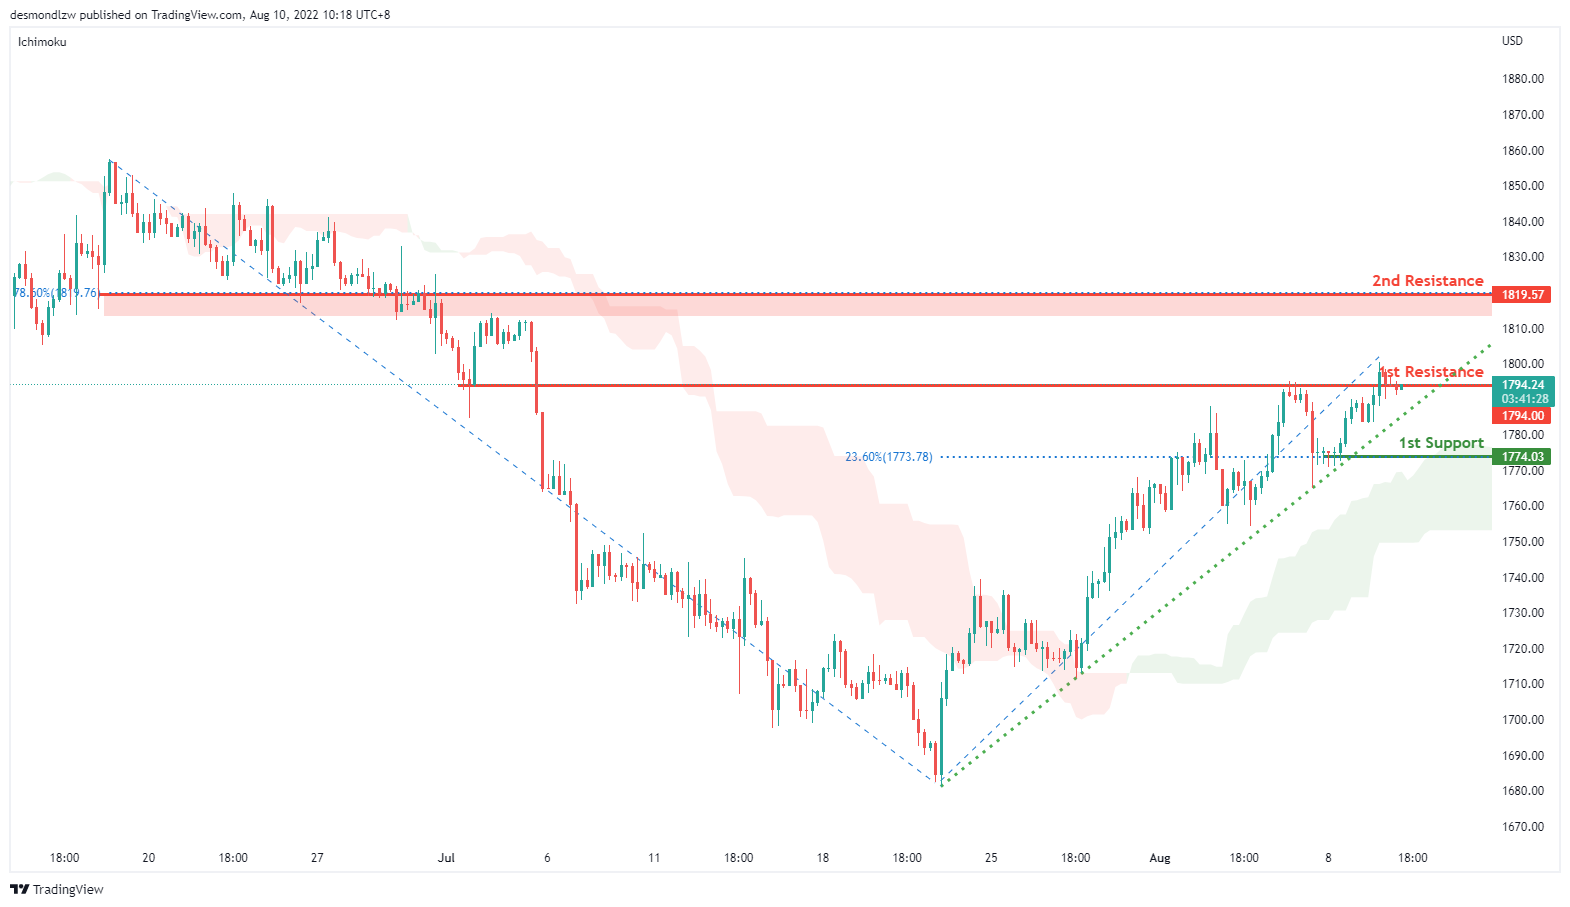
On the H4, with prices moving along the ascending trendline and above the ichimoku cloud, we have a bullish bias that the price may rise from the 1st resistance at 1794.00, which is in line with the overlap support to the 2nd resistance at 1819.57, which is in line with the 78.6% fibonacci retracement. Alternatively, prices may drop to 1st support at 1774.03,which is in line with the pullback support.
Areas of consideration:
- H4 time frame, 1st resistance at 1794.00
- H4 time frame, 2nd resistance at 1819.57
AUD/USD:
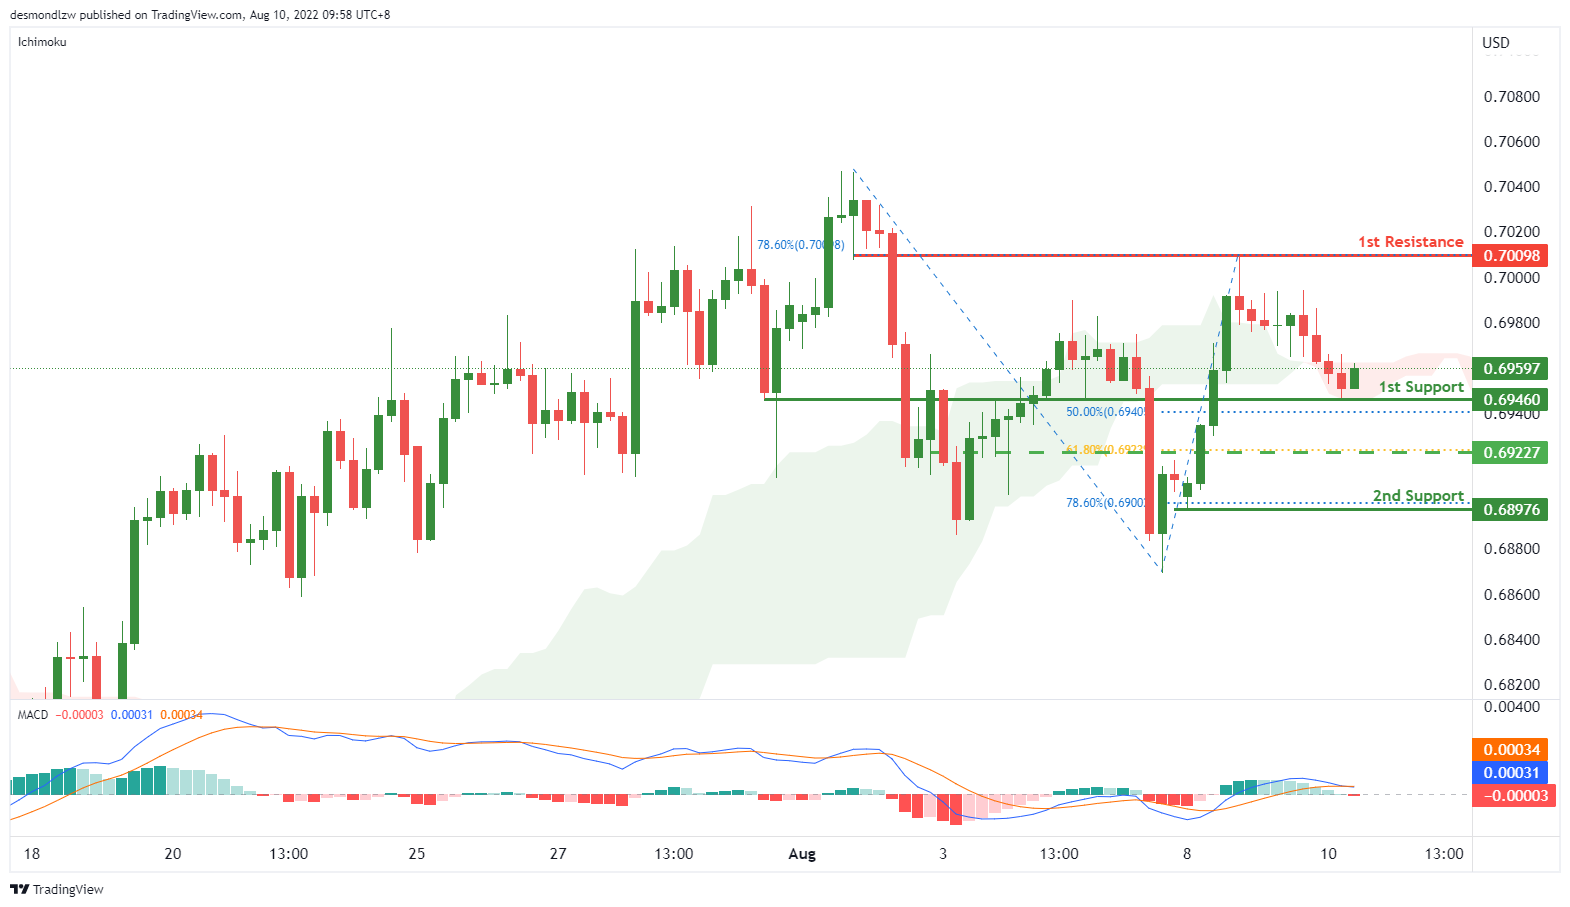
On the H4, with the DIF line is breaking below the signal line in MACD, we have a bearish bias that price may drop from the 1st support at 0.69460, where the swing low and 50% fibonacci retracement are to the 2nd support at 0.68976 where the 78.6% fibonacci retracement is. Alternatively, price may rise to the 1st resistance at 0.70098 which is in line with 78.6% fibonacci retracement and swing high. Take note the 0.69227 could be our intermediate support, which is in line with 61.8% fibonacci retracement.
Areas of consideration
- H4 1st support at 0.69460
- H4 2nd support at0.68976
NZD/USD:
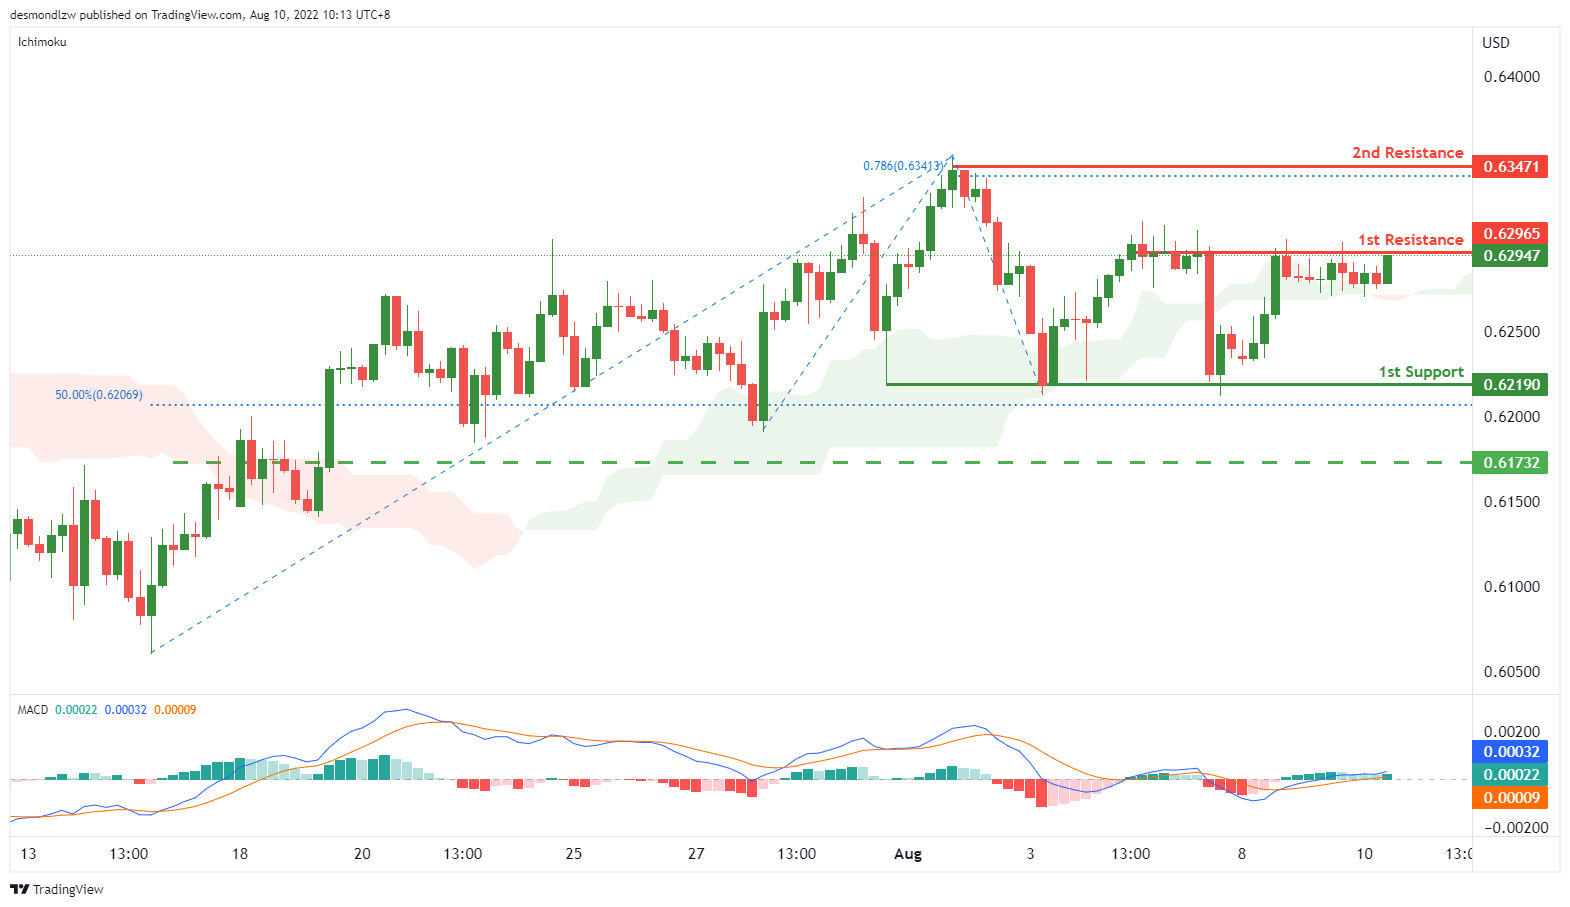
On the H4, with price moving above the ichimoku cloud and the histogram is above zero axis, we have a bullish bias that price may rise from the 1st resistance at 0.62965 where overlap resistance is to the 2nd resistance at 0.63471 where 78.6% fibonacci projection is. Alternatively, price may reverse off the 1st resistance and drop to 1st support at 0.62190 where the swing low support is.
Areas of consideration:
- H4 time frame, 1st resistance at 0.62965
- H4 time frame,2nd resistance at 0.63471
USD/CAD:
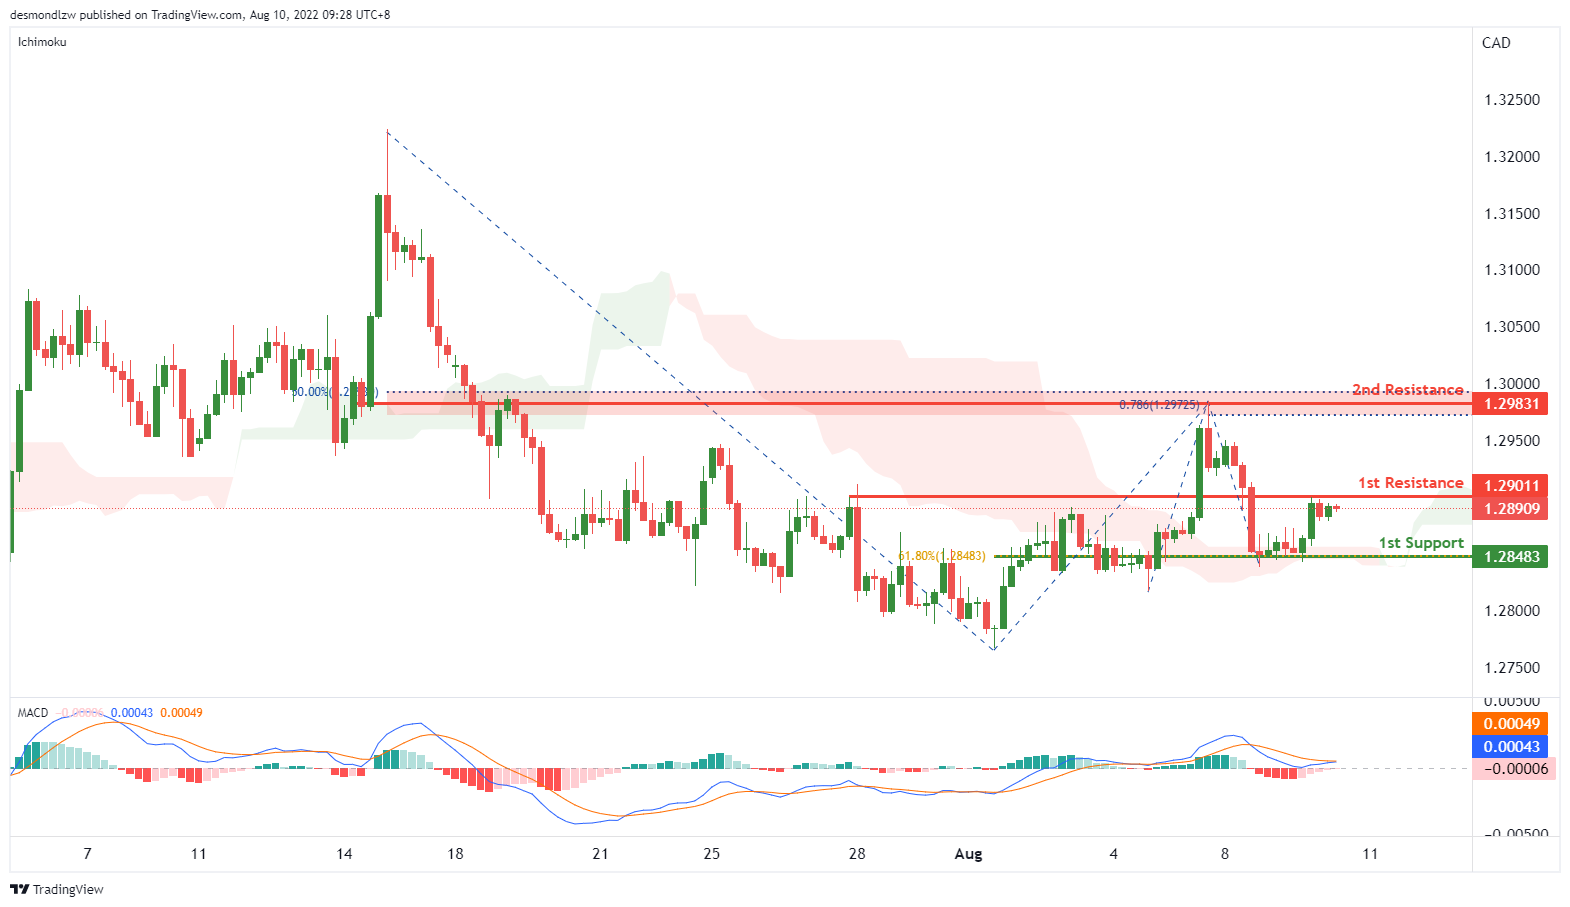
On the H4, with the price going above ichimoku cloud, and DIF is breaking the signal line in MACD, we have a bullish bias that the price may rise from our 1st resistance at 1.29011, which is in line with previous swing high to our 2nd resistance at 1.29831, which is in line with the 78.6% fibonacci projection and 50% fibonacci retracement. Alternatively, the price may drop to the 1st support at 1.28483, which is in line with 61.8% fibonacci retracement and pullback support.
Areas of consideration:
- H4 time frame, 1st resistance at 1.29011
- H4 time frame, 2nd resistance at 1.29831
OIL:
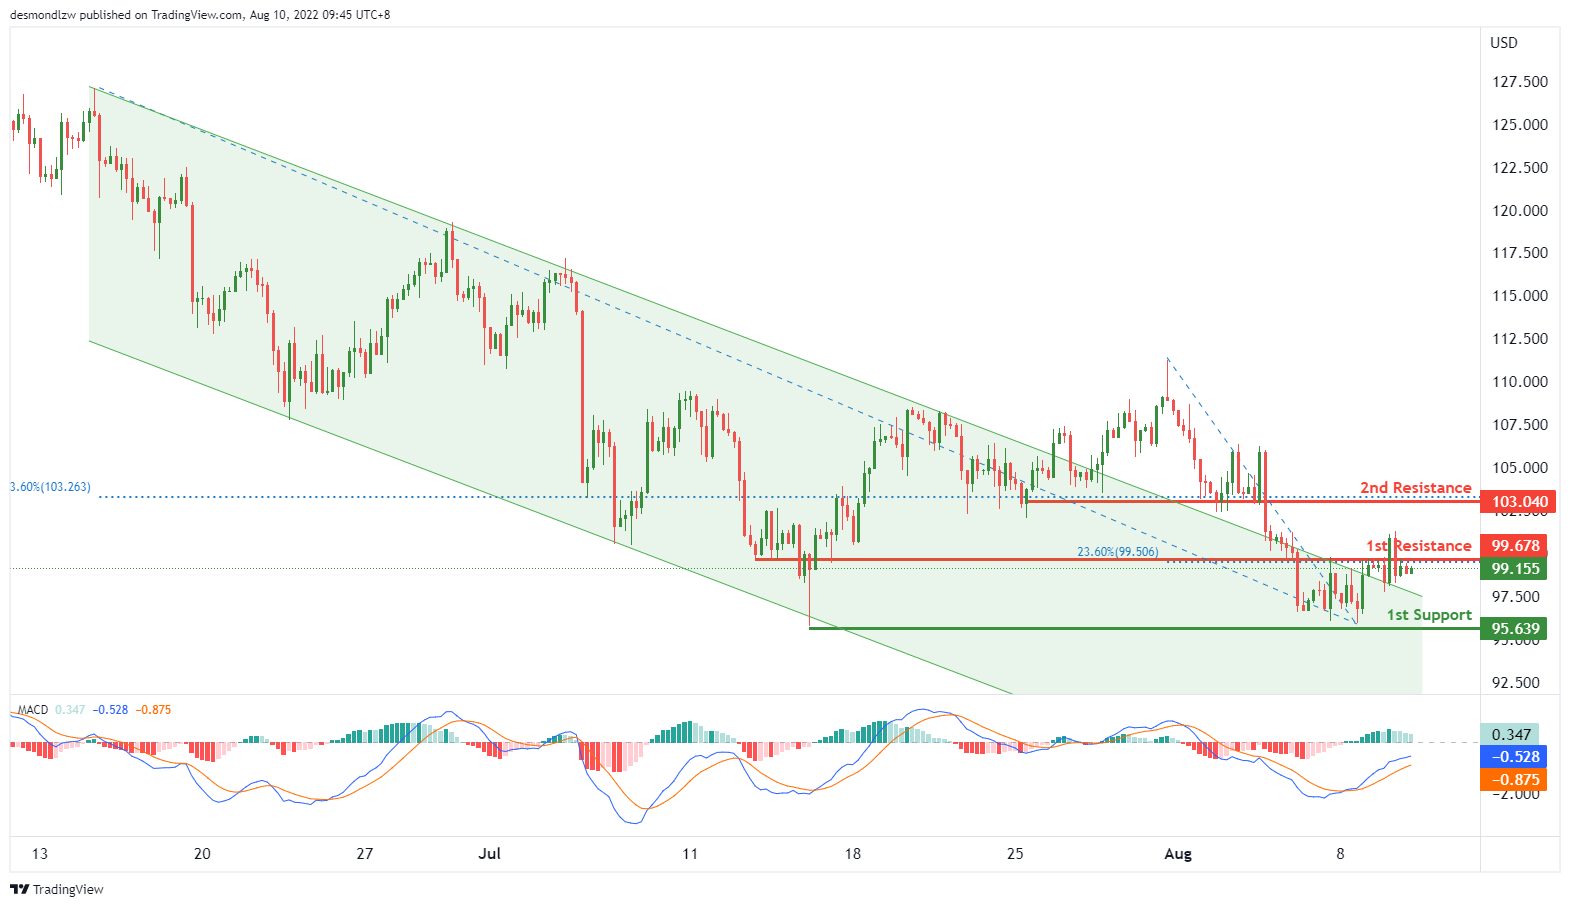
On the H4, with price braking the descending trendline, and the histogram of MACD is above zero axis, we have a bullish bias that the price may rise from our 1st resistance at 99.678, which is in line with the 23.6% fibonacci retracement to the 2nd resistance at 103.040, which is in line with the 23.6% fibonacci retracement and overlap resistance. Otherwise, the price may drop to our 1st support at 95.639, where the swing low support is.
Areas of consideration:
- H4 time frame, 1st resistance at 99.678
- H4 time frame, 2nd resistance at 103.04
Dow Jones Industrial Average:
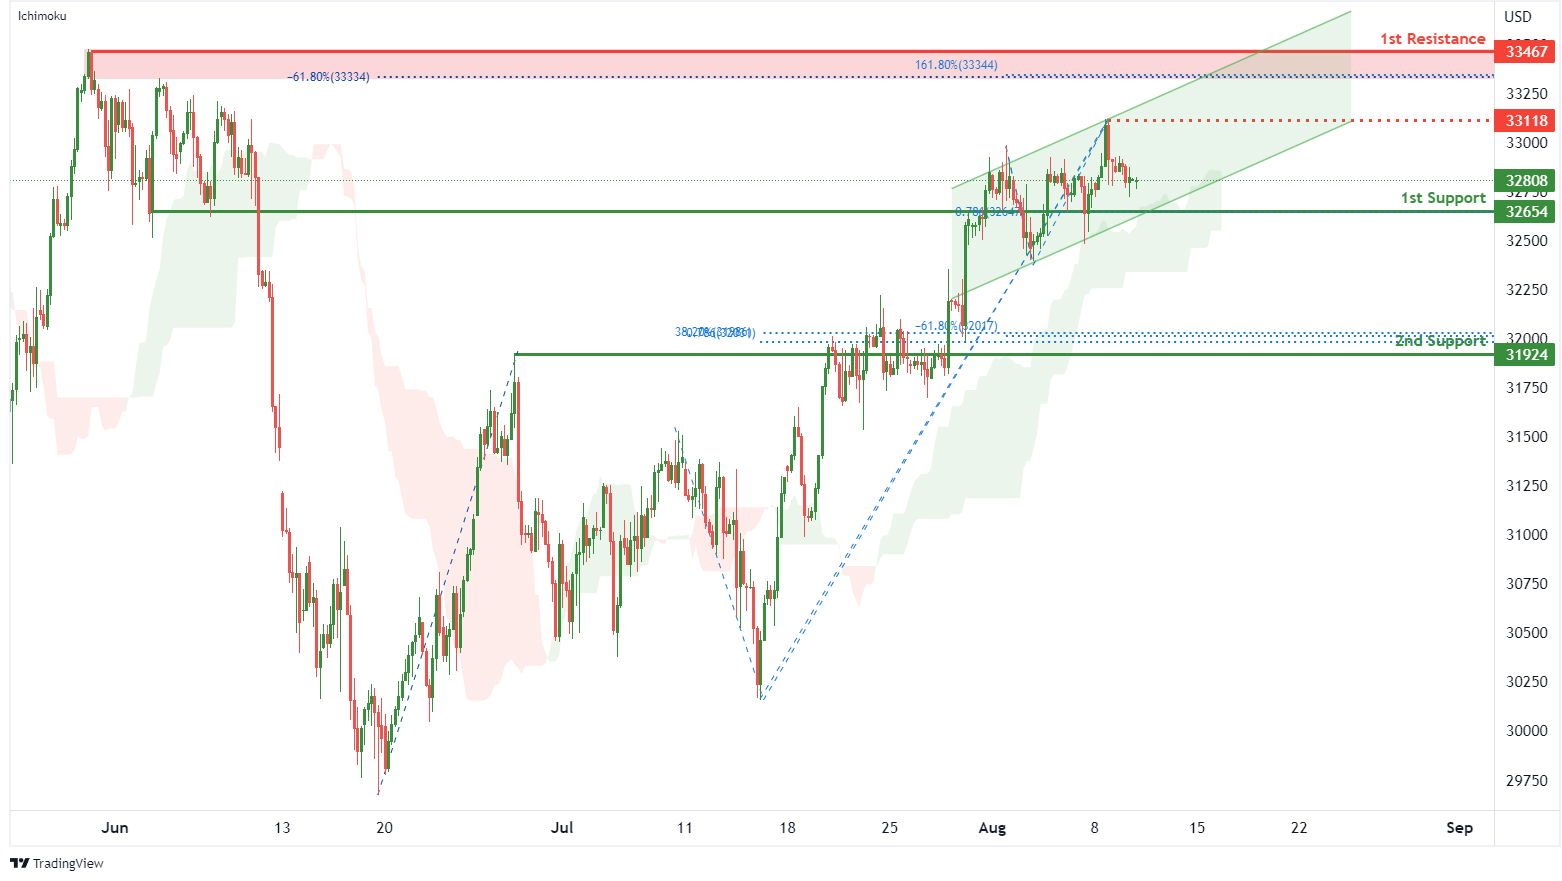
On the H4, with price moving above the ichimoku indicator and within an ascending channel, we have a bullish bias that price will rise from the 1st support at 32654 where the pullback support and 78.6% fibonacci projection are to the 1st resistance at 33467 where the swing high resistance, 161.8% fibonacci extension and -61.8% fibonacci expansion are. Take note of intermediate resistance at 33118 where the swing high resistance is. Alternatively, price could break 1st support structure and drop to 2nd support at 31924 where the pullback support, -61.8% fibonacci expansion, 38.2% fibonacci retracement and 78.6% fibonacci projection are.
Areas of consideration:
- H4 time frame, 1st resistance of 33467
- H4 time frame, 1st support at 32654
DAX:
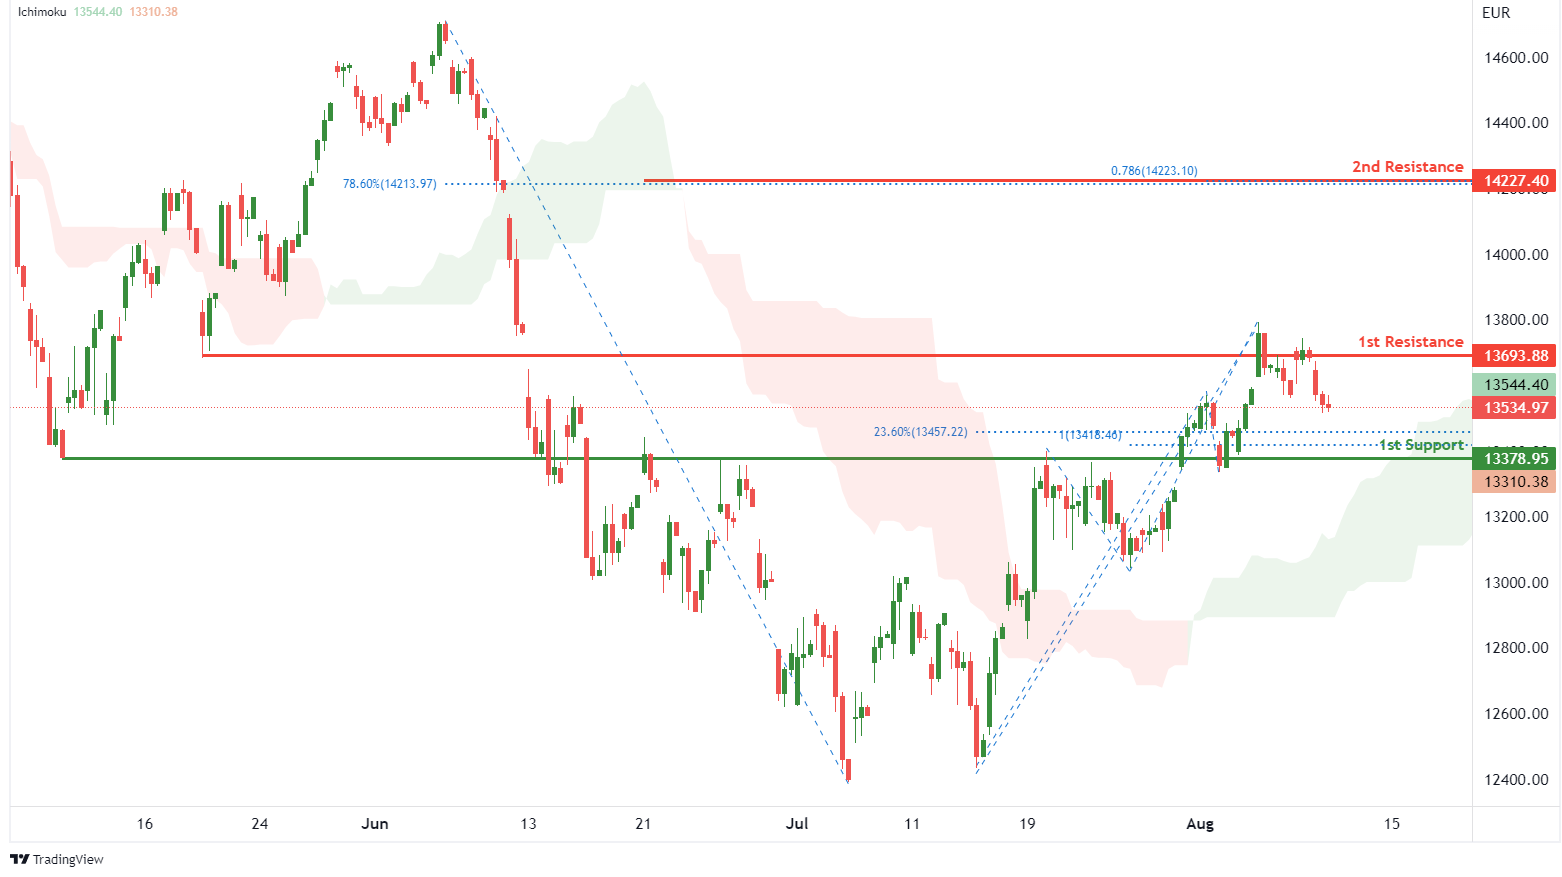
On the H4, with price moving above the ichimoku indicator, we have a bullish bias that price will rise to 1st resistance at 13693.88 where the pullback resistance is. Once there is upside confirmation of price breaking 1st resistance structure, we would expect bullish momentum to carry price to 2nd resistance at 14227.40 in line with 78.6% fibonacci projection and 78.6% fibonacci retracement. Alternatively, price could drop to 1st support at 13378.95 where the overlap support, 100% fibonacci projection and 23.6% fibonacci retracement are.
Areas of consideration:
- H4 time frame, 1st resistance of 13693.88
- H4 time frame, 1st support at 13378.95
ETHUSD:
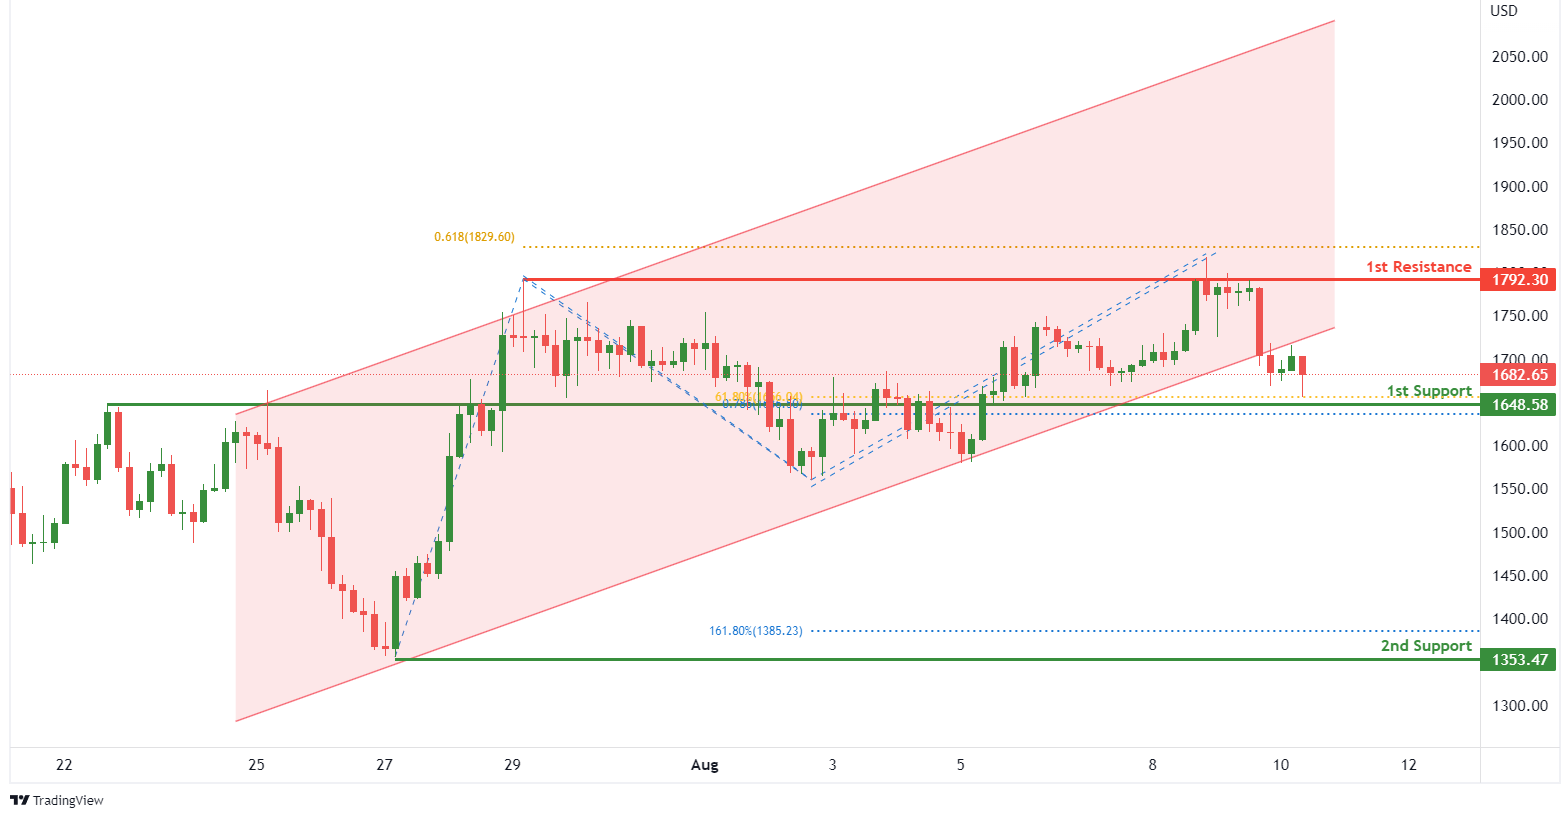
On the H4, with price breaking out of an ascending channel, we have a bearish bias that price will drop to 1st support at 1648.58 where the overlap support, 61.8% fibonacci retracement and 78.6% fibonacci projection are. Once there is downside confirmation that price has broken the 1st support structure, we would expect bearish momentum to carry price to 2nd support at 1353.47 where the swing low support and 161.8% fibonacci extension are. Alternatively,price could rise to 1st resistance at 1792.30 where the swing high resistance and 61.8% fibonacci projection are.
Areas of consideration:
- H4 time frame, 1st resistance of 1792.30
- H4 time frame, 1st support at 1648.58
BTCUSD:
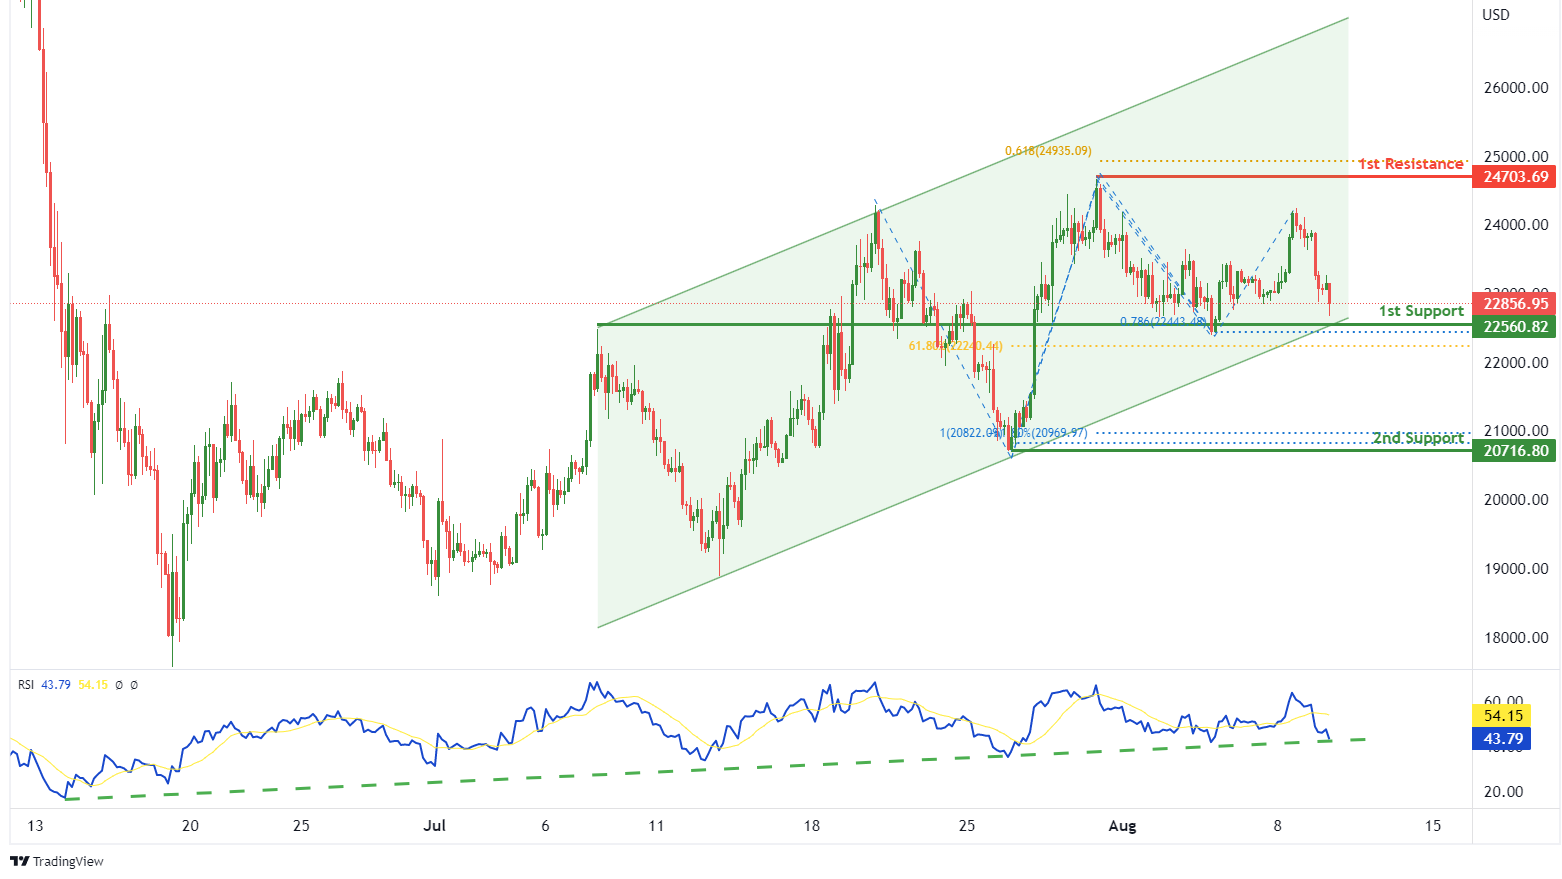
On the H4, with price moving within a bullish channel and RSI moving along an ascending trendline, we have a bullish bias that price will rise from our 1st support at 22560.82 where the pullback support, 61.8% fibonacci retracement and 78.6% fibonacci projection are to the 1st resistance at 24703.69 where the swing high resistance and 61.8% fibonacci projection are. Alternatively, price could break 1st support structure and drop to 2nd support at 20716.80 where the swing low support, -61.8% fibonacci expansion and 100% fibonacci projection are.
Areas of consideration:
- H4 time frame, 1st resistance of 24703.69
- H4 time frame, 1st support at 22560.82
S&P 500:
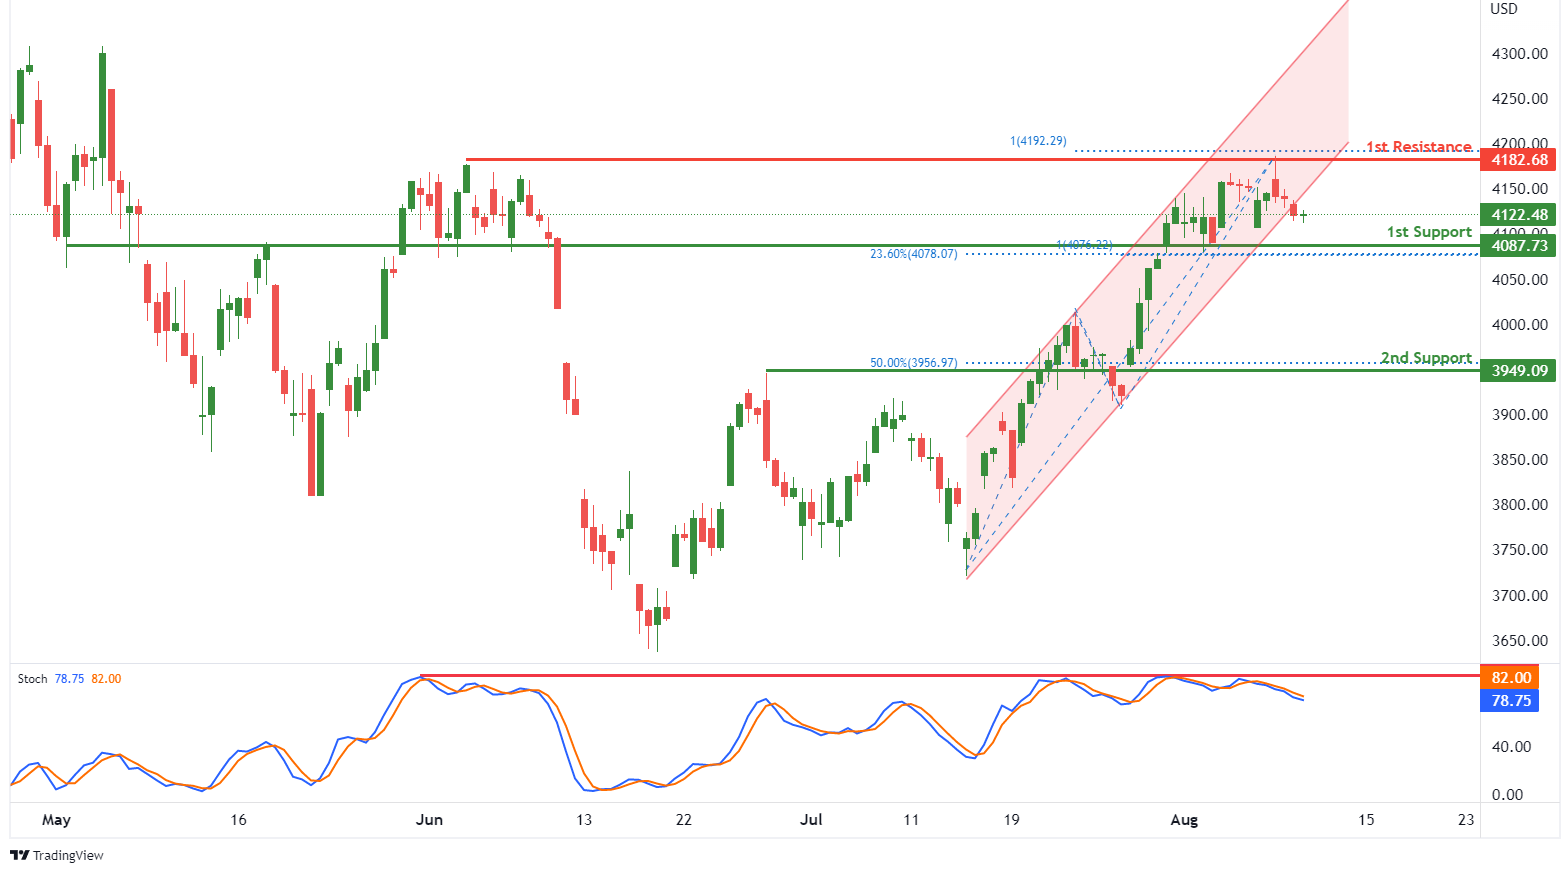
On the H4, with price breaking out of the ascending channel and reversing off the stochastic resistance, we have a bearish bias that price will drop to our 1st support at 4087.73 where the overlap support, 23.6% fibonacci retracement and 100% fibonacci projection are. Once there is downside confirmation that price has broken the 1st support structure, we would expect bearish momentum to carry price to 2nd support at 3949.09 where the pullback support and 50% fibonacci retracement is. Alternatively, price could rise to 1st resistance at 4182.68 where the swing high resistance and 100% fibonacci projection are.
Areas of consideration:
- H4 time frame, 1st resistance of 4182.68
- H4 time frame, 1st support at 4087.73
AUD/USD Indicators Signal More Upsides
Key Highlights
- AUD/USD climbed above 0.7000 before it corrected lower.
- A key breakout pattern is forming with resistance near 0.6980 on the 4-hours chart.
- EUR/USD is still facing a strong resistance near the 1.0280 level.
- The US Consumer Price Index could increase 8.7% in July 2022 (YoY).
AUD/USD Technical Analysis
The Aussie dollar started a steady increase above the 0.6900 level against the US Dollar. AUD/USD was able to clear the 0.6950 resistance to move into a positive zone.
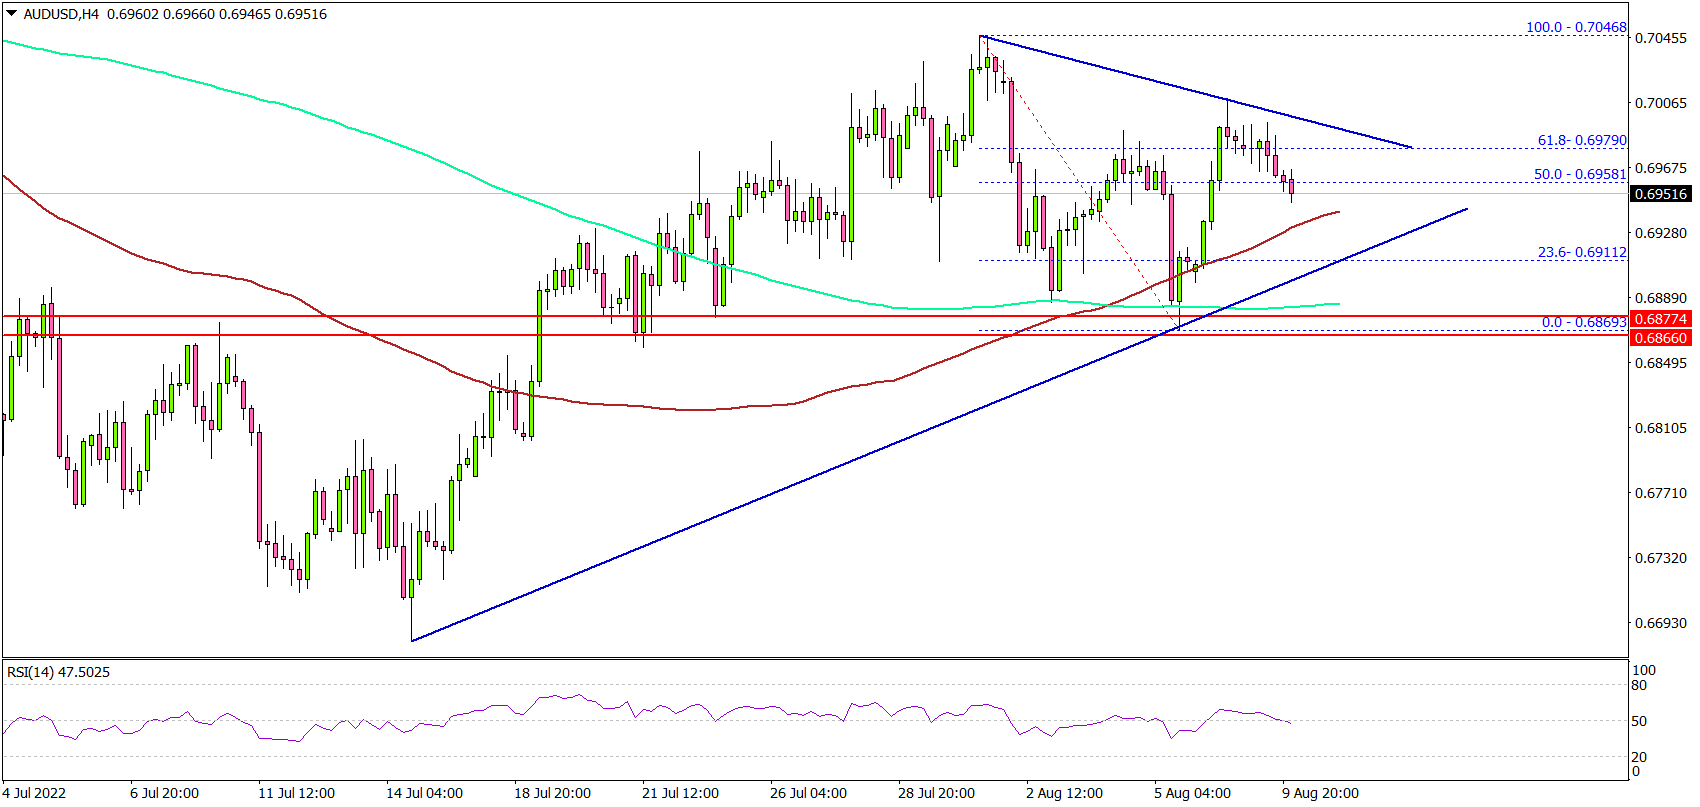
Looking at the 4-hours chart, the pair was able to close above the 0.6950 level, 100 simple moving average (red, 4-hours), and the 200 simple moving average (green, 4-hours).
There was a clear move above the 0.7000 resistance zone. The pair traded as high as 0.7046 before it started a downside correction. There was a sharp decline below the 0.6950 support but the bulls were active near the 0.6870 level.
The pair is now back above the 0.6940 and eyeing more upsides. On the upside, the pair is facing resistance near the 0.6970 level. There is also a key breakout pattern forming with resistance near 0.6980 on the same chart.
The next major resistance is near the 0.7000 level, above which the pair could accelerate higher. In the stated case, the pair could rise towards the 0.7050 resistance zone in the near term.
On the downside, the first major support is near the 0.6920 level. A downside break below the 0.6920 support might spark more losses. The next major support is near 0.6860. Any more losses might send the pair towards the 0.6800 zone.
Looking at EUR/USD, the pair is still trading in a range and faces a major hurdle near the 1.0280 zone, above which it could accelerate higher.
Economic Releases
- US Consumer Price Index for July 2022 (MoM) – Forecast +0.2%, versus +1.3% previous.
- US Consumer Price Index for July 2022 (YoY) – Forecast +8.7%, versus +9.1% previous.
- US Consumer Price Index Ex Food & Energy for July 2022 (YoY) – Forecast +6.1%, versus +5.9% previous.
Elliott Wave View: USDJPY Pullback Should Continue to Find Support
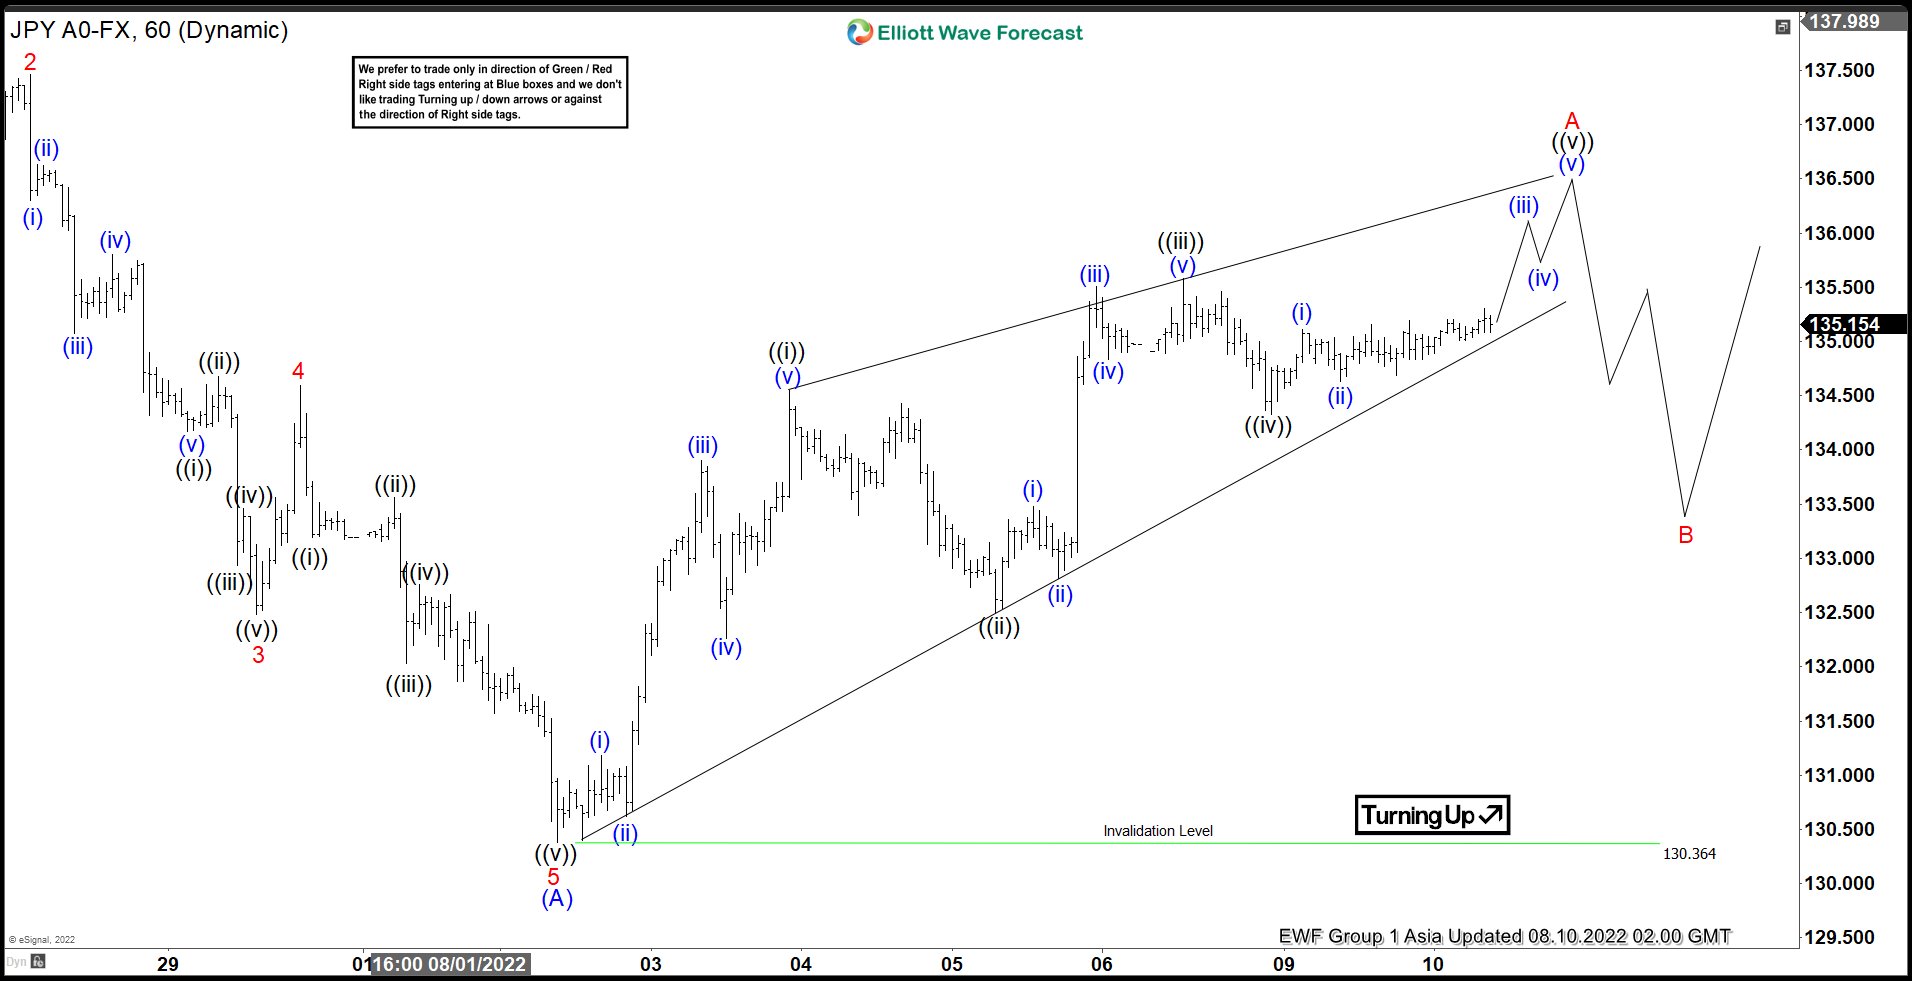
Short Term Elliott Wave View in USDJPY suggests decline from 7.11.2022 high is unfolding as a zigzag Elliott Wave structure. Down from 7.11.2022 high, wave 1 ended at 135.54 and rally in wave 2 ended at 137.46. Pair then extended lower in wave 3 towards 132.48, and rally in wave 4 ended at 134.59. Final leg lower in wave 5 ended at 130.364 which completed wave (A) in higher degree.
Wave B rally is currently in progress with internal subdivision as another zigzag in lesser degree. First leg wave (A) unfolded as a 5 waves diagonal. Up from wave (A), wave ((i)) ended at 134.55, and pullback in wave ((ii)) ended at 132.5. Pair then extended higher again in wave ((iii)) towards 135.58, and dips in wave ((iv)) ended at 134.33. Expect pair to extend 1 more leg before ending wave ((v)) and this should complete wave A in higher degree. Pair should then pullback in wave B to correct cycle from 8.2.2022 low before the next leg higher in wave C. Near term, as far as pivot at 130.364 low stays intact, expect dips to find support in 3, 7, 11 swing for further upside.
USDJPY 60 Minutes Elliott Wave Chart
Eco Data 8/10/22
[php_everywhere instance="1"]
Risk Assets or USD?
What will happen?
This week several important macroeconomic reports will be presented. On Wednesday, the Bureau of Labor Statistics will publish the consumer price index (CPI), which accounts for most of the overall inflation. Moreover, on Thursday, the markets will get the numbers for the US producer price index (PPI), a leading indicator of consumer inflation.
Why these two reports are might be more important this week than usual? Let's discuss.
Expectations
Last month, US consumers finally found some relief at gas pumps as fuel prices fell. Therefore, analysts expect that inflation growth will slow down in July. According to their forecasts, the consumer price index will increase by 0.2% in July from a month earlier, which would be the smallest advance since the start of 2021. However, the so-called core measure, which excludes energy and food, might climb by 0.5%.
Despite a predicted inflation growth slowdown, inflation pressure remains intense. Moreover, the July payroll report added fuel to the fire. Firstly, it included a larger-than-forecast pickup in hourly earnings, i.e. the evidence that inflation keeps rising. Second, the unemployment rate declined and nonfarm payrolls (NFP) came at 528K which means that the US economy gained more jobs than expected in July and that recession fears could be exaggerated. These two things may lead the Federal Reserve policymakers to significantly increase the key rate at the September meeting.
How to trade on the invent?
Higher-than-expected CPI and PPI numbers might significantly boost the US dollar, sending risk assets down due to investors' fear about one more 75-basis-point rate hike, which might occur as the Federal Reserve still has room thanks to the strong labor market.
On the other hand, if the actual result meets or underperforms the expectations, it would mean that the Federal Reserve finally succeeded in the battle against inflation, and the era of cheap money is not far away. In this case, investors will rush to the stock and crypto markets. NASDAQ (US100) will win the most among all stock indices.
What to watch?
US100, daily chart
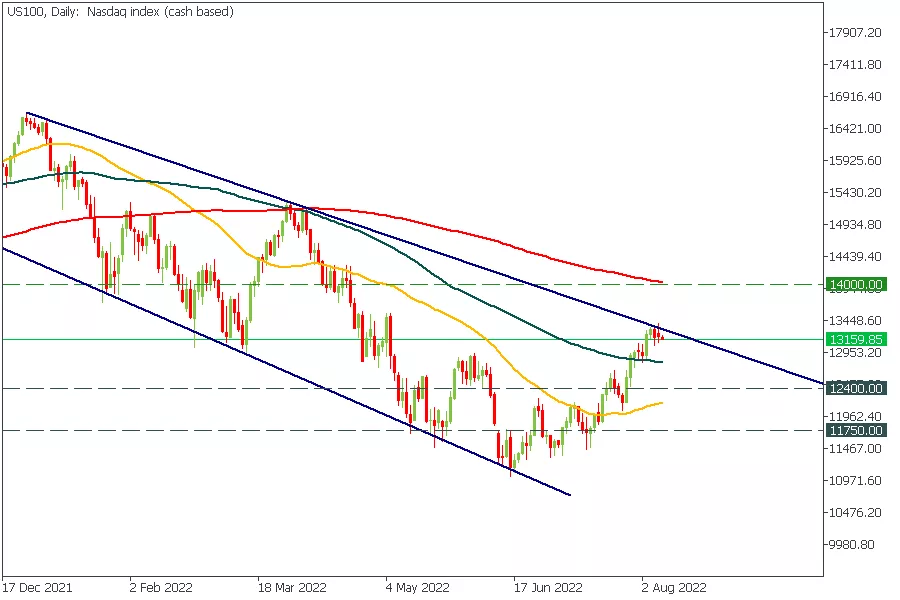
US100 is trading under the descending trend line on the daily timeframe. The breakout of this trendline might open the way even to 2021 high. However, before that, the price should exceed the 200-day moving average.
On the other hand, higher-than-expected CPI numbers will send the index down to 12 400 and possibly even to 11 750.
XAUUSD, daily
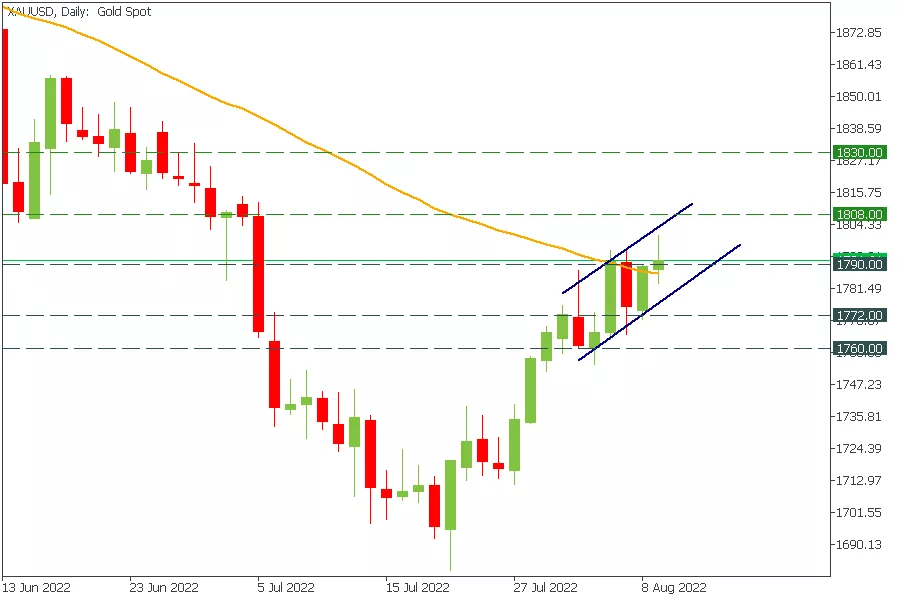
Gold is another asset to fly if the actual data meets or underperforms expectations.
The price broke through the descending trendline on the daily timeframe, and buyers already closed two daily candles above the 50-day moving average. In the case of a bull run, the targets are 1808 and 1830.
On the other hand, higher than expected numbers will send gold to the breakout retest at 1772 and 1760.
USDCAD, daily
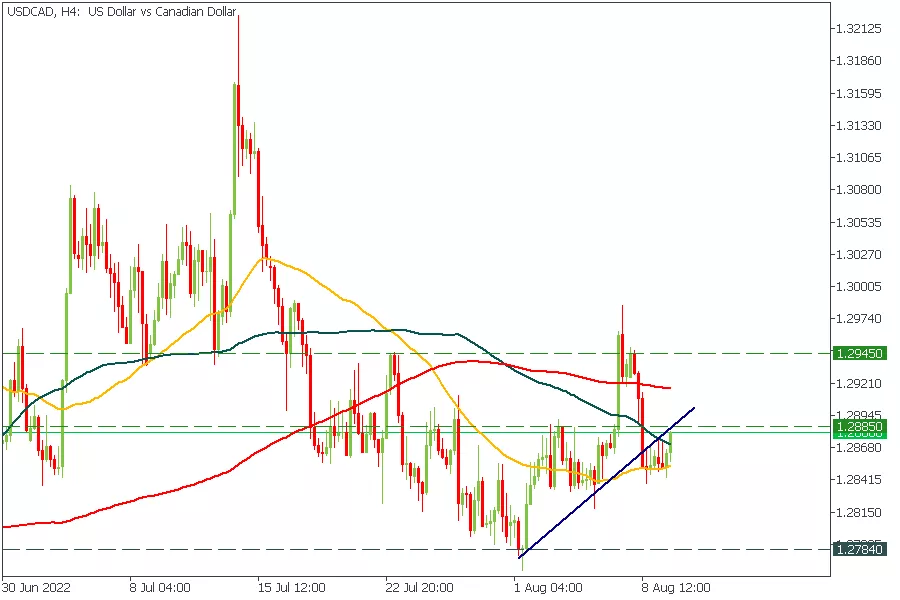
USDCAD is the currency pair with the most precise setup ahead of the volatile week.
The pair has broken through the ascending trendline, signaling an upcoming bearish trend.
Lower-than-expected CPI data might press the pair to 1.2784, while better-than-expected results will push the price to 1.2885 and even 1.2945 if the price breaks the trendline backward.
Sterling Rides Wave of Risk Sentiment Ahead of GDP Report
In the United Kingdom, preliminary GDP growth data for the second quarter will hit the markets at 06:00 GMT Friday. The British pound has suffered heavy damage this year, falling behind even the war-ravaged euro despite a series of rate increases from the Bank of England. This dataset is unlikely to change this dynamic. Instead, the pound is at the mercy of global risk sentiment, which seems unstable.
Metamorphosis
It has been a tough year for sterling. While the spotlight has been on the euro getting smoked by the energy crisis, the pound has performed just as badly, even though the Bank of England has raised interest rates at every single meeting since late last year.
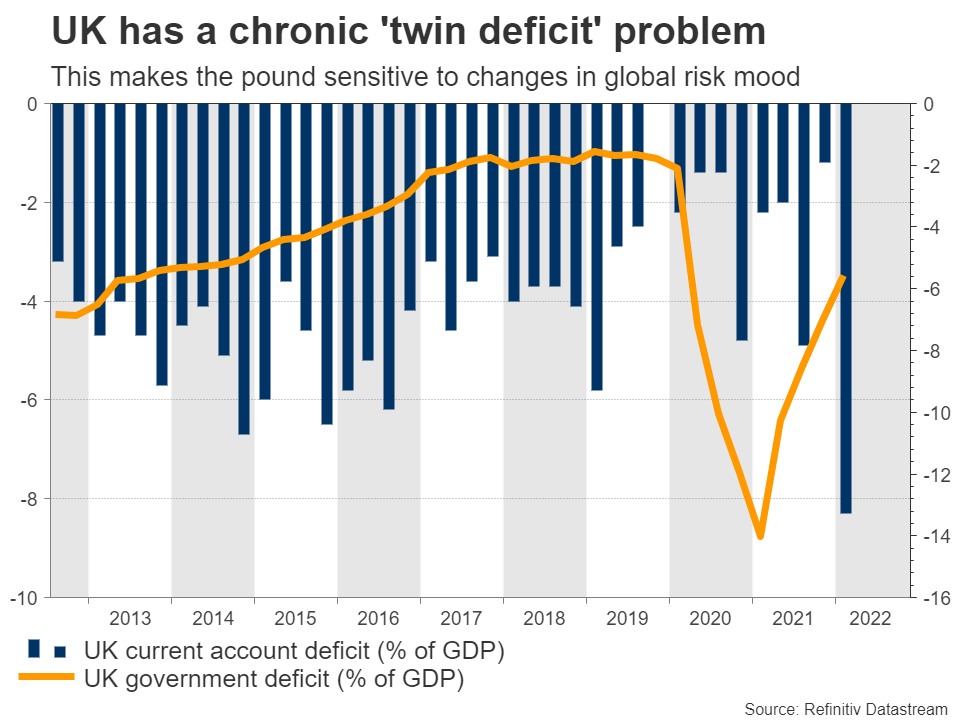
This softness seems to boil down to two elements. First, the UK is not immune to the global energy shock. It might not import most of its energy from Russia directly, but it is still a net importer and since energy markets are so interconnected, it ends up paying higher prices regardless. As such, the trade deficit has blown up this year.
Currencies don’t like trade deficits. It means a nation imports more than it exports, which over time tends to devalue a currency. The one thing that’s even worse is having a huge government deficit at the same time. This is the famous ‘twin deficit’ problem. When an economy like the UK runs twin deficits for a long time, it essentially depends on foreigners to fund those deficits, making it sensitive to any shifts in the global mood.
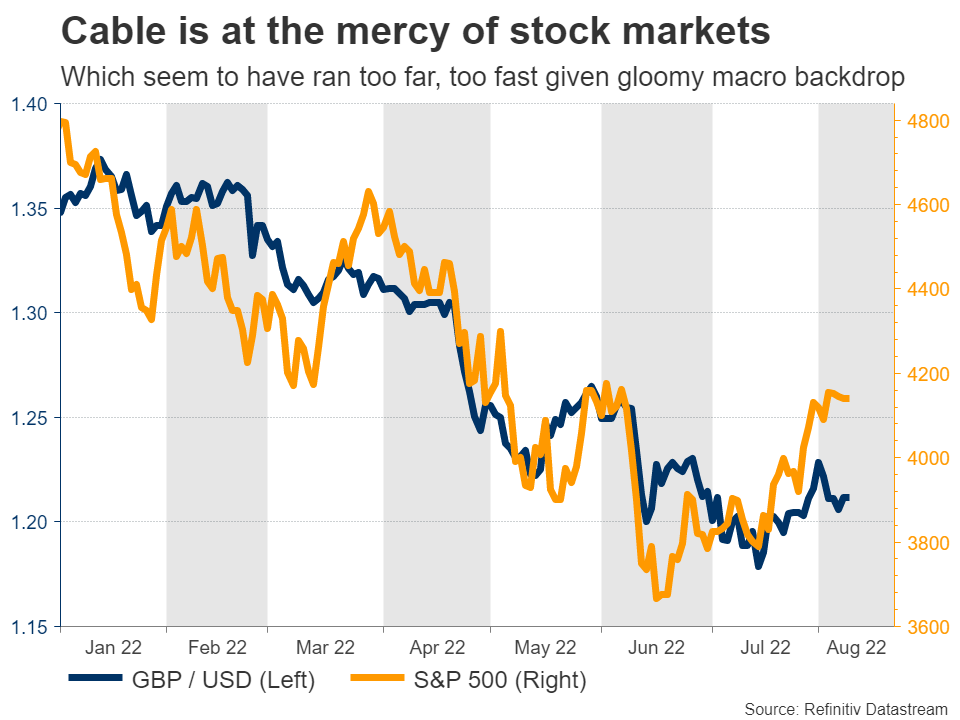
Which brings us to the second obstacle for the pound - its sensitivity to global risk appetite. Cable has become very vulnerable to any swings in stock markets, having a stunningly strong correlation with Wall Street this year, which in turn has gone downhill. Amplifying this effect has been the US dollar’s transformation into a safe-haven asset.
GDP report
Turning to the upcoming growth data, the British economy is forecast to have contracted by some 0.2% in the second quarter as the cost of living crisis took its toll. Of course, this won’t be a shock for the Bank of England, which already penciled in a negative print in its forecasts.
In fact, the BoE went a few steps further. It projected five quarters of economic contraction starting in the final quarter of this year, implicitly predicting a year-long recession. But it still raised interest rates by a half percentage point, arguing that inflation is simply far too high.
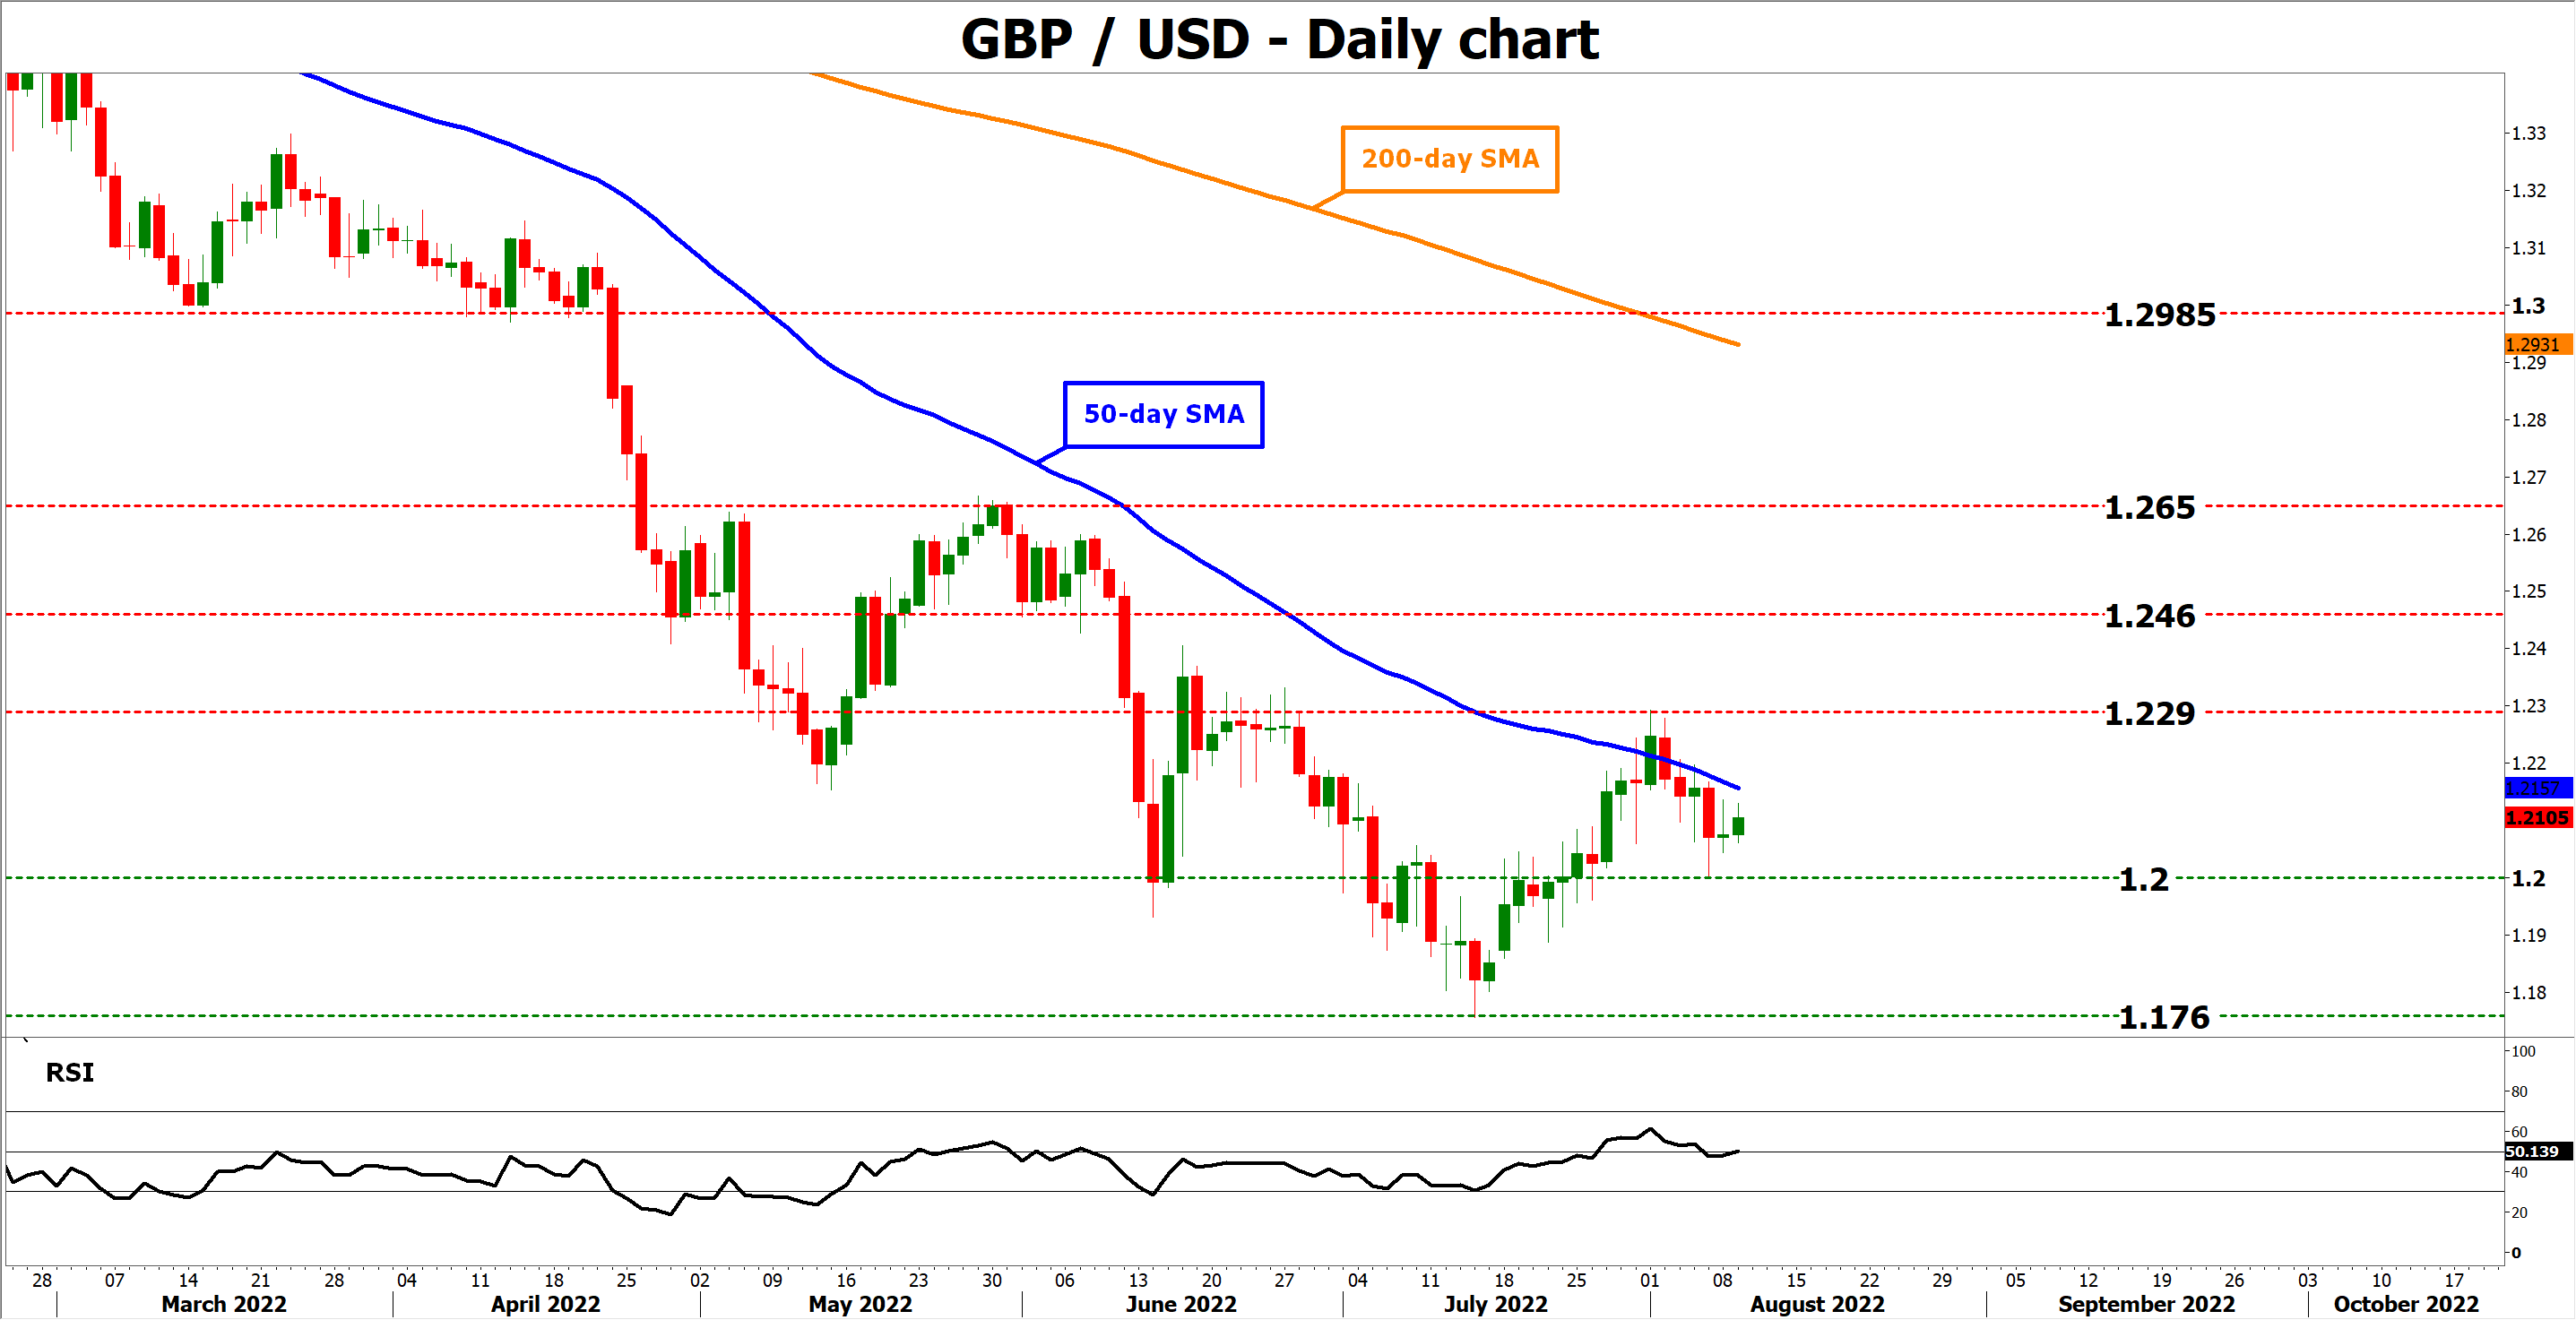
In case the GDP print manages to overcome forecasts, Cable could edge higher, with the first major barrier to the upside being the 1.2290 zone.
On the flipside, if the numbers are even worse than expected, the pair could instead inch lower for another test of the 1.2000 region.
Big picture
Admittedly, this dataset won’t change much. Market participants already have a good idea of what the BoE will do over the next few months - raise rates in a slow, methodical manner. What is less certain is how risk appetite will evolve.
In this sense, the risks seem tilted to the downside for Cable. Stock markets have recovered substantially over the past seven weeks, but for dubious reasons. First and foremost, the bond market started to panic about a recession, which in turn dragged yields down and eased the pressure on equity valuations.
The earnings season hasn’t been great either. Adjusted for inflation, real earnings growth for the S&P 500 has turned negative for the year. Even corporate profits can’t keep up with inflation.
And with stock markets rallying while yields drop, financial conditions have loosened again, putting more pressure on the Fed to roll out another shock-and-awe rate increase. Meanwhile, most forward-looking indicators suggest that avoiding a recession would be a miracle.
It’s difficult to be optimistic about a sustained recovery in Cable in this unstable regime.
Australian Consumer Sentiment Near Pandemic Lows
Australia’s Westpac Consumer Confidence Index lost 3% in August, developing a nine-month slump that took off 22.9%.
The index was near current levels twice in 2020 during the worst periods of lockdowns and uncertainty and even earlier in 2008 during the worst financial crisis. But current levels are well above the recessionary periods of the late 1980s and early 1990s.
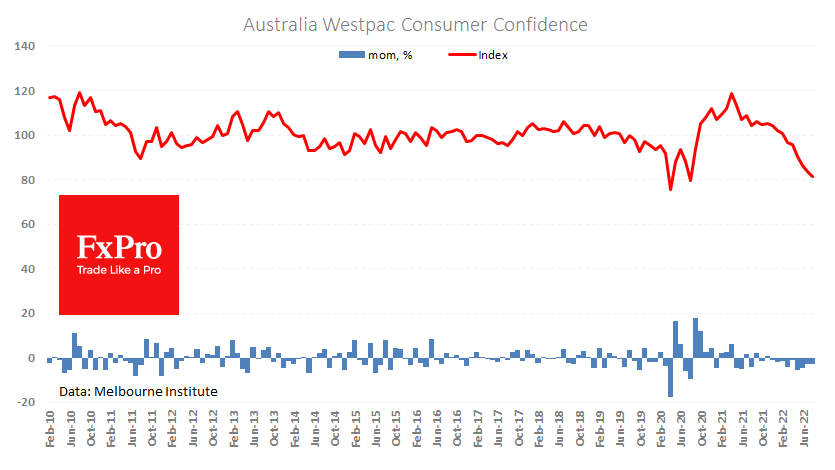
However, this does not promise a bleak future for the economy as it will shift the government’s and RBA’s focus from fighting inflation to supporting demand.
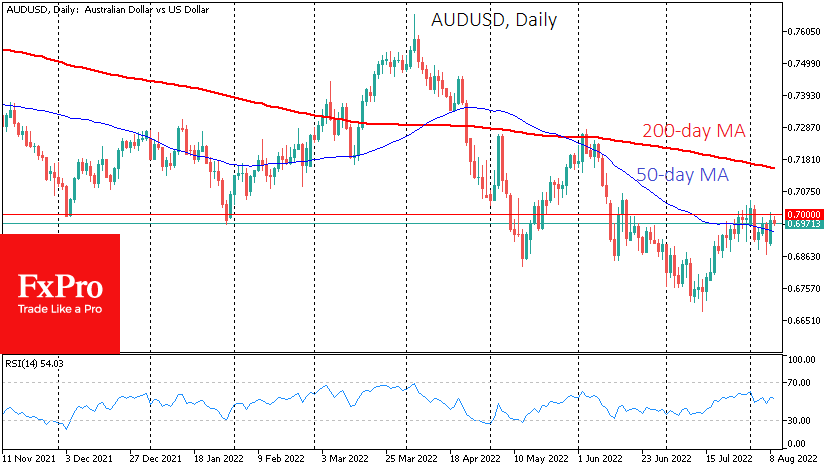
On forex, the AUDUSD has been languishing around its 50-day moving average for the last two and a half weeks. At the beginning of August, it hit a glass ceiling at 0.7000, separating the crisis from the norm for the Australian economy for years.
The inability of the bulls to push the pair higher may be seen as a structural weakness of the buyers, passed on the sight of the sharp decline in the prices of metals, an important export commodity. In this case, the AUDUSD may fall without significant headwinds to 0.6700, the low of July. If there is insufficient demand, the road to the abyss opens, and the pair will move into a channel at 0.50–0.60 for the following year.
Euro Extends Gains
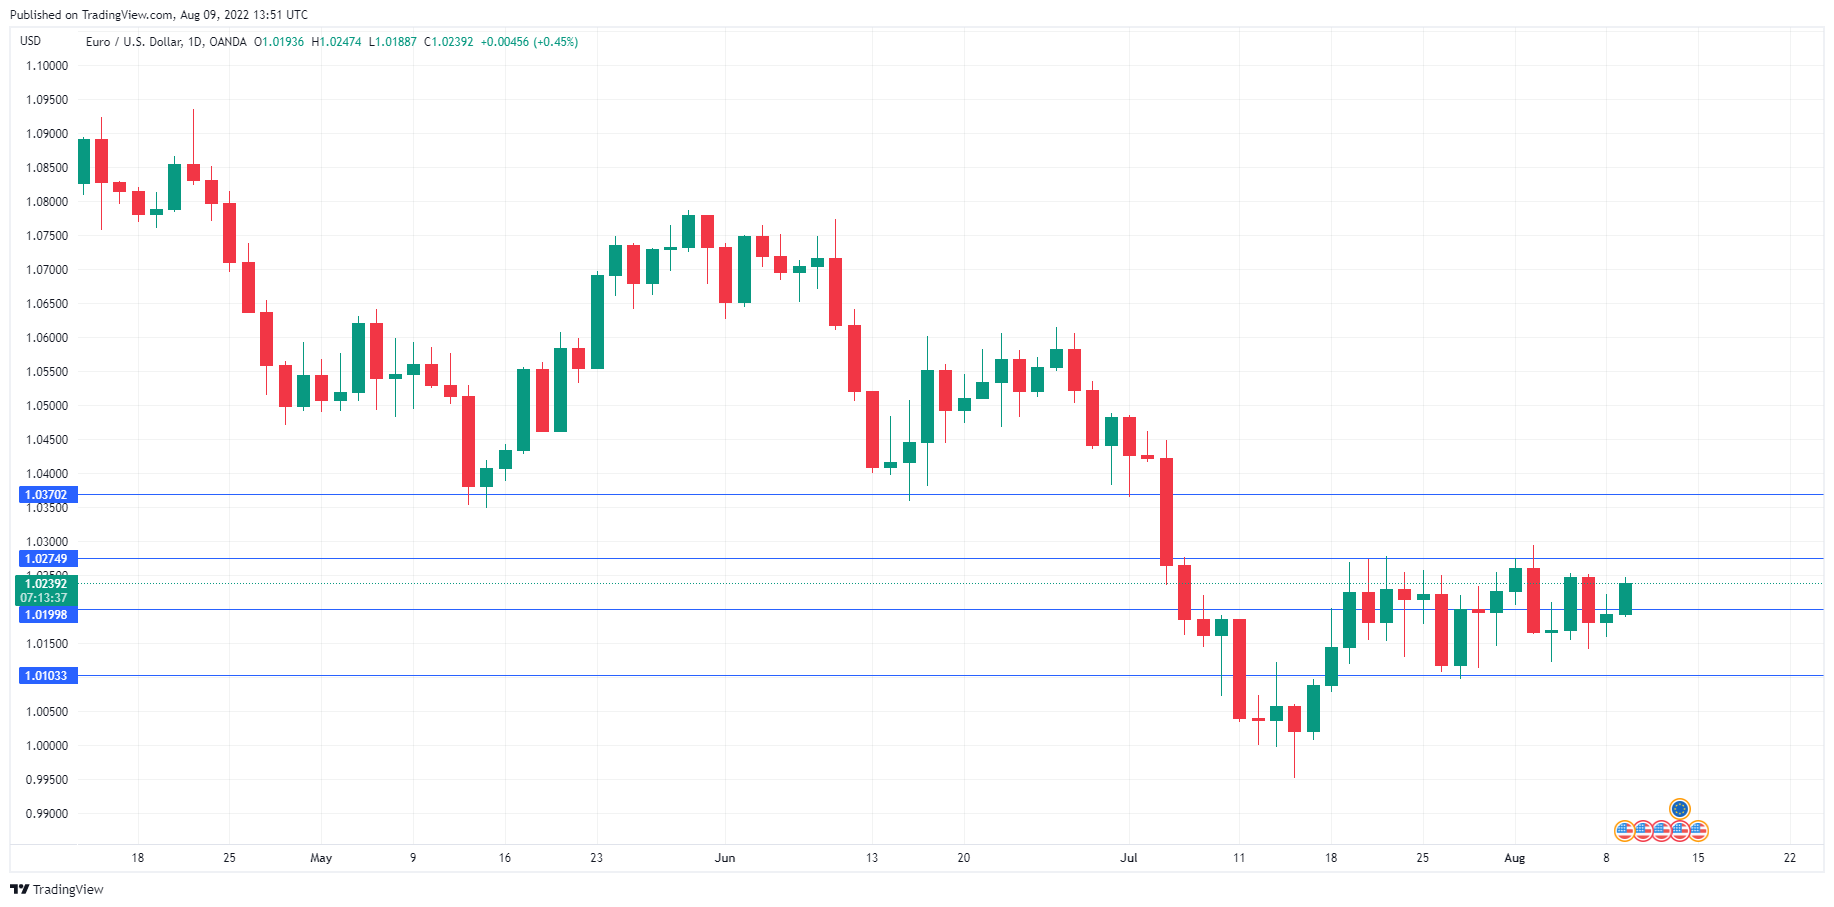
The euro continues to move higher early in the week. In the North American session, EUR/USD is trading at 1.0240, up 0.47% on the day.
The US dollar, which has been on a downward correction recently, flexed some muscles on Friday, after a superb nonfarm payrolls report, and posted broad gains. However, the gains proved to be short-lived, and the euro has now recovered all of Friday’s losses.
Fed officials were already pushing back against the market’s perception that the rate-hike cycle was almost over, and with the latest employment numbers, the Fed may feel the need to remain aggressive and respond with another supersize 0.75% increase at the next policy meeting in September. Fed Chair Powell has said that the Fed will be data-dependent as it considers its next move, which means that upcoming inflation and employment reports will be crucial and carefully monitored by the markets and Fed officials.
Germany, US releasing inflation data
In Europe, it’s a light economic calendar this week. Final German CPI is expected to come in at 7.5% YoY, which is another distress signal of “Brussels, we have a problem”. Inflation shows no signs of easing, and the ECB is playing catchup, having finally raised rates last month. A benchmark rate of 0.50% won’t do much to slay soaring inflation, although the perception that the central bank is raising rates is certainly helpful. Eurozone inflation hit 8.9% in June, up from 8.1%, and the ECB is hoping that the numbers don’t get even worse when the July inflation report is released next week.
The US will release the July inflation report on Wednesday. Headline CPI is expected to fall to 8.7%, down from 9.1%, while core CPI is forecast to rise to 6.1%, up from 5.9%. If the headline reading is higher than expected, it will put pressure on the Fed to remain in hawkish mode and the dollar should respond with gains. Conversely, a soft reading from the headline or core releases would ease the pressure on the Fed and could send the dollar lower.
EUR/USD Technical
- EUR/USD faces resistance at 1.0274 and 1.0370
- There is support at 1.0199 and 1.0103
Gold Outlook: Steady Yet Bullish Tendencies Could Occur
Gold’s price was on the rise since our last report yet seems to remain rather lazy given the relative inactivity of the greenback in the past few days.
The negative correlation of the two trading instruments came once again on display on Friday as the precious metal’s price dropped in response to USD’s strengthening. The driving force behind the movement was the release of the US employment report for July, which showed some solid rates and figures for the US employment market in the past month.
It was characteristic that the NFP figure did not drop as expected, instead jumped to twice the number of jobs the market anticipated to be released, reaching 528k. Also the unemployment rate ticked down implying that the US employment market remains tight and the average earnings growth rate remained unchanged instead of slowing down on a year on year level, as was expected, implying that wages are to continue to feed inflationary pressures in the US economy.
On a monetary level, the release intensified market expectations for the Fed to continue to hike rates at a fast pace. Furthermore we would note that Fed Governor Bowman stated, that additional 75 basis points rate hikes should be considered from the Fed in order to bring inflation down to 2%.
Overall and given that the Fed’s intentions to drain the market from excess liquidity remain unchanged, even with the risk of the US economy entering a recession, we may see the market sentiment remaining risk averse, which could initially support the USD and thus weaken the shiny metal, given also that similar intentions were expressed from a wider number of central banks regarding the tightening of their respective monetary policies.
The next big test is expected to be the release of the US CPI rates for July tomorrow the 10th of August. The headline rates are expected to slow down both on a month on month level as well as on a year on year level and reach 0.2% mom and 8.7% yoy respectively. Should the actual rates slowdown as expected, it could signal a big win for the Fed and its efforts to curb inflationary pressures.
Thus the pressure on the Fed to continue to hike rates at a fast pace could ease, as the slowdown may imply that inflation has peaked and may have started to roll back down to the bank’s target of 2% yoy. On a market reaction level the release, if the forecasts are realised, could weaken the USD and at the same time strengthen gold’s price, given the two instrument’s negative correlation.
On the other hand the precious metal could find itself in a rather peculiar position as it is also used as a hedging instrument for inflation, while increased volatility may be present for the bullion at the same time, especially should the actual rates differ from the market expectations.
On a fundamental level, we would like to note the tensions in the US–Sino relationships and especially China’s intentions over Taiwan. It’s characteristic that Taiwan’s foreign minister Wu warned earlier today in a press conference that “China has used the drills … to prepare for the invasion of Taiwan” according to Reuters and urged “international support to safeguard peace and stability across the Taiwan Strait”.
It should be noted that the Taiwan straits are of the busiest shipping routes worldwide and tensions could halt trading activities. We highlight the possible adverse effects for the global economic outlook of a possible military operation of China in Taiwan but also the possibility of additional sanctions being deployed against China from the US.
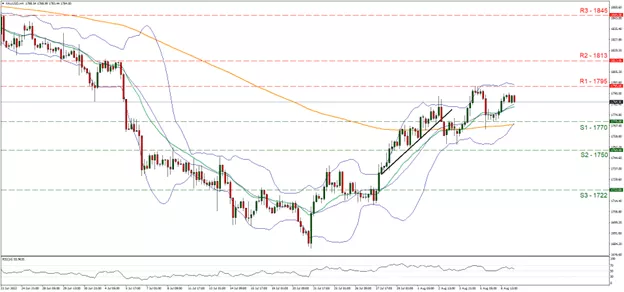
Technical Analysis
XAUUSD H4 Chart
Support: 1770 (S1), 1750 (S2), 1722 (S3)
Resistance: 1795 (R1), 1813 (R2), 1845 (R3)
Gold’s price rose since our last report yet seems to have hit a ceiling at the 1795 (R1) resistance line and calmed down by correcting and stabilizing a bit lower.
We tend to maintain a bias for a sideways motion of the precious metal’s price between the 1770 (S1) support line and the 1795 (R1) resistance line currently. It should be noted though, that the RSI indicator below our 4-hour chart is above the reading of 50, thus some bullish tendencies should not take us by surprise, given also the consecutive higher troughs and peaks that characterize the precious metal’s price action since the 21st of July.
Also indicative of the bullish tendencies is the crossover of the more sensitive 20 moving average over the 200 period moving average. On the other hand, the upper and lower Bollinger bands seem to be converging, implying some lower volatility for the precious metal’s price.
Please note though that fundamentals and the release of the US CPI rates for July could alter gold’s direction either way, depending on the outcome. Should the bulls take over, we may see Gold’s price breaking the 1795 (R1) resistance line that capped its ascent higher on the 4th of August and aim for the 1813 (R2) level that kept the bulls at bay, on the 4th of July. Even higher, we note the 1845 (R3) resistance barrier that has not seen any price action since the 23rd of June.
Should the bears take over, we would expect gold’s price to initially break the 1770 (S1) support line that held its ground against the downward pressure exercised by the bullion’s price on the 5th and 8th of August and take aim for the 1750 (S2) support level. Should the S2 be broken we note as the next possible target for the bears the 1722 (S3) support hurdle.