

Sample Category Title
EURUSD Wave Analysis
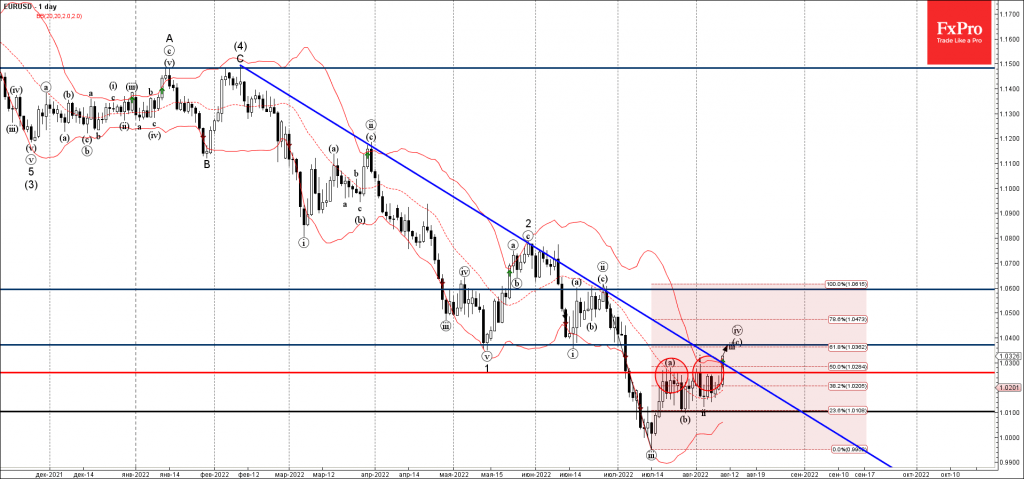
- EURUSD broke key resistance level 1.0260
- Likely to rise to resistance level 1.0370
EURUSD just broke the pivotal resistance level 1.0260 (which has been repeatedly reversing the pair from the middle of July).
The breakout of the resistance level 1.0260 coincided with the breakout of the multi-month resistance trendline from February and the 50% Fibonacci correction of the downward impulse from June.
EURUSD can be expected to rise further toward the next resistance level 1.0370 (former monthly low from May and June, target for the completion of the active wave (iv)).
USD/CAD Mid-Day Outlook
Daily Pivots: (S1) 1.2853; (P) 1.2876; (R1) 1.2909; More...
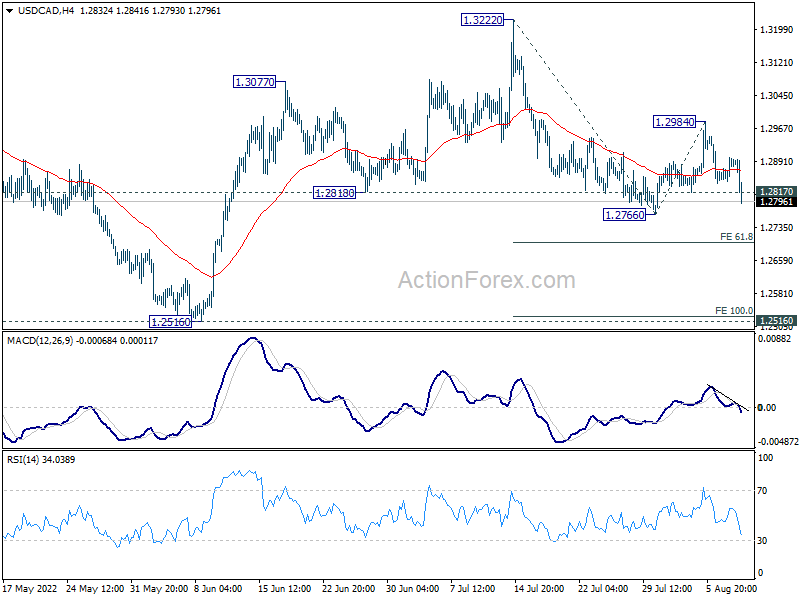
USD/CAD's break of 1.2817 minor support suggests that fall from 1.3222 is resuming. Intraday bias is back on the downside for 61.8% projection of 1.3222 to 1.2766 from 1.2984 at 1.2702. Firm break there will target 100% projection at 1.2528, which is close to 1.2516 key support. For now, further decline will remain in favor as long as 1.2984 resistance holds, in case of recovery.
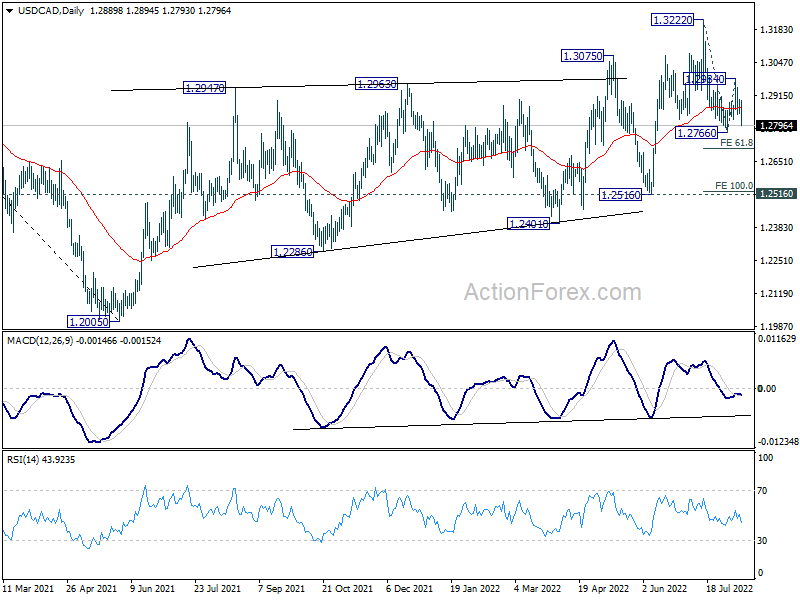
In the bigger picture, down trend from 1.4667 (2020 high) should have completed at 1.2005, after defending 1.2061 long term cluster support. Rise from there should target 61.8% retracement of 1.4667 to 1.2005 (2021 low) at 1.3650. This will remain the favored case now as long as 1.2516 support holds.
GBP/USD Soars as US Inflation Falls
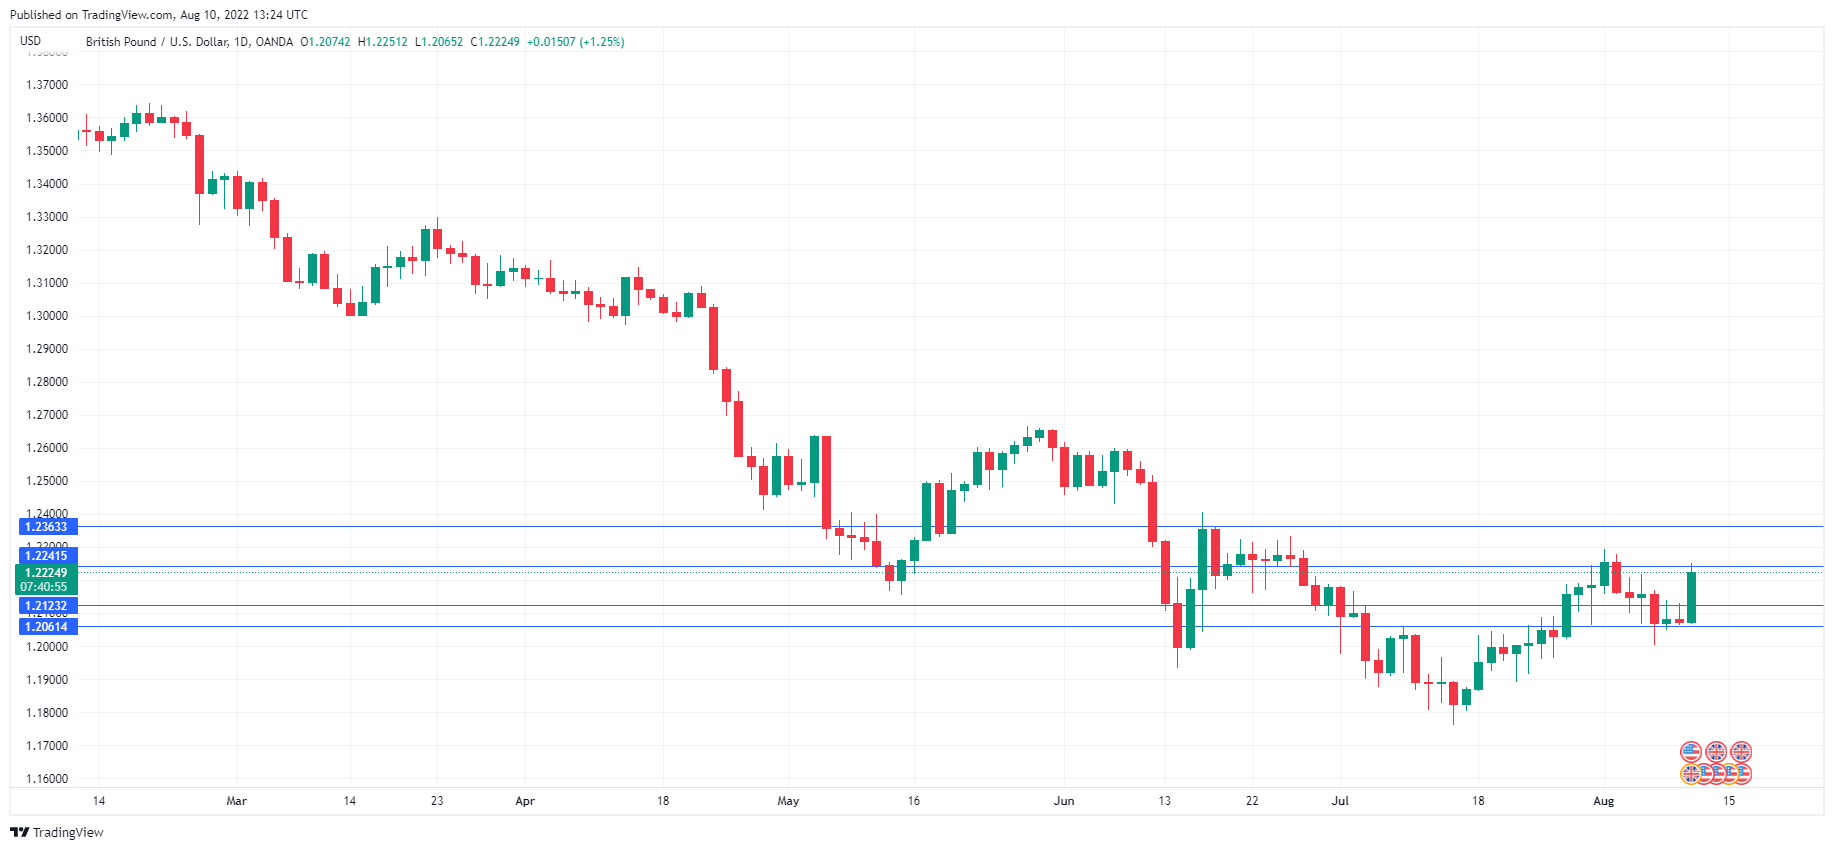
The British pound has surged in today’s North American session. GBP/USD has jumped a massive 1.20% on the day and is trading at 1.2218.
US inflation underperforms
The economic calendar is very light on both sides of the pond today, but that didn’t matter as today’s US inflation report has sent the US dollar on a nasty slide. The July data saw both the headline and core readings come in lower than expected. Core CPI remained steady at 5.9%, lower than the forecast of 6.1%. However, the real news was the headline reading, which dropped to 8.5%, down from 9.1% in June and below the estimate of 8.7%.
It is of course too early to talk about a peak in inflation based on one reading, although readers may see some headlines trumpeting just that. Still, the markets have responded with vigour, sending the US dollar sharply lower on the assumption that the Fed can ease its rate hiking, possibly to a 50 basis point hike in September. It wasn’t long ago that a 50bp rise was labeled “supersize”, but times have changed and with central banks raising rates by 75 and even 100bp, a 50bp move is almost modest.
The Fed is breathing easier today and is hoping that inflation is on its way down, after relentlessly accelerating. This is also good news for President Biden, as voters have been hit hard by the cost of living crisis and may well take out their anger on the Democrats in the mid-term elections. I’m assuming Biden will not credit his brand new Inflation Reduction Act as the reason that inflation has fallen, but there’s no doubt that the drop in inflation is great news for the White House.
The pound certainly got a fortuitous break as US inflation fell and has taken advantage by rising sharply. It could be a very different outcome on Friday, as the markets are braced for a downturn in the UK economy. GDP is expected to slow to 2.8% YoY, down from 8.7% in Q1. On a quarterly basis, GDP is projected at -0.2%, following a 0.8% gain in Q1. If GDP is weaker than expected, a fall in the pound is a strong possibility.
GBP/USD Technical
- GBP/USD is testing resistance at 1.2241. Next, there is resistance at 1.2361
- There is support at 1.2123 and 1.2061
US: Inflation Pressures Ease in July, But Remain at 40-Year High
Consumer price inflation was flat in July after having increased by 1.3% month-over-month (m/m) in June. On a year-over-year basis, inflation decelerated 0.6 percentage points (pp) from June, rising by 8.5%.
After making sizeable contributions in each of the last two months, energy prices fell by 4.6% m/m, as both gasoline (-7.7% m/m) and energy services (-11% m/m) were lower on the month. Food prices accelerated by 1.1% m/m and are now up 10.9% y/y.
Core inflation (excludes volatile items such as food and energy) rose 0.3% m/m – four-tenths slower than in June. On a year-over-year basis, core inflation is up 5.9% y/y, unchanged from the month prior.
Price growth across services (0.4% m/m) remained relatively broad-based, but did decelerate from June's gain of 0.7% m/m. Shelter costs were again a meaningful contributor, rising 0.5% m/m. Medical care services (0.4% m/m) were also higher on the month, while transportation (-0.5% m/m) fell – largely the result of a sharp pullback in airfare (-7.8% m/m) prices.
Core goods prices – includes all goods except food & energy – were up 0.2% m/m, a sharp declaration from June's gain of 0.8% m/m. Gains were seen in new vehicle prices (0.6% m/m), household furnishings (0.6% m/m) and recreation goods (0.2% m/m), while used vehicle prices (-0.4% m/m) and apparel (-0.1% m/m) were lower on the month.
Key Implications
Overall, slightly better than expected. Forecasts were calling for some moderation in the headline measure given the recent pullback in energy prices, but the sharper deceleration in core inflation came as pleasant surprise. However, we have been head-faked before by what appeared to be a cooling in the core measure, only to see things U-turn higher in subsequent months.
We've received a smattering of various wage metrics over the last few weeks, and all are showing wage growth having considerable staying power north of 5% (annualized). This is roughly two percentage points above what is consistent with the Fed's 2% inflation objective, highlighting the uphill battle the FOMC faces. Even if core inflation shows a definitive sign of rolling over in the coming months, it won't be until the supply-demand mismatch in the labor market eases allowing wage growth to decelerate that we'll see inflation move meaningfully lower.
With the FOMC dropping its forward guidance and moving to a data dependent "meeting-by-meeting" assessment, today's inflation data alongside July's strong employment report will give policymakers little reason to materially dial back on the pace of rate hikes when it next meets on September 20th-21st. While we still see a 50bps move as the most probable outcome, another 75bps hike can't be completely ruled out, particularly if we see further surprises on either the employment or inflation readings for August.
AUD/USD Mid-Day Report
Daily Pivots: (S1) 0.6946; (P) 0.6970; (R1) 0.6987; More...
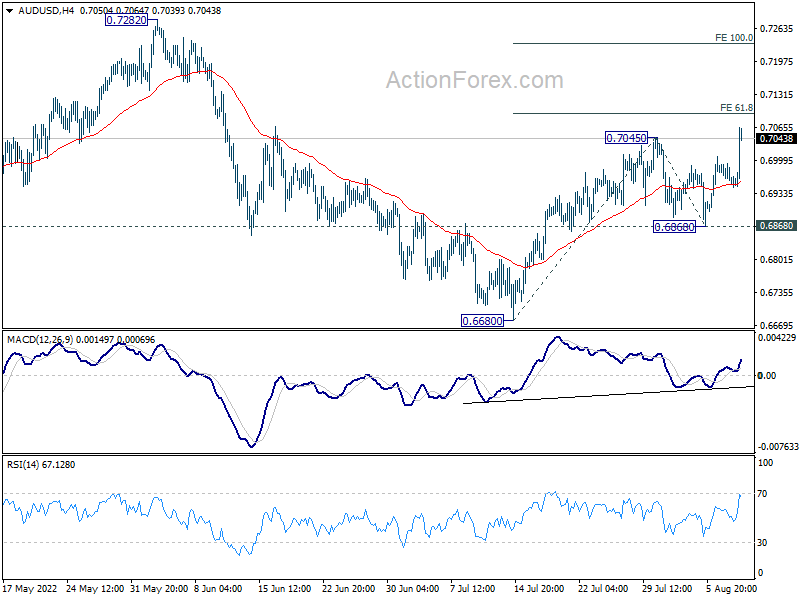
AUD/USD's rally from 0.6680 resumes by breaking through 0.7045 and intraday bias is back on the upside. Further rally should be seen to 61.8% projection of 0.6680 to 0.7045 from 0.6868 at 0.7094, and then 100% projection at 0.7233. For now, further rally will remain in favor as long as 0.6868 support holds, in case of retreat.
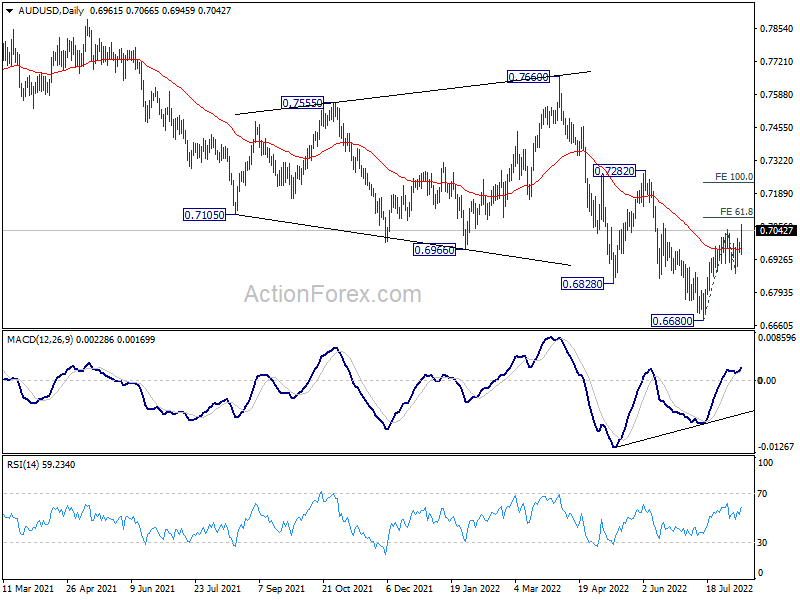
In the bigger picture, price actions from 0.8006 (2021 high) is seen more as a corrective pattern to rise from 0.5506 (2020 low). Or it could be a bearish impulsive move. In either case, outlook will remain bearish as long as 0.7282 resistance holds. Next target is 61.8% retracement of 0.5506 to 0.8006 at 0.6461.
USD/JPY Mid-Day Outlook
Daily Pivots: (S1) 134.81; (P) 135.00; (R1) 135.34; More...
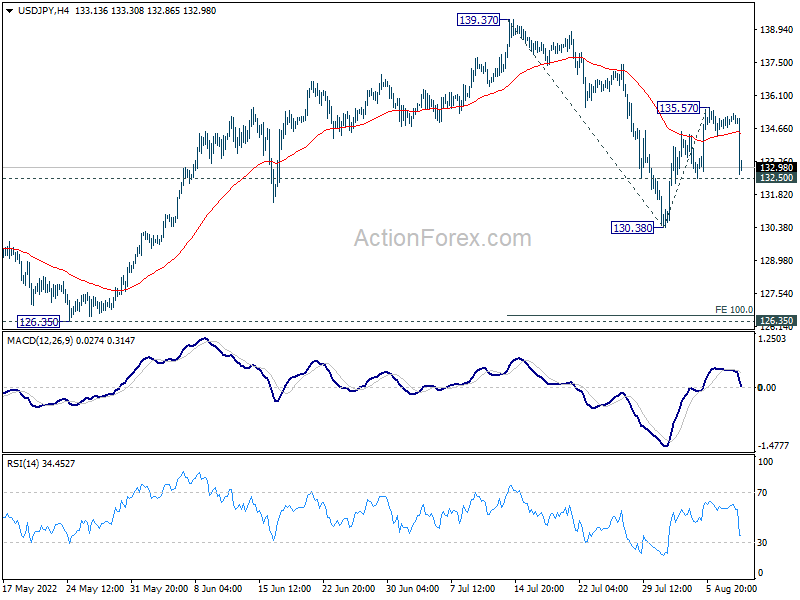
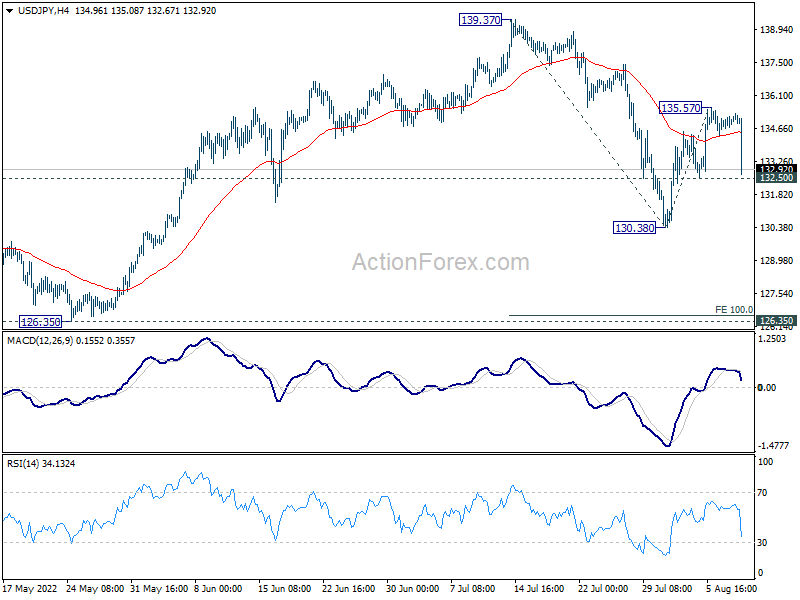
Immediate focus is now on 132.50 minor support in USD/JPY with current sharp fall. Firm break there will argue that whole decline from 139.37 is resuming. Intraday bias will be back on the downside for 130.38 first, and the 100% projection of 139.37 to 130.38 from 135.57 at 126.58. As such decline is seen as a corrective move, strong support should be seen from 126.35 to contain downside. On the upside, above 135.57 will resume the rebound from 130.38 to retest 139.37 high instead.
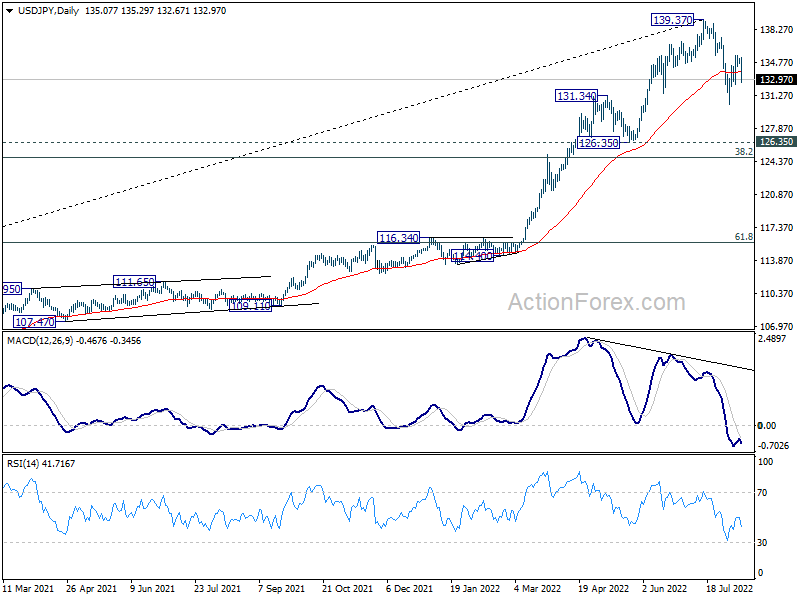
In the bigger picture, fall from 139.37 medium term top is seen as correcting whole up trend from 101.18 (2020 low). While deeper decline cannot be ruled out, outlook will stays bullish as long as 55 week EMA (now at 121.84) holds. Long term up trend is expected to resume through 139.37 at a later stage, after the correction finishes.
USD/CHF Mid-Day Outlook
Daily Pivots: (S1) 0.9511; (P) 0.9536; (R1) 0.9560; More...
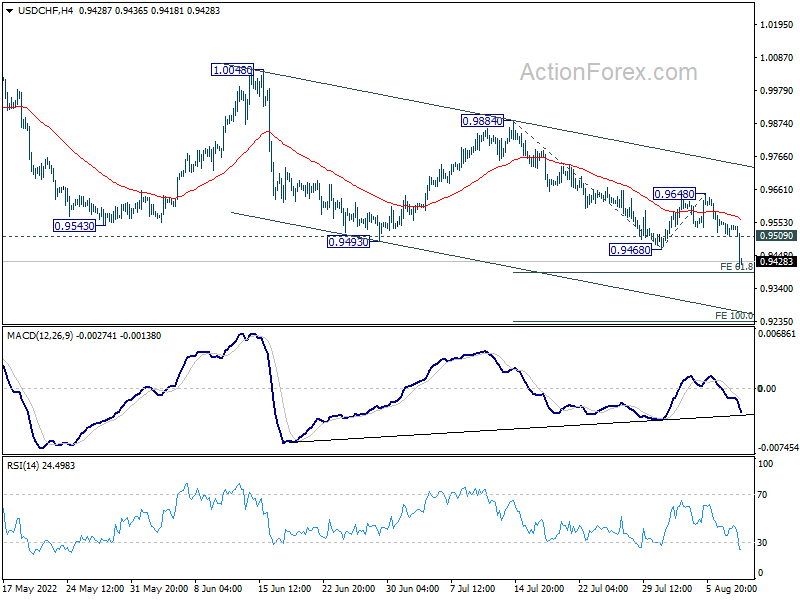
USD/CHF's decline resumed by breaking through 0.9468 and intraday bias is back on the downside. Prior rejection by 55 day EMA is a bearish sign. Strong break of 0.9471 support turned resistance also raises the chance of medium term reversal. Intraday bias is now on the downside. Break 61.8% projection of 0.9884 to 0.9468 from 0.9648 at 0.9391 will pave the way to 100% projection at 0.9232. On the upside, above 0.9509 minor resistance will mix up the outlook and turn intraday bias neutral first.
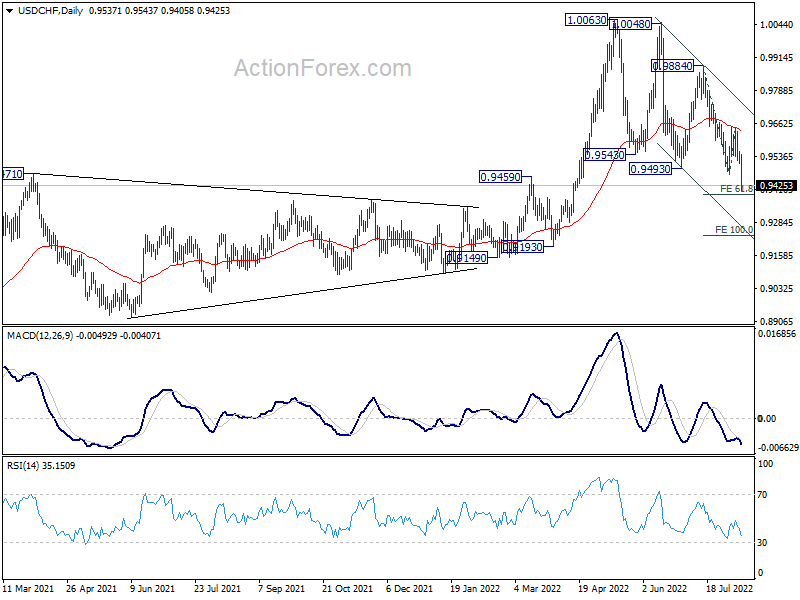
In the bigger picture, break of 0.9471 support turned resistance argues that medium term up trend from 0.8756 has completed with three waves up to 1.0063. Long term sideway pattern might have started another falling leg. Deeper decline would now be in favor as long as 0.9648 resistance holds, to 0.9149 structural support. Sustained break there could pave the way back to 0.8756.
GBP/USD Mid-Day Outlook
Daily Pivots: (S1) 1.2049; (P) 1.2090; (R1) 1.2117; More...
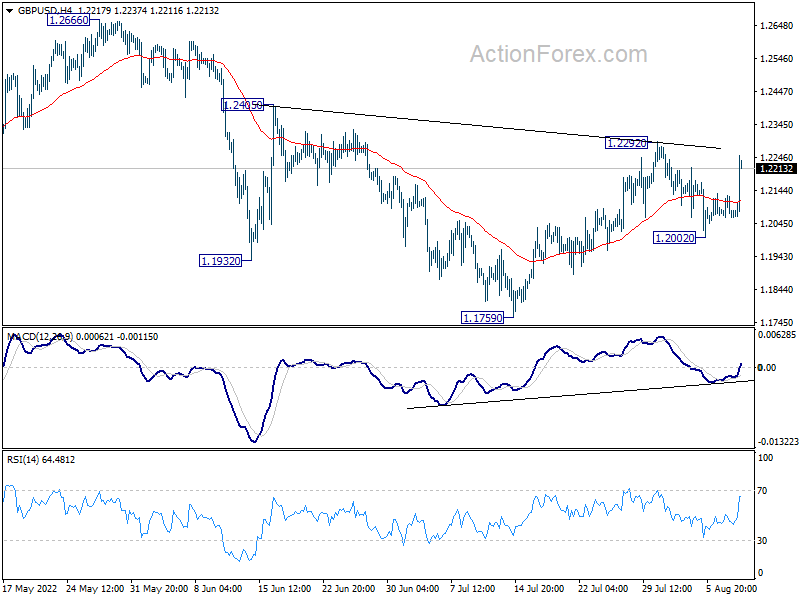
Current strong rebound argues that rise from 1.1759 is not completed. But upside is held below 1.2292 resistance and intraday bias in GBP/USD remains neutral first. On the upside, firm break of 1.2292 will also complete a head and shoulder bottom pattern (ls: 1.1932; h: 1.1769; rs: 1.2002). Further rally should then be seen to 1.2666 key resistance next. On the downside, however, break of 1.2002 will bring deeper fall back to retest 1.1759 low.
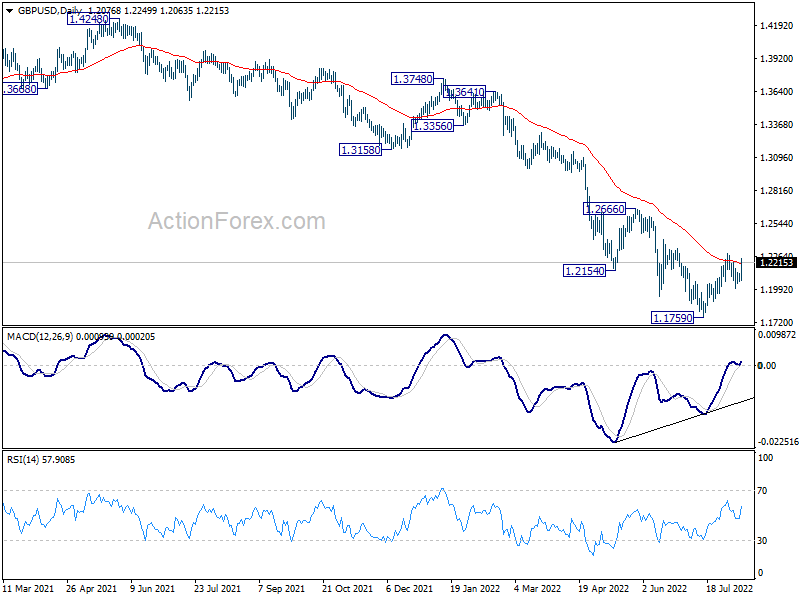
In the bigger picture, fall from 1.4248 (2018 high) could be a leg inside the pattern from 1.1409 (2020 low), or resuming the longer term down trend. Deeper decline is expected as long as 1.2666 resistance holds. Next target is 1.1409 low. However, firm break of 1.2666 will bring stronger rise back to 55 week EMA (now at 1.2925).
EUR/USD Mid-Day Outlook
Daily Pivots: (S1) 1.0186; (P) 1.0217; (R1) 1.0244; More...
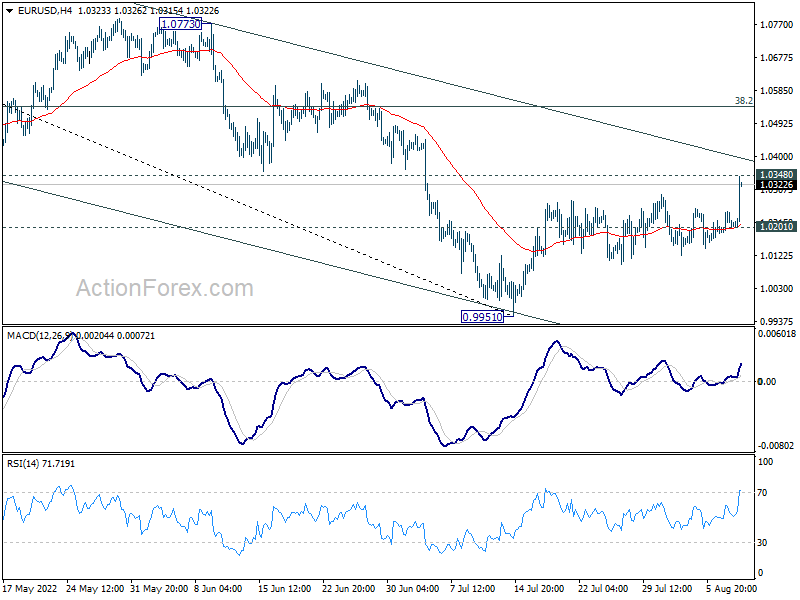
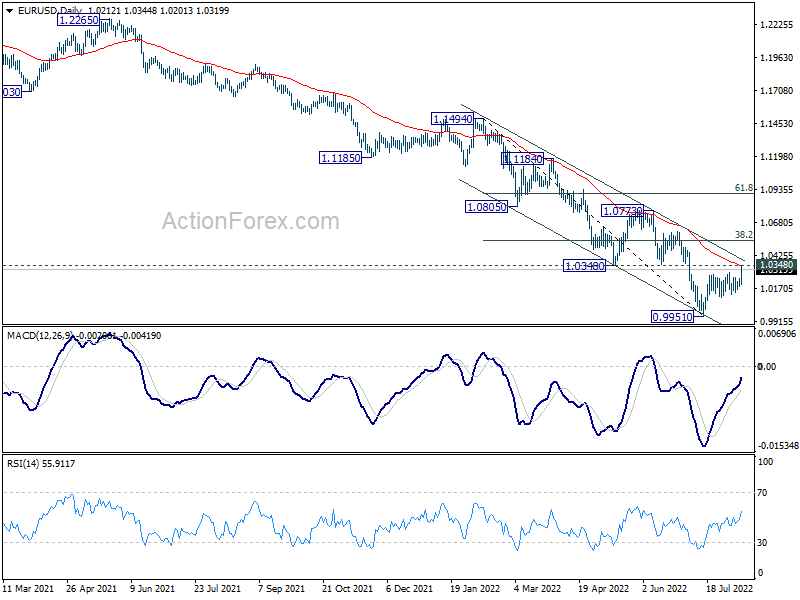
EUR/USD's rise from 0.9951 resumes today and accelerates to as high as 1.0344 so far. Immediate focus is now on 1.0348 support turned resistance, which is close to 55 day EMA (now at 1.0350). Decisive break there ague that such rally is at least correcting the fall from 1.1494. Further rally should then be seen to 38.2% retracement of 1.1494 to 0.9951 at 1.0540. On the downside, break of 1.0201 minor support will suggest that such rebound has completed and bring retest of 0.9951 low instead.
In the bigger picture, down trend from 1.6039 (2008 high) is still in progress. Next target is 100% projection of 1.3993 to 1.0339 from 1.2348 at 0.8694. In any case, outlook will stay bearish as long as 1.0773 resistance holds, in case of strong rebound.
Dollar Hammered after CPI Miss, Yen Strongest But Others May Catch Up
Dollar falls broadly in early US session after data shows headline CPI slowed more than expected, which core inflation held steady. Yen is gaining most against the greenback for now, with extra help from falling treasury yields. But it's unsure for now long Yen's rally against others could last. Also, it's hard to say which currencies is taking most advantage, as they'll need some time to sort their positions out. Nonetheless, selloff in the greenback is for now the main them.
Technically, USD/JPY's fall from 139.37 looks set to resume with current steep decline. Break of 132.50 will turn bias to the downside to 130.38 first. Further break there could prompt downside acceleration to 100% projection of 139.37 to 130.38 from 135.57 at 126.58, which is close to 126.25 structural support. Such development could help cap upside of other Yen crosses in case of their recoveries.
In Europe, at the time of writing, FTSE is up 0.21%. DAX is up 0.93%. CAC is up 0.65%. Germany 10-year yield is down -0.046 at 0.877. Earlier in Asia, Nikkei dropped -0.65%. Hong Kong HSI dropped -1.96%. China Shanghai SSE dropped -0.54%. Singapore Strait Times rose 0.47%. Japan 10-year JGB yield rose 0.0261 to 0.193.
US CPI slowed to 8.5% yoy, core CPI unchanged at 5.9% yoy
In July, US CPI was at 0.0% mom, below expectation of 0.2% mom. CPI core rose 0.3% mom, below expectation of 0.5% mom. Gasoline index dropped sharply by -7.7% mom. Energy index dropped -4.6 mom. But food index rose 1.1% mom.
For the last 12 months, CPI slowed from 9.1% yoy to 8.5% yoy, below expectation of 8.7% yoy. CPI core was unchanged at 5.9% yoy, below expectation of 6.1% yoy. Energy index rose 32.9% yoy, slowed from 4.16% yoy. Food index rose 10.9% yoy, highest since May 1979.
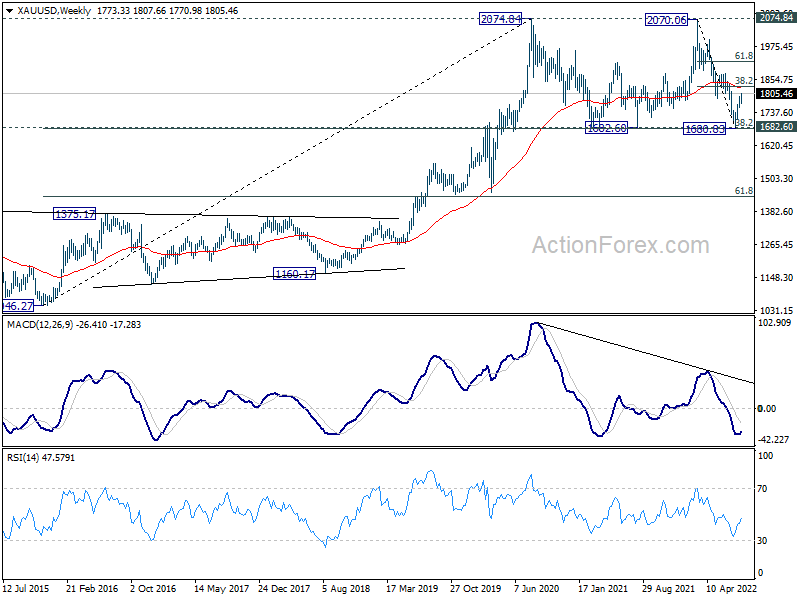
Gold breaks 1800 after US CPI
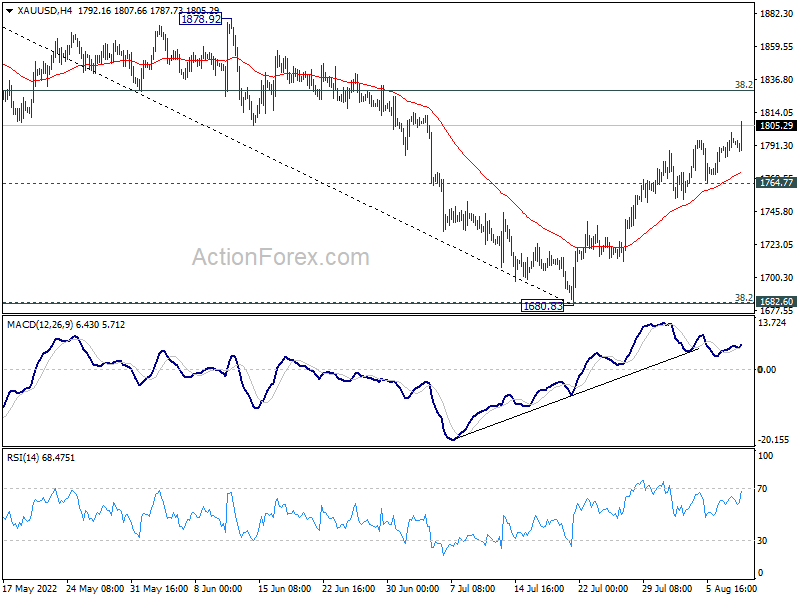
Gold's rally from 1680.83 picks up some momentum after US CPI release, and breaks above 1800 handle. For now further rally is expected as long as 1764.77 support holds. Next near term target is 38.2% retracement of 2070.06 to 1680.83 at 1829.51. This fibonacci level is close to 55 week EMA (now at 1826.89).
Sustained break of 1826/9 will add to that case fall from 2070.06 is totally over. That will also solidify the case that whole corrective pattern from 2074.84 has completed with three waves to 1680.83. In this case, stronger rally would be seen to 61.8% retracement at 1921.37 next.
EUR/USD Mid-Day Outlook
Daily Pivots: (S1) 1.0186; (P) 1.0217; (R1) 1.0244; More...
EUR/USD's rise from 0.9951 resumes today and accelerates to as high as 1.0344 so far. Immediate focus is now on 1.0348 support turned resistance, which is close to 55 day EMA (now at 1.0350). Decisive break there ague that such rally is at least correcting the fall from 1.1494. Further rally should then be seen to 38.2% retracement of 1.1494 to 0.9951 at 1.0540. On the downside, break of 1.0201 minor support will suggest that such rebound has completed and bring retest of 0.9951 low instead.
In the bigger picture, down trend from 1.6039 (2008 high) is still in progress. Next target is 100% projection of 1.3993 to 1.0339 from 1.2348 at 0.8694. In any case, outlook will stay bearish as long as 1.0773 resistance holds, in case of strong rebound.
Economic Indicators Update
| GMT | Ccy | Events | Actual | Forecast | Previous | Revised |
|---|---|---|---|---|---|---|
| 23:50 | JPY | PPI Y/Y Jul | 8.60% | 8.40% | 9.20% | 9.40% |
| 01:30 | CNY | CPI Y/Y Jul | 2.70% | 2.90% | 2.50% | |
| 01:30 | CNY | PPI Y/Y Jul | 4.20% | 4.90% | 6.10% | |
| 06:00 | EUR | Germany CPI M/M Jul F | 0.90% | 0.90% | 0.90% | |
| 06:00 | EUR | Germany CPI Y/Y Jul F | 7.50% | 7.50% | 7.50% | |
| 12:30 | USD | CPI M/M Jul | 0.00% | 0.20% | 1.30% | |
| 12:30 | USD | CPI Y/Y Jul | 8.50% | 8.70% | 9.10% | |
| 12:30 | USD | CPI Core M/M Jul | 0.30% | 0.50% | 0.70% | |
| 12:30 | USD | CPI Core Y/Y Jul | 5.90% | 6.10% | 5.90% | |
| 14:00 | USD | Wholesale Inventories Jun F | 1.90% | 1.90% | ||
| 14:30 | USD | Crude Oil Inventories | 0.1M | 4.5M |