

Sample Category Title
Daily Technical Analysis
EUR/USD
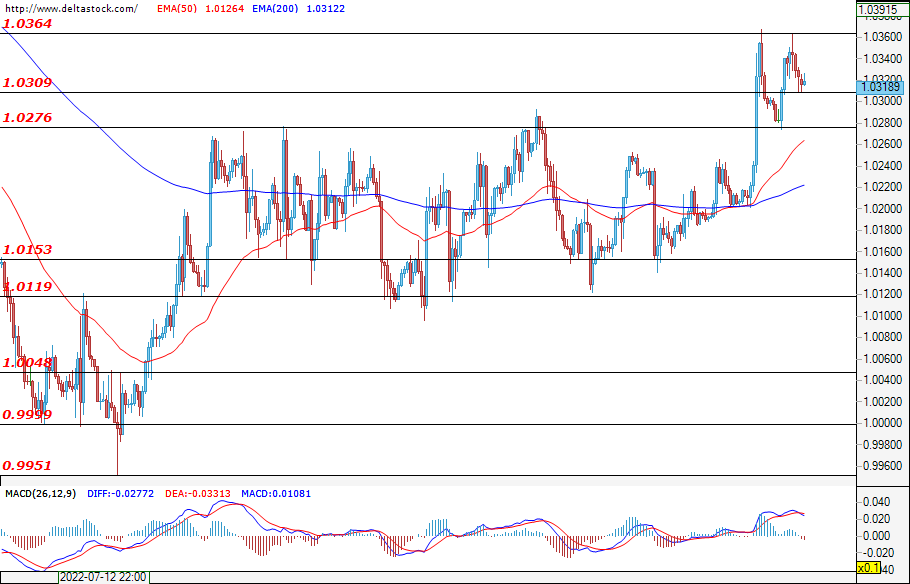
On Thursday this week, the single European currency was moving erratically. The day started low, but at the European open, the bulls took control and reached the same price as Wednesday, namely 1.0364. The reaction of the bears after the release of the U.S. manufacturing inflation data was swift and they brought the currency down from its double top and so the market closed at around 1.0317. Today, between 6:45 and 09:00 GMT, we will see a set of data that may give the euro a clear direction. Whether Tuesday's move will be further corrected or if we see a new wave of uptrend movements will depend on traders' reaction to today's data.
USD/JPY
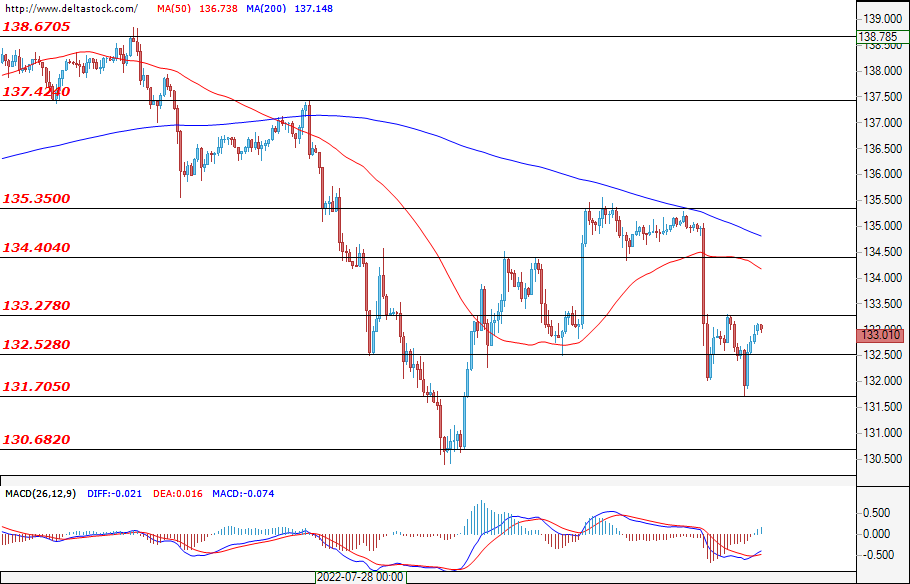
The Ninja is still hesitant about which direction to take after several extremely volatile trading sessions. In the early hours, we saw attempts to breach the key 133.27 level, but the bulls gave up, and in the next few hours, we saw a bottom deeper than the one reached yesterday. The price of 131.70 played the role of support and the USD/JPY managed to end the day with a bounce of nearly 30 pips from the mentioned bottom. Today, the data at 14:00 GMT on the current state of consumer sentiment in the U.S. may have an effect on the currency pair. Whether the corrections will deepen or if we will see a reversal of the trend remains to be seen.
GBP/USD
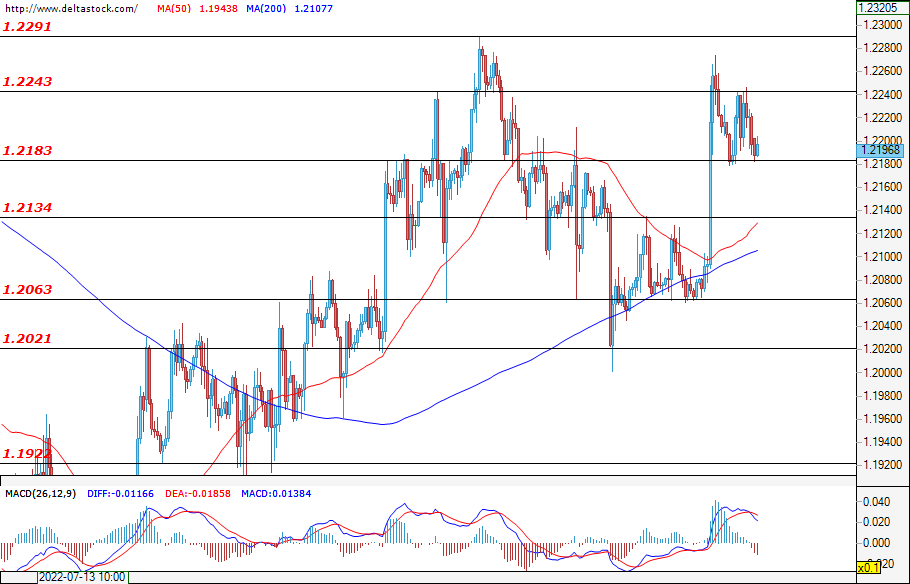
Yesterday, the Cable’s situation was akin to that of the euro. It started low, followed by a bull attack, but after reaching the 1.2243 resistance, the pair began moving in a narrow 40-pip range. We saw some slight buying at the 1.2183 levels, but everyone seems to be holding their breath as they await today’s data releases. At 6:00 GMT, we'll gain more insights into the UK gross domestic product on a monthly basis, as well as the preliminary count of quarterly GDP. Along with this, we also expect a report showing whether the production slowdown is continuing or deepening. If the results are negative, then the probability of the GBP/USD going down would be high because of the political crisis on the island and the lack of clarity about who will take over the role of Boris Johnson.
EUGERMANY40
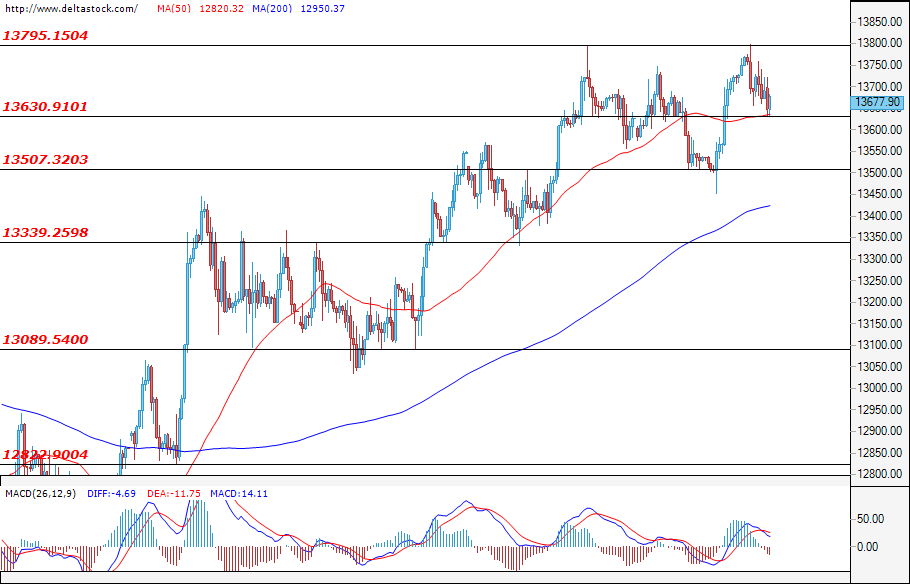
Yesterday, with the opening of the European session, we saw a failed second attempt to breach last week's level of 13795. This, of course, denied the bulls a follow-up attack, and by the end of the day, the German index was under the firm grasp of the bears and headed back to the key prices at around 13630, where the day ended. Whether the EUGERMANY40 will be able to secure a new monthly high will depend on whether we will see a successful breakout of the abovementioned level. A deepening of the correction should not be ruled out as well because of the still ongoing energy crisis in the EU.
US30
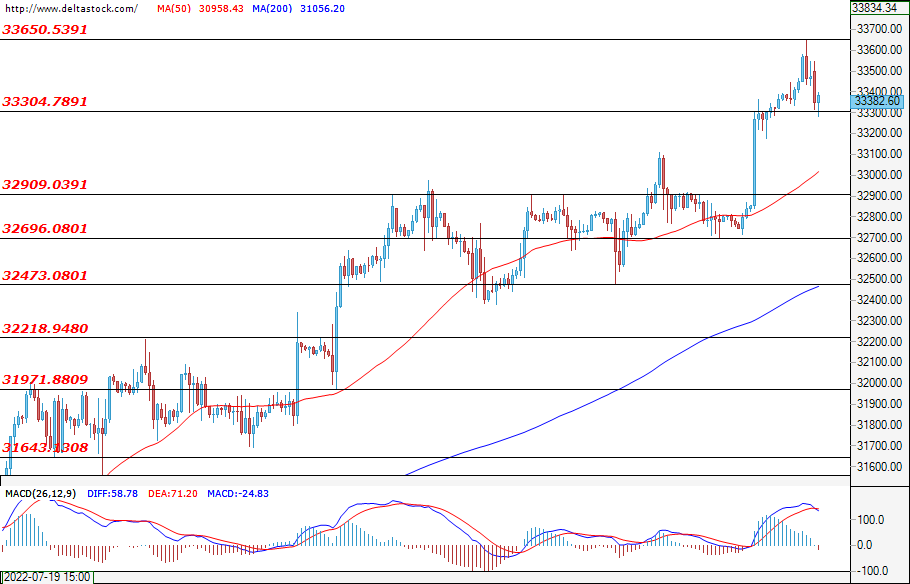
In the European session, the blue-chip index moved in a convincing uptrend and managed to reach a new monthly and weekly high of 33650. When Wall Street opened at 13:30 GMT, the bears found a good entry point at this price and took control of the index by the end of the day. They managed to get it back to 33300, where the index found support. Given the weakening of the dollar this week, it is fully expected to see an increase in the U.S. indices’ prices. The likelihood of this trend continuing will depend on the reaction to the current state of the U.S. consumer sentiment for the month of July due today at 14:00 GMT.
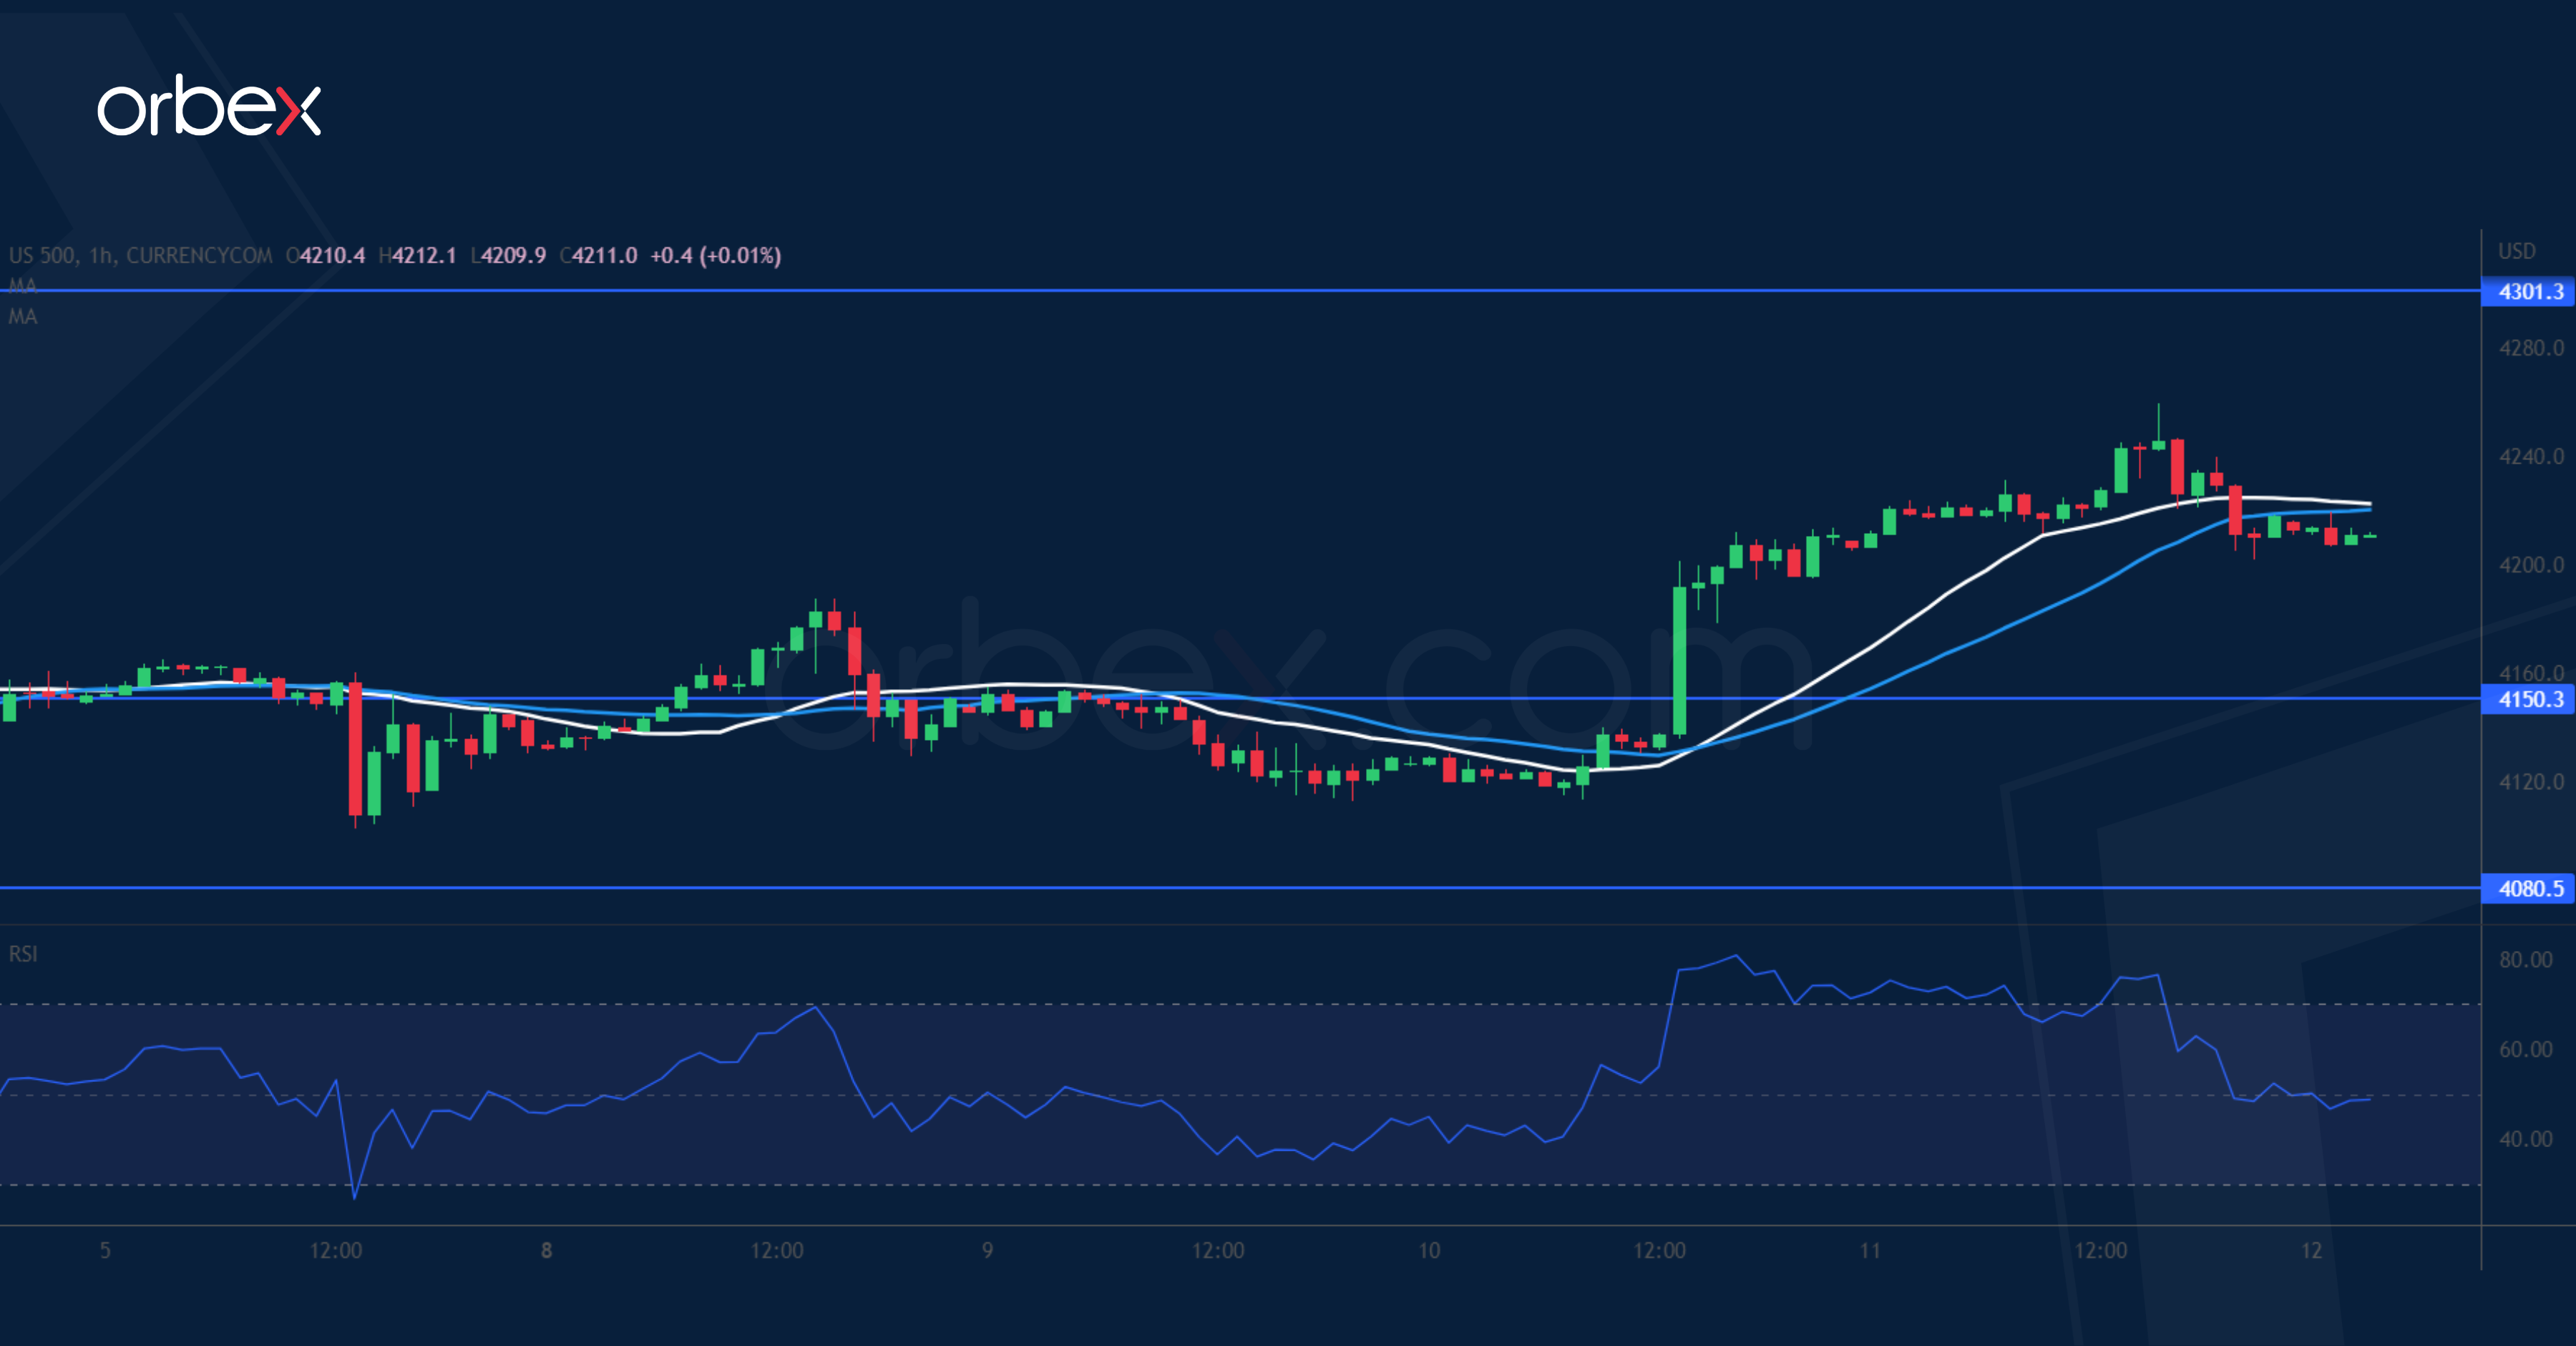
S&P 500 Pulls Lower
The S&P 500 falls back over concerns that inflation is yet to peak. Divergence between the 20 and 30-day moving averages indicates an acceleration to the upside. The current recovery may have gained traction after a break above June’s peak at 4200. Along with medium-term bears rushing to avoid a squeeze, momentum buying may continue to support the index. May’s high at 4300 would be the next target. An overbought RSI may cause a limited pullback, If this occurs, 4150 is a new support level.
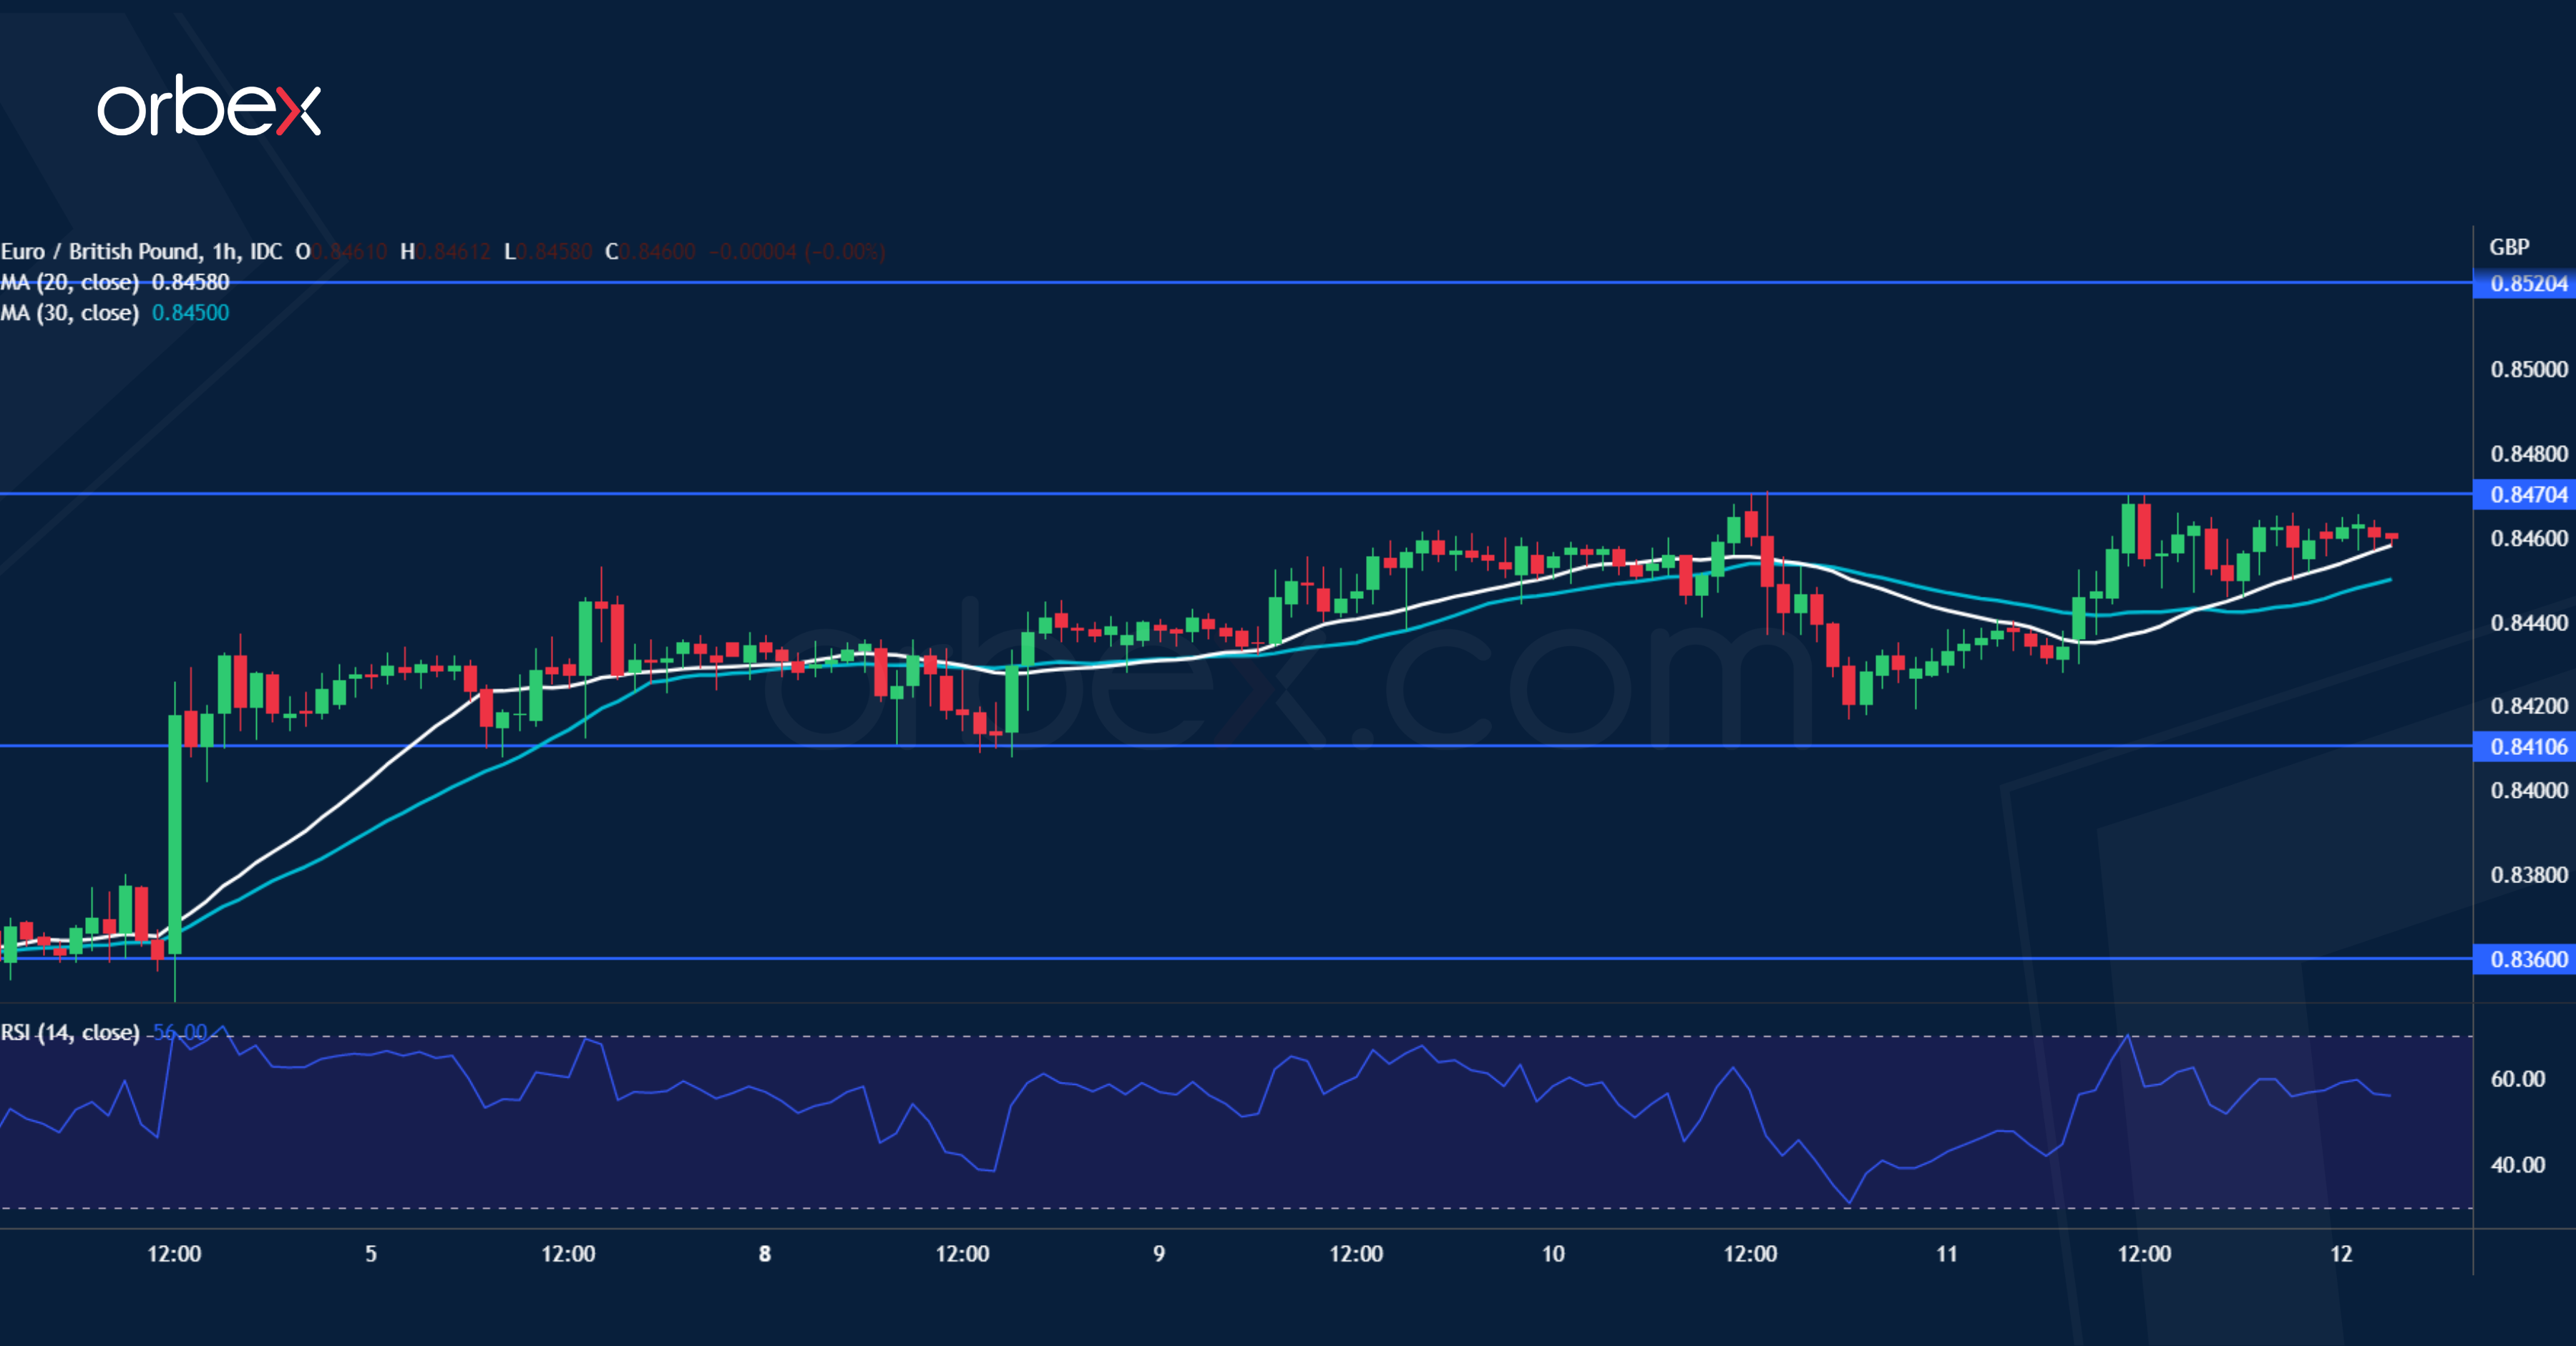
EUR/GBP Tests Resistance
Sterling treads water as the market expects a contraction in the UK’s Q2 GDP. The latest rebound came under pressure near the support-turned-resistance at 0.8470 which sits on the 30-day moving average. A bounce off 0.8410 showed solid interest in keeping the single currency afloat. A close above 0.8470 would send the pair to 0.8520 where a breakout could prompt more sellers to cover their bets, laying the groundwork for a rally to June’ highs next to 0.8580. 0.8410 is the first support in case of hesitation.
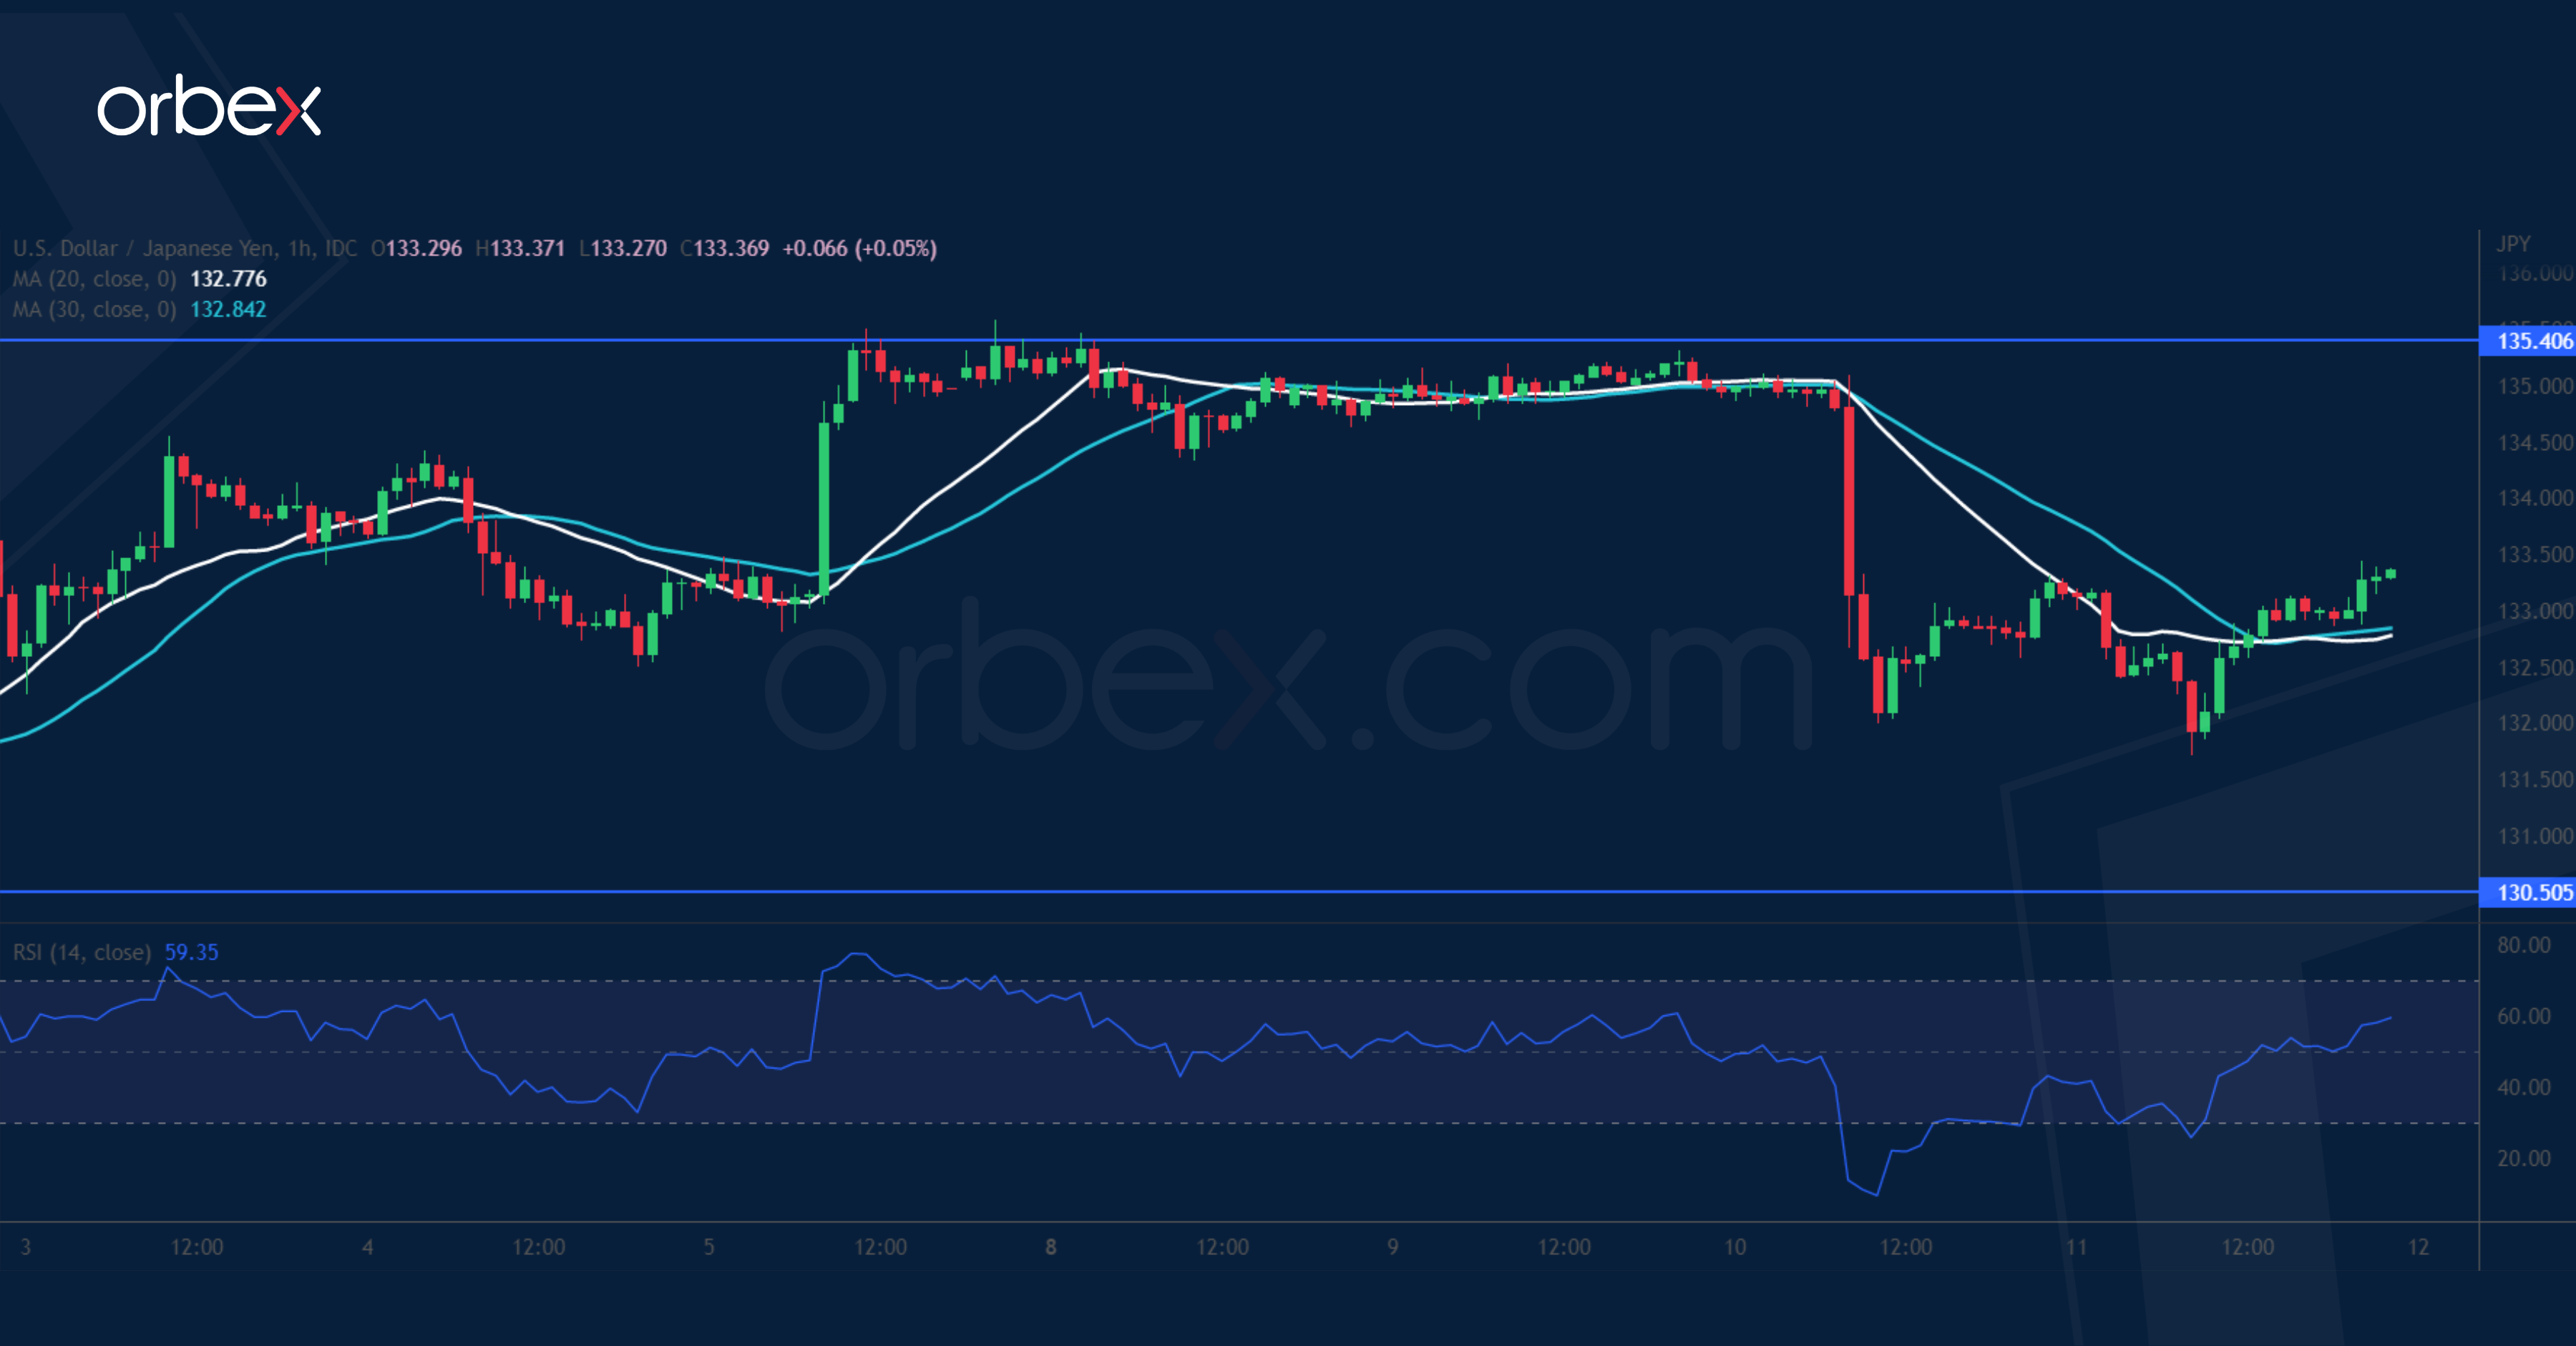
USD/JPY Struggles for Bids
The US dollar consolidates as traders reassess future rate hike moves by the Fed. A bearish RSI divergence and MA cross on the daily chart suggest the start of a correction. A short-lived rebound came to a halt in the supply zone around 135.40 which coincides with the 20-day moving average. A follow-up break below 133.00 indicates that the path of least resistance could be down. 130.50 at the origin of a bullish breakout in June is a critical floor, its breach may extend losses to last May’s lows next to 126.90.
Fed Warning, Jump in Energy Prices Dent Post-CPI Rally
US equities could hardly consolidate gains they posted following the Wednesday’s softer-than-expected inflation data in the US, even as the producer price index printed the first monthly decline since April 2020.
American factory gate prices fell 0.5% last month, and the yearly figure fell below the 10% mark. The decline was mostly due to a more than 15% drop in energy prices.
Rebound in energy prices was one likely explanation for the lack of risk appetite yesterday, Federal Reserve (Fed) members’ reluctance to cheer a premature easing in inflation, is the other.
A bear market rally, or a sustainable recovery?
Nasdaq retreated from the highest levels since the beginning of May. The S&P500 closed slightly in the negative, above the 4200 level, but below the major 50% Fibonacci retracement since the beginning of the year.
Obviously, a bear market rally, and a sustainable recovery are similar at the start. We must see consolidation to call the end of the year-to-date bear market.
Technically speaking, the S&P500 should hold ground above the 4090 points, the major 38.2% Fibonacci retracement on year-to-date selloff to keep its head above the negative trend.
One factor clearly plays against the stocks right now: perhaps an excessive positive pricing following the CPI data released this week. Activity on fed funds futures assess a 65% probability for a 50bp rate hike in September, meaning that there is now plenty of room for the latest Fed pricing to reverse, without, however, the need of excessively bad news. A simple rebound in energy prices could easily bring the Fed hawks back in the market and change the mood.
Energy rebound
The barrel of US crude rebounded to $94 as the International Energy Agency (IEA) warned that the biggest US oil companies’ combined deficit is almost back to the historical lows, and the end of the Strategic Petroleum release in the US, which should end in less than 3 months, will make the tight supply much more obvious.
The IEA says that the soaring gas prices boosted the use of oil-power generation, and that the ‘substantial’ gas-to-oil switching is, in return, set to boost crude consumption for the rest of the year, even as demand growth from other parts of the economy slows, due to higher price pressures, and slowing economic activity.
They added that the extra demand due to high gas prices will increase by 2 mio barrels this year, to push the daily oil demand to around 100 mio, and a further 2.1 mio in 2023, to push the global oil demand close to 102 mio barrels per day.
From the technical perspective, oil prices have completed an ABCD pattern, which could encourage a bullish breakout, and support a rebound toward the $100 per barrel level in the short to medium run. The first natural target for the oil bulls stands near the $96 level, which is the 200-DMA.
USD/JPY Daily Outlook
Daily Pivots: (S1) 132.04; (P) 132.67; (R1) 133.62; More...
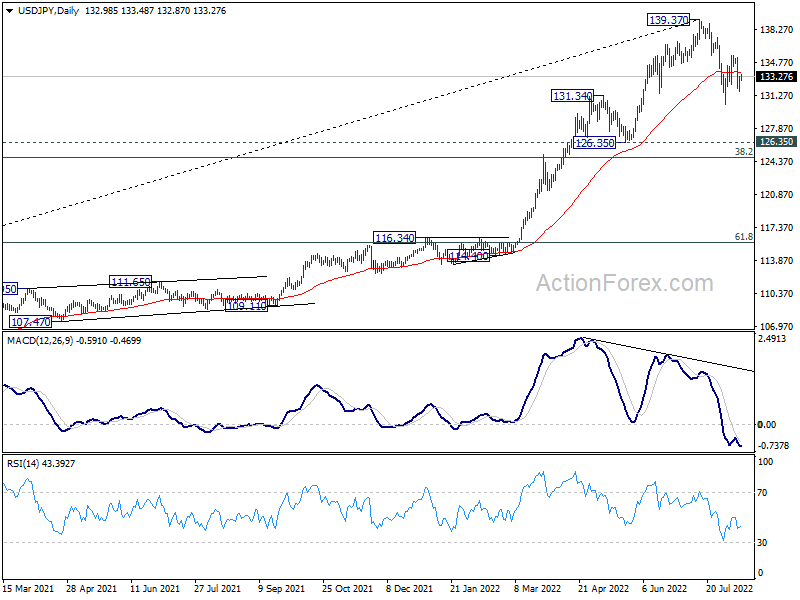
Intraday bias in USD/JPY is turned neutral first, as it recovered well ahead of 130.38 support. Overall outlook is unchanged that price actions from 139.37 are developing into a corrective pattern to larger up trend. Below 130.38 will target 100% projection of 139.37 to 130.38 from 135.57 at 126.58. But downside should be contained by 126.35 structure support. On the upside, above 135.57 will resume the rebound form 130.38 to retest 139.37, but firm break there is not expected even in this case.
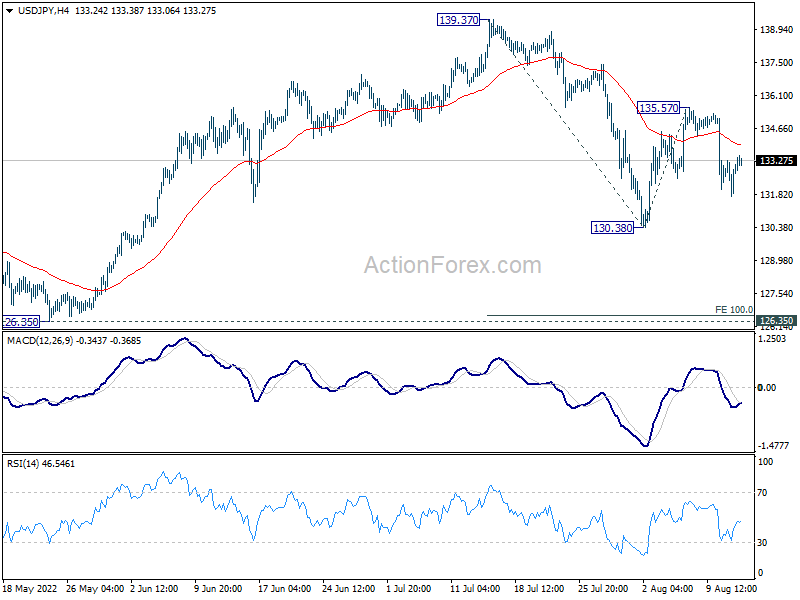
In the bigger picture, fall from 139.37 medium term top is seen as correcting whole up trend from 101.18 (2020 low). While deeper decline cannot be ruled out, outlook will stays bullish as long as 55 week EMA (now at 121.84) holds. Long term up trend is expected to resume through 139.37 at a later stage, after the correction finishes.
Dollar Staying Weak, But Yen Turns Lower Too
Dollar remains the worst performing major currency for the week, but the dynamics are shifting. Yen is giving up much of its gain, following the strong rebound in benchmark treasury yields, but Swiss Franc is still firm. Euro and Sterling are somewhat under pressure too, while smaller than expected GDP contraction gives the Pound little help. Commodity currencies are staying the strongest ones, as led by Kiwi and Aussie.
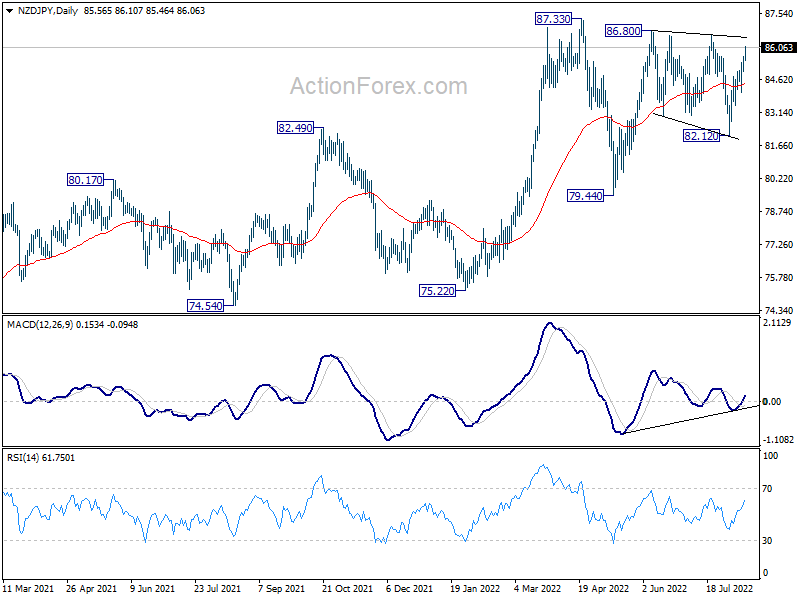
Technically, NZD/JPY looks set to take on 86.80/87.33 resistance zone with current strong rally. Decisive break there will resume larger up trend. If that happens, attention would also be on USD/JPY at the same time, on whether it would break through 135.57 minor resistance to resume the rebound from 130.38, towards 139.37 high.
In Asia, Nikkei rose 2.62%. Hong Kong HSI is up 0.39%. China Shanghai SSE is up 0.04%. Singapore Strait Times is down -0.92%. Japan 10-year JGB yield is up 0.0046 at 0.198. Overnight, DOW rose 0.08%. S&P 500 dropped -0.07%. NASDAQ dropped -0.58%. 10-year yield rose 0.102 to 2.888.
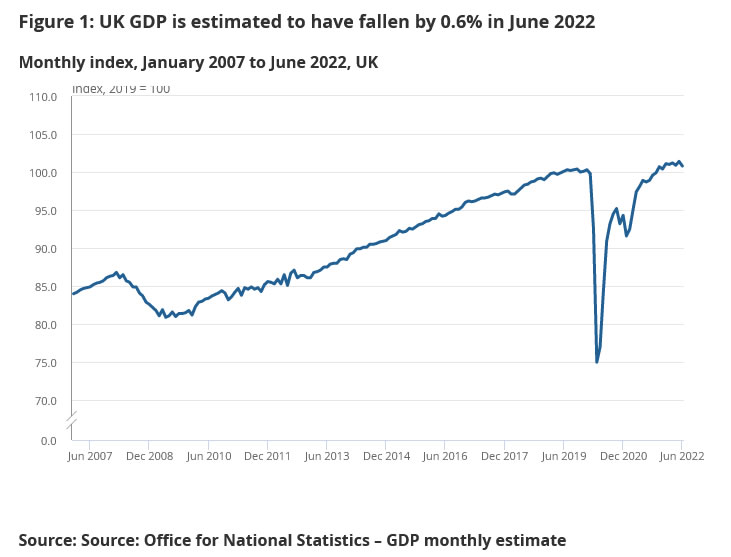
UK GDP down -0.6% mom in Jun, -0.1% qoq in Q2
UK GDP contracted -0.6% mom in June, better than expectation of -1.3% mom. All main sectors contributed negatively to the monthly GDP estimate. Services was the main contributor, down -0.5%. Production dropped -0.9% mom. while construction also fell by -1.4% mom. Monthly GDP was still 0.9% above its pre-coronavirus levels in February 2020.
For the whole of Q2, GDP contracted -0.1% qoq, above expectation of -0.2% qoq. The level of GDP was 2.9% yoy higher than Q2 2021. Also, compared with the same quarter a year ago, the implied GDP deflator rose by 6.0%, primarily reflecting the 7.3% increase in the price of household consumption expenditure, which is the fastest annual household deflator growth rate since 1991.
GBP/AUD breaks out from medium term range, EUR/AUD to follow
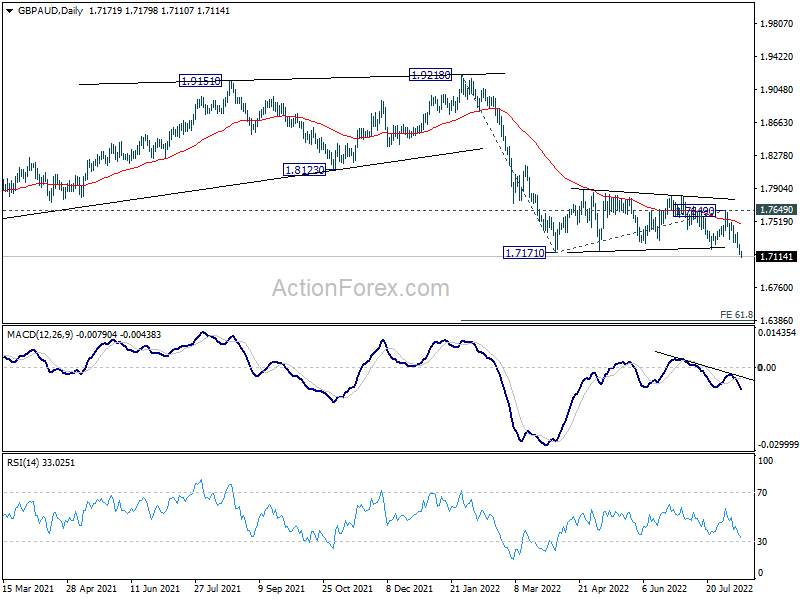
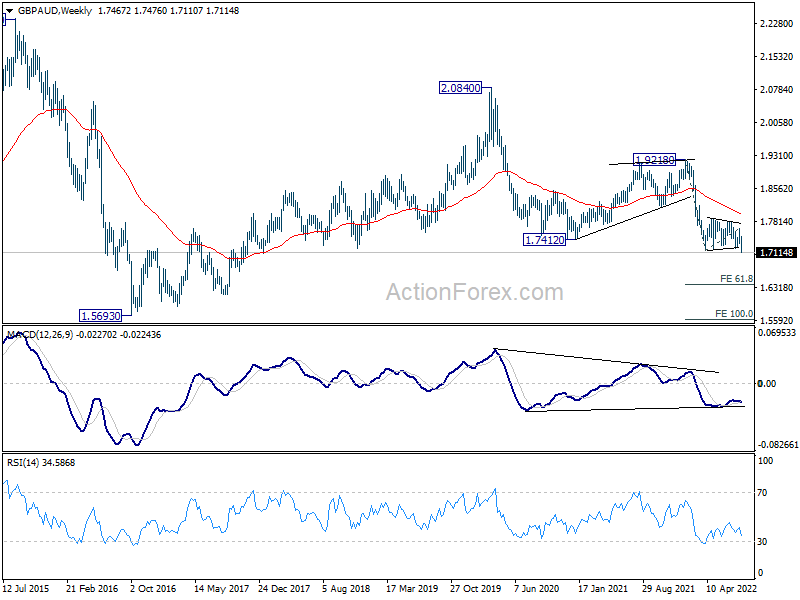
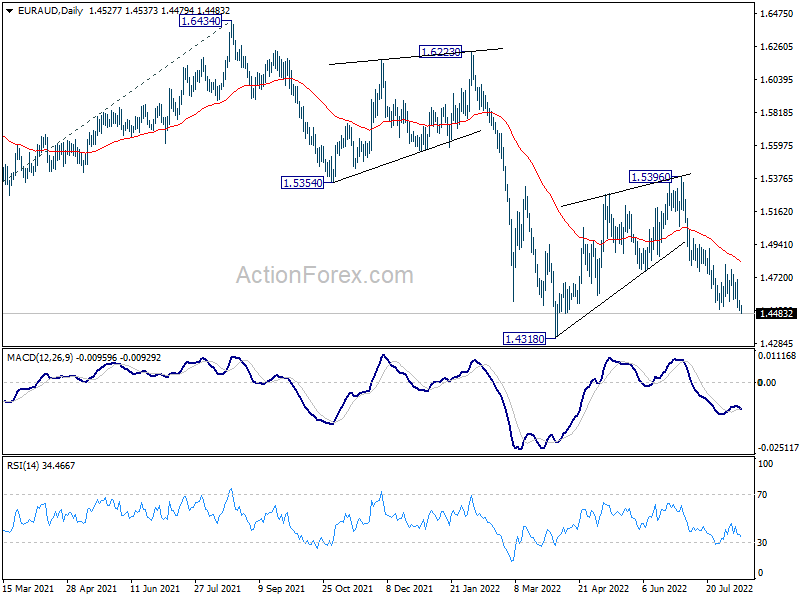
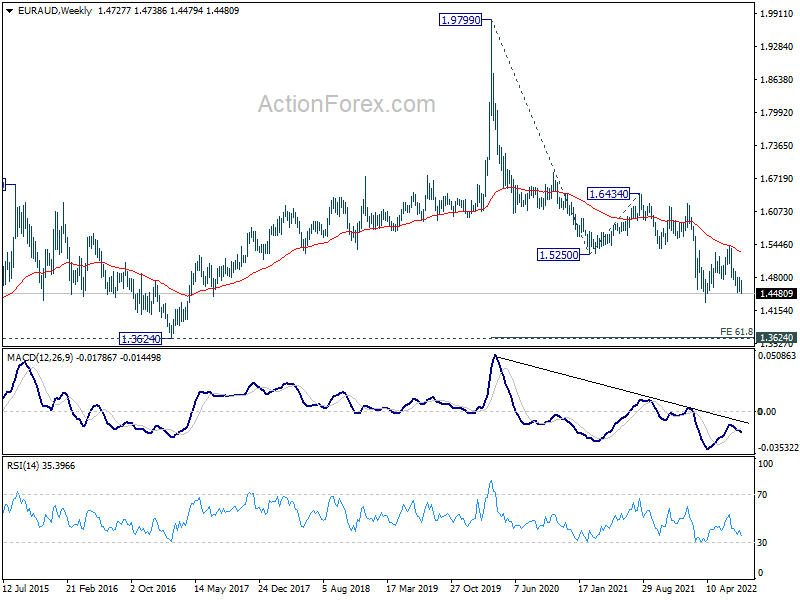
GBP/AUD finally broke out from medium term consolidation and resume down trend this week. EUR/AUD is also following and look ready for down trend resumption too. The development came as commodity currencies generally responded better to receding expectation of another 75bps Fed hike, than European majors.
GBP/AUD's fall is seen as part of the down trend from 1.9218, as well as that from 2.0840 (2020 high). Both near term and medium term bearishness are maintained well with the cross capped by falling 55 day and 55 week EMA. Next target is 61.8% projection of 1.9218 to 1.7171 from 1.7649 at 1.6384.
EUR/AUD also resumed the fall from 1.5396 through 1.4580 support. It's now targeting 1.4318 low (corresponding to GBP/AUD's 1.7171 support). Firm break there will resume whole down trend from 1.9799 (2020 high), and target 61.8% projection of 1.9799 to 1.5250 from 1.6434 at 1.3623, which is close to 1.3624 long term support (2017 low).
USD/JPY Daily Outlook
Daily Pivots: (S1) 132.04; (P) 132.67; (R1) 133.62; More...
Intraday bias in USD/JPY is turned neutral first, as it recovered well ahead of 130.38 support. Overall outlook is unchanged that price actions from 139.37 are developing into a corrective pattern to larger up trend. Below 130.38 will target 100% projection of 139.37 to 130.38 from 135.57 at 126.58. But downside should be contained by 126.35 structure support. On the upside, above 135.57 will resume the rebound form 130.38 to retest 139.37, but firm break there is not expected even in this case.
In the bigger picture, fall from 139.37 medium term top is seen as correcting whole up trend from 101.18 (2020 low). While deeper decline cannot be ruled out, outlook will stays bullish as long as 55 week EMA (now at 121.84) holds. Long term up trend is expected to resume through 139.37 at a later stage, after the correction finishes.
Economic Indicators Update
| GMT | Ccy | Events | Actual | Forecast | Previous | Revised |
|---|---|---|---|---|---|---|
| 22:30 | NZD | Business NZ PMI Jul | 52.7 | 49.7 | ||
| 06:00 | GBP | GDP M/M Jun | -0.60% | -1.30% | 0.50% | |
| 06:00 | GBP | GDP Q/Q Q2 P | -0.10% | -0.20% | 0.80% | |
| 06:00 | GBP | Industrial Production M/M Jun | -0.90% | -0.80% | 0.90% | 1.30% |
| 06:00 | GBP | Industrial Production Y/Y Jun | 2.40% | 1.60% | 1.40% | 1.80% |
| 06:00 | GBP | Manufacturing Production M/M Jun | -1.60% | -1.70% | 1.40% | 1.70% |
| 06:00 | GBP | Manufacturing Production Y/Y Jun | 1.30% | 1.30% | 2.30% | 2.60% |
| 06:00 | GBP | Index of Services 3M/3M Jun | -0.40% | -0.40% | 0.10% | 0.00% |
| 06:00 | GBP | Goods Trade Balance (GBP) Jun | -22.8B | -22.3B | -21.4B | |
| 08:00 | EUR | Italy Trade Balance (EUR) Jun | 0.35B | -0.01B | ||
| 09:00 | EUR | Eurozone Industrial Production M/M Jun | 0.00% | 0.80% | ||
| 12:30 | USD | Import Price Index M/M Jul | -0.50% | 0.20% | ||
| 14:00 | USD | Michigan Consumer Sentiment Index Aug P | 52.3 | 51.5 |
UK GDP down -0.6% mom in Jun, -0.1% qoq in Q2
UK GDP contracted -0.6% mom in June, better than expectation of -1.3% mom. All main sectors contributed negatively to the monthly GDP estimate. Services was the main contributor, down -0.5%. Production dropped -0.9% mom. while construction also fell by -1.4% mom. Monthly GDP was still 0.9% above its pre-coronavirus levels in February 2020.
For the whole of Q2, GDP contracted -0.1% qoq, above expectation of -0.2% qoq. The level of GDP was 2.9% yoy higher than Q2 2021. Also, compared with the same quarter a year ago, the implied GDP deflator rose by 6.0%, primarily reflecting the 7.3% increase in the price of household consumption expenditure, which is the fastest annual household deflator growth rate since 1991.
GBP/AUD breaks out from medium term range, EUR/AUD to follow
GBP/AUD finally broke out from medium term consolidation and resume down trend this week. EUR/AUD is also following and look ready for down trend resumption too. The development came as commodity currencies generally responded better to receding expectation of another 75bps Fed hike, than European majors.
GBP/AUD's fall is seen as part of the down trend from 1.9218, as well as that from 2.0840 (2020 high). Both near term and medium term bearishness are maintained well with the cross capped by falling 55 day and 55 week EMA. Next target is 61.8% projection of 1.9218 to 1.7171 from 1.7649 at 1.6384.
EUR/AUD also resumed the fall from 1.5396 through 1.4580 support. It's now targeting 1.4318 low (corresponding to GBP/AUD's 1.7171 support). Firm break there will resume whole down trend from 1.9799 (2020 high), and target 61.8% projection of 1.9799 to 1.5250 from 1.6434 at 1.3623, which is close to 1.3624 long term support (2017 low).
Fed Daly: 50bps is the case for Sep FOMC meeting
San Francisco Fed President Mary Daly told Bloomberg TV overnight that 50bps rate hike "is the case" for September FOMC meeting. But added, "I am open to 75 should the data evolve differently."
Daly didn't expect rate cuts to quickly follow the current tightening cycle once inflation is conquered. "I don't see this hump-shaped part where we raise interest rates to really high rates and then bring them down," she said. "I think of raising them to a level that we think is going to be appropriate and then holding them there."