Sample Category Title
EUR/USD Mid-Day Outlook
Daily Pivots: (S1) 1.0274; (P) 1.0290; (R1) 1.0297; More...
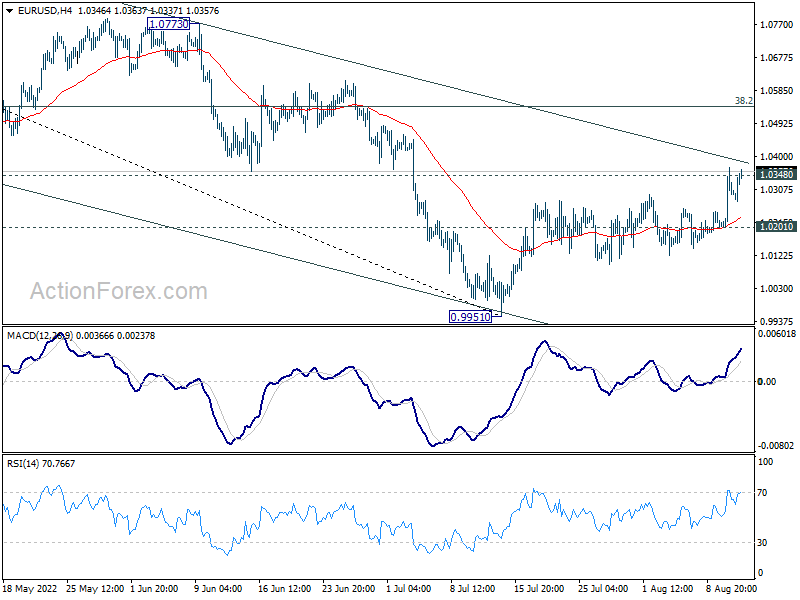
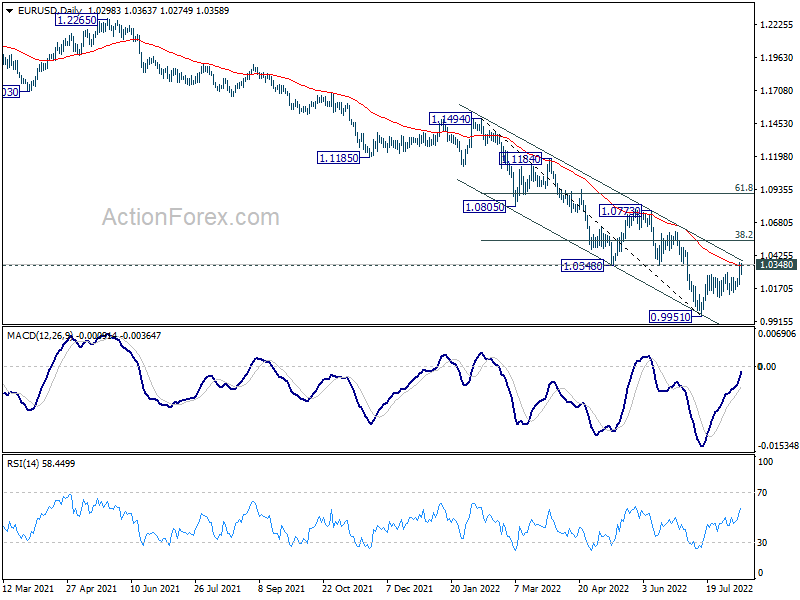
Focus stays on 1.0348 support turned resistance, which is close to 55 day EMA (now at 1.0350). Decisive break there argue that rally from 0.9951 is at least correcting the fall from 1.1494. Further rise should then be seen to 38.2% retracement of 1.1494 to 0.9951 at 1.0540. On the downside, break of 1.0201 minor support will suggest that such rebound has completed and bring retest of 0.9951 low instead.
In the bigger picture, down trend from 1.6039 (2008 high) is still in progress. Next target is 100% projection of 1.3993 to 1.0339 from 1.2348 at 0.8694. In any case, outlook will stay bearish as long as 1.0773 resistance holds, in case of strong rebound.
GBP/USD Mid-Day Outlook
Daily Pivots: (S1) 1.2095; (P) 1.2186; (R1) 1.2306; More...
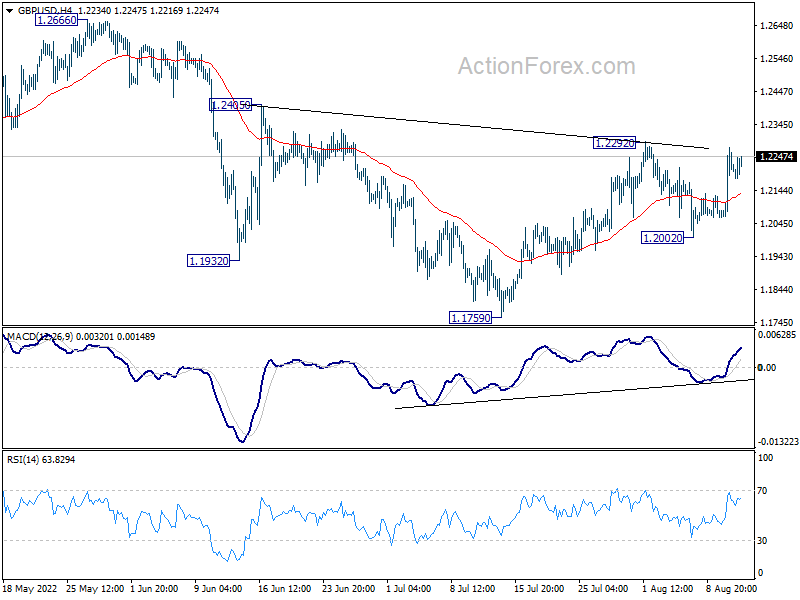
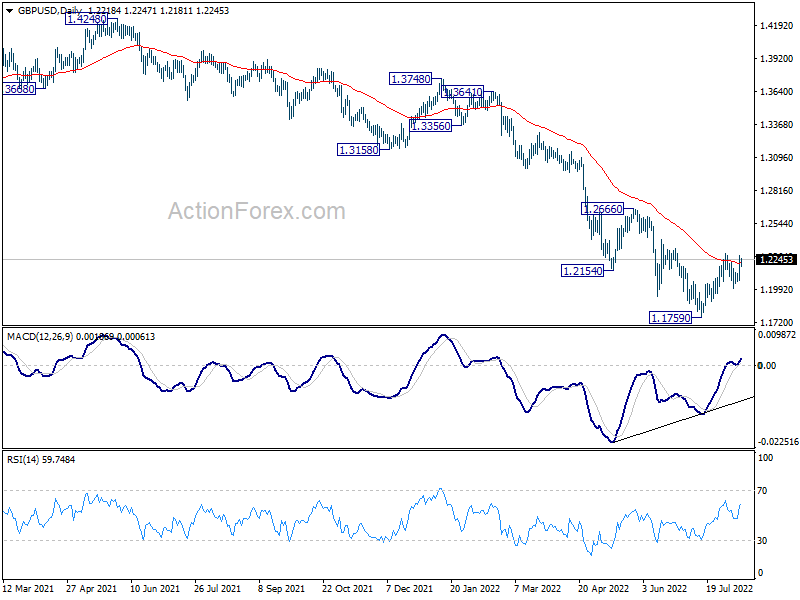
Intraday bias in GBP/USD remains neutral for the moment. On the upside, decisive break of 1.2292 resistance will complete a head and shoulder bottom pattern (ls: 1.1932; h: 1.1769; rs: 1.2002). Further rally should then be seen to 1.2666 key resistance next. On the downside, however, break of 1.2002 will bring deeper fall back to retest 1.1759 low.
In the bigger picture, fall from 1.4248 (2018 high) could be a leg inside the pattern from 1.1409 (2020 low), or resuming the longer term down trend. Deeper decline is expected as long as 1.2666 resistance holds. Next target is 1.1409 low. However, firm break of 1.2666 will bring stronger rise back to 55 week EMA (now at 1.2925).
USD/CHF Mid-Day Outlook
Daily Pivots: (S1) 0.9366; (P) 0.9455; (R1) 0.9517; More...
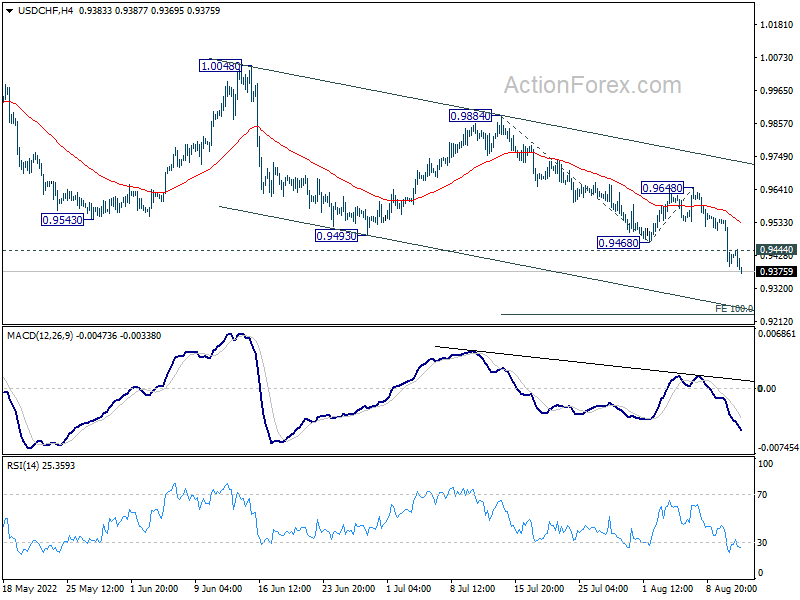
USD/CHF's decline is still in progress and intraday bias remains on the downside. Next target is 100% projection of 0.9884 to 0.9468 from 0.9648 at 0.9232. On the upside, above 0.9444 minor resistance will turn intraday bias neutral first. But risk will now stay on the downside as long as 0.9648 resistance holds, in case of recovery.
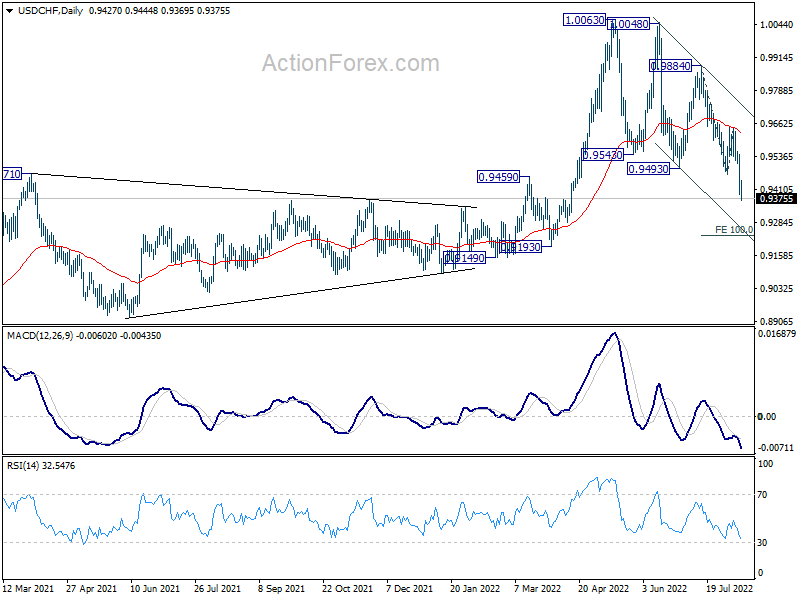
In the bigger picture, break of 0.9471 support turned resistance argues that medium term up trend from 0.8756 has completed with three waves up to 1.0063. Long term sideway pattern might have started another falling leg. Deeper decline would now be in favor as long as 0.9648 resistance holds, to 0.9149 structural support. Sustained break there could pave the way back to 0.8756.
USD/JPY Mid-Day Outlook
Daily Pivots: (S1) 131.51; (P) 133.41; (R1) 134.79; More...
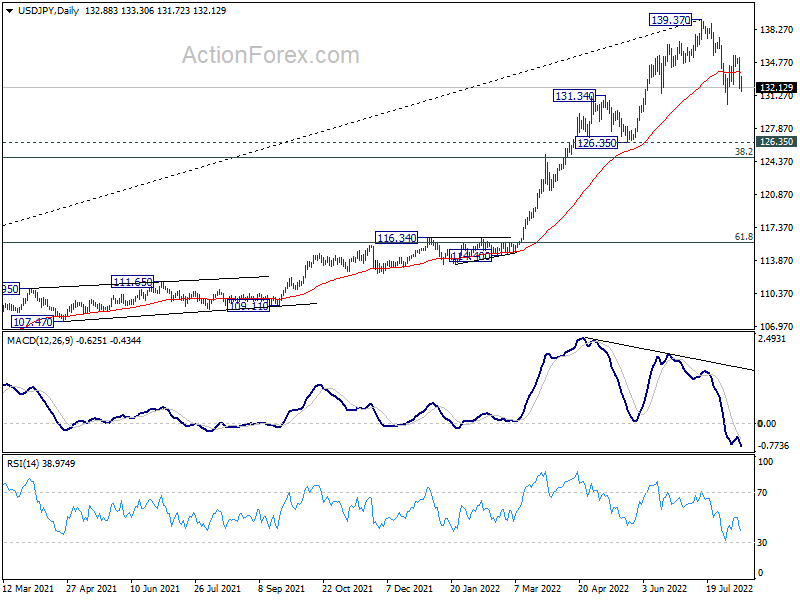
USD/JPY's recovery from 130.38 should have completed at 135.57 and fall from 139.37 is resume to resume. Intraday bias is back on the downside for 130.38 support first. Break there will target 100% projection of 139.37 to 130.38 from 135.57 at 126.58. As such decline is seen as a corrective move, strong support should be seen from 126.35 to contain downside. But for now, risk will remain on the downside as long as 135.57 resistance holds, in case of recovery.
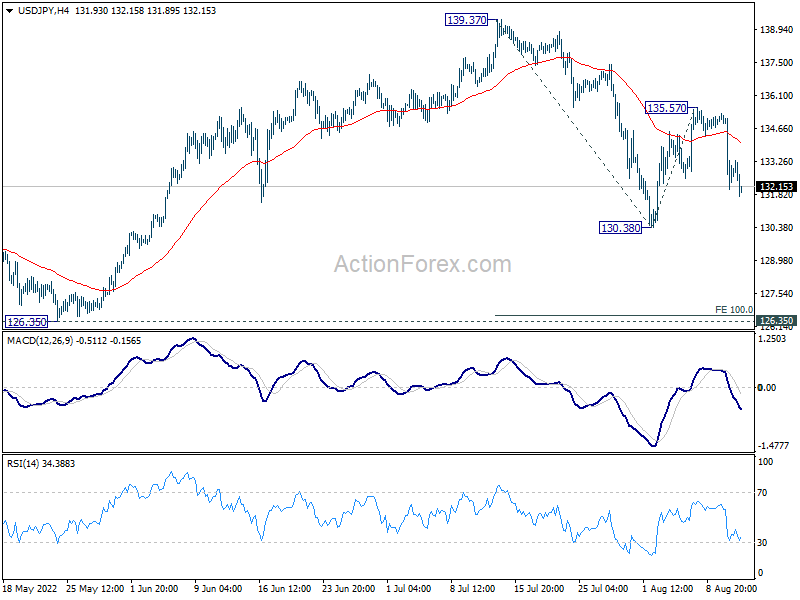
In the bigger picture, fall from 139.37 medium term top is seen as correcting whole up trend from 101.18 (2020 low). While deeper decline cannot be ruled out, outlook will stays bullish as long as 55 week EMA (now at 121.84) holds. Long term up trend is expected to resume through 139.37 at a later stage, after the correction finishes.
Dollar Selloff Resumes after PPI Miss
Dollar selloff resumes in early US session after lower than expected PPI reading. Aussie and Kiwi are strong as supported by risk-on sentiments but Canadian is lagging behind. Yen is also firm, together with Swiss Franc, thanks to falling yields. Euro and Sterling continue to be mixed. In other markets, Gold is struggling to take out 1800 handle decisively, but bias stays on the upside. WTI crude oil recovering, with relatively weak momentum.
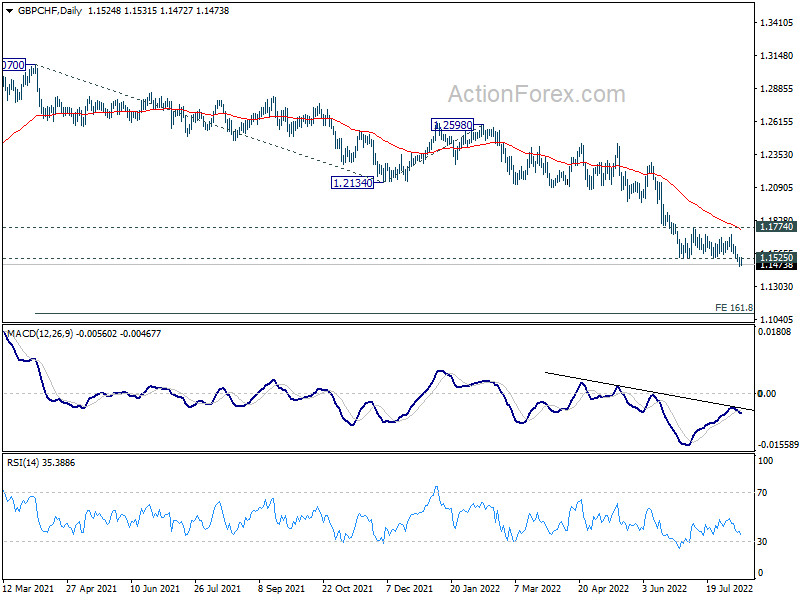
Technically, GBP/CHF's break of 1.1525 support this week suggests that down trend from 1.3070 is resuming. Next target is 161.8% projection of 1.3070 to 1.2134 from 1.2598 at 1.1084. The question is when EUR/CHF will follow and break through 0.9697 low.
In Europe, at the time of writing, FTSE is down -0.51%. DAX is up 0.16%. CAC is down -0.02%. Germany 10-year yield is down -0.0001 at 0.890. Earlier in Asia, Japan was on holiday. Hong Kong HSI rose 2.40%. China Shanghai SSE rose 1.60%. Singapore Strait Times rose 0.48%.
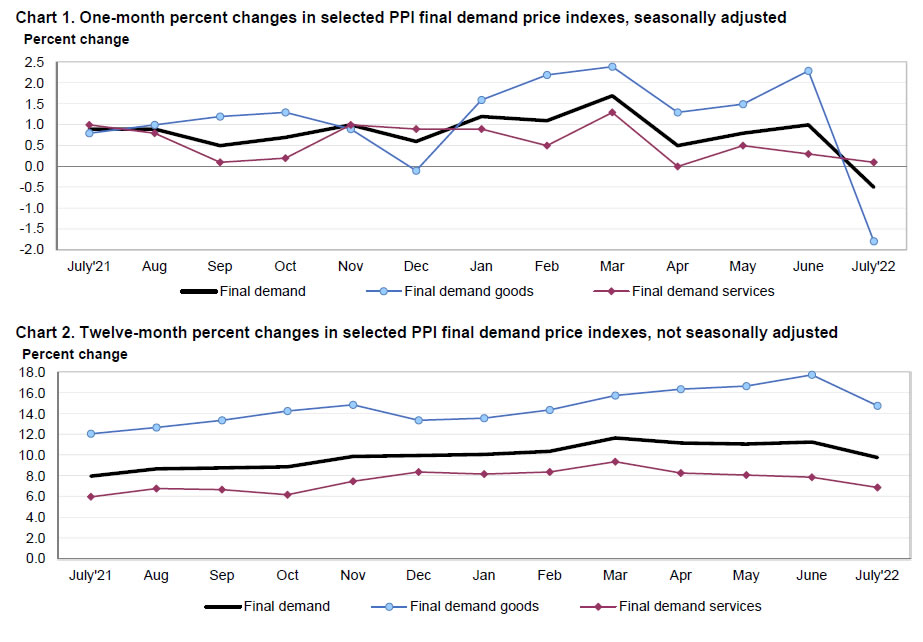
US PPI down -0.5% mom in Jul, slowed to 9.8% yoy
US PPI for final demand dropped -0.5% mom in July, versus expectation of 0.2% mom rise. The decrease is attributable to -1.8% mom decline in goods while services rose 0.1% mom. For the 12-months, PPI rose 9.8% yoy, slowed from June's 11.3% yoy.
Prices for final demand less foods, energy and trade services rose 0.2% mom. For the 12 months, PPI less foods, energy and trade services rose 5.8% yoy.
US initial jobless claims rose 14k to 262k
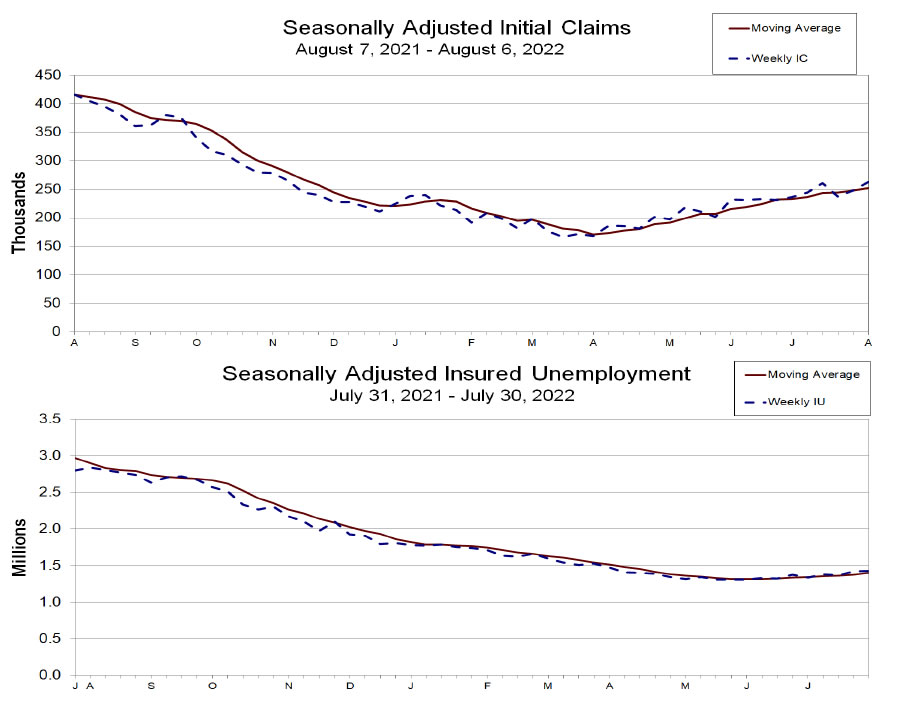
US initial jobless claims rose 14k to 262k in the week ending August 6, slightly below expectation of 265k. Four-week moving average of initial claims rose 4.5k to 252k.
Continuing claims rose 8k to 1428k in the week ending July 30. Four-week moving average of continuing claims rose 24k to 1399k.
Fed Daly: 50bps hike in Sep is her baseline
In an FT interview, San Francisco Fed President Mary Daly said, "there's good news on the month-to-month data that consumers and business are getting some relief, but inflation remains far too high and not near our price stability goal,"
"This is why we don't want to declare victory on inflation coming down," she said. "We're not near done yet."
She reiterated her view that rise should rise to just under 3.5% by the end of the year. And her baseline for September FOMC meeting is a 50bps hike.
"There is a lot of uncertainty, so leaping ahead with great confidence that [a 0.75 percentage point rate rise] is what we need and being prescriptive would not be optimal policy," she said.
NZD/USD completed head and shoulder bottom, targets 0.657/9
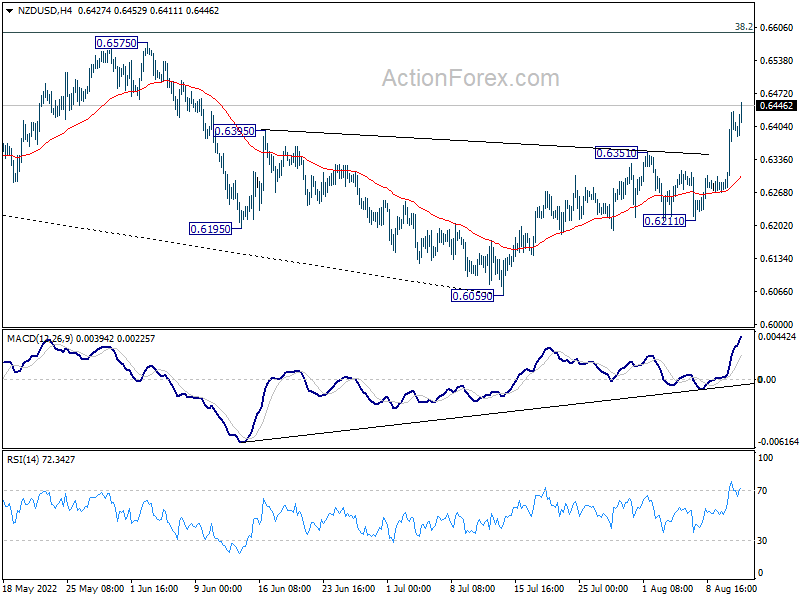
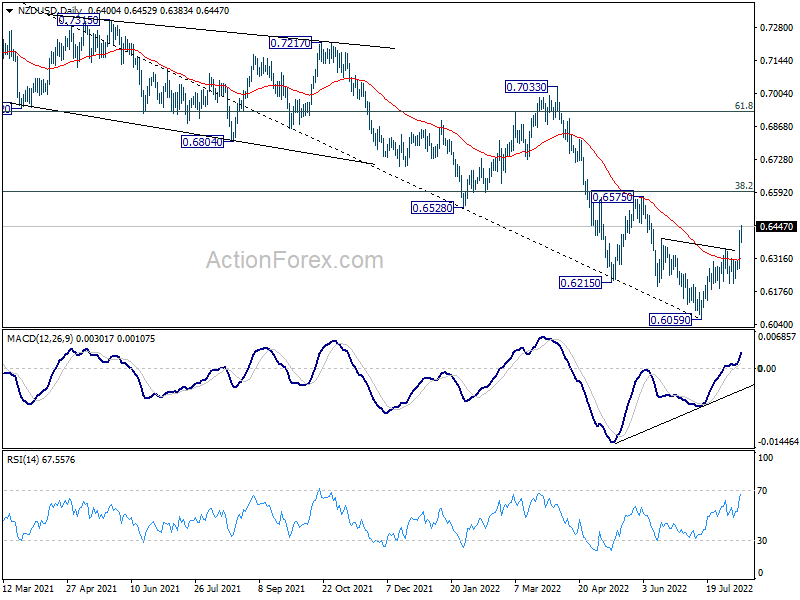
NZD/USD surges to as high as 0.6452 so far today and it's still in upside acceleration mode. This week's break of 0.6351 resistance completes a head and shoulder bottom pattern (ls: 0.6195, h: 0.6059, rs: 0.6211). The strong break of 55 day EMA, and bullish convergence condition in daily MACD are both bullish signs too.
Further rise is now expected as long as 0.6351 resistance turned support holds. Next target is 0.6575 cluster resistance zone (38.2% retracement of 0.7463 to 0.6059 at 0.6595). This is the major resistance zone for NZD/USD to overcome. Decisive break there will raise the chance of medium term bullish reversal. Meanwhile, rejection by 0.6575/95 will maintain medium term bearishness.
USD/JPY Mid-Day Outlook
Daily Pivots: (S1) 131.51; (P) 133.41; (R1) 134.79; More...
USD/JPY's recovery from 130.38 should have completed at 135.57 and fall from 139.37 is resume to resume. Intraday bias is back on the downside for 130.38 support first. Break there will target 100% projection of 139.37 to 130.38 from 135.57 at 126.58. As such decline is seen as a corrective move, strong support should be seen from 126.35 to contain downside. But for now, risk will remain on the downside as long as 135.57 resistance holds, in case of recovery.
In the bigger picture, fall from 139.37 medium term top is seen as correcting whole up trend from 101.18 (2020 low). While deeper decline cannot be ruled out, outlook will stays bullish as long as 55 week EMA (now at 121.84) holds. Long term up trend is expected to resume through 139.37 at a later stage, after the correction finishes.
Economic Indicators Update
| GMT | Ccy | Events | Actual | Forecast | Previous | Revised |
|---|---|---|---|---|---|---|
| 23:01 | GBP | RICS Housing Price Balance Jul | 63% | 60% | 65% | |
| 01:00 | AUD | Consumer Inflation Expectations Aug | 5.90% | 6.30% | ||
| 12:30 | USD | PPI M/M Jul | -0.50% | 0.20% | 1.10% | |
| 12:30 | USD | PPI Y/Y Jul | 9.80% | 10.40% | 11.30% | |
| 12:30 | USD | PPI Core M/M Jul | 0.20% | 0.40% | 0.40% | |
| 12:30 | USD | PPI Core Y/Y Jul | 7.60% | 7.60% | 8.20% | |
| 12:30 | USD | Initial Jobless Claims (Aug 5) | 262K | 265K | 260K | 248K |
| 14:30 | USD | Natural Gas Storage | 40B | 41B |
NZD/USD completed head and shoulder bottom, targets 0.657/9
NZD/USD surges to as high as 0.6452 so far today and it's still in upside acceleration mode. This week's break of 0.6351 resistance completes a head and shoulder bottom pattern (ls: 0.6195, h: 0.6059, rs: 0.6211). The strong break of 55 day EMA, and bullish convergence condition in daily MACD are both bullish signs too.
Further rise is now expected as long as 0.6351 resistance turned support holds. Next target is 0.6575 cluster resistance zone (38.2% retracement of 0.7463 to 0.6059 at 0.6595). This is the major resistance zone for NZD/USD to overcome. Decisive break there will raise the chance of medium term bullish reversal. Meanwhile, rejection by 0.6575/95 will maintain medium term bearishness.
US initial jobless claims rose 14k to 262k
US initial jobless claims rose 14k to 262k in the week ending August 6, slightly below expectation of 265k. Four-week moving average of initial claims rose 4.5k to 252k.
Continuing claims rose 8k to 1428k in the week ending July 30. Four-week moving average of continuing claims rose 24k to 1399k.
US PPI down -0.5% mom in Jul, slowed to 9.8% yoy
US PPI for final demand dropped -0.5% mom in July, versus expectation of 0.2% mom rise. The decrease is attributable to -1.8% mom decline in goods while services rose 0.1% mom. For the 12-months, PPI rose 9.8% yoy, slowed from June's 11.3% yoy.
Prices for final demand less foods, energy and trade services rose 0.2% mom. For the 12 months, PPI less foods, energy and trade services rose 5.8% yoy.
EURCHF Approaches SNB Flash Crash Low
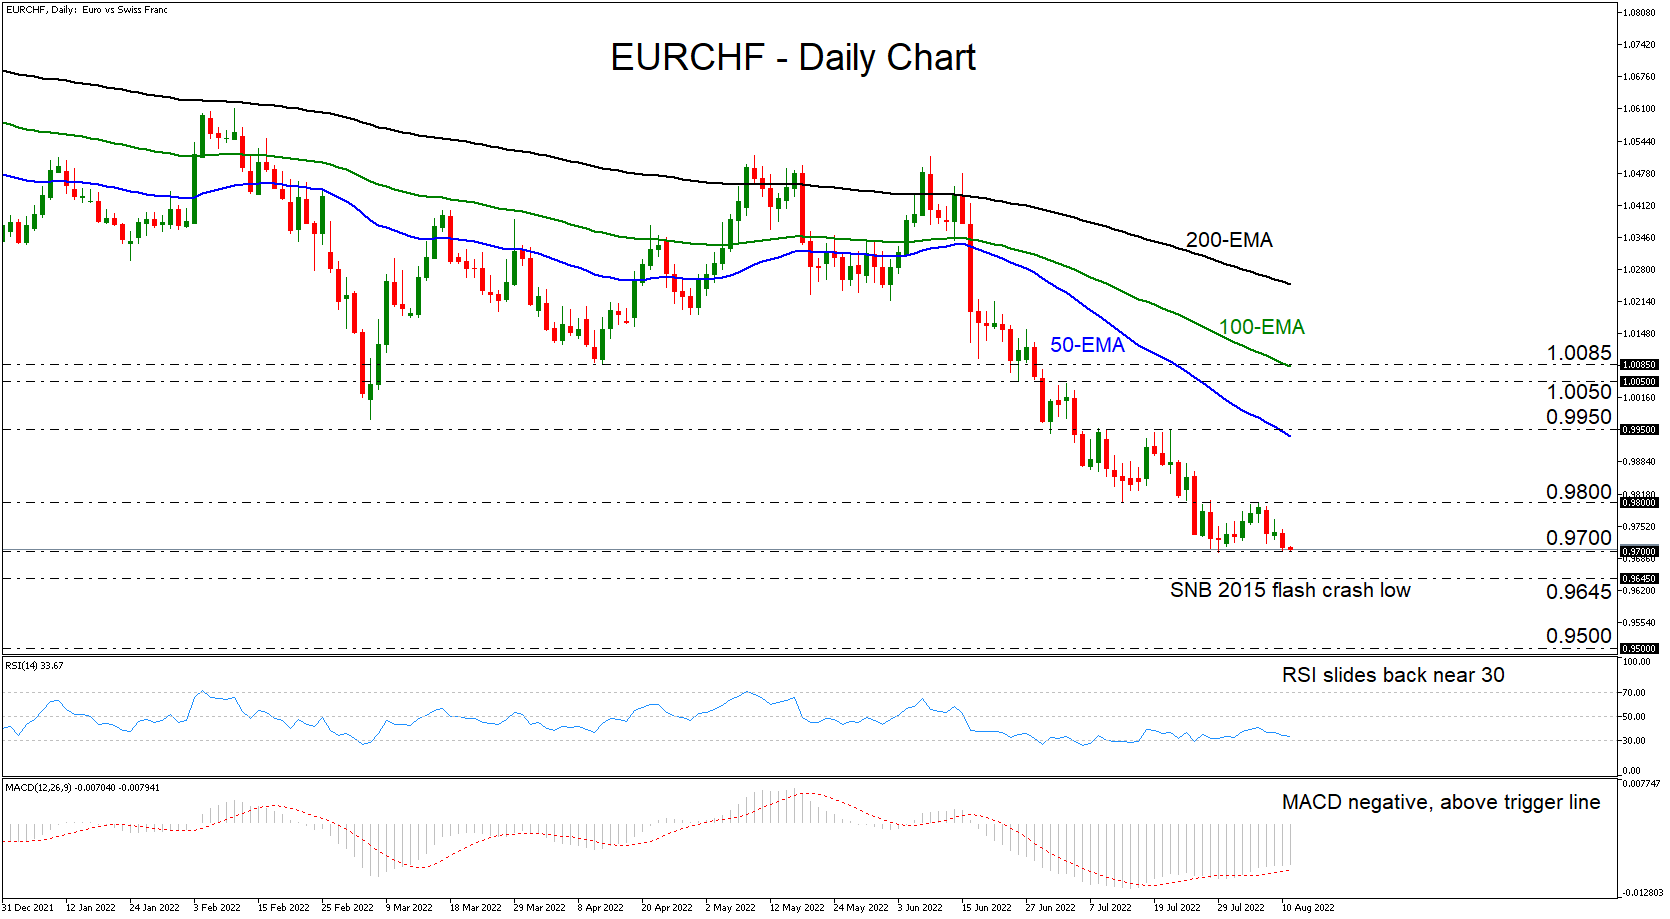
EURCHF entered a sliding mode this week, after hitting 0.9800, and is now hovering near the July 29 low, at 0.9700. Overall, the pair has been trading in a downtrend, staying below all three of the plotted moving averages, since mid-June.
The likelihood for further declines is enhanced by both the RSI and the MACD. The former has turned back down and is now approaching 30 again, while the latter remains well within its negative territory. That said, it lies above its trigger line, pointing up, which could imply another small bounce before an extension of the downtrend.
A break below 0.9700 would confirm a forthcoming lower low on the daily chart, allowing the pair to flirt with its all-time low at 0.9645, which was hit back in 2015 after the SNB removed the 1.20 floor, triggering a massive flash crash. Now, in case the bears do not stop there this time, they will enter uncharted territory, and the next support to consider may be the potentially psychological zone of 0.9500.
On the upside, the move confirming that the bulls have stolen all the bears’ swords – at least for a while – may be a recovery above 0.9800. This could signal the completion of a short-term double bottom and may initially allow advances towards the July 21 high, at 0.9950, near the 50 – exponential moving average (EMA). If there are no sellers to be found near that area either, the bulls could climb to the peak of July 4, at 1.0050.
To wrap up, EURCHF is getting closer to the 2015 flash crash low, where a break will take it into unseen grounds. That said, if the bulls decide to reenter the game and drive the action above 0.9800, a decent recovery may be possible.
BTCUSD Extends Advance, Eyeing $25,000 Mark
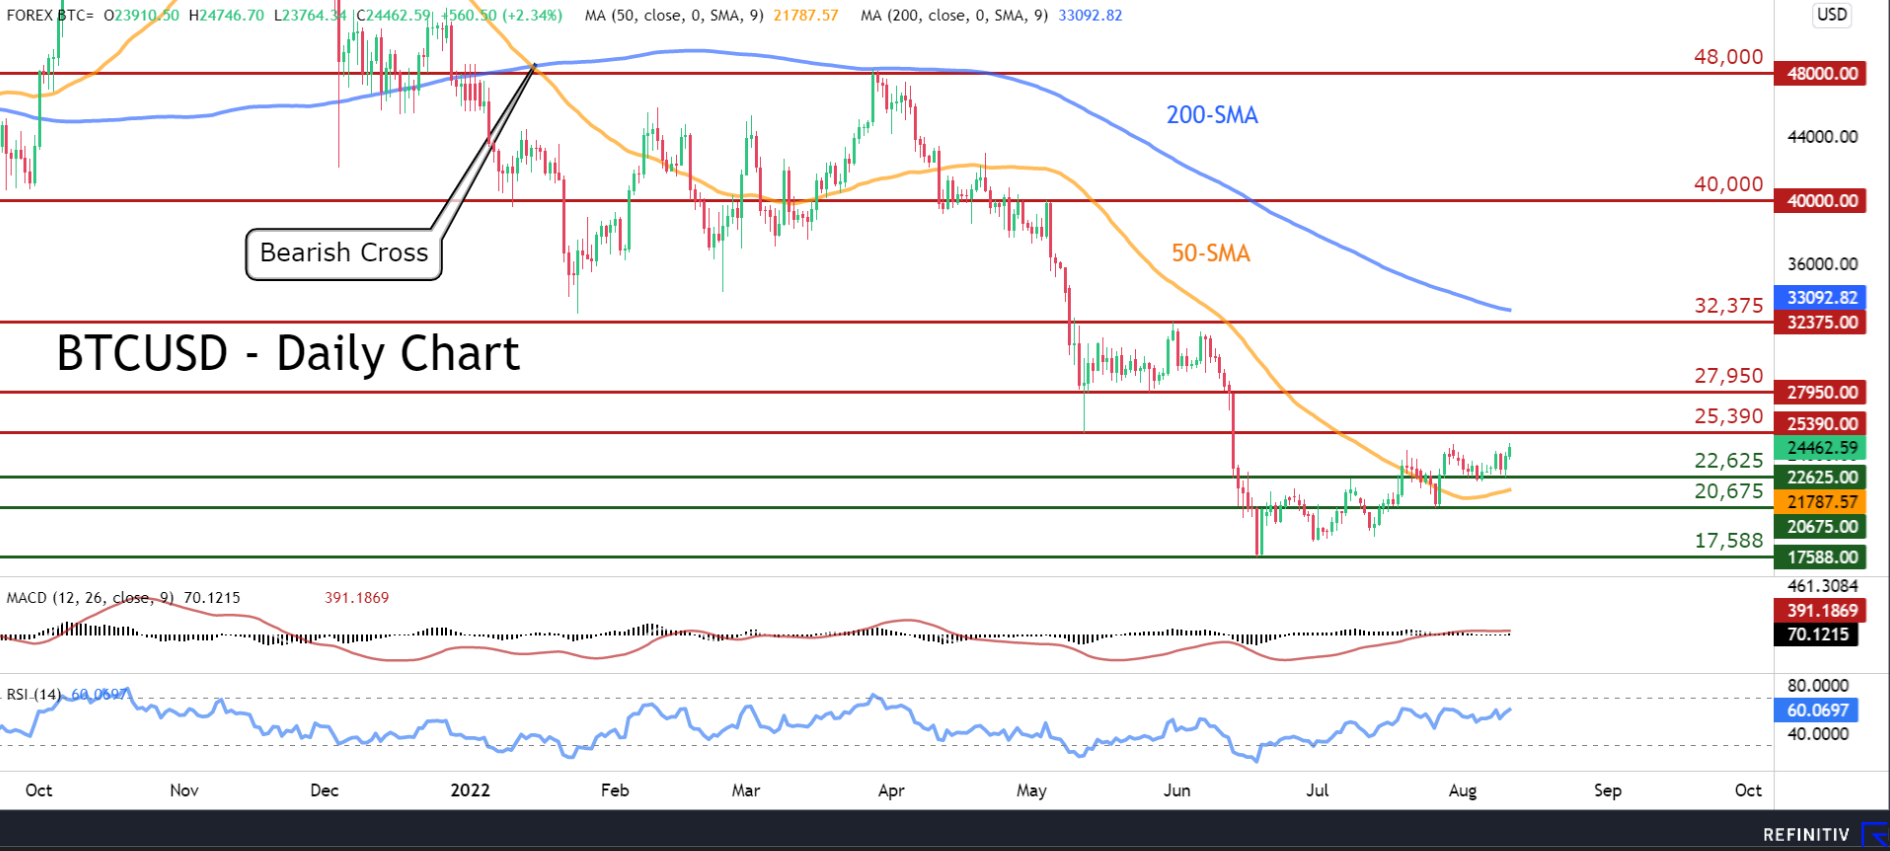
BTCUSD has been in a steady uptrend since it managed to halt its long-term decline at the 2022 low of 17,588. Even though the price is currently standing above its 50-day simple moving average (SMA), endorsing a bullish short-term picture, the road to a complete recovery remains long.
The short-term oscillators suggest a cautiously positive tone. Specifically, the MACD histogram is positive but below its red signal line, while the RSI is sloping upwards above its 50-neutral mark.
Should buyers propel the price higher, the May low of 25,390 could prove to be the first resistance point. Jumping above this zone, the bulls could aim for 27,950 before the spotlight turns to the 32,375 peak. Failing to stop there, the 40,000 psychological mark may halt any further upside moves.
On the flipside, if positive momentum wanes and the price declines, the recent low of 22,625 might act as the first line of defence. Sliding beneath that floor, the price could challenge the 20,675 obstacle. A violation of the latter could open the door for the 19-month low of 17,588.
Overall, Bitcoin is attempting a recovery, but its long-term bearish picture remains intact. Hence, a jump above the 32,375 region is required to initially shift its medium-term outlook to bullish.