Sample Category Title
UK Economy Slows Slightly Less than Expected
The UK monthly statistics package showed that the economy lost 0.1% in the second quarter (0.2% expected), and the annual growth rate collapsed from 8.7% to 2.9% (2.8% expected). For the month, the decline was 0.6%, half the forecasts.
A similar “better than might have been” is evident in the other indicators released today. Industrial production fell 0.9% against an expected 1.3% and left something from the last month’s gain. Construction dipped 1.4%, against a forecasted 2.0%. The service sector lost 0.4% of its volume, the first contraction since last March.
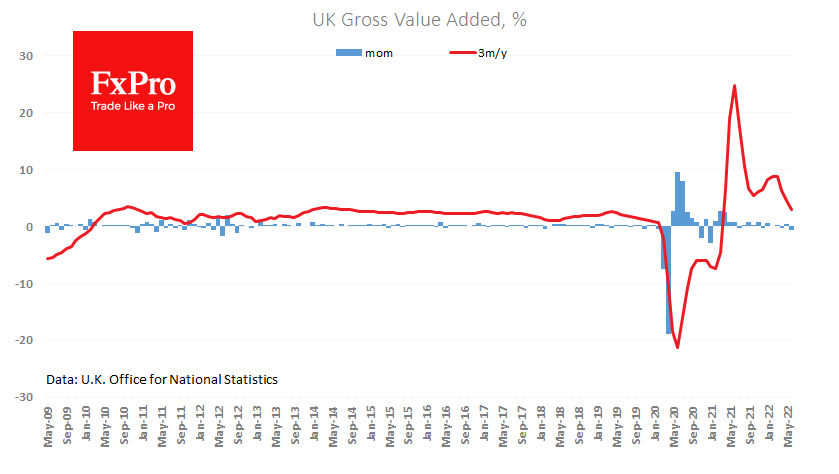
While this data is better than forecast, it is unlikely to inspire buyers of the pound or investors in the stock market. We see more market sensitivity to price data than the economy.
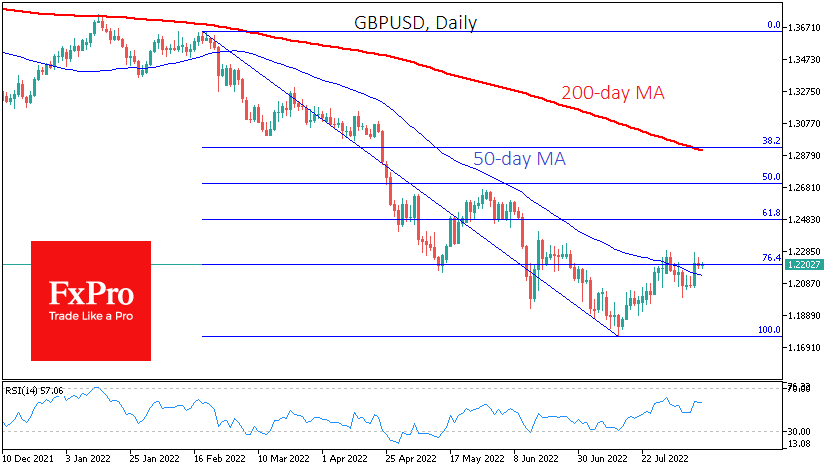
The GBPUSD is now struggling with downtrend resistance in the form of the 50-day moving average, trying to consolidate higher. On Wednesday, it formally succeeded, but the pound failed to develop the offensive, which might be the first worrying signal that the bears retain control of the markets.
Whether GBPUSD closes the day above 1.22 or below that mark may determine next week’s performance. An ability to stay near or rewrite the local highs would be a bullish signal, sending the sterling further into the 1.25-1.2650 range.
A close on a weak note or a move under 1.2140 would indicate that the recent rebound was only a temporary correction as part of a long-term downtrend. And in this case, GBPUSD could head down with an intermediate target below 1.2000 and a potential next target around 1.1800.
USDCAD Plummets But 200-Day SMA Caps Downside
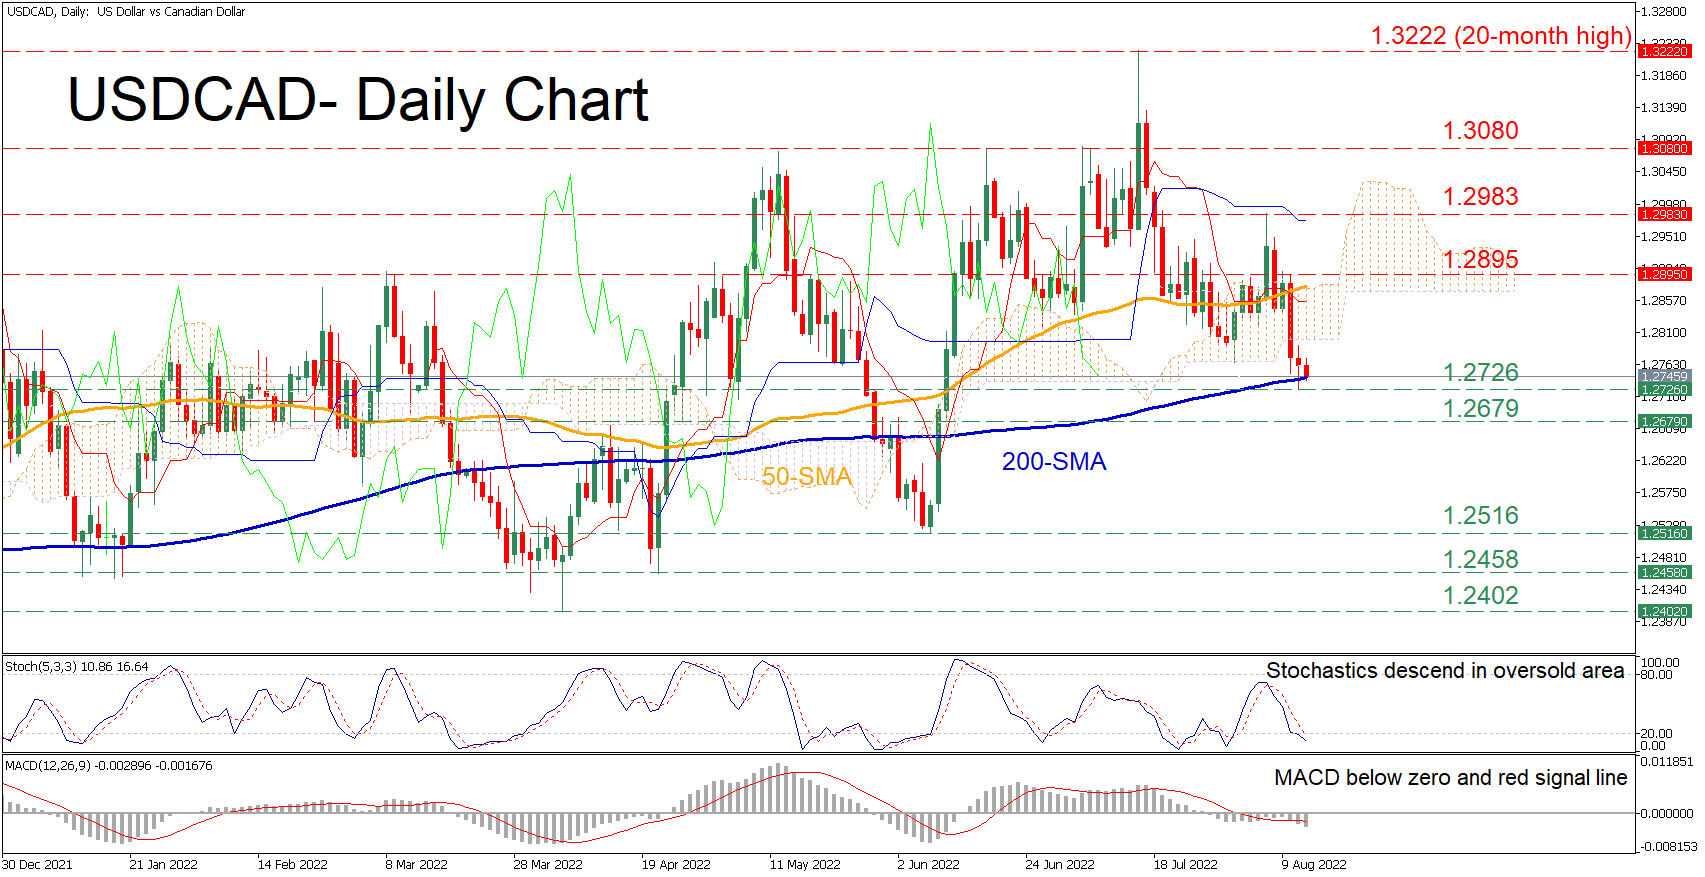
USDCAD has been losing ground in the short term since it peaked at the 20-month high of 1.3222 in mid-July. Moreover, in the last few sessions, the technical picture has deteriorated further, with the price crossing below both its 50-day simple moving average (SMA) and the Ichimoku cloud.
The momentum indicators are reflecting that the latest downside move could resume as near-term risks are tilted to the downside. Specifically, the stochastic oscillator is sloping downwards in the 20-oversold zone, while the MACD histogram is currently beneath both zero and its red signal line.
To the downside, should the price dive below crucial 200-day SMA, immediate support could be encountered at the recent low of 1.2726. Sliding beneath that floor, the 1.2679 barrier may come under examination before the pair challenges the June low of 1.2516. Any further price declines could then cease at the 1.2458 hurdle.
Alternatively, bullish actions might meet initial resistance at the 1.2895 region. Conquering this barricade, the bulls could aim for the recent peak of 1.2983. Failing to stop there, the price could ascend towards 1.3080 or higher to test the 20-month high of 1.3222.
In brief, even though USDCAD has been experiencing a sharp decline, the 200-day SMA appears to be acting as a strong floor. Hence, a violation of the latter could accelerate the downfall.
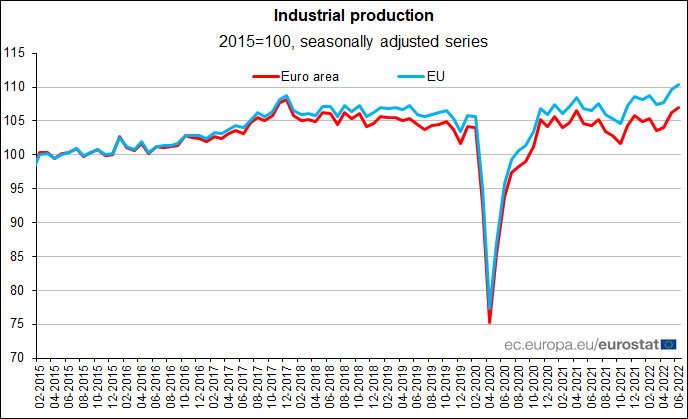
Eurozone industrial production rose 0.7% mom in June, EU up 0.6% mom
Eurozone industrial production rose 0.7% mom in June, above expectation of 0.0% mom. Production of capital goods rose by 2.6% mom and energy by 0.6% mom, while production of intermediate goods fell by -0.1% mom, durable consumer goods by -0.6% mom and non-durable consumer goods by -3.2% mom.
EU industrial production rose 0.6% mom. Among Member States for which data are available, the highest monthly increases were registered in Ireland (+6.7%), Malta (+4.8%) and Greece (+3.4%). The largest decreases were observed in Romania (-3.9%), Belgium (-2.2%), Italy and Latvia (both -2.1%).
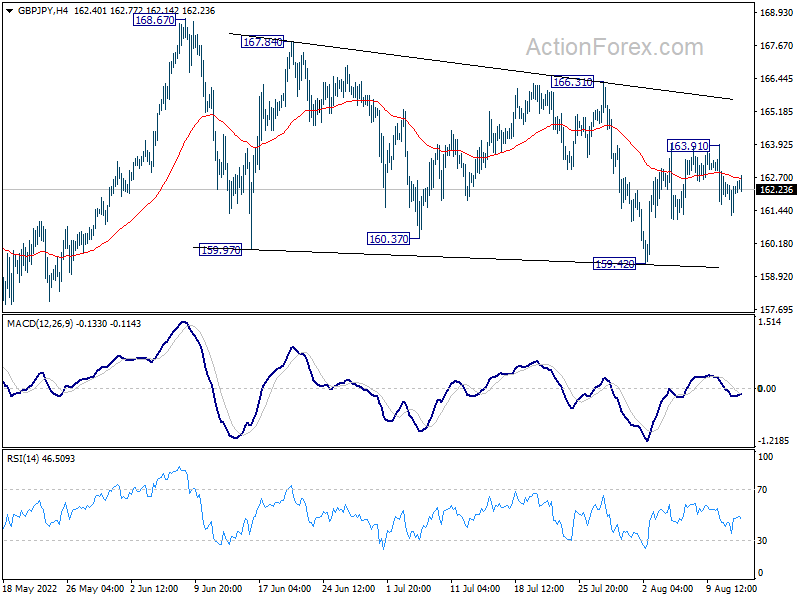
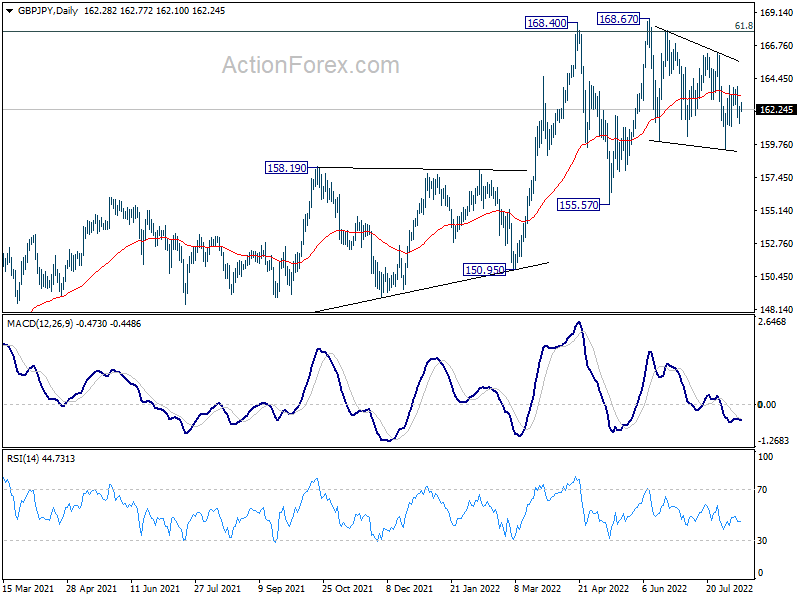
GBP/JPY Daily Outlook
Daily Pivots: (S1) 161.50; (P) 162.01; (R1) 162.76; More...
Intraday bias in GBP/JPY stays neutral, and consolidation from pattern from 168.67 could extend further. On the upside, above 163.97 will turn bias to the upside, and resume the rebound to 166.31 resistance. Break there will be the first sign of up trend resumption. On the downside, break of 159.42 will extend the correction towards 155.57 support.
In the bigger picture, up trend from 123.94 (2020 low) is still in progress. Sustained break of 61.8% retracement of 195.86 (2015 high) to 122.75 (2016 low) at 167.93 will be a long term bullish signal, and could pave the way back to 195.86 high. This will remain the favored case as long as 155.57 support holds, even in case of deep pull back.
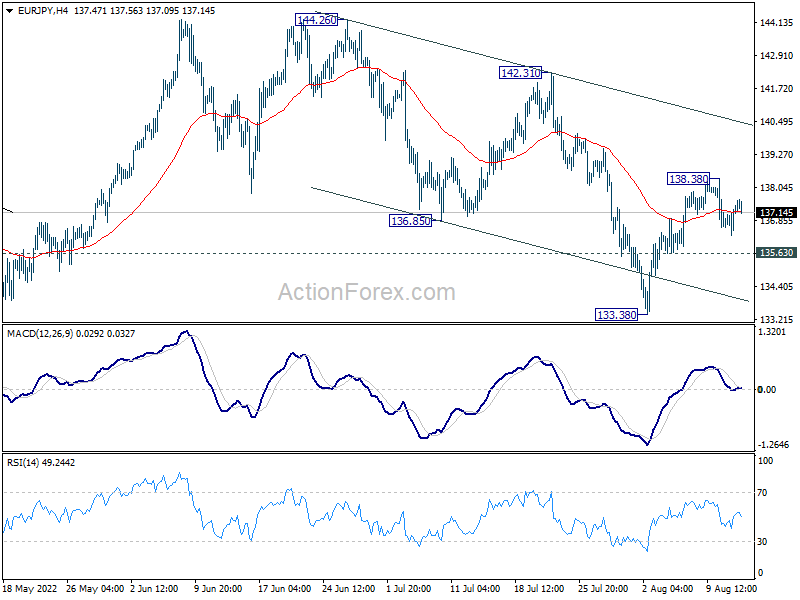
EUR/JPY Daily Outlook
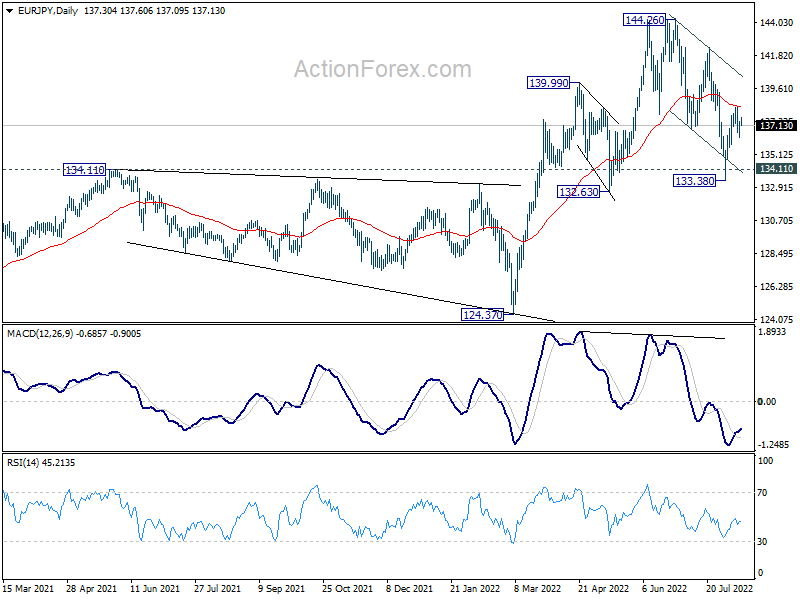
Daily Pivots: (S1) 136.60; (P) 137.00; (R1) 137.70; More....
Intraday bias in EUR/JPY remains neutral for the moment. On the upside, break of 138.38, and sustained trading above 55 day EMA (now at 138.44) will suggest that whole correction from 144.26 has completed. Further rally would then be seen back to retest 144.26 high. However, break of 135.63 will turn bias back to the downside for 133.38 low instead.
In the bigger picture, up trend from 114.42 (2020 low) is seen as the third leg of the pattern from 109.30 (2016 low). Further rally is in favor as long as 134.11 resistance turned support holds, even in case of deep pull back. Next target is 149.76 (2015 high). However, sustained break of 134.11 will be a sign of medium term bearish reversal and turn focus to 124.37 support for confirmation.
EUR/GBP Daily Outlook
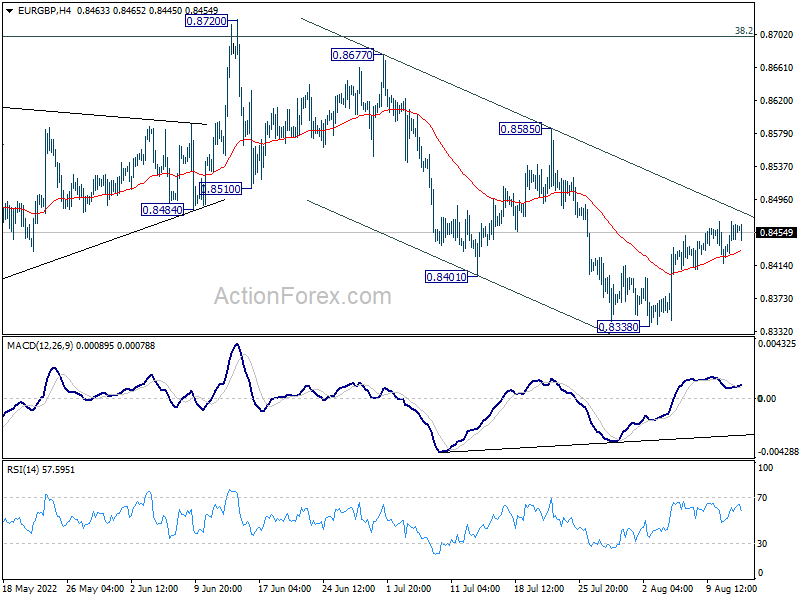
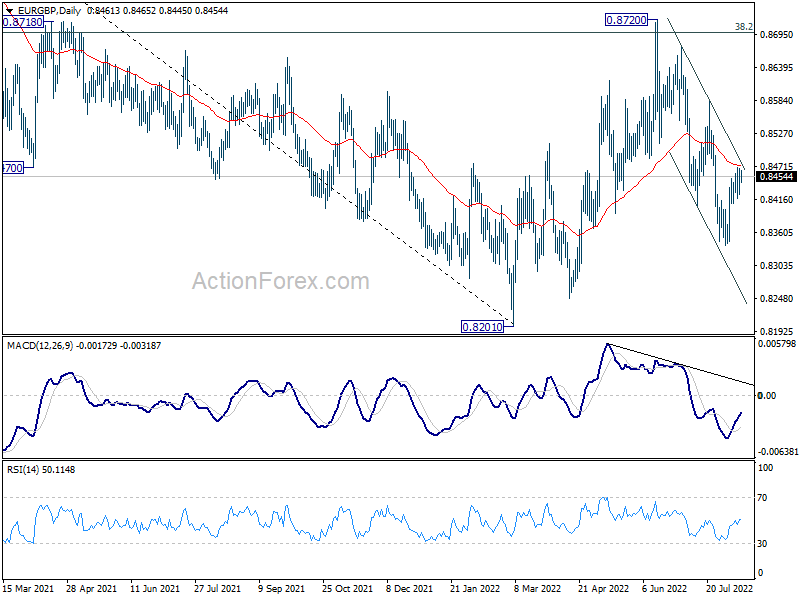
Daily Pivots: (S1) 0.8437; (P) 0.8454; (R1) 0.8479; More...
Intraday bias in EUR/GBP remains neutral at this point. Outlook stays bearish with 0.8585 resistance intact. Fall from 0.8720 is expected to resume sooner or later. Break of 0.8338 will turn bias to back to the downside for retesting 0.8201 low.
In the bigger picture, current development suggests rejection by 38.2% retracement of 0.9499 to 0.8201 at 0.8697. Medium term bearishness is maintained. Break of 0.8201 will resume larger down trend from 0.9499 (2020 high). Nevertheless, sustained break of 0.8697 will affirm the case that rise from 0.8201 is a medium term up trend itself.
EUR/AUD Daily Outlook
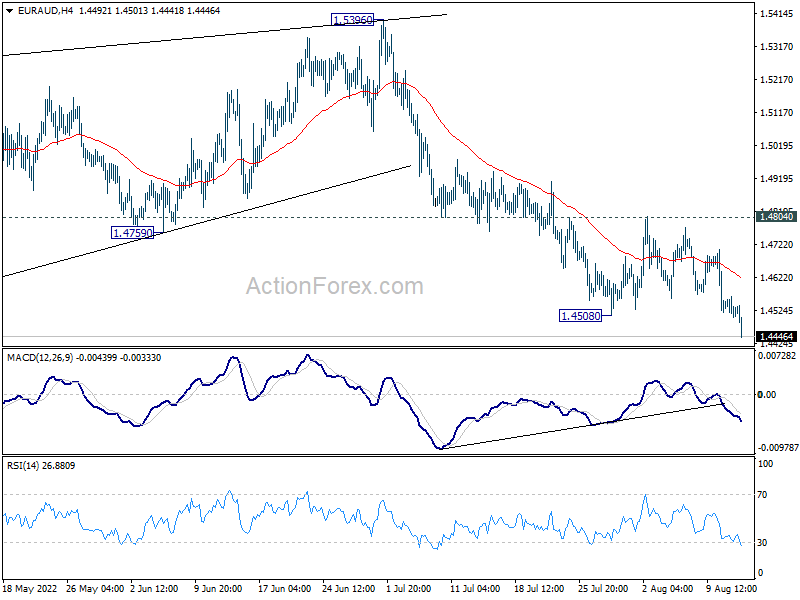
Daily Pivots: (S1) 1.4498; (P) 1.4534; (R1) 1.4562; More...
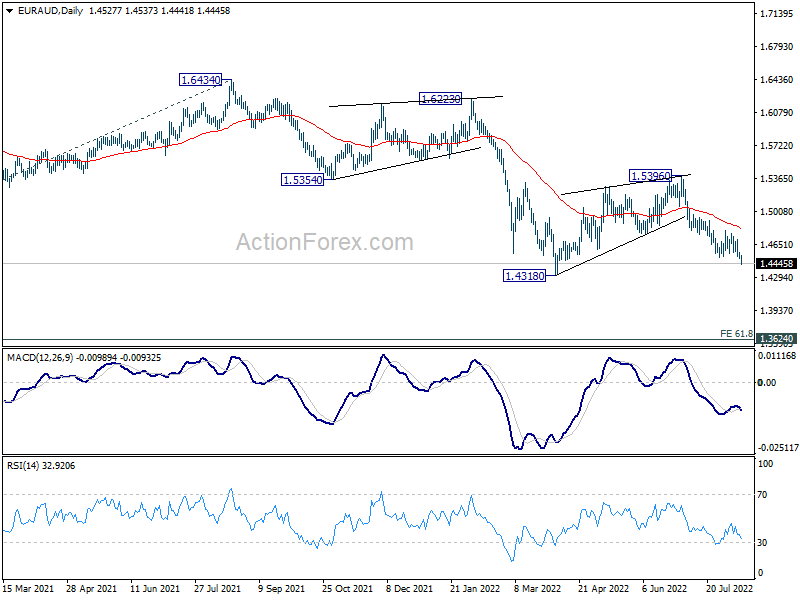
EUR/AUD's fall from 1.5396 resumes by breaking through 1.4508 support. Intraday bias is back on the downside for retesting 1.4318 low. Decisive break there will resume larger down trend. On the upside, break of 1.4804 resistance is needed to indicate short term bottoming. Otherwise, risk will stay on the downside in case of recovery.
In the bigger picture, down trend from 1.9799 is still in progress. Break of 1.4318 low will target 61.8% projection of 1.9799 to 1.5250 from 1.6434 at 1.3623, which is close to 1.3624 long term support (2017 low). This will remain the favored case now as long as 1.5396 resistance holds.
EUR/CHF Daily Outlook
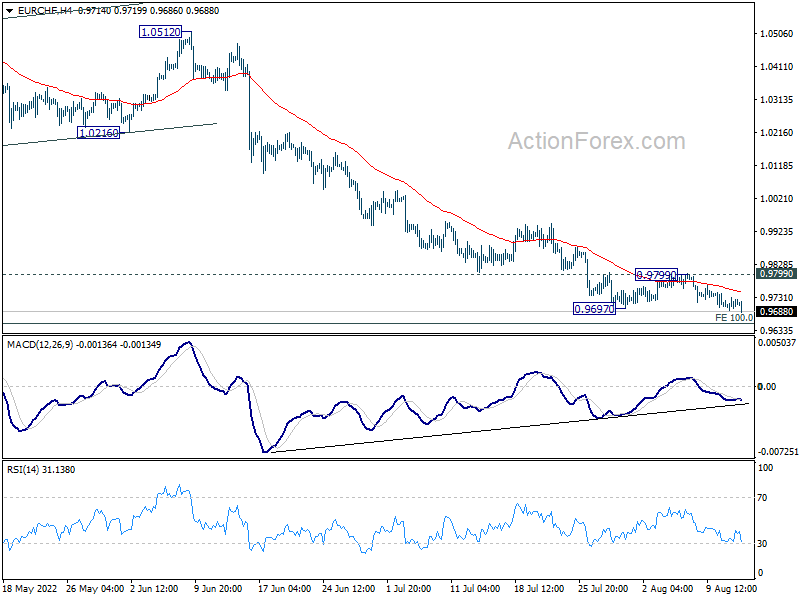
Daily Pivots: (S1) 0.9697; (P) 0.9715; (R1) 0.9734; More....
EUR/CHF's down trend resumes by breaking through 0.9697 support. Intraday bias is back on the downside for 0.9650 long term projection level. Some support could be seen there to bring rebound. But break of 0.9799 resistance is needed to signal short term bottoming. Otherwise, further decline will remain in favor. Firm break of 0.9650 will target 100% projection of 1.1149 to 0.9970 from 1.0513 at 0.9334.
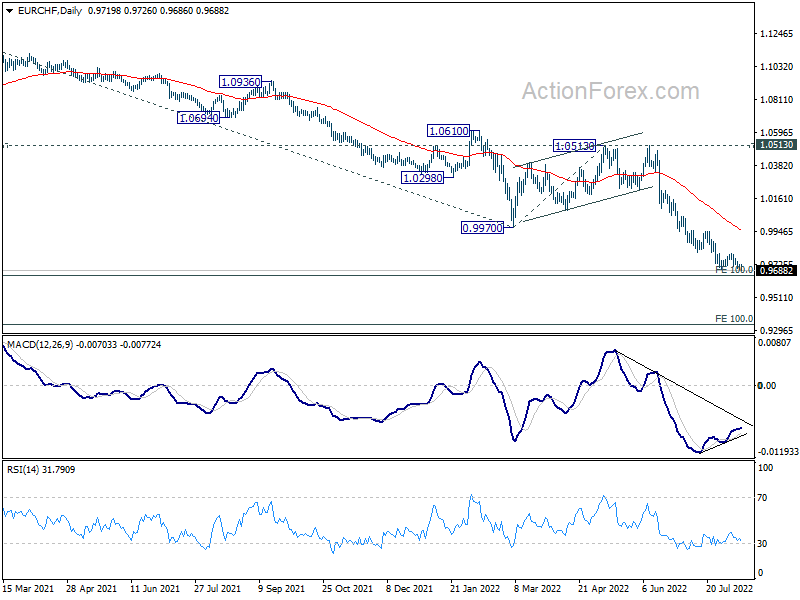
In the bigger picture, long term down trend from 1.2004 (2018 high) is expected to target 100% projection of 1.2004 to 1.0505 to 1.1149 at 0.9650. Firm break there will target 138.2% projection at 0.9033. On the upside, break of 0.9799 support turned resistance is needed to be the first sign of medium term bottoming. Otherwise, outlook will stay bearish in case of strong rebound.
Weekly Gains, China, UK GDP, Oil, Gold, Bitcoin
It's been another very good week for equity markets, extending the run to four weeks in many cases as investors become more optimistic about the economic outlook.
This week has been all about the inflation data and, frankly, it could be the dominant force in the markets now right up until the Jackson Hole symposium. The fact that inflation not only decelerated in the US but at a faster pace than the consensus forecasts was a double win and risk assets are feeling the benefit.
Of course, it doesn't take much of a dive into the data to see that fuel prices are having a considerable impact, favourably for once. This isn't something that's going to sway the Fed at all even if it will ease the burden on the economy a little. The Fed will need to see broader signs of inflationary pressures softening to ease off the brake into year-end.
It is worth highlighting also the apparent disconnect between the equity and bond markets. Equity markets give the impression that all is not as bad as it seemed - the Dow is less than 10% from its all-time highs - while the bond market has recession signals flashing red. The 2-10 inversion is not only apparent but this week it's the most inverted it's been in more than 20 years. How long can investors ignore that?
China underperforms amid higher Covid cases
We've seen broad, albeit relatively small, gains across Asia overnight with the Shanghai Composite underperforming. It may be that the country's zero-Covid policy is continuing to hold it back, with China reporting a slight uptick in cases including a small number in Shanghai which could be making investors a little nervous.
The policy remains a constant downside risk for the economy which is facing other headwinds at the same time and the leadership appears unusually at ease with missing its annual growth target. All of which makes any prospect of further monetary easing unlikely in the near-term, with the PBOC highlighting this week its caution despite the inflation data surprising to the downside.
Not so bad data as good as it gets for the UK
It's not going to be fun to watch the UK economic data over the coming months and the misery looks to have started early, with GDP numbers this morning reporting a slight contraction in the second quarter - albeit a slightly smaller one than forecast - following a 0.6% decline in June which was also better than the consensus. So basically, it's bad but not as bad as feared and that may be as good as it gets for a while. Naturally, as you can see by the reaction in the pound, no one is in the mood to celebrate that.
The 0.2% reduction in real household consumption will only get worse as we move into the winter, with energy prices set to soar again by a staggering amount. I'd provide the latest estimate of what the increase will be but by the time I send this out, it will probably have risen again. As households tighten the purse strings this winter, consumption will likely fall a lot more bringing about the recession the BoE has long feared and now doubled down on.
Brent eyes $100 after mixed headline week
The oil market has bounced back this week, with Brent once more flirting with triple-figures. There's been a lot to digest this week, with Iran nuclear talks ongoing, US inventories rising, US output also rising, the Druzhba pipeline saga and the various forecasts.
Even the forecasts themselves offered contrasting views, with OPEC downgrading demand growth and expecting the oil market to tip into surplus this quarter. The IEA, meanwhile, anticipates stronger demand growth due in part to the gas to oil switch as some countries react to sky-high prices.
All things considered, the price moves highlight just how tight the market remains and how sensitive it therefore still is to spikes. A deal between the US and Iran could go some way to changing that but I think it's clear traders are not banking on that given how the talks have gone until this point.
A compelling bullish case for gold
Gold is holding onto gains despite struggling to capture $1,800. The yellow metal briefly traded above here after the inflation data but it seems traders quickly changed their minds, with risk assets instead being favoured. The fact that it continues to hold onto the bulk of the gains without any significant correction may suggest there's still an appetite for it, with slower tightening seen as a favourable outcome.
This will be an interesting test for gold as $1,800 could represent an interesting rotation point from a technical perspective if there is no desire to see it above here but ultimately the case for bullish gold remains quite compelling.
Bitcoin struggling for momentum
It's shaping up to be a relatively calm end to the week and that may not be good news for bitcoin in the short term as it may encourage some profit-taking into the weekend. It's off around 1% today and back below $24,000 at the time of writing. What's interesting about bitcoin at these levels is how little momentum there is in the rallies, which is going to make $25,000 very difficult to overcome. Is that a sign that we're seeing some profit-taking or that the correction has run its course and further downside pressure is on the horizon?
GBPJPY Battling to Keep its Feet Above Trendline
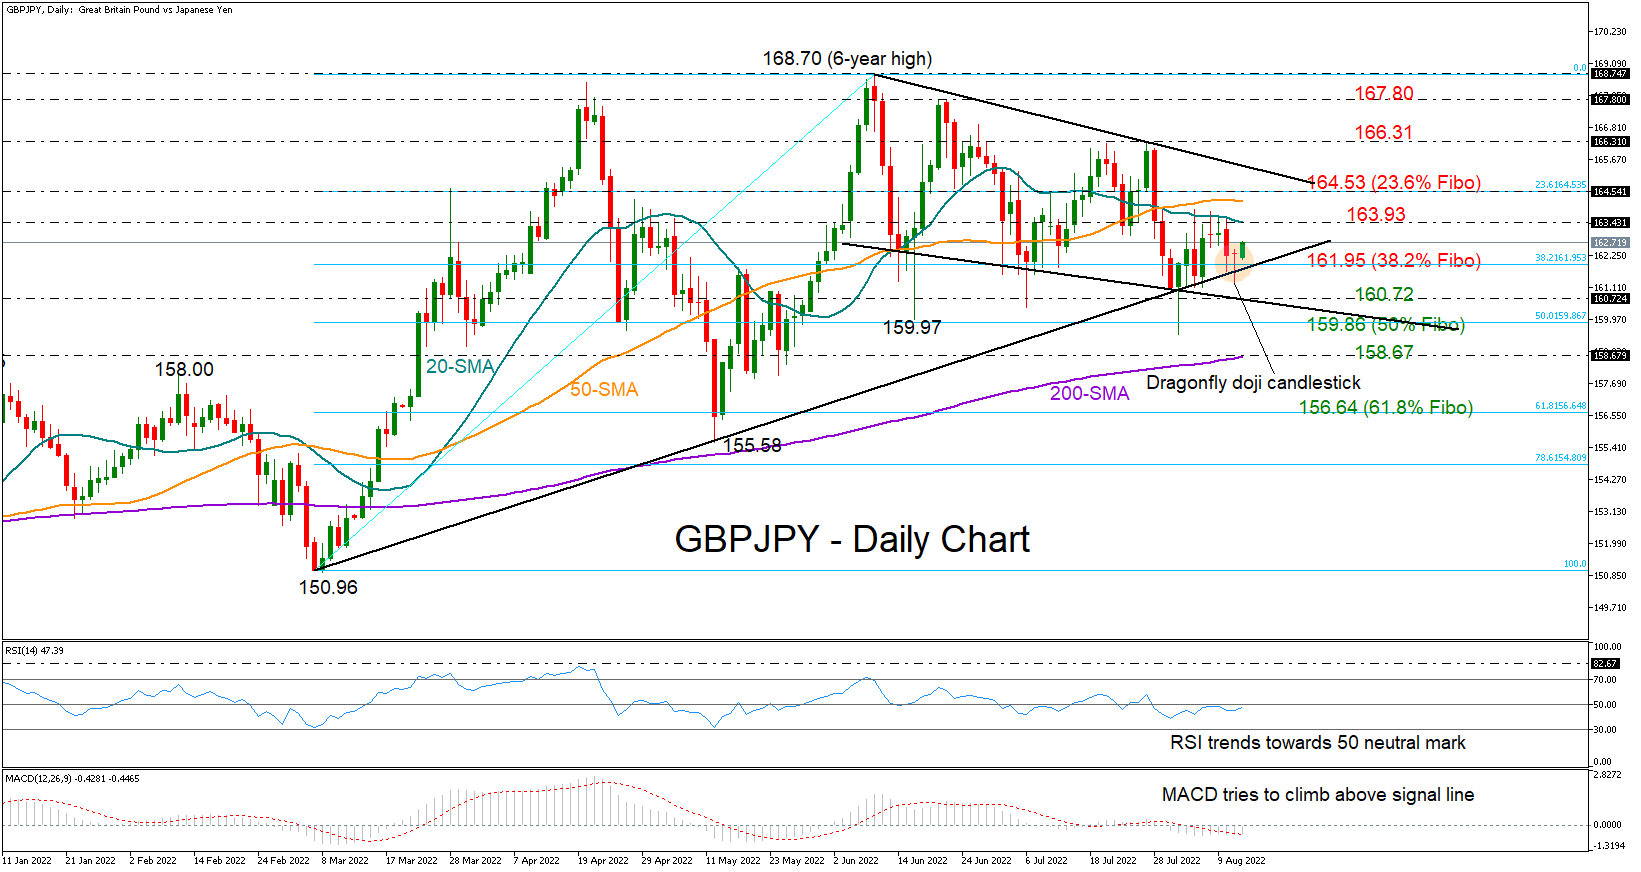
GBPJPY came under renewed selling pressure on Thursday but encouragingly it quickly managed to recover its flash drop to 161.26, closing neutral above the ascending trendline once again.
In addition to the above, Thursday’s candlestick reminds of a bullish dragonfly doji candlestick, which is a signal of a possible upside reversal, though whether the price will proceed higher on the following candlestick will confirm the appetite for more buying.
For now, the technical oscillators are displaying some improvement in market sentiment as the RSI keeps trending up, and the MACD is trying to climb above its red signal line in the negative area. Yet, as long as the former remains below 50, some caution is warranted.
If the price was to pick up steam, the 20-day simple moving average (SMA) could resume its resistance role at 163.43. If not, the next obstacle could pop up somewhere between the 50-day SMA and the 61.8% Fibonacci retracement of the 150.96 – 168.70 upleg at 164.53, while a decisive break above the descending trendline at 165.33 could be a bigger achievement. In the event the bulls climb that wall, traders will look for a close above the previous high of 166.31 to shift attention towards the April-June ceiling of 167.80 – 168.70.
On the downside, a durable move below the trendline and the 38.2% Fibonacci of 161.95 could initially push for a close below the support line seen at 160.72. Should the bears snap that bar, the spotlight will turn to the 50% Fibonacci of 159.86, while lower, the 200-day SMA at 158.67 could be the next target.
Summarizing, GBPJPY maintains some buying interest despite its recent consolidation. An extension above 163.43 could be the trigger for more upside.