

Sample Category Title
Technical Outlook and Review
DXY:
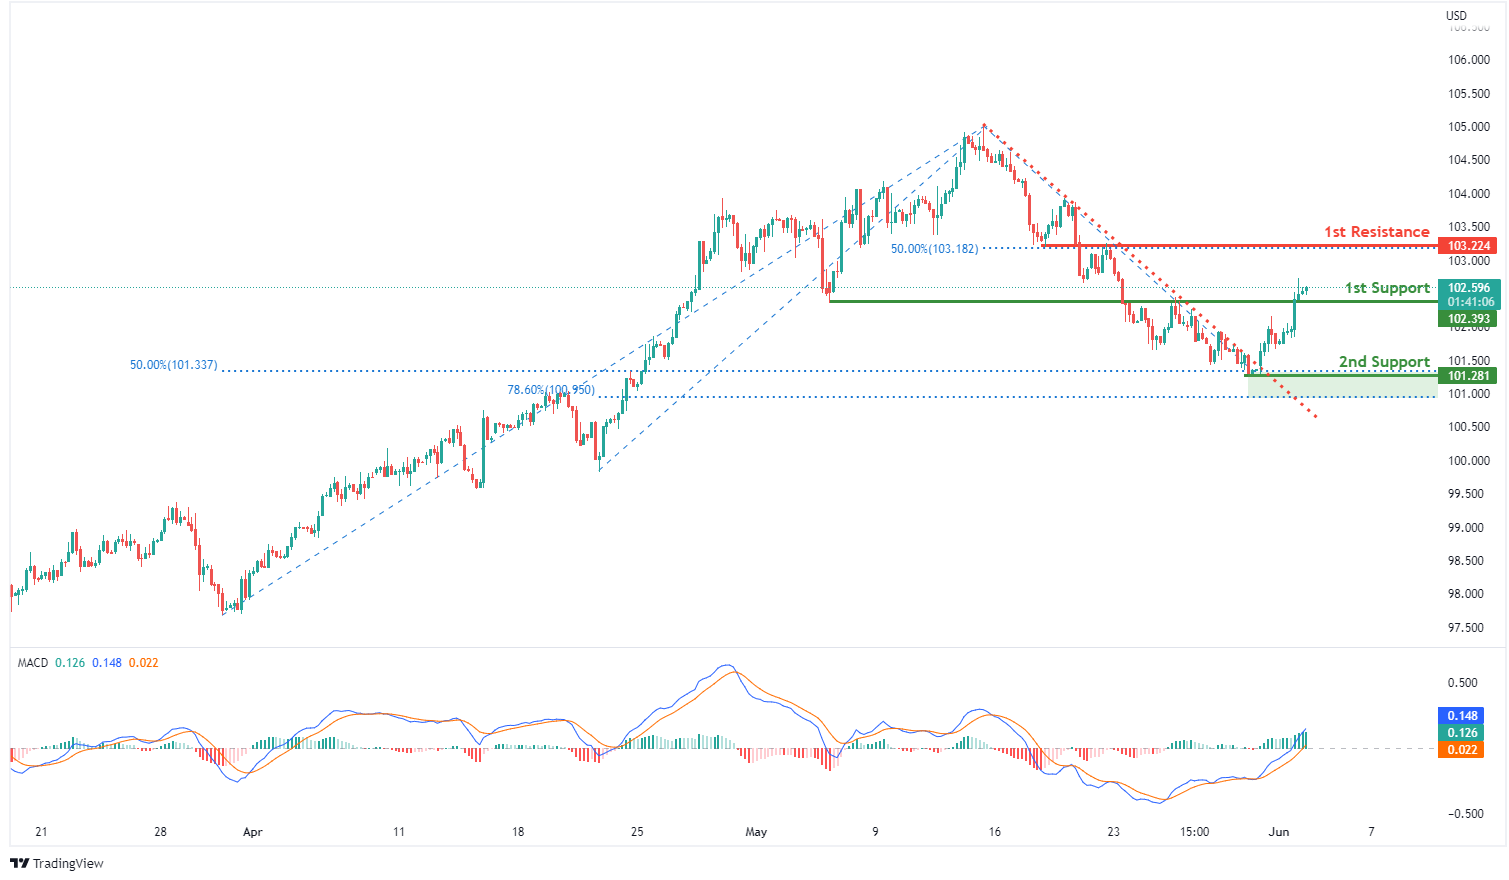
On the H4, with MACD moving in a bullish momentum and breakout from the descending trendline, we have a bullish bias that price will rise to our 1st resistance at 103.224 where the horizontal overlap resistance and 50% fibonacci retracement are from our 1st support at 102.393 in line with the horizontal overlap support is. Alternatively, price may break 1st support structure and head for 2nd support at 101.281 where the horizontal swing low, 50% fibonacci retracement and 78.6% fibonacci retracement are.
Areas of consideration:
- H4 time frame, 1st resistance at 103.224
- H4 time frame, 1st support at 102.393
XAU/USD (GOLD):
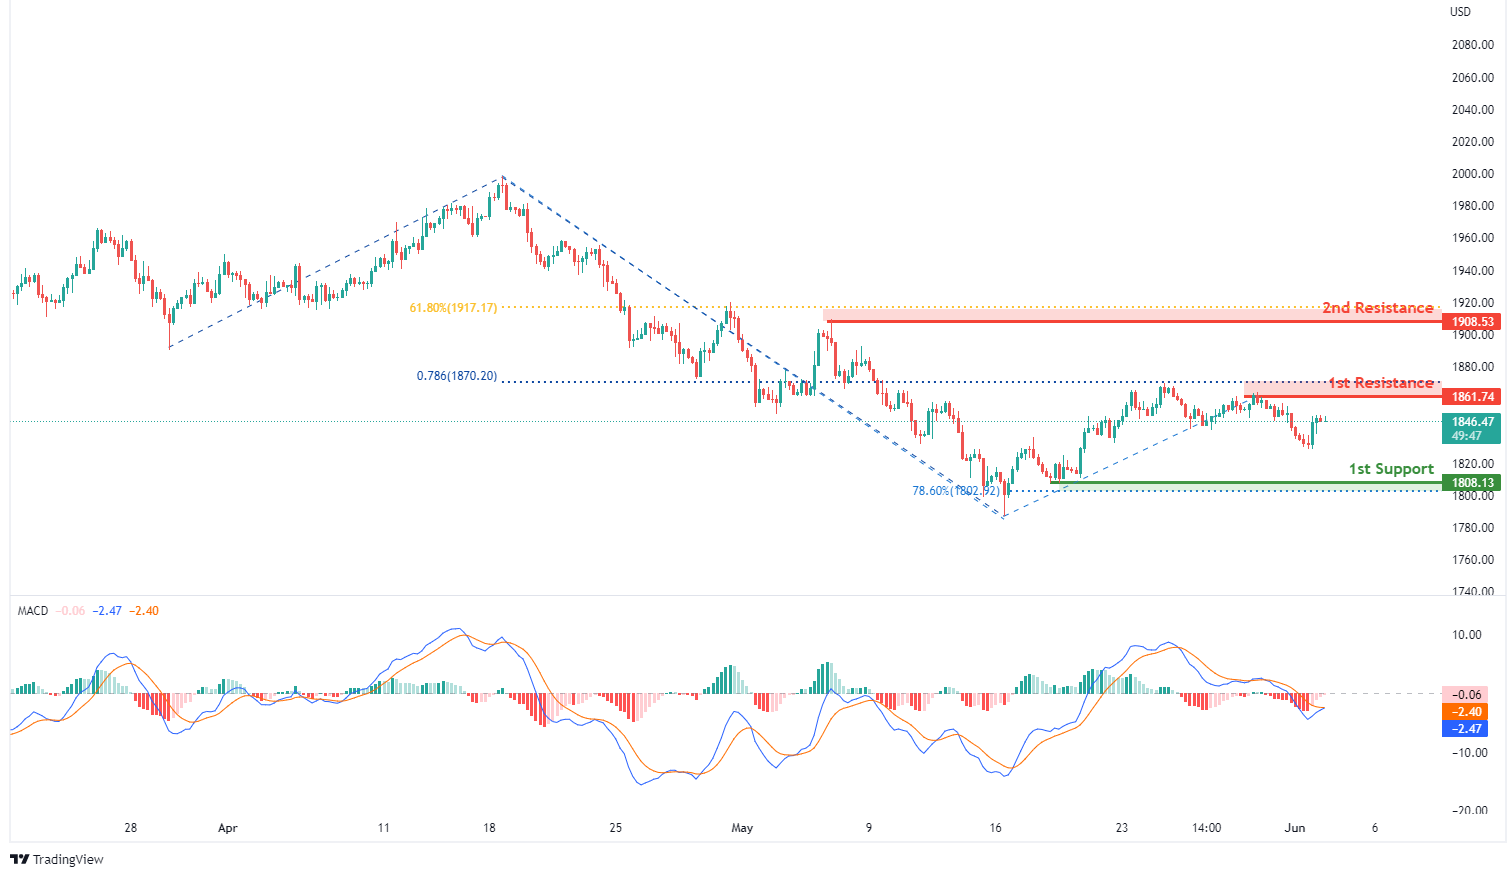
On the H4, with MACD moving in a bearish momentum, we have a bearish bias that price will drop from our 1st resistance at 1861.74 where the horizontal swing high resistance and 78.6% fibonacci projection to our 1st support at 1808.13 in line with the horizontal swing low support and 78.6% Fibonacci retracement. Alternatively, price may break 1st resistance structure and head for 2nd resistance at 1908.53 where the horizontal swing high resistance and 61.8% fibonacci retracement are.
Areas of consideration:
- H4 time frame, 1st Resistance at 1861.74
- H4 time frame, 1st Support at 1808.13
GBP/USD:
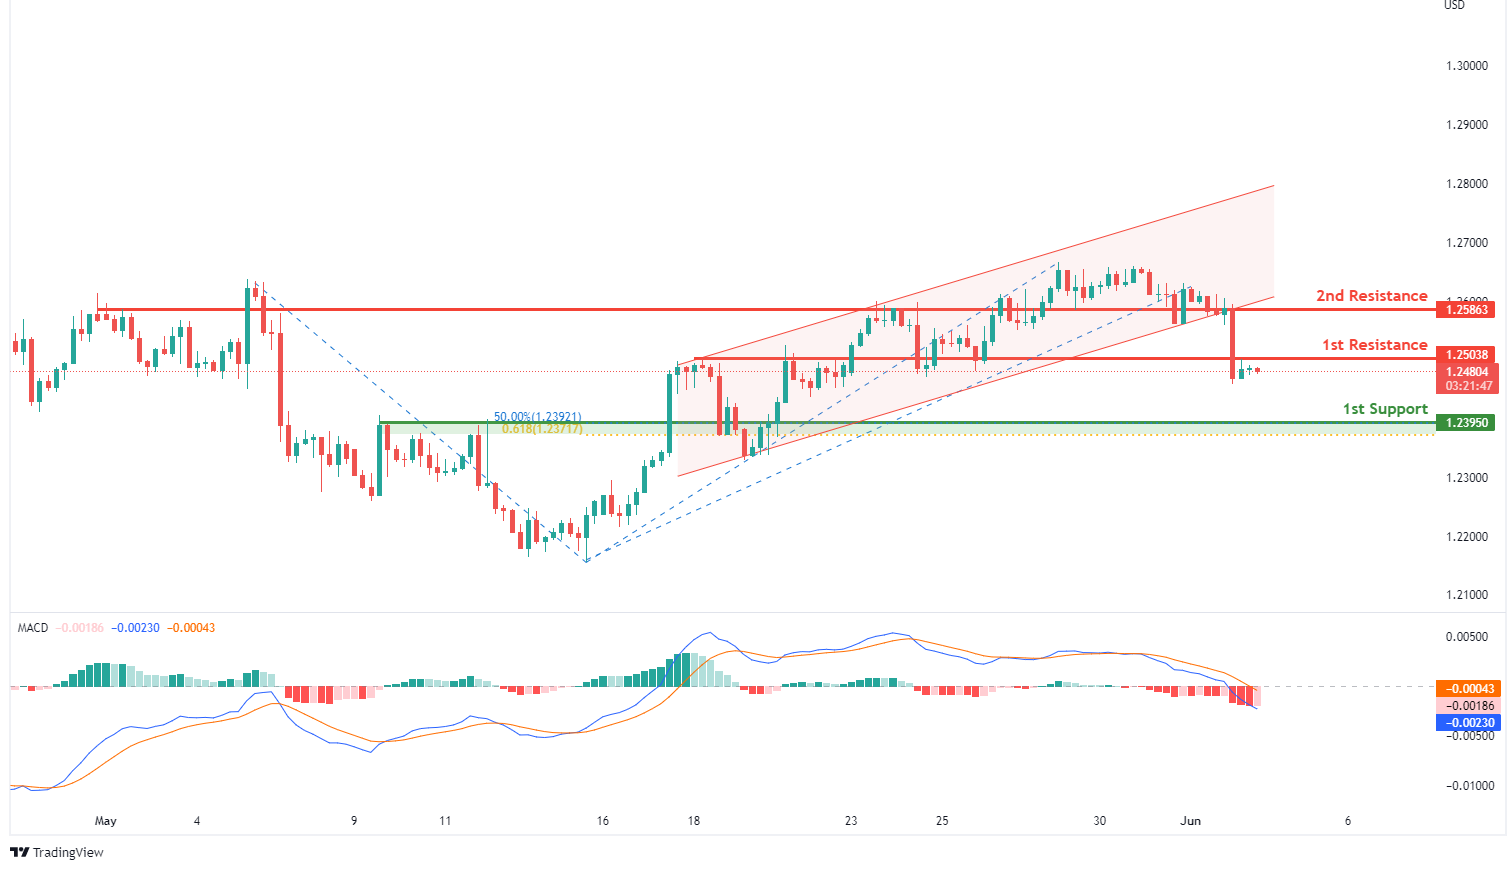
On the H4, with MACD moving in bearish momentum and price breakout from ascending channel, we have a bearish bias that price will drop from our 1st resistance at 1.25038 where the horizontal overlap resistance is to our 1st support at 1.23950 in line with the 61.8% Fibonacci projection, 50% Fibonacci retracement and overlap support. Alternatively, price may break 1st resistance structure and head for 2nd resistance at 1.25863 where the horizontal overlap resistance is.
Areas of consideration:
- H4 1st resistance at 1.25038
- H4 1st support at 1.23950
USD/CHF:
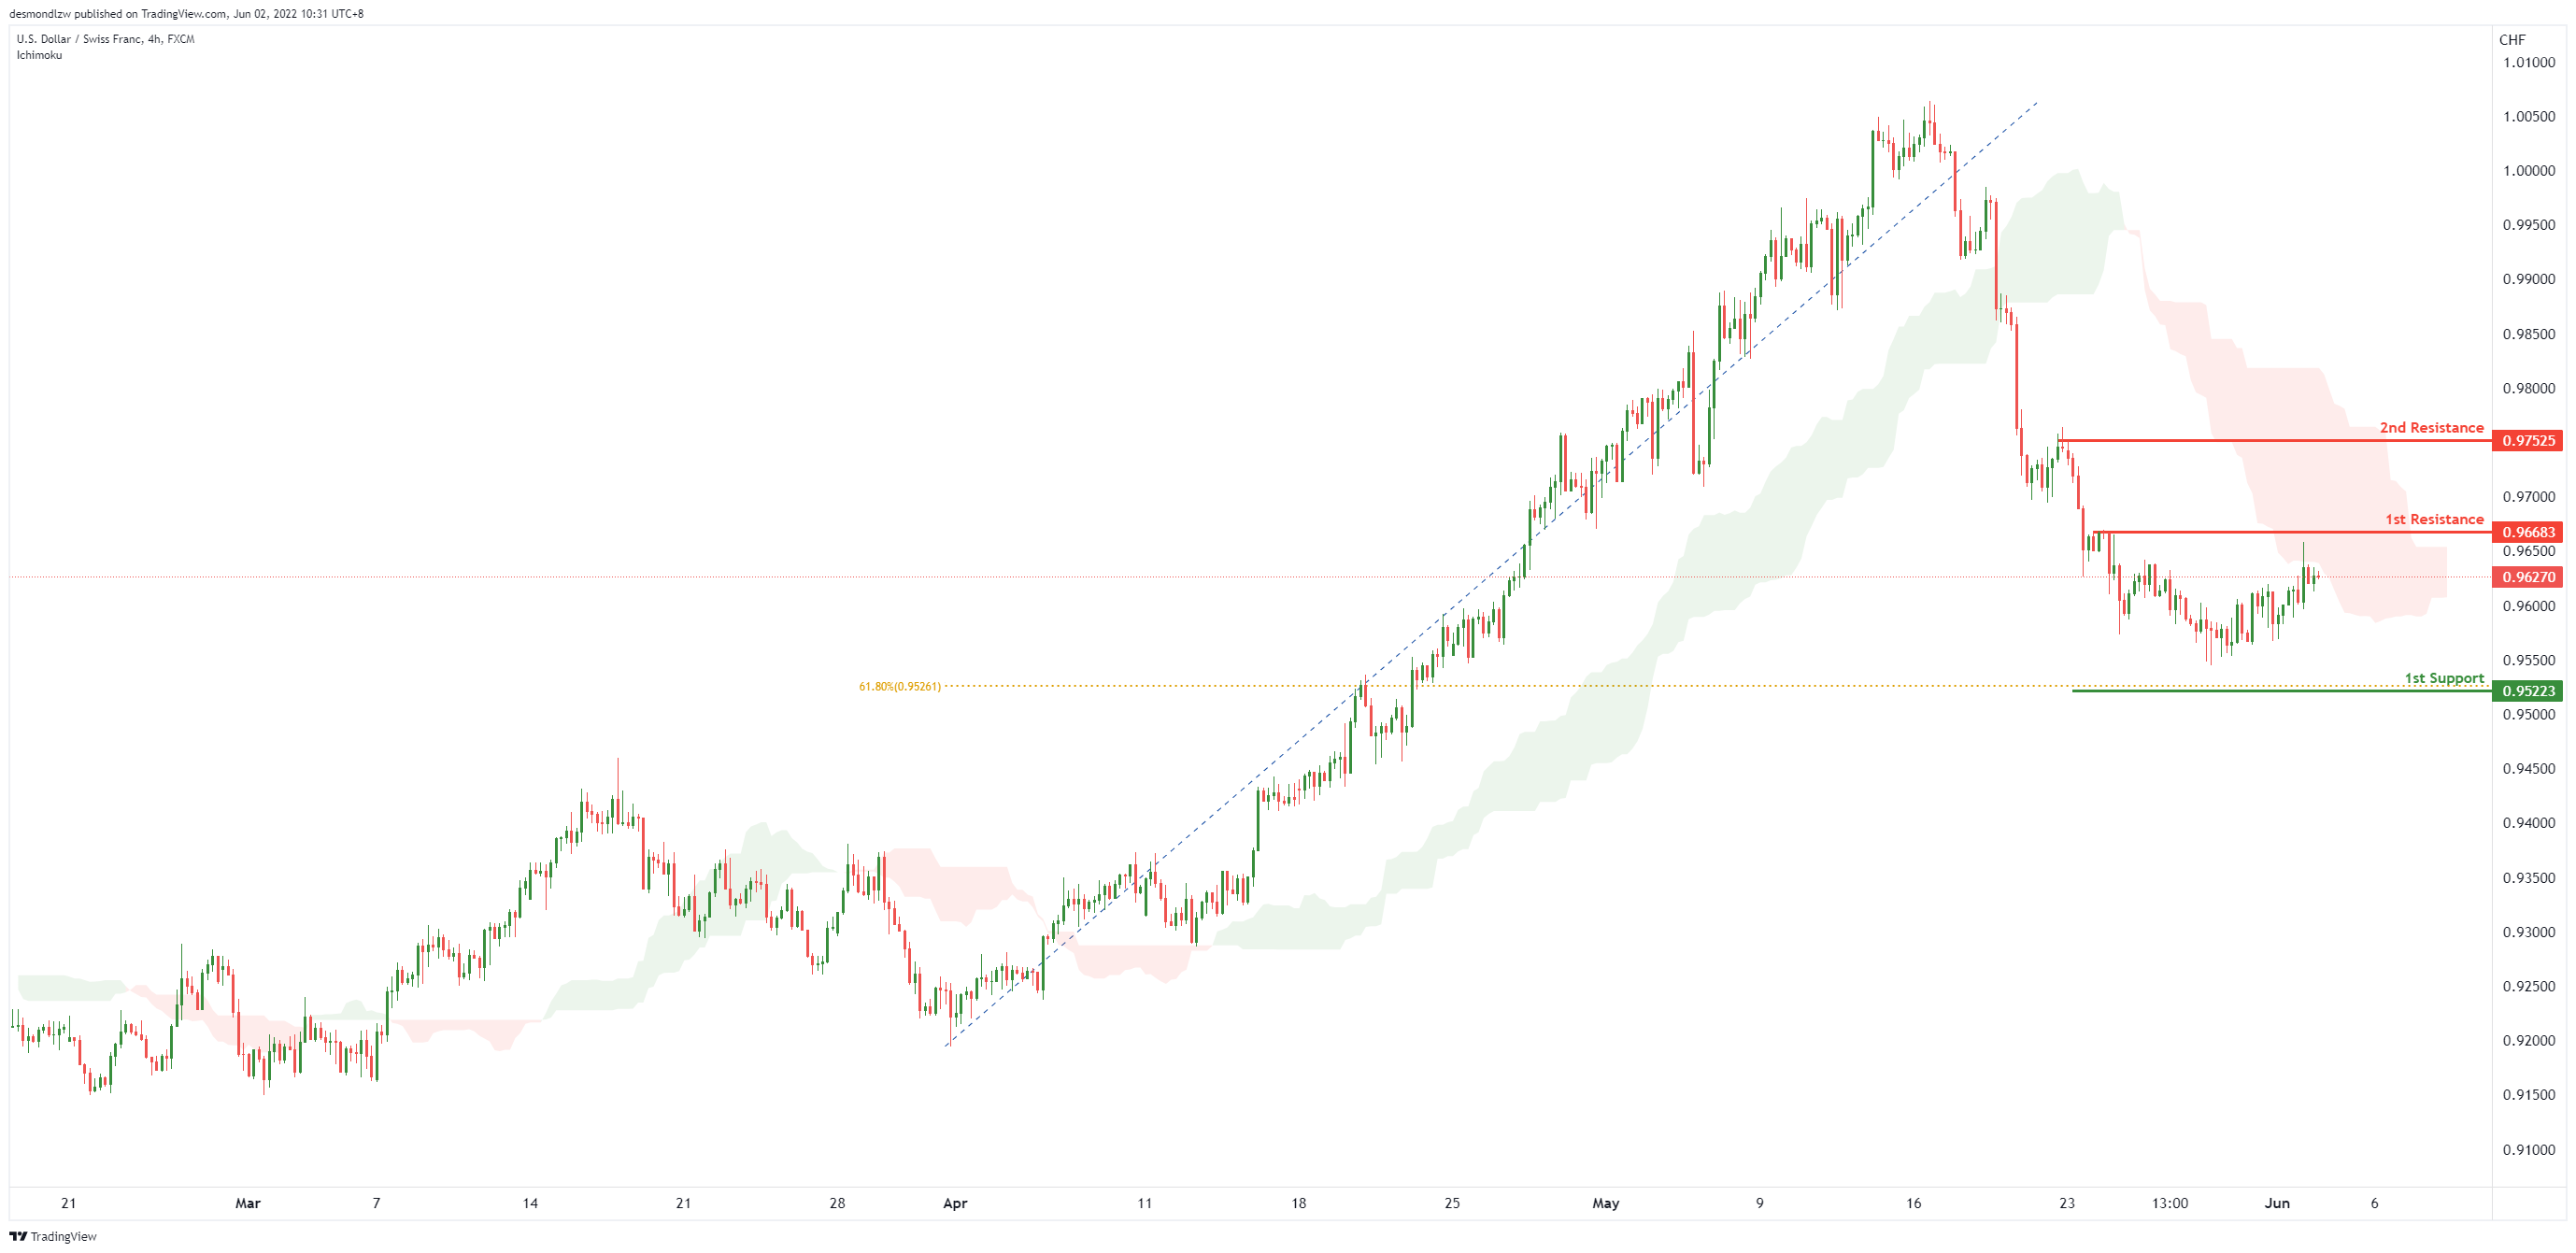
On the H4, with price moving below the ichimoku cloud, we have a bearish bias that price will drop to our 1st support at 0.95223 where the 61.8% Fibonacci retracement is from our 1st resistance at 0.96673 in line with the pullback resistance. Alternatively, price may break 1st resistance structure and head for 2nd resistance at 0.97525 where the swing high resistance is.
Areas of consideration
- 1st support level at 0.95223
- 1st resistance level at 0.96673
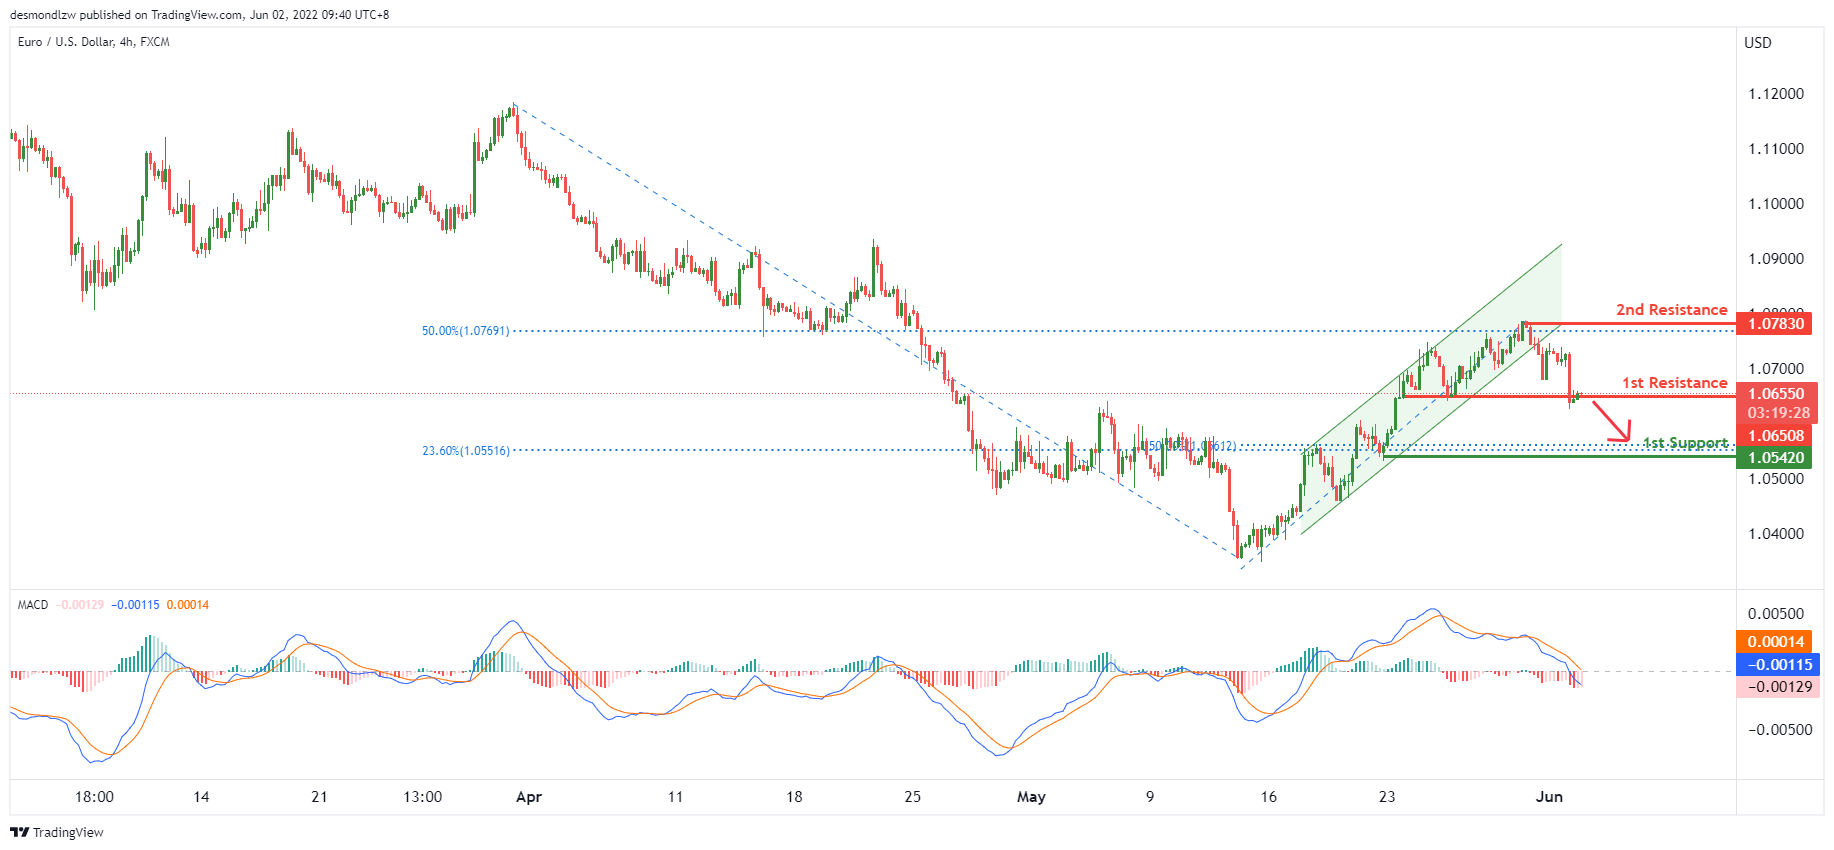
EUR/USD :
On the H4, with price showing bearish pressure on the MACD indicator and price recently breaking the ascending trend channel, we have a bearish bias that price will drop from our 1st overlap resistance at 1.06508 to our 1st support at 1.0542 in line with the 23.6% fibonacci retracement and 50% fibonacci retracement. Alternatively, price may reverse off the 1st resistance and rise to the 2nd resistance at 1.07830 in line with the 50% fibonacci retracement.
Areas of consideration :
- H4 1st resistance at 1.06508
- H4 1st support at 1.0542
USD/JPY:
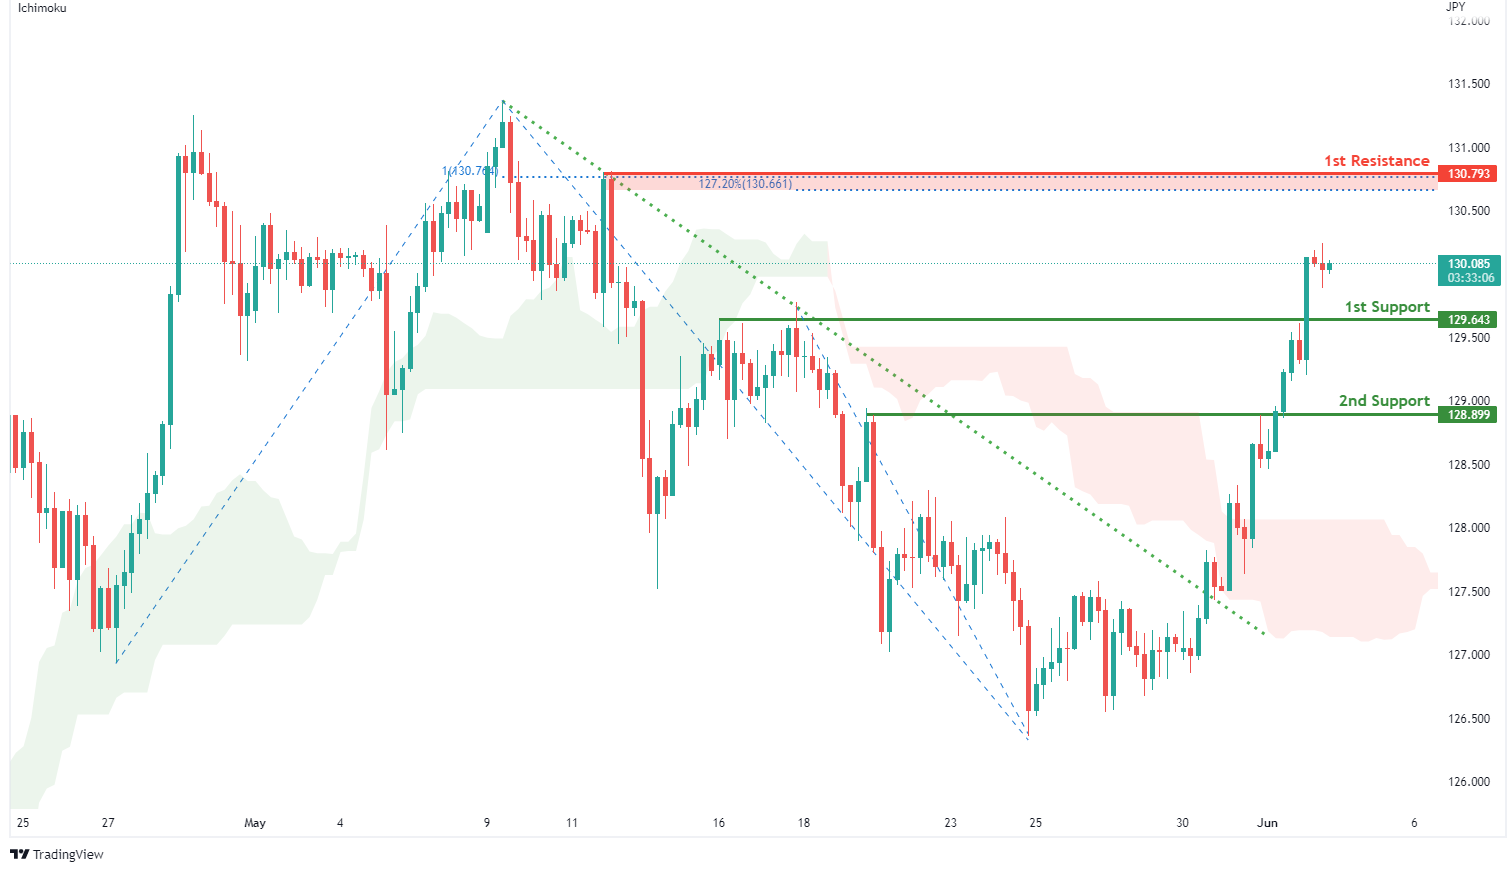
On the H4, with prices moving above the ichimoku indicator and breakout from descending trendline, we have a bullish bias that price will rise from our 1st support at 129.643 where the horizontal overlap support is to our 1st resistance at 130.793 in line with the swing high resistance, 127.2% Fibonacci extension and 100% fibonacci projection. Alternatively, price may break 1st support structure and head for 2nd support at 128.899 where the horizontal pullback support is.
Areas of consideration:
- H4 time frame, 1st resistance at 130.793
- H4 time frame, 1st support at 129.643
AUD/USD:
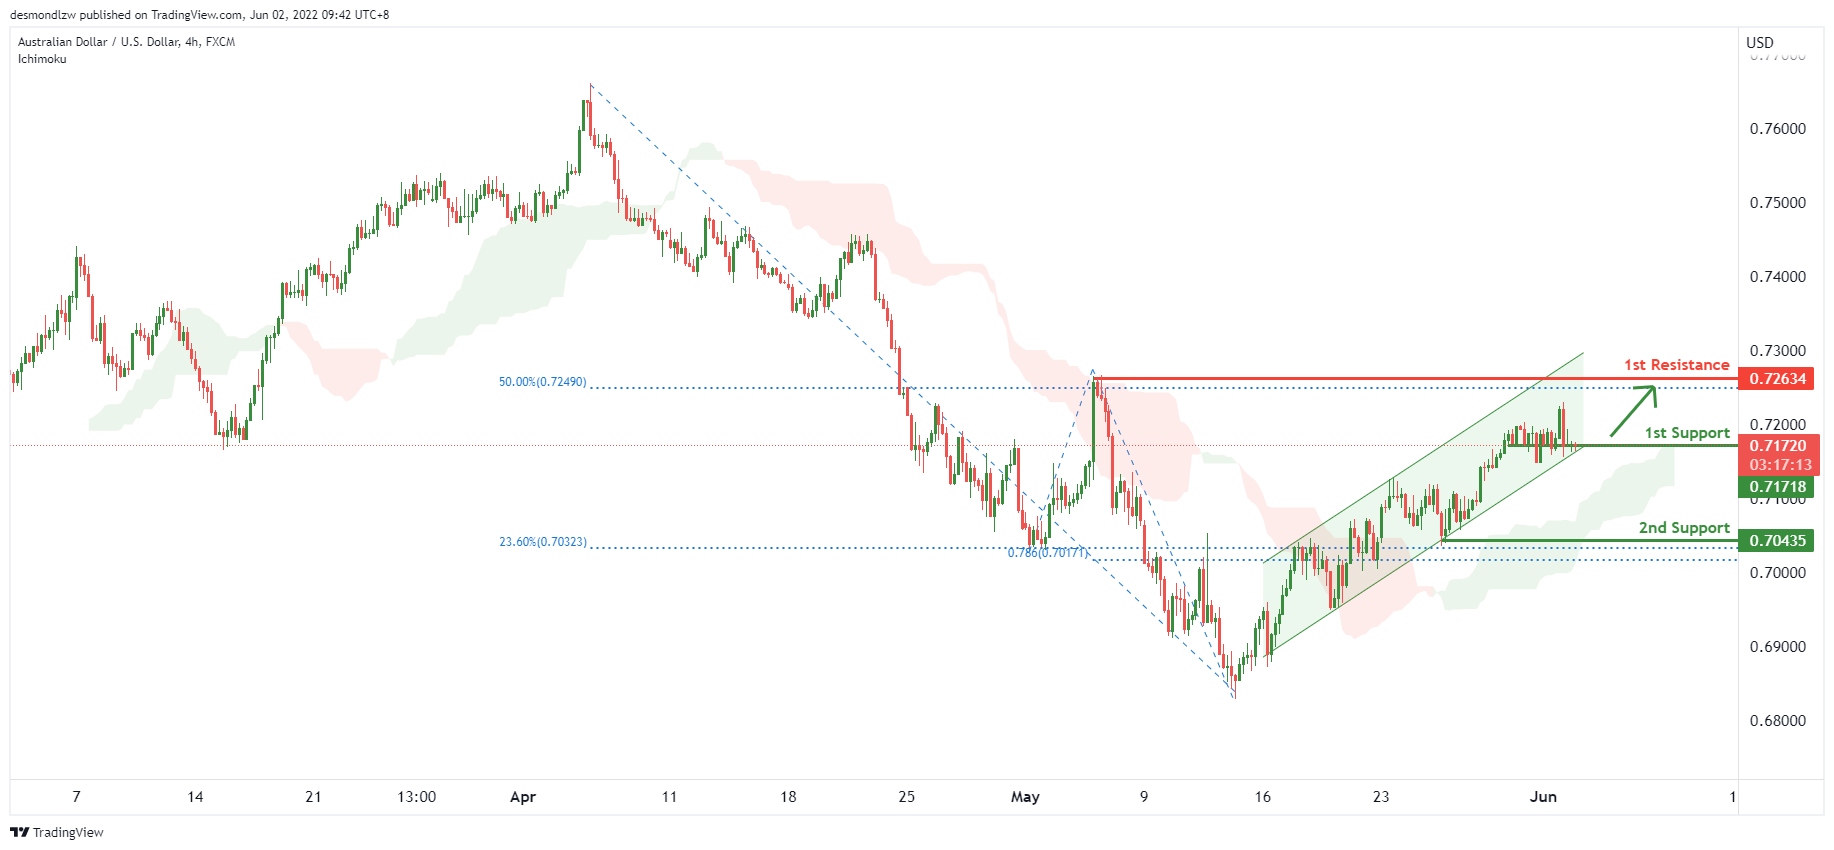
On the H4, with price moving above the ichimoku cloud and price moving within the ascending trend channel, we have a bullish bias that price will rise to our 1st resistance at 0.72634 where the swing high is in line with the 50% Fibonacci retracement from our 1st support at 0.71718. Alternatively, price may break 1st support structure and head for 2nd support at 0.70435 where the horizontal pullback support is, in line with the 78.6% fibonacci projection and 23.6% Fibonacci retracement.
Areas of consideration
- H4 1st resistance at 0.72634
- H4 1st support at 0.71718
NZD/USD:
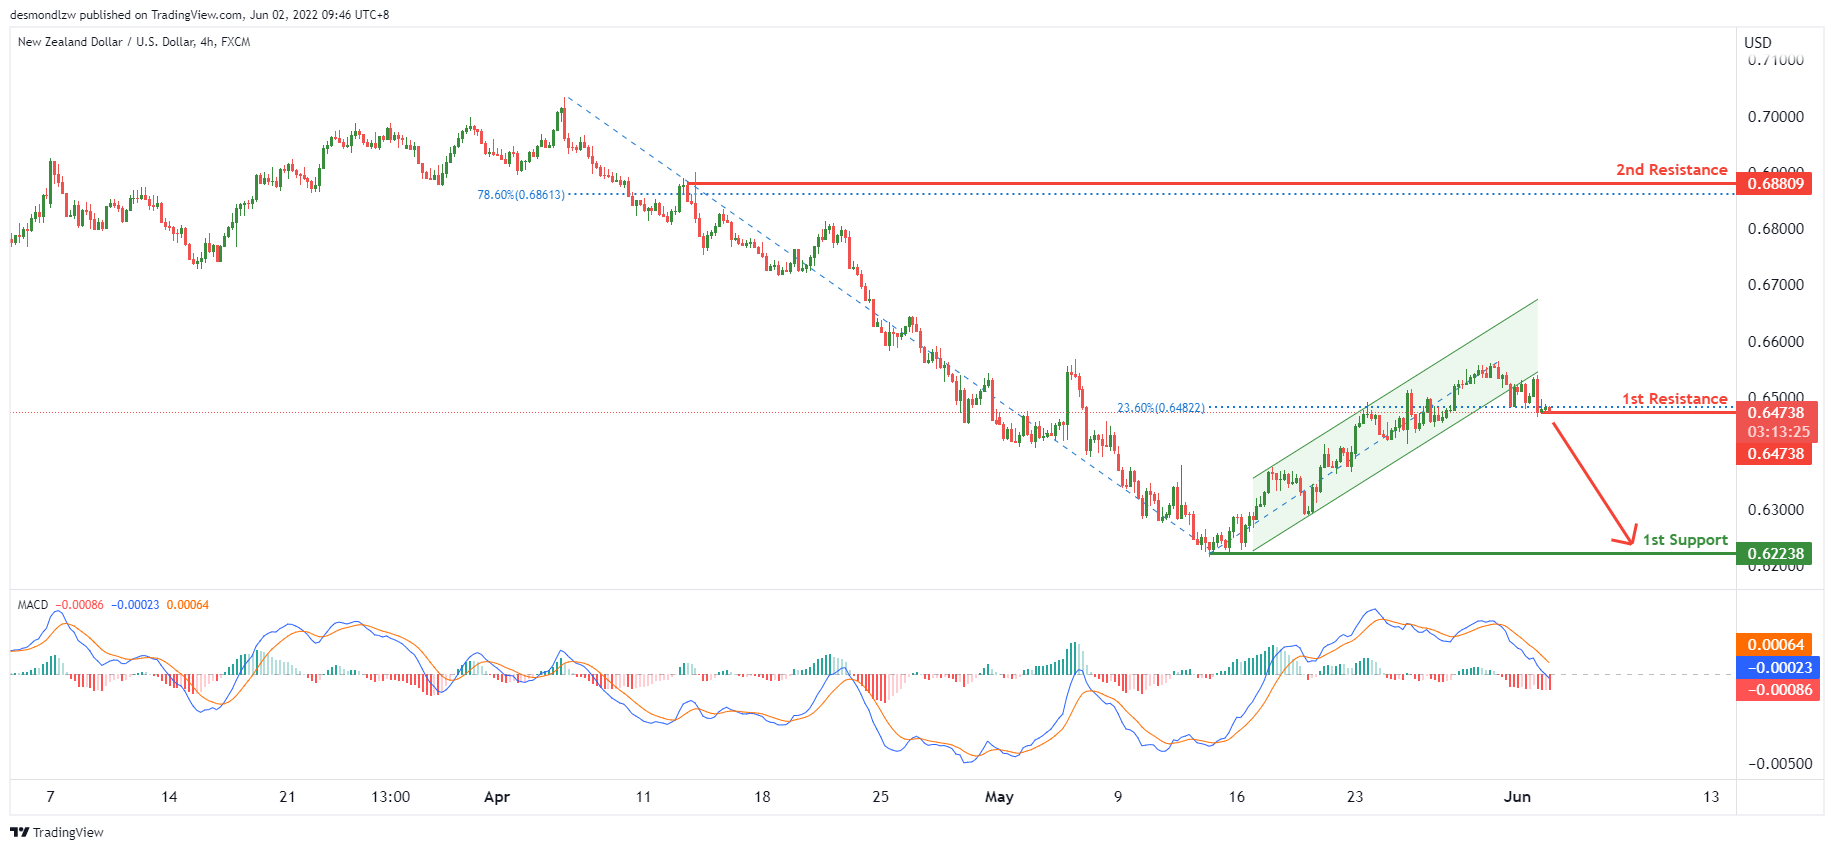
On the H4, with price showing bearish pressure on the MACD indicator and price recently breaking the ascending trend channel, we have a bearish bias that price will drop from our 1st resistance at 0.64738 in line with the 23.6% fibonacci retracement to our 1st support at 0.62238 at the swing low. Alternatively, price may reverse off the 1st resistance and rise to the 2nd resistance at 0.68809 in line with the 78.6% fibonacci retracement.
Areas of consideration:
- H4 time frame, 1st support at 0.62238
- H4 time frame, 1st resistance at 0.64738
USD/CAD:
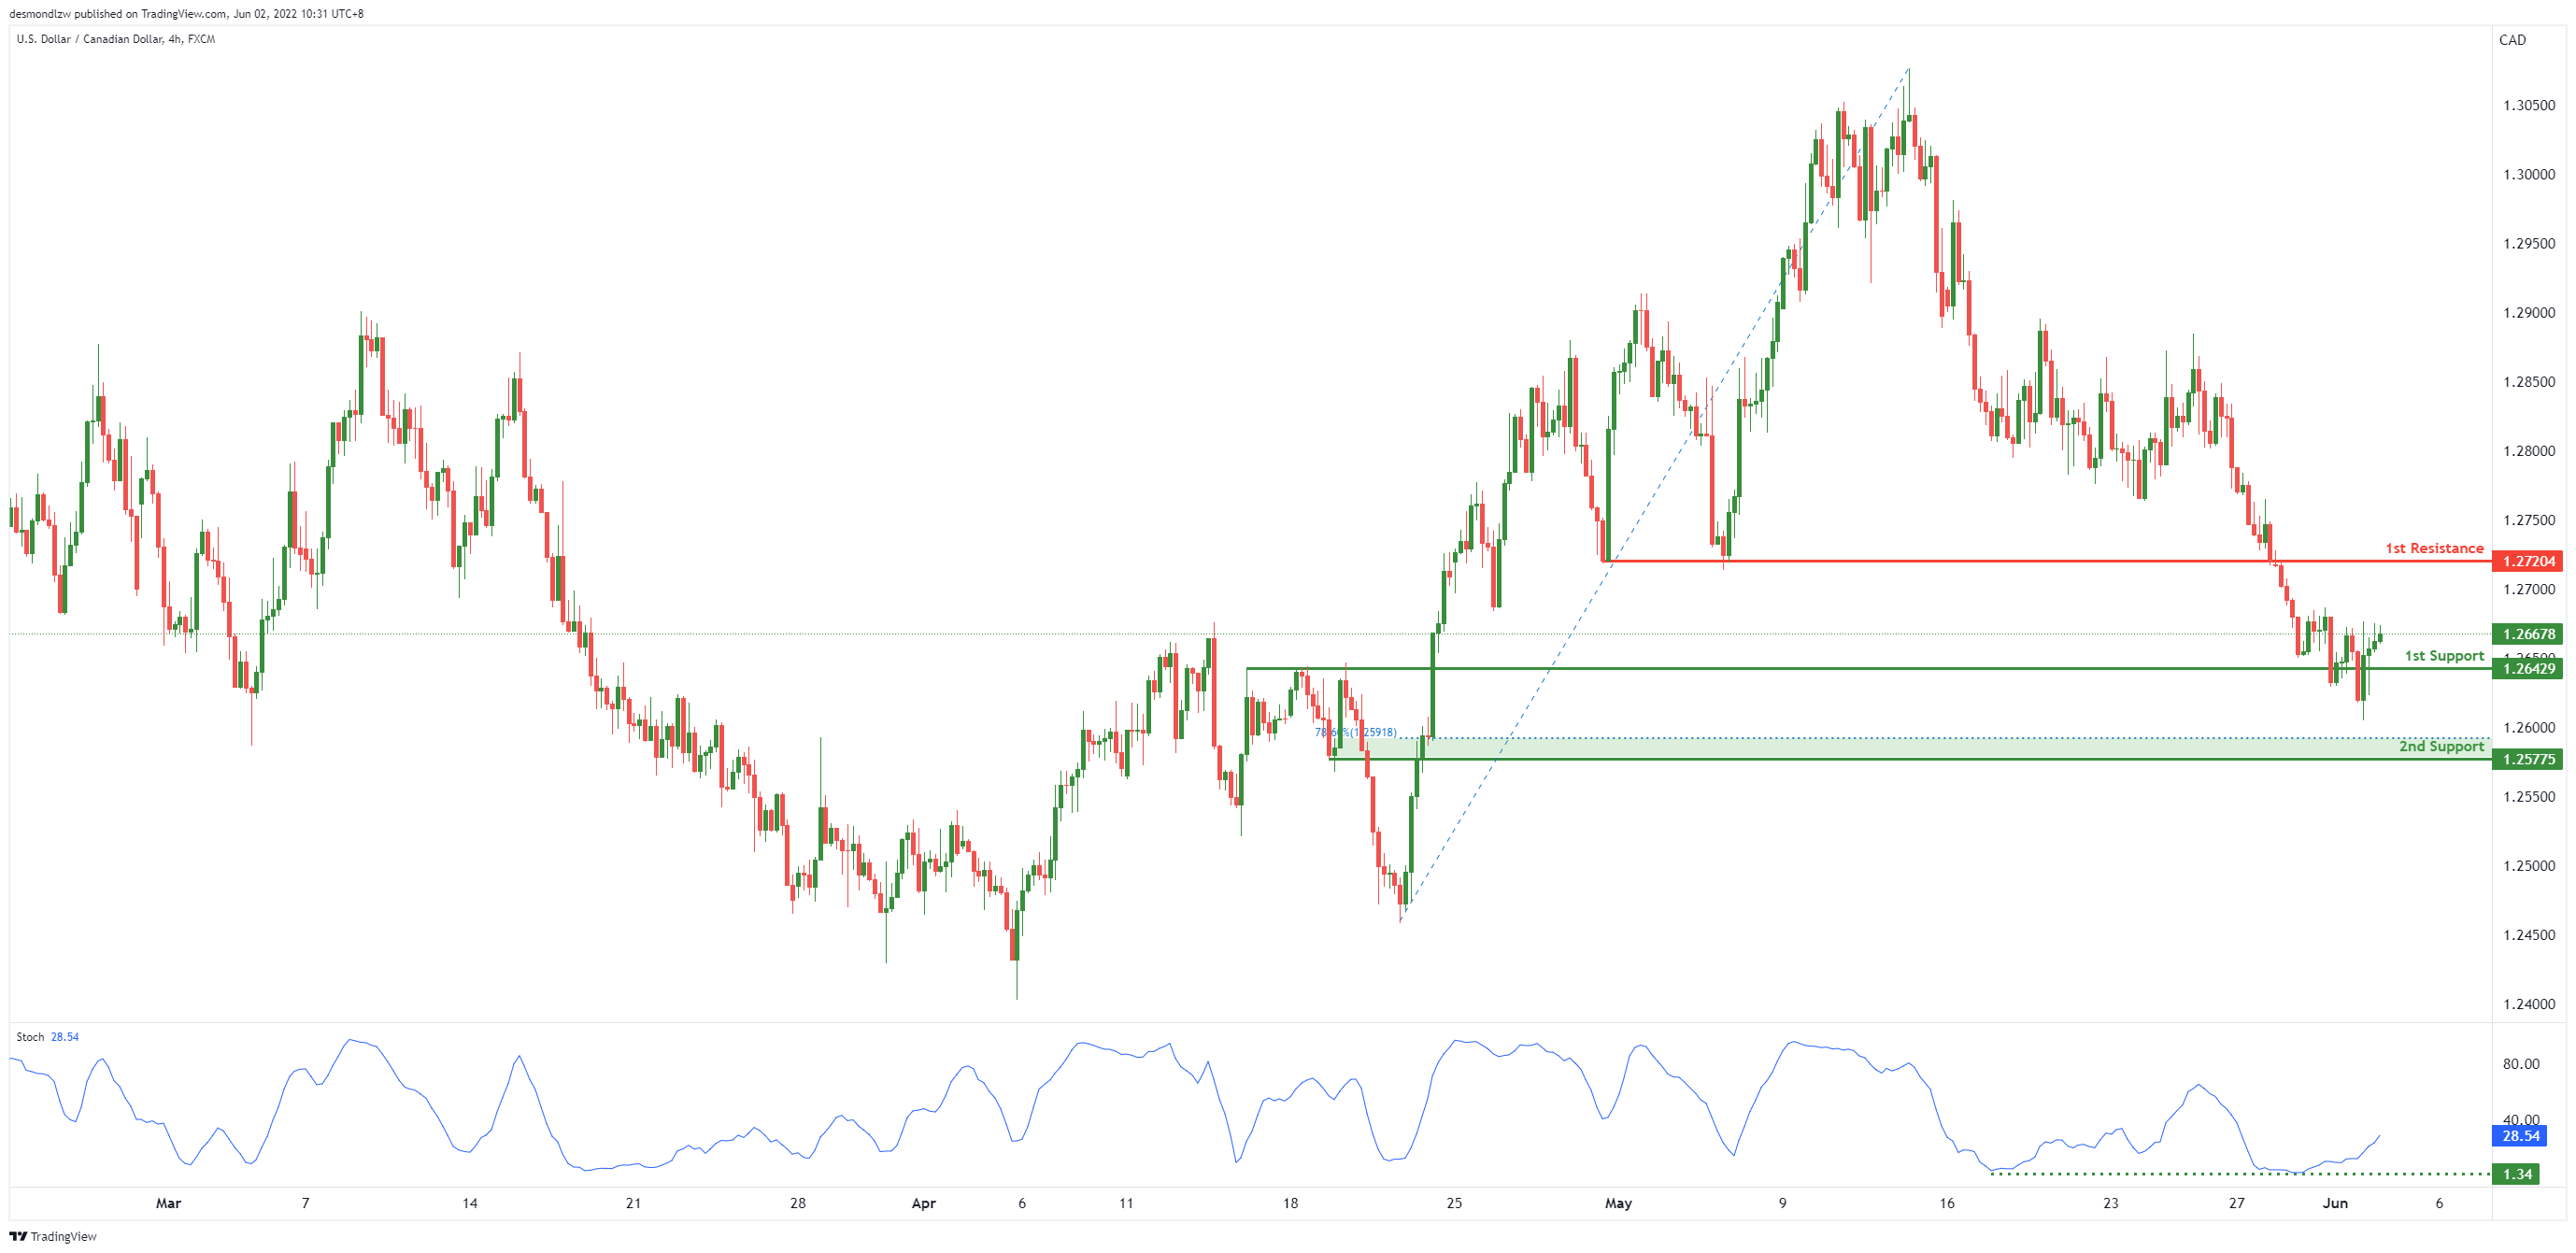
On the H4, with price expected to bounce off the stochastics, we have a bullish bias that price will rise to our 1st resistance at 1.27204 where the horizontal pullback resistance is from our 1st support at 1.26429 in line with the horizontal pullback support.
Areas of consideration:
- H4 time frame, 1st resistance at 1.27204
- H4 time frame, 1st support at 1.26429
OIL:
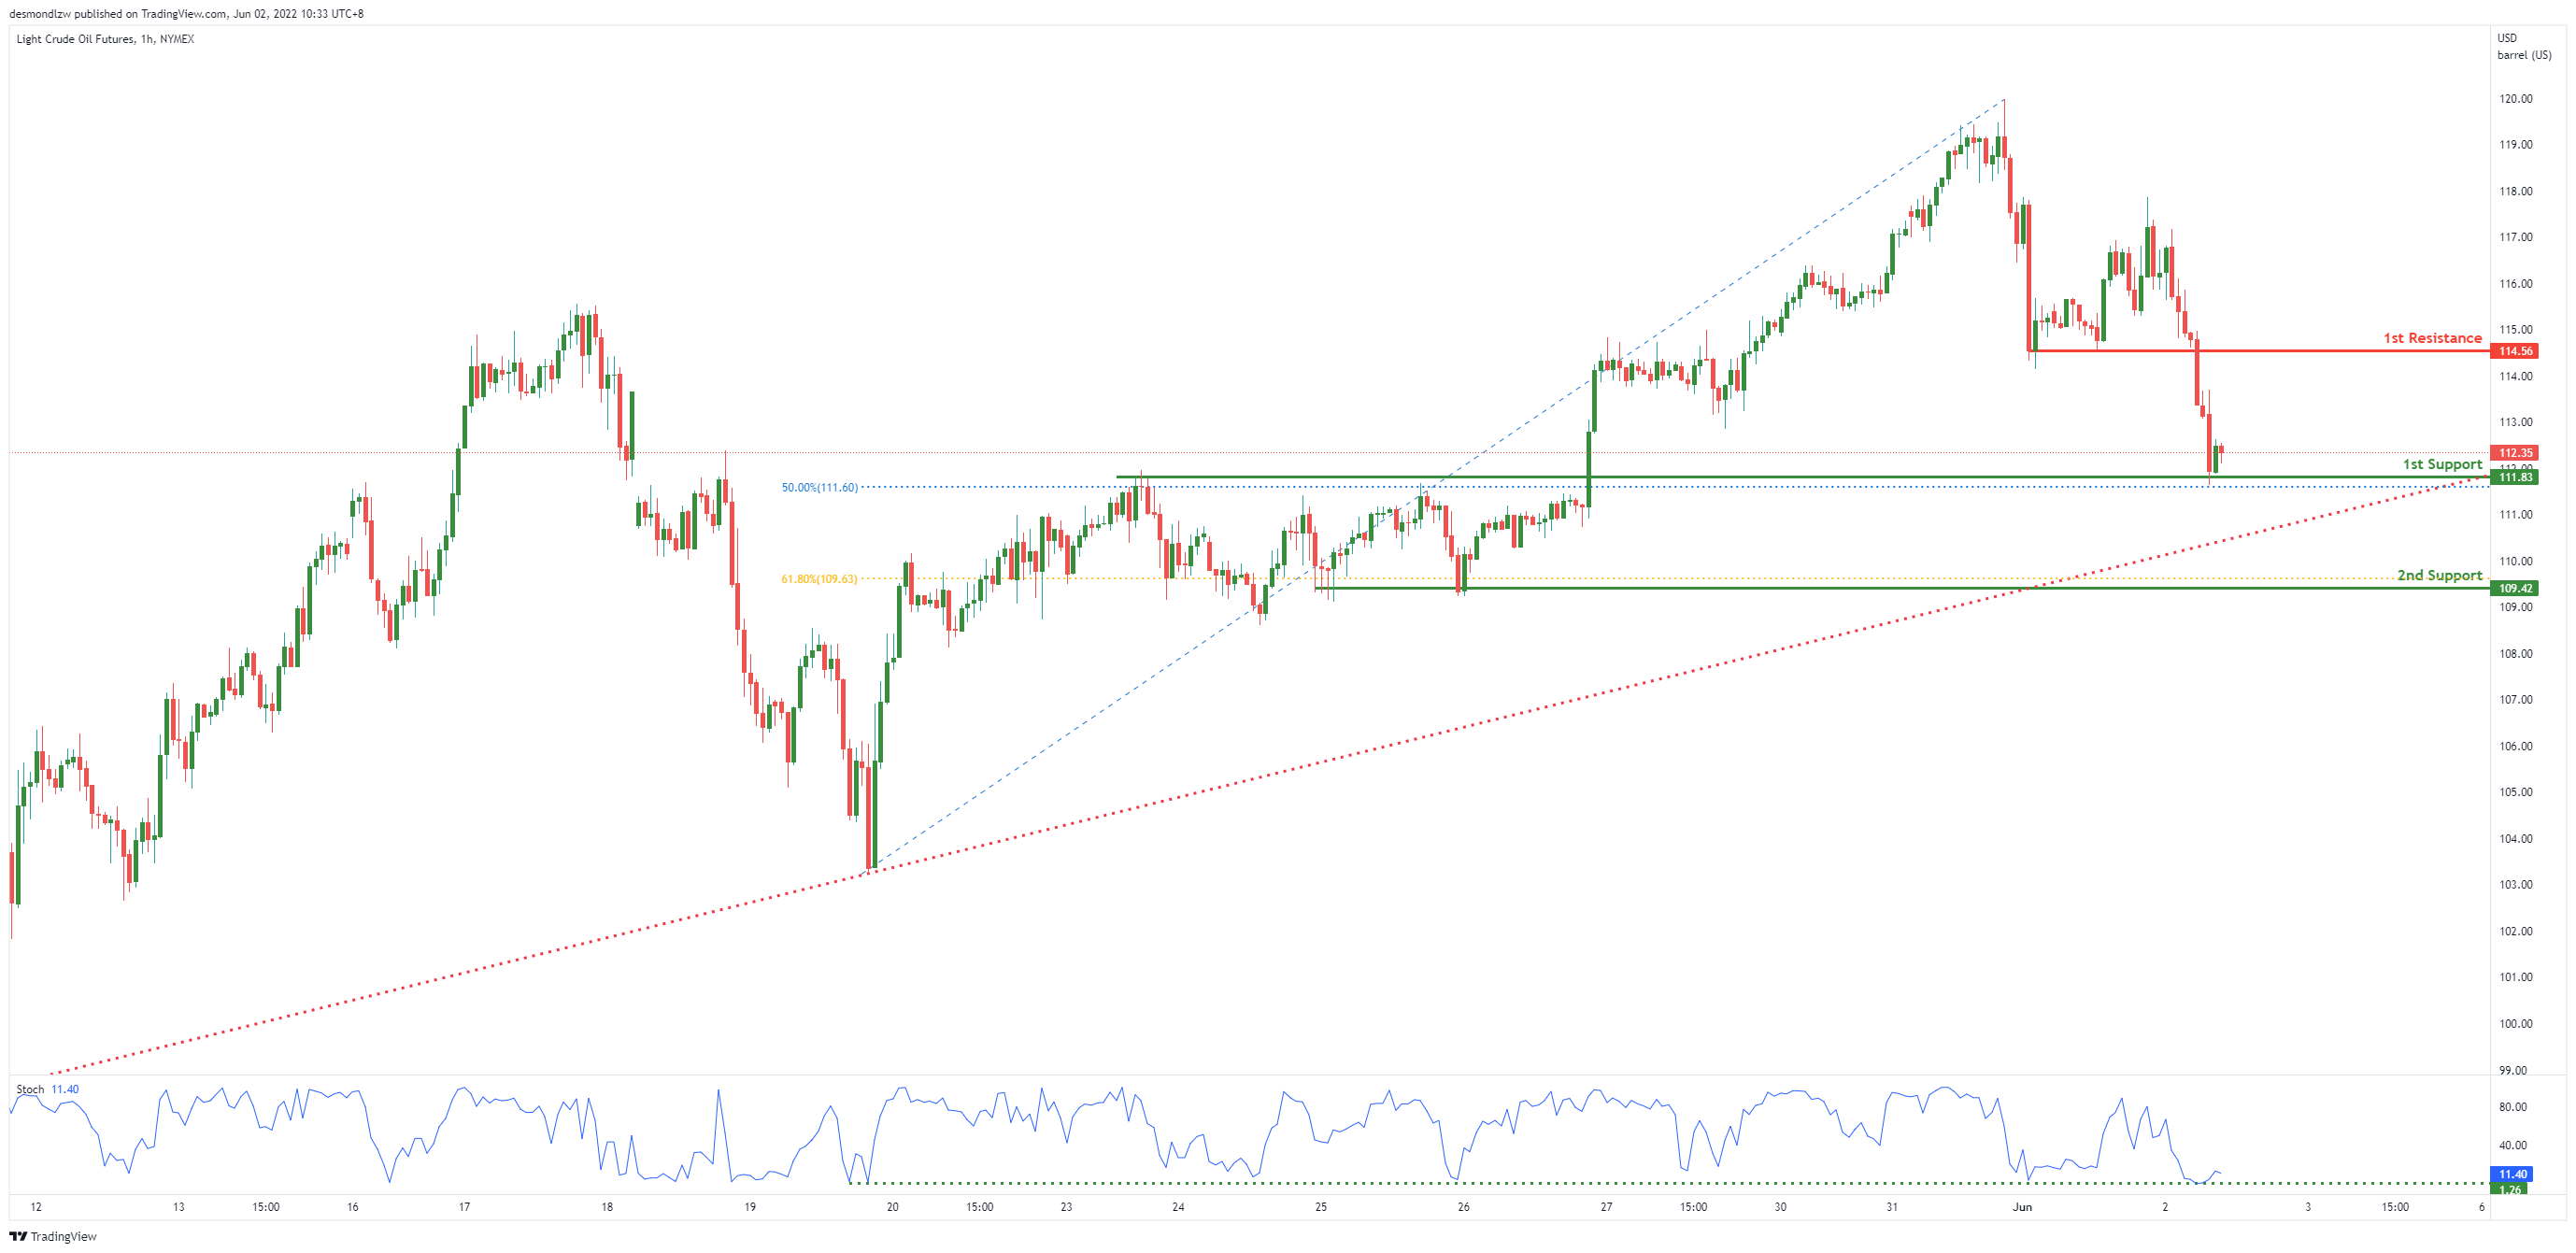
On the H4, with price expected to bounce off the stochastics indicator, we have a bullish bias that price will rise from our 1st support at 111.83 where the 50% Fibonacci retracement is from our 1st resistance at 114.56 in line with the horizontal pullback resistance. Alternatively, price may break 1st support structure and head for 2nd support at 109.04 where the 61.8% Fibonacci retracement is.
Areas of consideration:
- H4 time frame, 1st resistance of 114.56
- H4 time frame, 1st support of 111.83
Dow Jones Industrial Average:
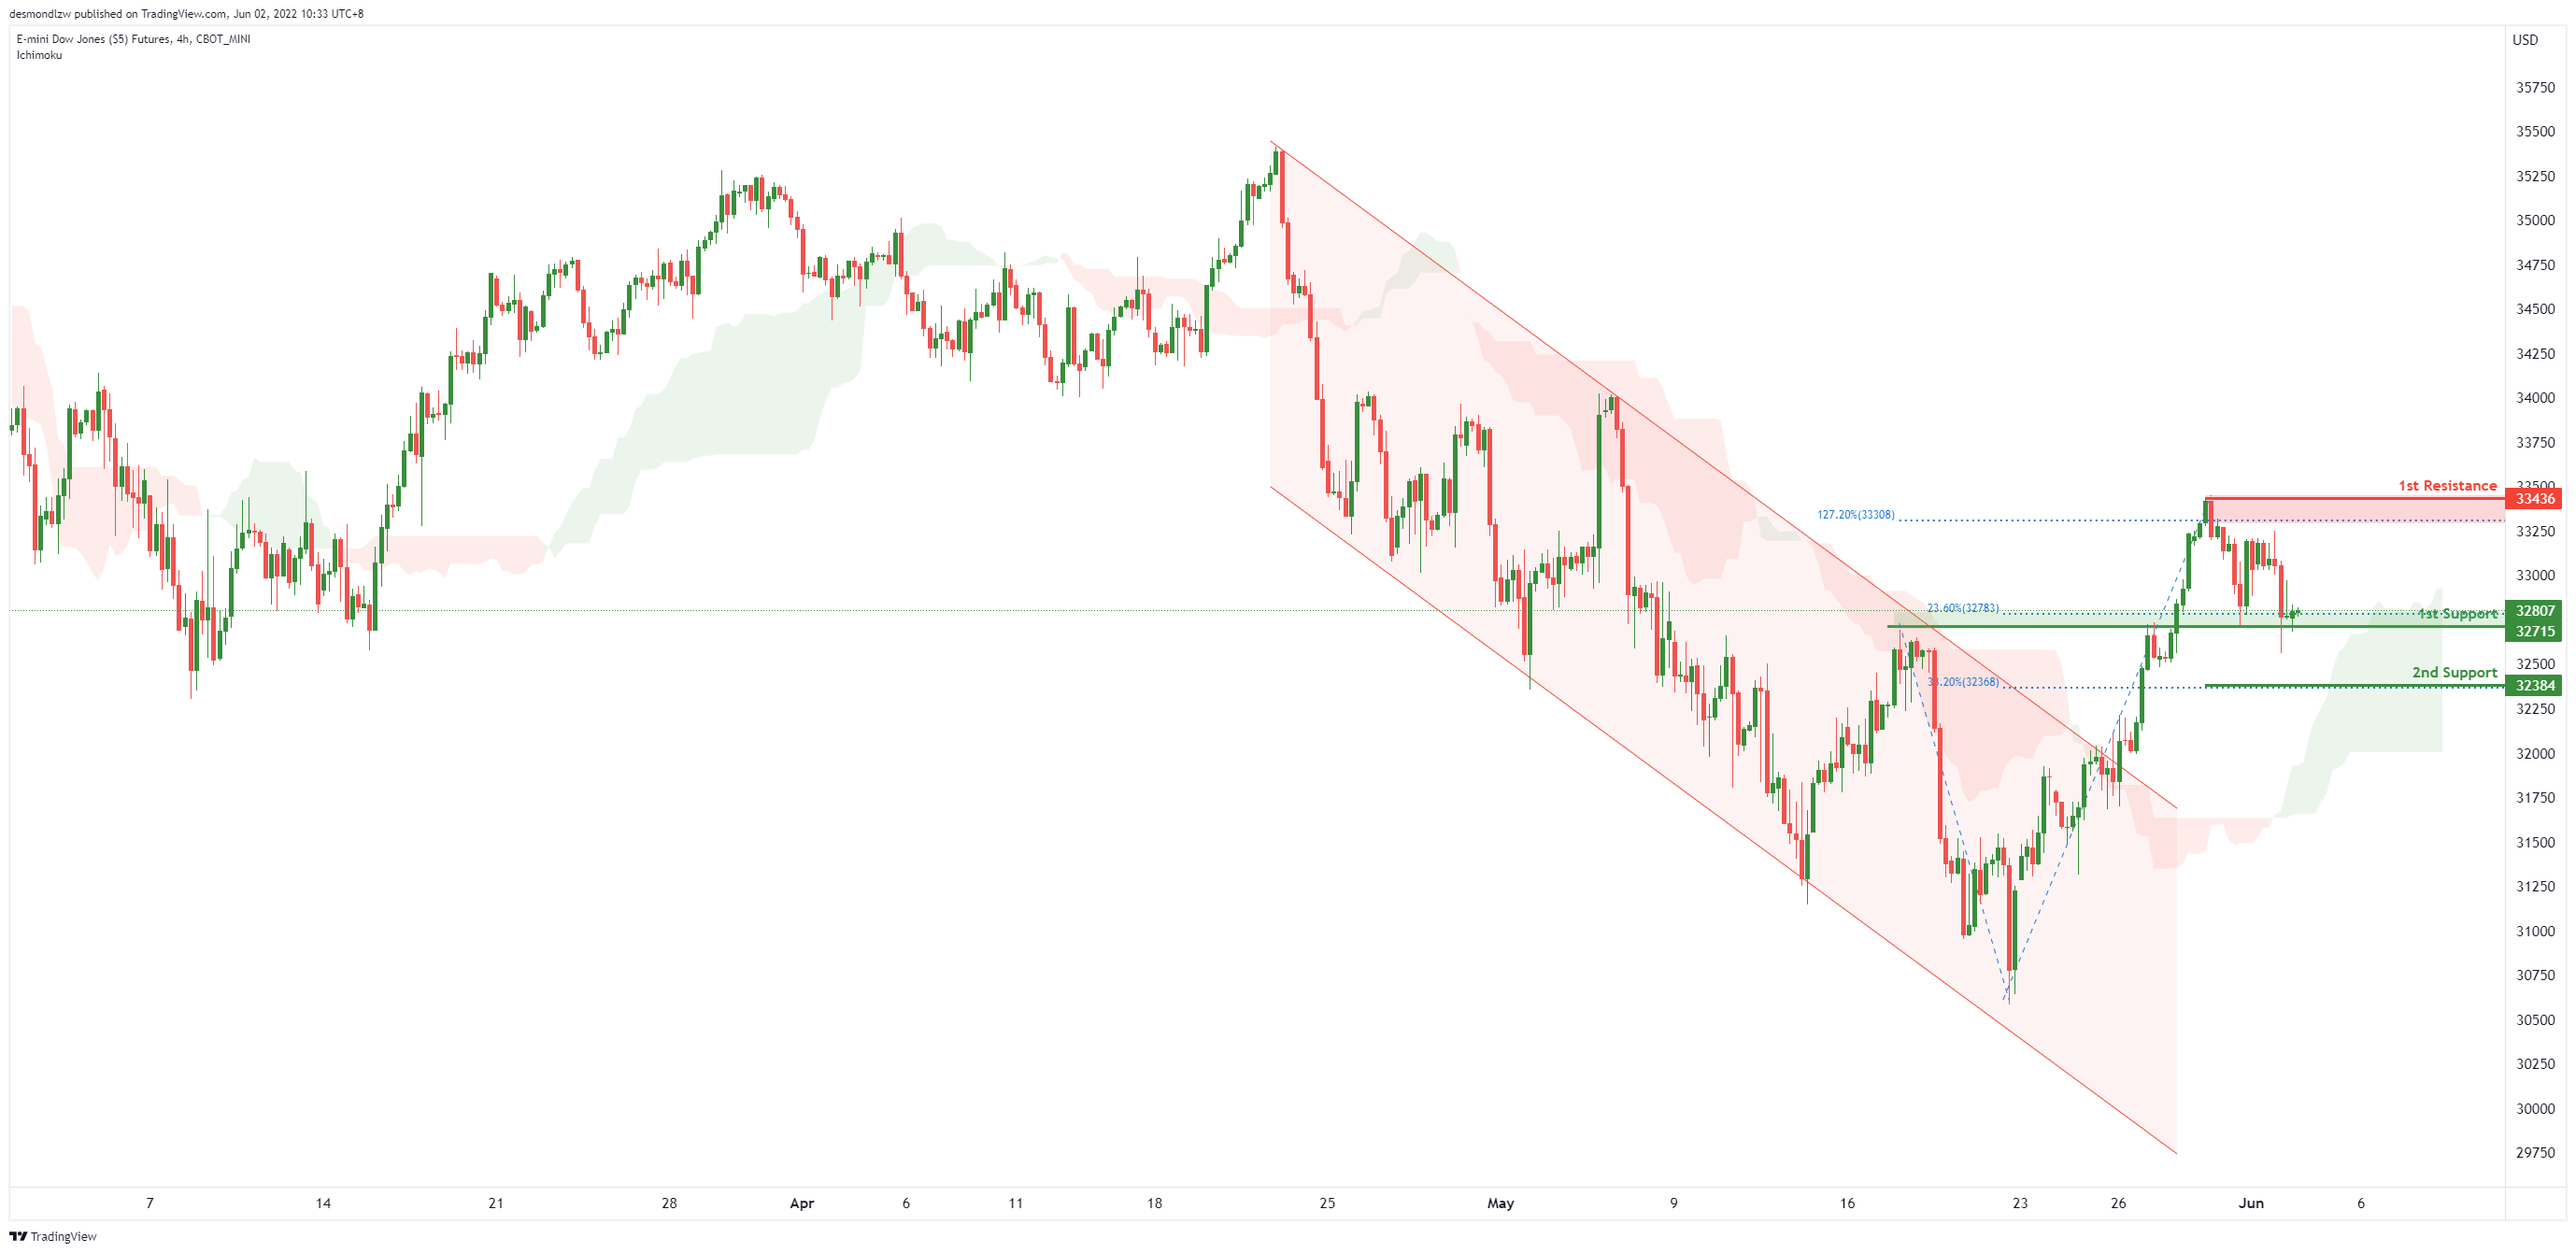
On the H4, with price moving above the ichimoku cloud, we have a bullish bias that price will rise from our 1st support at 32814 where the 23.6% Fibonacci retracement is to our 1st resistance at 33463 in line with the swing high resistance.
Areas of consideration :
- H4 time frame, 1st resistance at 33463
- H4 time frame, 1st support at 32814
BoJ Adachi: We should not forget strong yen led to two lost decades
BoJ board member Seiji Adachi said, "with the impact of the pandemic continuing, shifting to tighter monetary policy now would inflict huge damage to business and household activity... It's premature to move toward tighter policy."
"If the bank uses monetary policy to respond to short-term fluctuations (in exchange rates) before achieving its goal for underlying inflation, it would bring negative effects on the Japanese economy," he said.
"We should not forget that a strong yen was among factors that led to Japan's prolonged deflation and two 'lost' decades" of economic stagnation, he added.
Fed Barkin: It makes perfect sense to normalize policy
Richmond Fed President Barkin said "it's time both on rates and on the balance sheet to normalize where we are". He added, with "inflation this elevated and the economy still this strong, it just makes perfect sense to do that."
"When we get to the fall, I think we're going to have a lot more information on the strength of the economy, we'll have a lot more information on the pace of inflation. Those are the two things I'm paying the most attention to, and the stronger inflation and the stronger the economy, the more the case to do more, and to the extent that the two are weaker, the better the case is to do less," he said.
Fed Bullard: We have a good plan with 50bps per meeting
St. Louis Fed President James Bullard reiterated yesterday, "I think we have a good plan for now. This 50 basis point per meeting increase is twice the normal pace that the committee has used in recent years which shows that there's a lot of unanimity around expeditiously moving to neutral in this high-inflation environment that we're in."
Bullard also repeated that he wants to get rates to 3.5% by the end of the year. Then some of the rate hikes could be reversed late next year or in 2024. He pointed to the pre-pandemic rates, with Fed rates at 1.55%, 10-year yield at 1.86% and mortgage rates well below 4%. "This may provide a practical benchmark for where the constellation of rates may settle once inflation comes under control in the U.S.," he said.
Fed Daly: Let’s get to neutral as quickly as we can
San Francisco Fed President Mary Daly told CNBC yesterday, "I see a couple of 50-basis-point hikes immediately in the next couple of meetings to get there. And then we need to look around and see what else is going on." She estimates that neutral rate is at around 2.50%, and said , "let's get there as quickly as we can."
"I'm looking for both supply to recover somewhat and demand to come back down a little bit. If neither of those things cooperate, then we need to go into restrictive territory," Daly added.
Oil Prices Volatility Amps Up as OPEC Plans Discussions of Production Quotas
Oil Prices Volatility Amps Up as OPEC Plans Discussions of Production Quotas
The final day of May was one of the most volatile for oil markets this spring. In the aftermath of the EU’s decision to impose an embargo on Russian crude shipped by sea, prices skyrocketed to almost hit $120 per barrel, stopping short just a few cents from the figure. As the U.S. trading session started, profit taking ensued and news about OPEC discussing whether to suspend Russian crude from the oil-production deal weighed on prices.
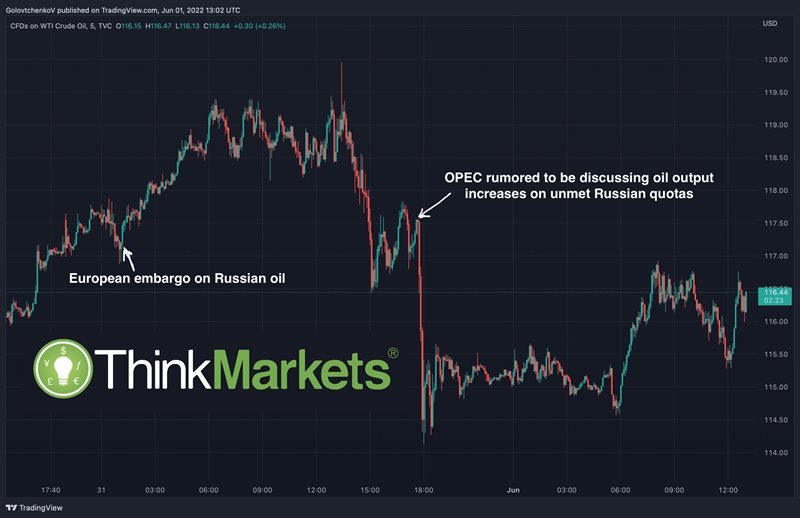
WTI Oil quickly dropped 5 figures, closing the session around $114.67. With a looming OPEC meeting on Thursday, oil prices could continue to fluctuate wildly as most oil-producing nations lack the capacity to pump out more oil. Will Saudi Arabia and the UAE pick up the slump in Russian production which is expected to drop 8% this year? This could have a dramatic impact on oil markets which have been the top-performing asset over the past several months.
Why it matters?
During the Covid-19 pandemic as demand for oil slumped, a meeting between most major oil-producing nations formed the OPEC+ deal – an agreement that regulated the planned gradual increase in oil production as the post-covid slump in demand subsided. Every month after the OPEC/OPEC+ meeting a planned increase to the production quotas of 400,000 bpd is enacted, and proportionately distributed between oil-producing nations. Since Russia isn’t able to meet its production quota over recent months, the meeting on Thursday could result in this amount being split between other member-states that have spare capacity.
What we’re watching?
The key driving factors coming up are the discussions at the OPEC meeting this Thursday. A WSJ report signaled yesterday that discussions about the exclusion of Russia from planned increases of oil production is underway. If other OPEC members pick up the slack, we could see a temporary relief for oil prices which have been relentlessly rising since the start of the year.
What we’re hearing?
OPEC has reduced its estimate for oil a global oil surplus by 0.5 million barrels per day. With a lower surplus, prices for the commodity have maintained above-trend levels for a protracted period. Meanwhile Russia claims that the European oil sanctions against it could impact the while global energy market.
Take advantage of oil market volatility and take a view on the direction of the oil markets using WTI or BRENT crude oil CFDs. If OPEC producers decide to suspend the quotas for Russian oil, Saudi Arabia and the UAE are the only two countries that have enough spare capacity to pump out more of it. Will this lead to a material and more protracted correction in oil prices or not?
GBPUSD Wave Analysis
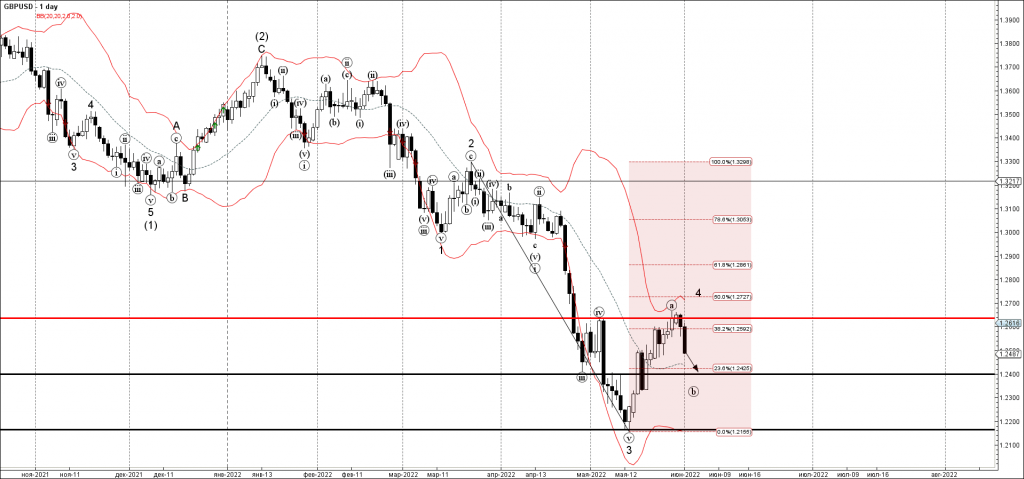
- GBPUSD reversed from key resistance level 1.2635
- Likely to fall to support level 1,2400
GBPUSD recently reversed down from the key resistance level 1.2635 (which stopped wave (iv) at the start of May) – standing close to the 38.2% Fibonacci correction of the previous downward impulse 3 from March.
The downward reversal from the resistance level 1.2635 started the active minor corrective wave (b).
Given the strong daily downtrend, GBPUSD can be expected to fall further toward the next support level 1,2400.
FTSE 100 Wave Analysis
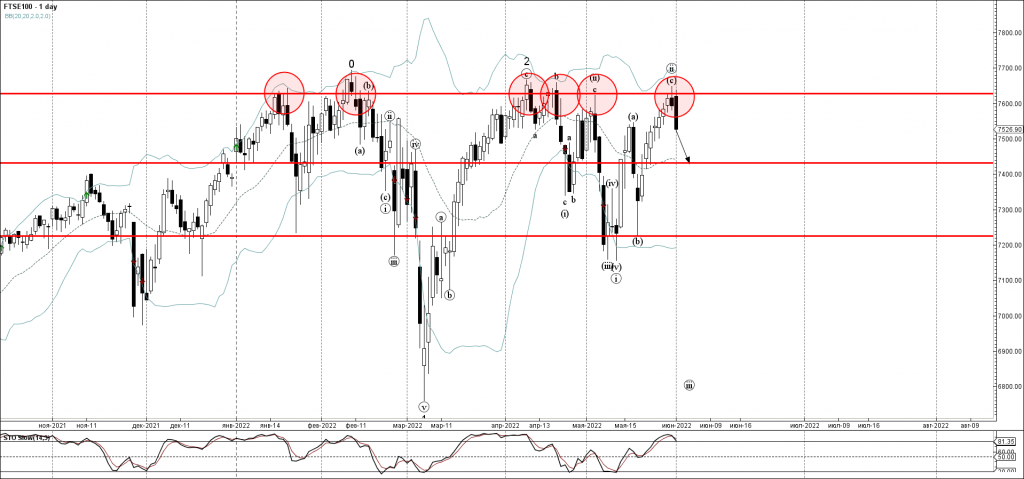
- FTSE 100 reversed from long-term resistance level 7630.00
- Likely to fall to support level 7400.00
FTSE 100 index recently reversed down from the long-term resistance level 7630.00 (which has been repeatedly reversing the index from January, as can be seen below).
The downward reversal from the resistance level 7630.00 stopped the previous minor corrective wave (ii).
Given the strength of the resistance level 7630.00 and the overbought reading on the daily Stochastic indicator, FTSE 100 can be expected to fall further toward the next support level 7400.00.
Gold – Gathering Momentum?
Or a failed recovery?
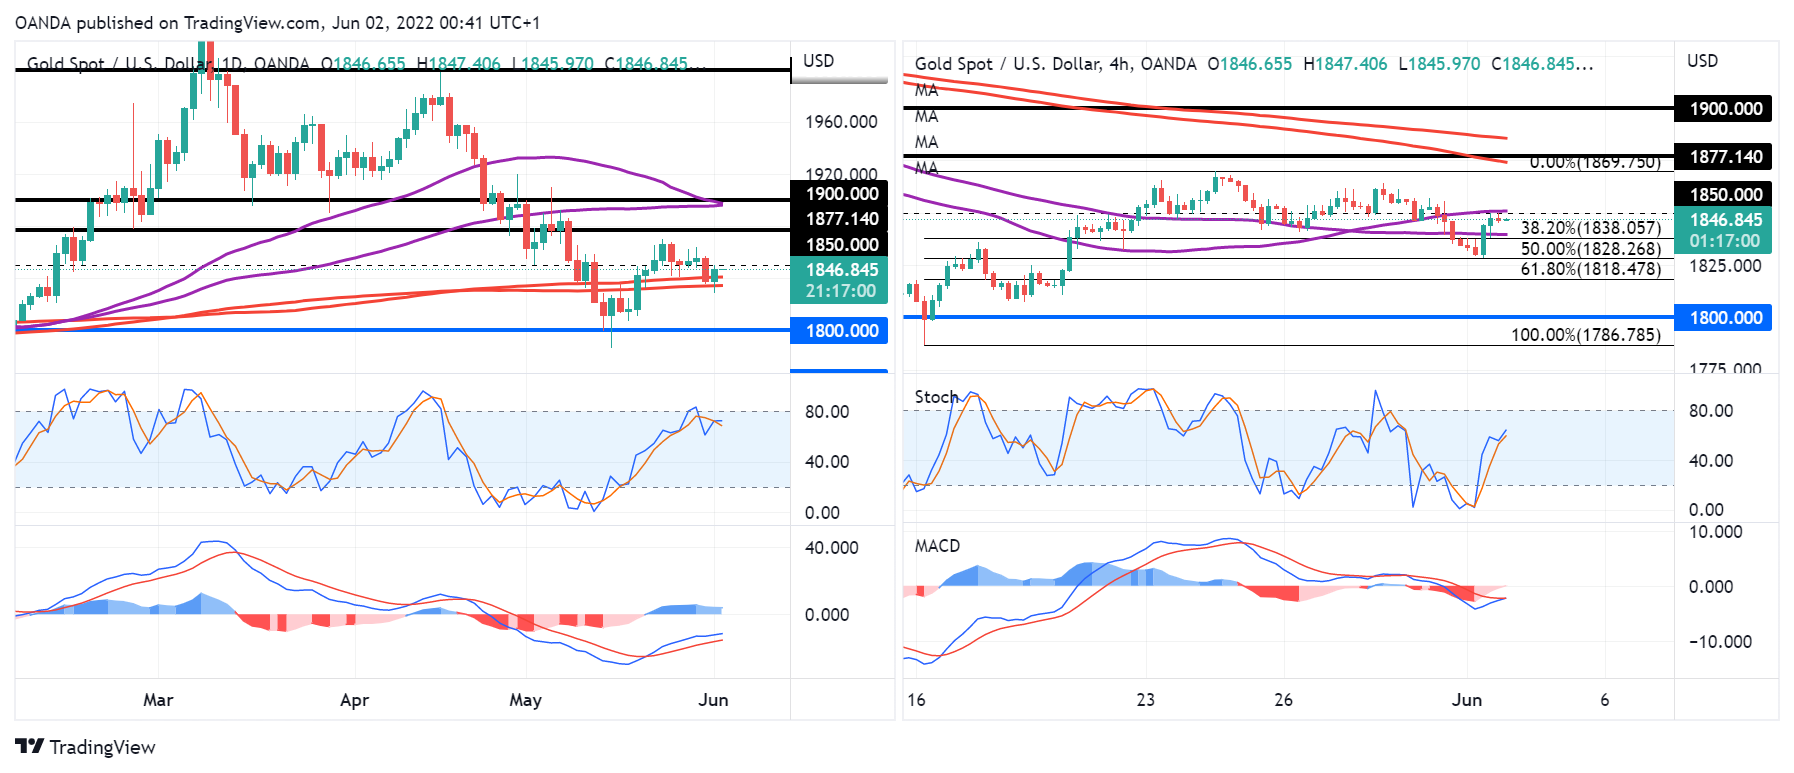
Gold fell heavily between the middle of April and May but then started to recover as interest rate expectations were pared back. How sustainable is the recovery?
It ran into trouble quite quickly around $1,870, at which point it struggled to gather any upward momentum. But after falling back towards $1,830 today, that may have changed.
A rotation off the 50% Fibonacci retracement level – mid-May lows to late-May highs – which coincides with the 200/233-day SMA band may signal a resumption of the recovery that sees it test last week’s highs.
If so, then perhaps gold could enjoy more of a recovery and a run at $1,900. But that may depend on how the broader markets behave and whether yields and the dollar avoid rising much further.
A failure at $1,850 or $1,870 could spell trouble for the yellow metal, especially if accompanied by higher interest rate expectations and a stronger dollar.
Eco Data 6/2/22
[php_everywhere instance="1"]