Sample Category Title
Australian Dollar Edges Up, GDP Looms
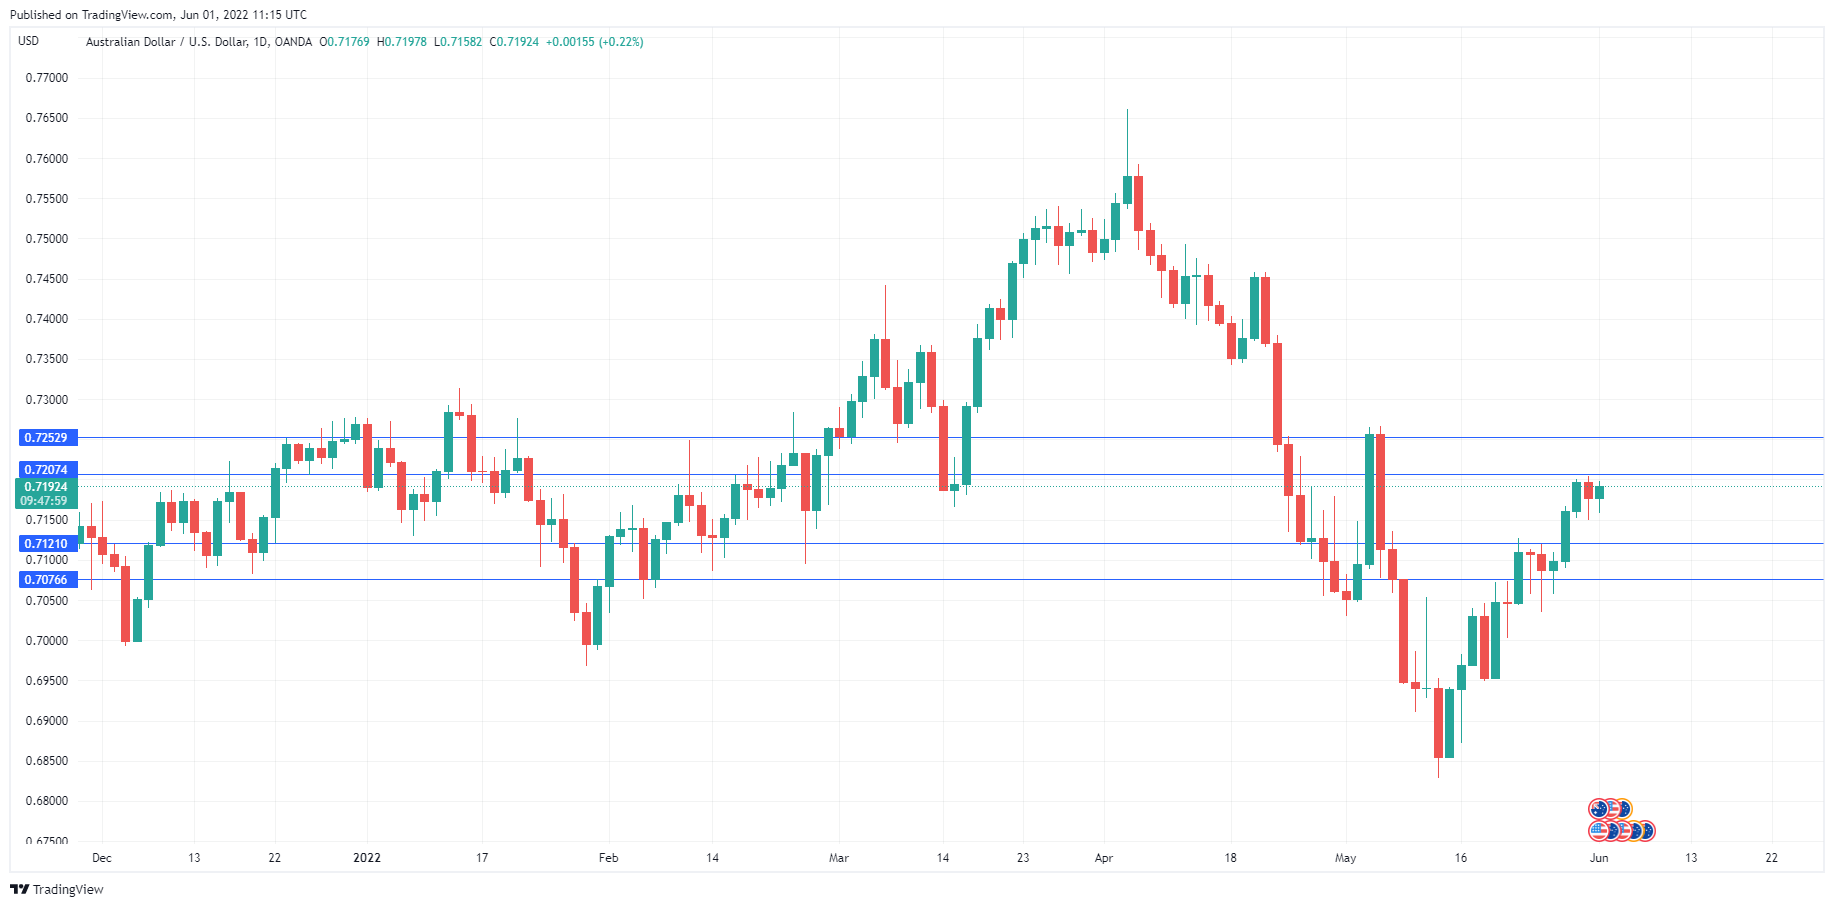
The Australian dollar is in calm waters this week, as AUD/USD trades quietly just below the 0.73 level.
GDP slows to 0.8%
Australia’s Q1 GDP slowed to 0.8% QoQ, after a massive 3.6% QoQ gain in Q4 of 2021. Investors were braced for a softer release after the impressive Q4 surge, and the Q1 reading actually outperformed, beating the estimate of 0.5%. This has resulted in a muted response to GDP, with the Aussie edging slightly higher.
The whipsaw movement in GDP makes it difficult to predict the underlying strength of the economy. As far as the RBA is concerned, the respectable growth in Q1, which translates into 3.2% annualized growth, doesn’t interfere with its rate-tightening plans. Monetary policy has not focused all that much on GDP, with the RBA concentrating on the labour market, wage growth and inflation. The RBA holds its meeting next week, and is likely to tighten by another 25-bps, which would bring the cash rate to a (still low) 0.60%.
Australia’s current account contracted to AUD 7.5 billion in the first quarter, down sharply from AUD 13.2 billion in Q4 of 2021. The decline was a strong increase in imports, which outstripped exports. This is consistent with strong retail sales, as consumers continue to spend in the follow-up to the removal of Covid restrictions.
In the US, the Fed commenced quantitative tightening this week and the Fed continues to send out hawkish messages. Fed Governor Christopher Waller urged the Fed to continue its rate hikes and said that he supported raising rates above the “neutral level”, which is not supportive or restrictive for growth. The Fed estimates the neutral level around 2.5%, which leaves plenty of room for further hikes. Fed Chair Powell has signalled that the Fed will deliver 50-bps hikes in June and July, followed by a pause in September.
AUD/USD Technical
- 0.7207 is under pressure in resistance. Above, there is resistance at 0.7252
- There is support at 0.7121 and 0.7076
Where Gold’s Downtrend is Heading
Gold has shed its position for the second day in a row, losing more than 1% during that time, and that might be just the beginning of a new downside wave, which will potentially take the price down to $1650. However, investors and traders will likely consider the potential to outweigh the risks early on.
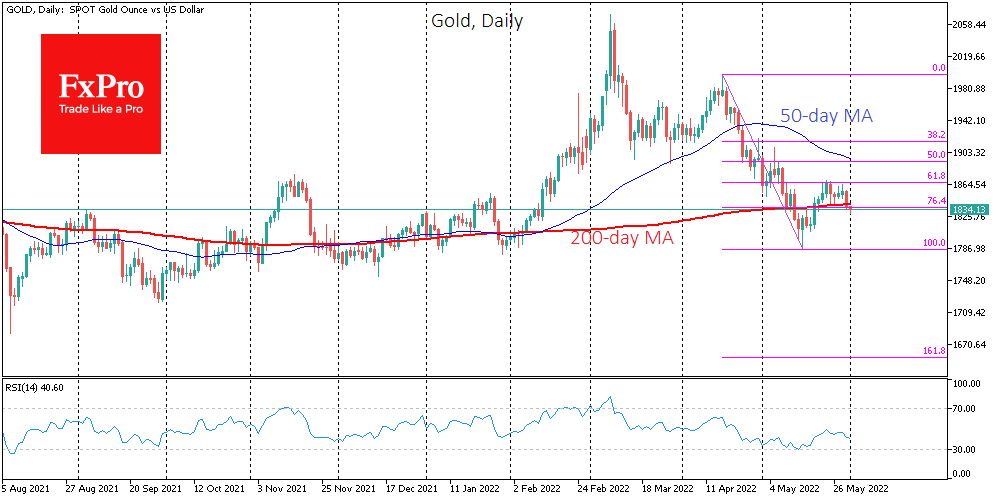
The momentum of the ounce’s decline from April 18 to May 16 took more than $200 from the peak to the bottom and was sharp enough for the bears to need a recharge. However, at the beginning of last week, the rebound began to choke around 61.8% of the initial rally – clearly within the Fibonacci pattern.
Yesterday Gold closed below its 200 SMA, and the debt and equity markets went back to selling. This dynamic is a significant signal that the bounce and consolidation phase ends in a victory for the dollar bulls, which increases the pressure on gold.
By Fibonacci, the final selling point, in that case, would be the 161.8% level of the initial momentum, somewhere around $1650, where the price was by the end of February 2020. That is, before the spike, the subsequent failure, and a long pandemic rally.
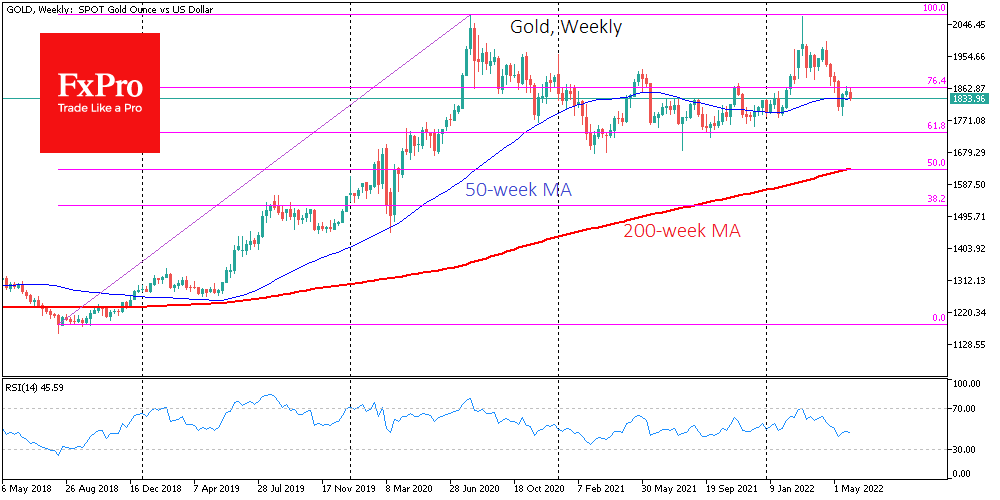
Such a scenario would be very nice, but several factors could prevent it from materialising. Gold has been repeatedly redeemed on dips to the $1750 area in the past year. Inflationary acceleration and geopolitics gradually raised the bar from which purchases prevailed.
There is also a $1750 mark near 61.8% from the 2018-2020 rally, and the bulls can step up the onslaught at the top defence level. If they fail to do so, there could be an absolute capitulation in gold.
The entire decline path can be broken down into several phases. Initially, the bears need to break support at $1780, the previous local lows. Next, the decline may encounter support from more principled buyers in $1740-1750. If the sellers are stronger here, gold could fall back to $1650 before the end of August.
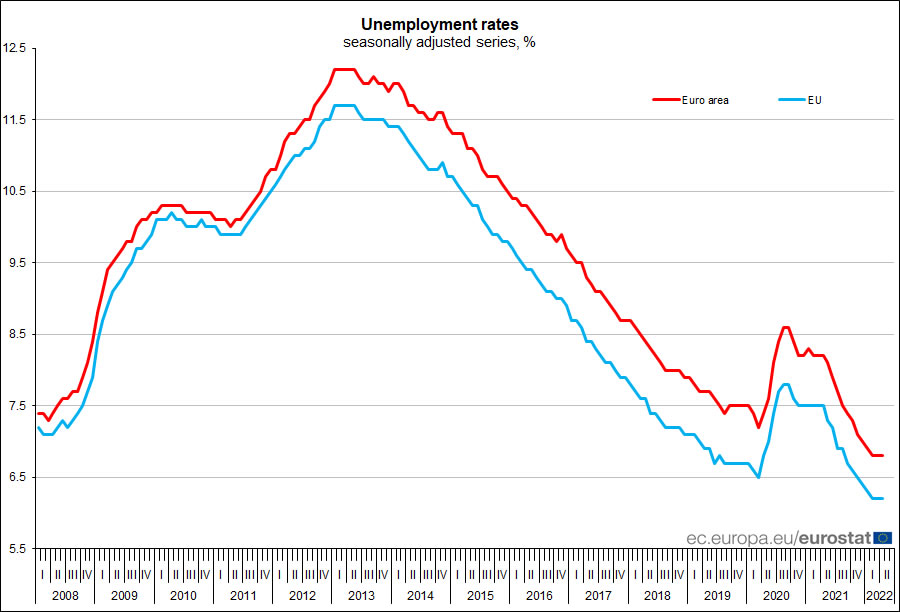
Eurozone unemployment rate unchanged at 6.8%, EU at 6.2%
Eurozone unemployment rate was unchanged at 6.8% in April, above expectation of 6.7%. EU unemployment rate was also unchanged at 6.2%.
Eurostat estimates that 13.264m men and women in the EU, of whom 11.181m in the Eurozone, were unemployed in April 2022. Compared with April 2021, unemployment decreased by 2.543m in the EU and by 2.175m in the Eurozone.
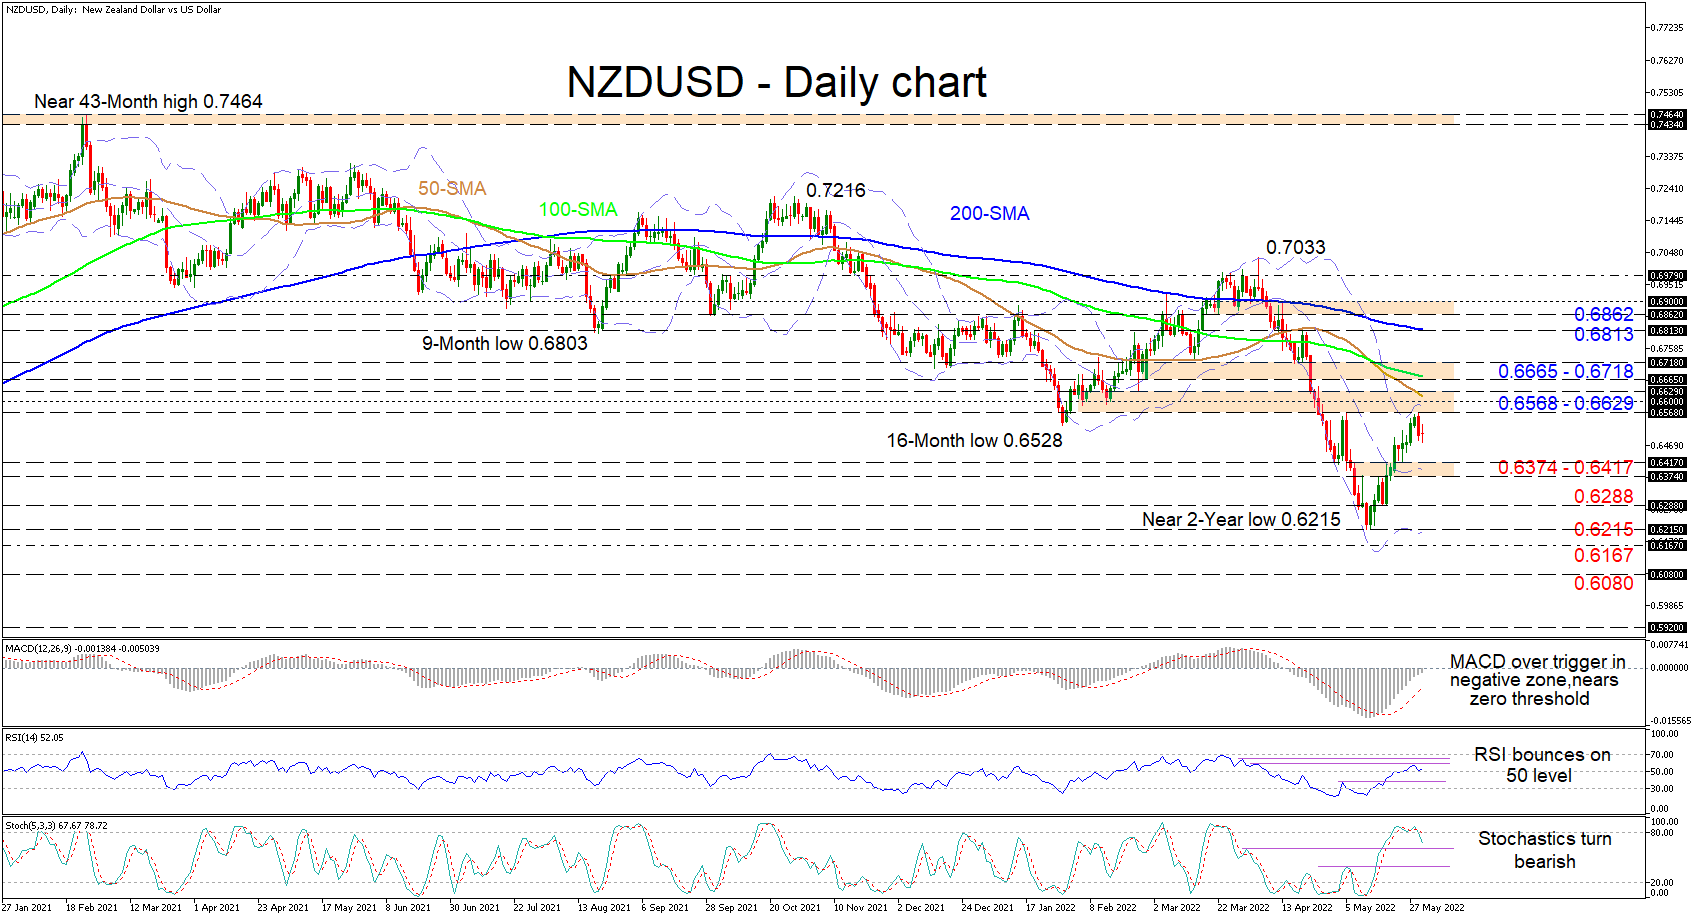
NZDUSD Gains Subside Below MAs and 0.66 Mark
NZDUSD is fading from the vicinity of the upper Bollinger band that is just shy of the 0.6600 handle, both being upside deterrents, which are encapsulated in a resistance boundary established by the May 5 high of 0.6568 and the February 24 inside swing low of 0.6629. The gliding longer-term 100- and 200-day simple moving averages (SMAs), and the diving 50-day SMA, are still promoting the negative trend despite the bounce in the pair from the near two-year low of 0.6215, which has faltered under overwhelming negative obstacles.
The short-term oscillators are currently exhibiting mixed signals in momentum and have yet to compliment a clear direction. The MACD is promoting strong positive forces, improving over its red trigger line towards the zero mark, while the RSI is pointing higher just above the 50 threshold. Meanwhile, the negatively charged stochastic oscillator is suggesting additional dwindling in the price of the pair.
If NZDUSD continues to recede, support could commence from the 0.6374-0.6417 zone that is reinforced by the mid-Bollinger band. In the event downward forces intensify, the 0.6288 low may draw traders’ attention prior to the 0.6215 trough coming under attack. Should sellers sustain command and steer the price past the near two-year low of 0.6215, where the lower Bollinger band also resides, the 0.6167 barrier that extends back to May 2020 could provide downside friction ahead of the 0.6080 mid-May 2020 low.
Otherwise, if buyers re-emerge, profound resistance could stem from the immediate 0.6568 until 0.6629 region. The bulls are not out of the woods even if they overcome this reinforced boundary that contains the upper Bollinger band, the 0.6600 border, and the falling 50-day SMA. This is because an adjacent opposing zone from 0.6665-0.6718 could mute positive developments from gaining further ground. However, if buyers are triumphant, the price may then jump for the 0.6813 high, in line with the 200-day SMA, before challenging the 0.6862-0.6900 resistance band.
Summarizing, NZDUSD’s newfound positive traction over the last two-weeks seems to be running on fumes as bearish forces weigh on the positive outlook. Negative impetus may speed up with a break below the mid-Bollinger band. Yet, for optimism to grow in the pair, the price would need to improve over the 0.6665-0.6718 obstacle.
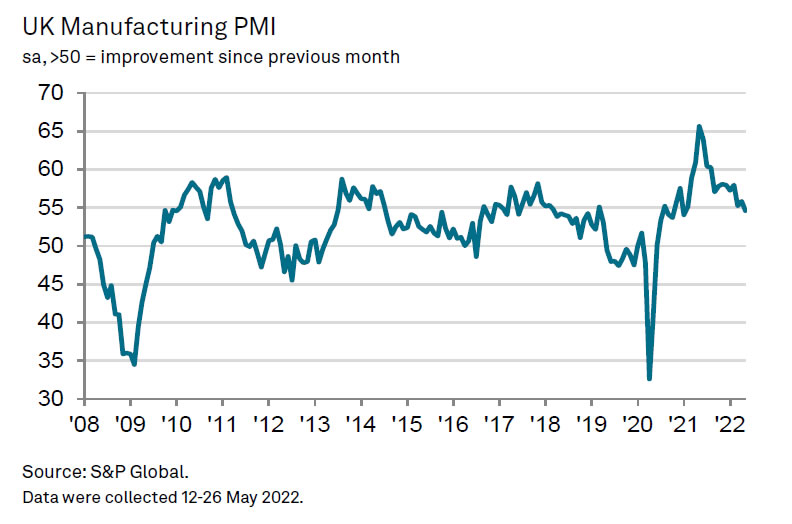
UK PMI manufacturing finalized at 54.6, companies face a barrage of headwinds
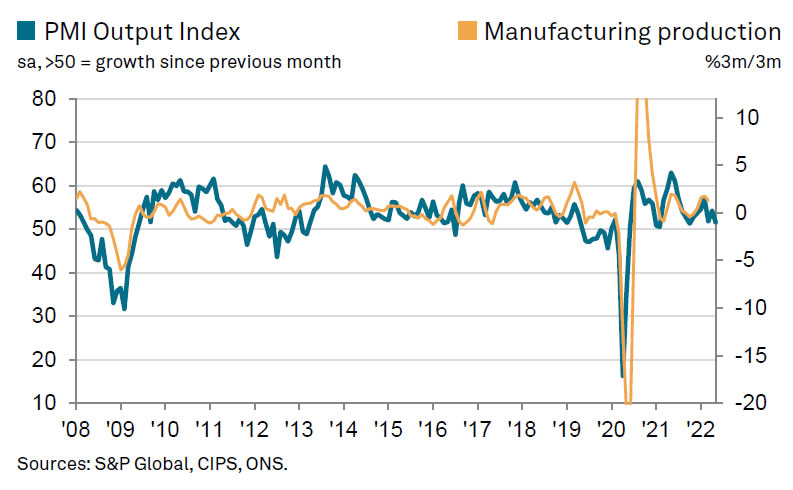
UK PMI Manufacturing was finalized at 54.6 in May, down from April's 55.8. S&P Global said output grew at seven-month low. Consumer goods sector was hit by weaker consumer demand. Input cost and output price inflation remained elevated.
Rob Dobson, Director at S&P Global Market Intelligence, said: "The rate of expansion in UK manufacturing output eased to a seven-month low in May as companies face a barrage of headwinds. Factories are reporting a slowdown in domestic demand, falling exports, shortages of inputs and staff, rising cost pressures and heightened concern about the outlook given geopolitical uncertainties. The consumer goods sector was especially hard hit, as household demand slumped in response to the ongoing cost of living crisis.
"With both input costs and selling prices rising at rates close to April's peaks, the surveys suggest that there is no sign of the inflationary surge abating any time soon. Manufacturers continue to report issues getting the right materials, at the right time for the right price, and energy prices remain a major concern."
USDJPY Extends Rebound off 50-day MA
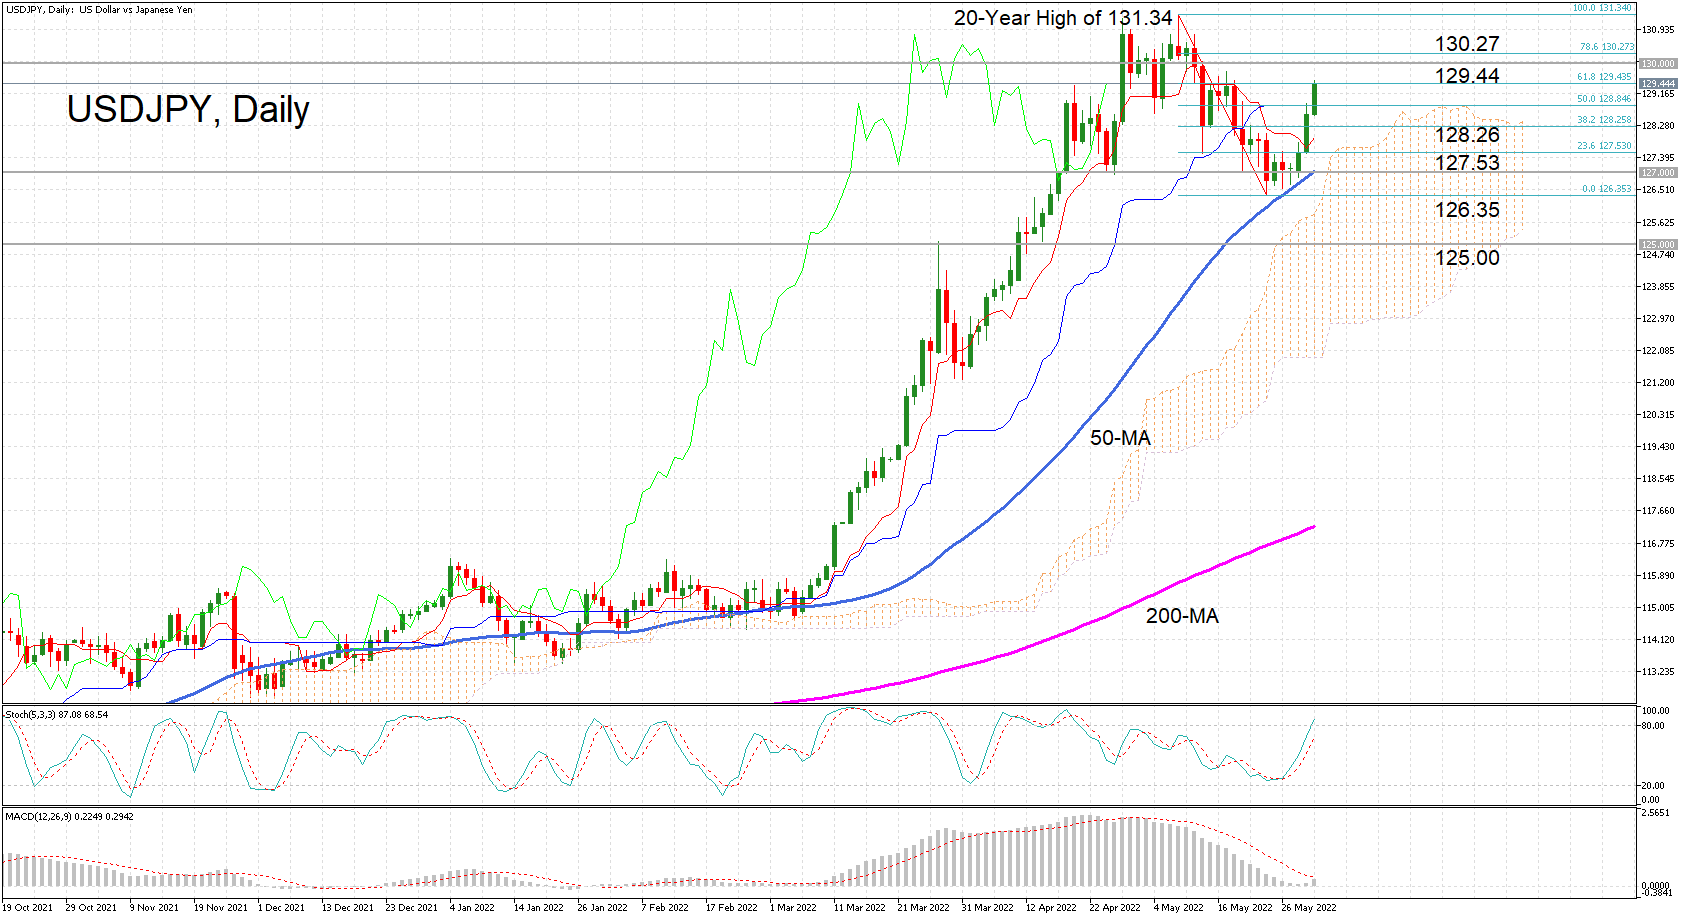
USDJPY is headed for a fourth straight day of gains, having glided off the 50-day moving average (MA) after tumbling to a one-month low of 126.35 on May 24. The pair has now retraced more than half of the May downleg, reaching the 61.8% Fibonacci of 129.44.
The momentum indicators suggest that further gains are possible in the near term. The stochastics are on a decisive path upwards. However, the %K line has crossed into overbought territory, hinting the possibility that the rally could soon run out of steam. In contrast, the MACD histogram has yet to rise above its red signal line, suggesting that the rebound hasn’t gone far enough.
But for the bulls to power ahead, they would first have to overcome the immediate resistance of the 61.8% Fibonacci. A successful break above it would shift focus to the 130 handle and the 78.6% Fibonacci of 130.27. Clearing this hurdle too would set USDJPY on course to re-test the two-decade of 131.34.
A climb above this top is necessary to restore the medium-term uptrend, as the outlook is at risk of turning neutral as the price approaches the Ichimoku cloud.
To the downside, the 38.2% and 23.6% Fibonacci retracements of 128.26 and 127.53, respectively, could stymie any selloff attempts before the price approaches the critical 50-day MA again, which currently stands just at the 127 level. Dropping below 127 would open the way for the 125 barrier, which coincides with the March peak. If this support fails, the medium-term outlook would start to turn more bearish.
To sum up, USDJPY seems to have enough bullish momentum at the moment to revive the Spring rally, but it would first need to surpass May’s 20-year high. If, though, it were to succumb to negative pressures again, the 50-day MA and 125 level would be key in staving off the bears.
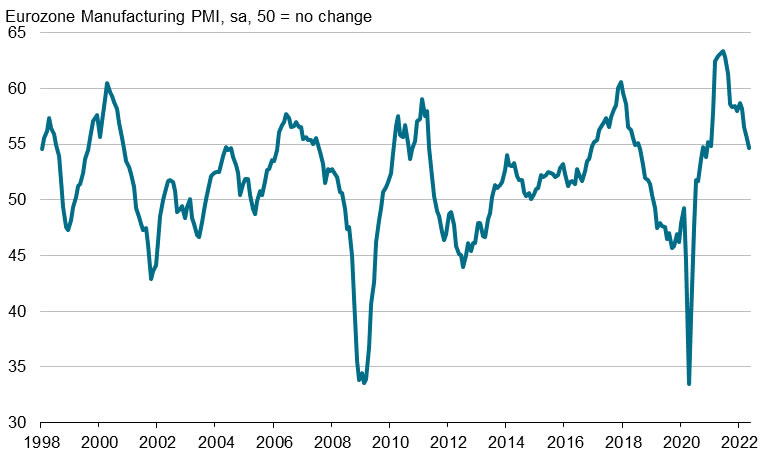
Eurozone PMI manufacturing finalized at 54.6, 18-month low
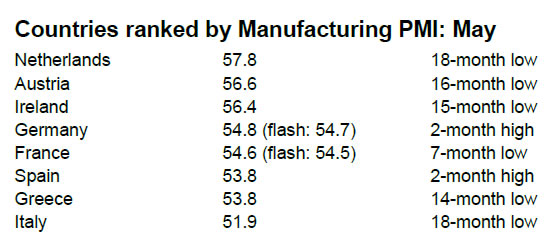
Eurozone PMI Manufacturing was finalized at 54.6 in May, down from April's 55.5. That's the lowest level in 18 months. Looking at some member states, the Netherlands dropped to 18-month low at 57.8. Austria dropped to 16-month low at 56.6. Ireland dropped to 15-month low at 56.4. France dropped to 7-month low at 54.6. Greece dropped to 14-month low at 53.8. Italy dropped to 18-month low at 51.9. Nevertheless, Germany rose to 2-month high at 54.8.
Chris Williamson, Chief Business Economist at S&P Global Market Intelligence said: "Euro area manufacturers continue to struggle against the headwinds of supply shortages, elevated inflationary pressures and weakening demand amid rising uncertainty about the economic outlook. However, the manufacturing sector's deteriorating health has also been exacerbated by demand shifting to services, as consumers boost their spending on activities such as tourism and recreation.
GBP/JPY Daily Outlook
Daily Pivots: (S1) 161.33; (P) 161.84; (R1) 162.74; More...
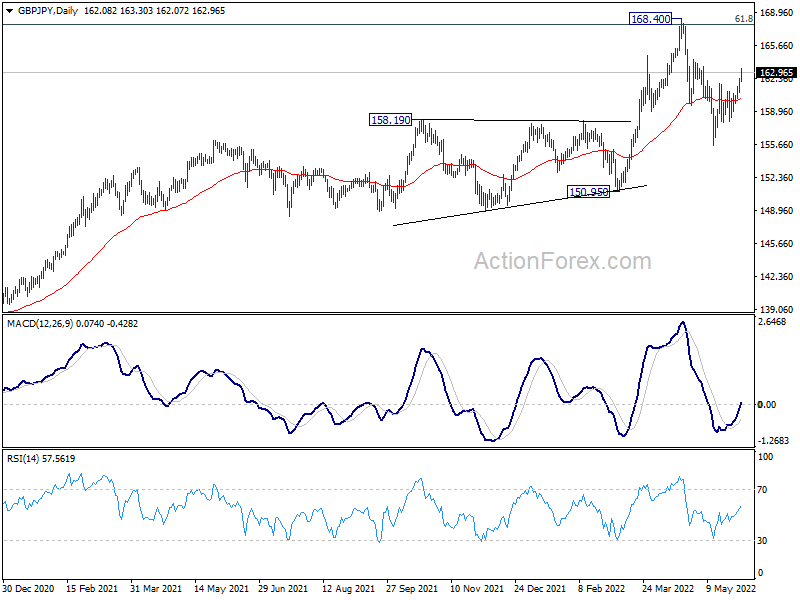
GBP/JPY's rebound from 155.57 resumes by breaking 161.83 minor resistance. Intraday bias is back on the upside for retesting 168.40 high next. Firm break there will resume larger up trend. On the downside, below 160.92 minor support will turn bias back to the downside for extending the correction from 168.40.
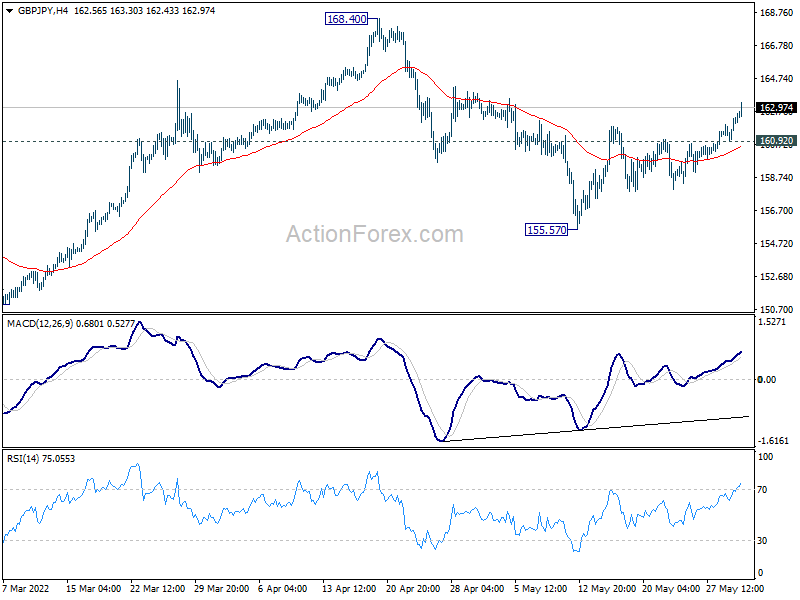
In the bigger picture, up trend from 123.94 (2020 low) is still in progress. Sustained break of 61.8% retracement of 195.86 (2015 high) to 122.75 (2016 low) at 167.93 will be a long term bullish signal, and could pave the way back to 195.86 high. This will now remain the favored case as long as 150.95 support holds, even in case of deep pull back. However, firm break of 150.95 will indicate rejection by 167.93, and bearish trend reversal.
EUR/JPY Daily Outlook
Daily Pivots: (S1) 137.23; (P) 137.73; (R1) 138.67; More....
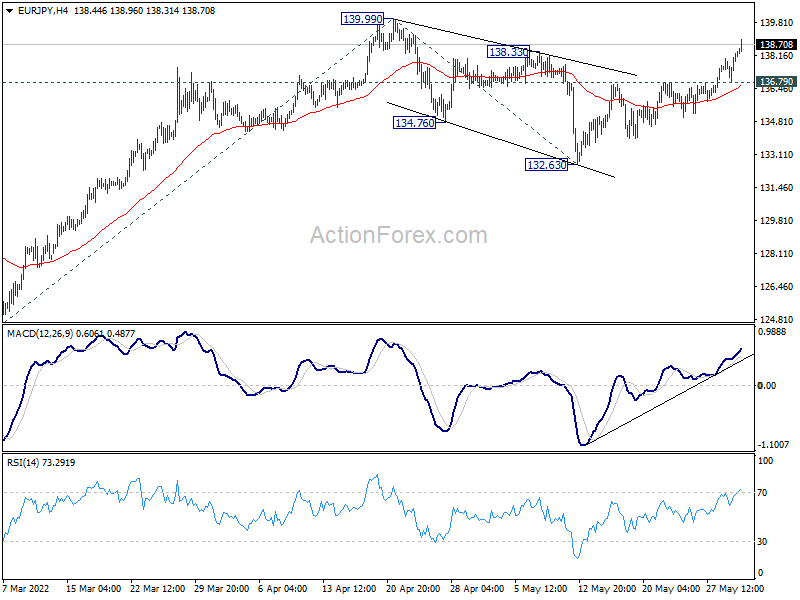
EUR/JPY's break of 138.33 resistance suggests that pull back from 139.99 has completed, and larger up trend is resuming. Intraday bias stays on the up side for 139.99 first. Firm break there will confirm and target 61.8% projection of 124.37 to 139.99 from 132.63 at 142.28. On the downside, below 136.79 minor support will delay the bearish case and turn intraday bias again first.
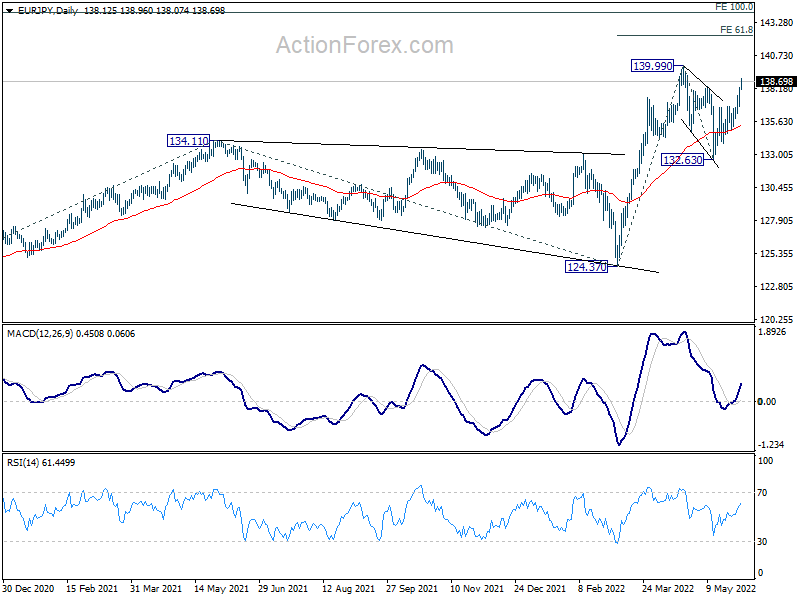
In the bigger picture, up trend from 114.42 (2020 low) is in progress. Such rise is seen as the third leg of the pattern from 109.30 (2016 low). Next target will be 100% projection of 114.42 to 134.11 from 124.37 at 144.06. In any case, outlook will now remain bullish as long as 124.37 support holds, in case of deep pull back.
EUR/GBP Daily Outlook
Daily Pivots: (S1) 0.8495; (P) 0.8512; (R1) 0.8534; More...
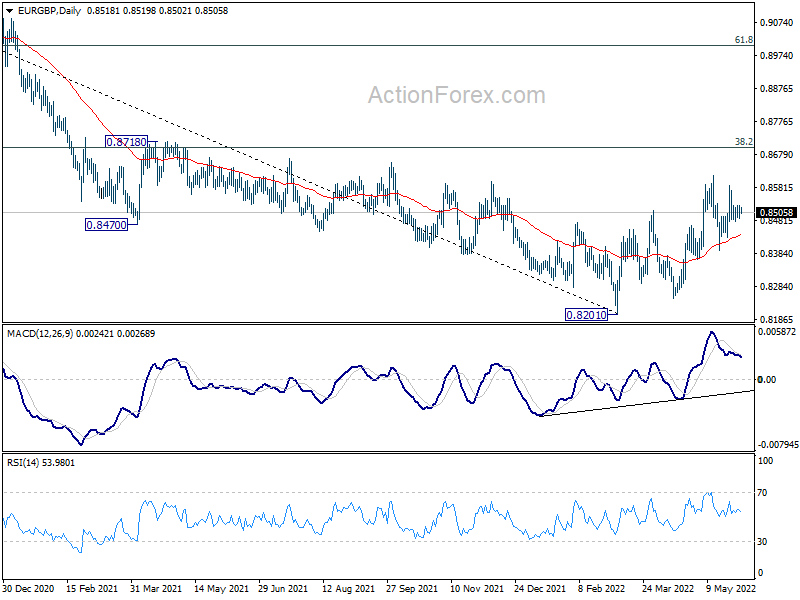
Intraday bias in EUR/GBP stays neutral as range trading continues. Further rally is in favor with 0.8365 support intact. On the upside, break of 0.8617 will resume rise from 0.8201 medium term bottom to 0.8697 medium term fibonacci level. However, break of 0.8365 will dampen this bullish view, and turn bias back to the downside instead.
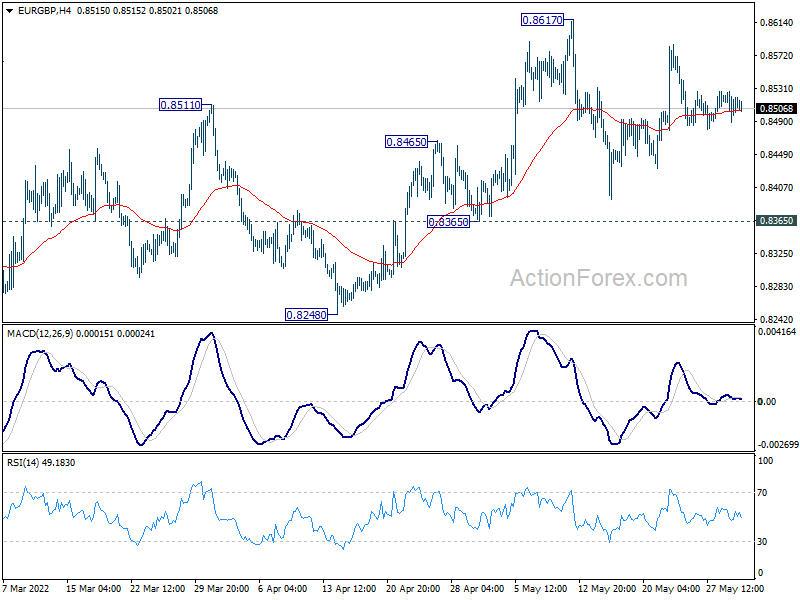
In the bigger picture, a medium term bottom could be in place at 0.8201, on bullish convergence condition in daily and weekly MACD. Rise from there could either be a correction to the down trend from 0.9499 (2020 high), or a medium term up trend itself. In either case, further rise should be seen to 38.2% retracement of 0.9499 to 0.8201 at 0.8697. Sustained break there will target 61.8% retracement at 0.9003.