Sample Category Title
BoJ Wakatabe: Necessary to persistently continue with monetary easing
BoJ Deputy Governor Masazumi Wakatabe said in a speech, "since rises in energy and food prices are mainly caused by cost-push factors from abroad, it is desirable to respond to them through measures other than monetary policy."
"Possible options include fiscal policy and energy policy to reduce Japan's dependence on petroleum and natural gas," he added.
For monetary policy, "it is necessary to persistently continue with monetary easing and thereby continue to steadily support the virtuous cycle in the economy and maintain an environment in which wages rise," he said.
"In addition, if downside risks to the economy materialize, the Bank should not rule out taking the necessary additional easing measures without hesitation."
Fed Bostic: There could be significant reduction in inflation this year
Atlanta Fed President Raphael Bostic said yesterday that a pause in tightening in September might be a good idea, because market responses had been "far stronger than what we've historically seen." "I want to make sure I truly understand the pace of change that's associated with our policy response," Bostic said.
By September, some of the uncertainty over the economy could be resolved. Bostic expected that could lead to a "pretty significant reduction in inflation."
Yet, he's "fully comfortable" to raise interest rates above neutral if inflation doesn't come down. "The goal is to get inflation down. We've got to really tackle it in an intentional, persistent way," he said. "I want to be open to both possibilities."
BoC Policy Meeting: Stick to the Guidance for Now
The Bank of Canada will probably stick to the script on Wednesday at 14:00 GMT, announcing another jumbo rate hike to rein in inflation. The Canadian dollar, however, may not respond aggressively as investors have factored in the rate announcement, while they also expect additional increases during the next months. That said, any warnings about the drawbacks the rate hike cycle may cause, especially on the housing market, could still generate some volatility.
Another sharp rate increase expected
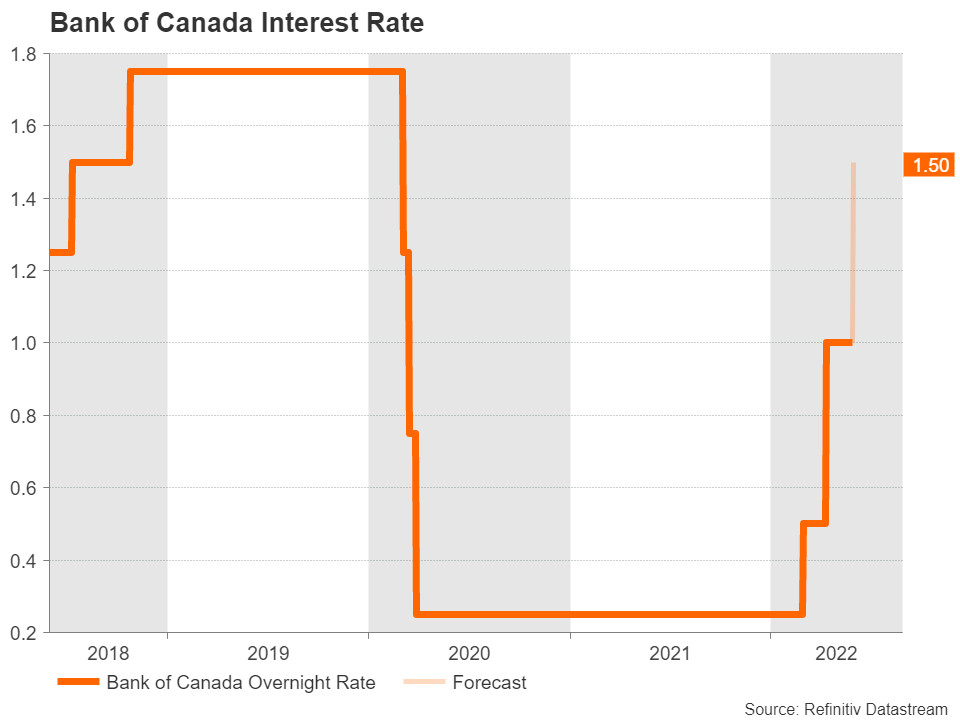
The Bank of Canada (BoC) ramped up its fight against inflation in April, delivering a double 50 bps rate hike during its previous policy meeting and starting the quantitative tightening phase after a normal 25 bps increase in the preceding month. Despite that, the nonstop Ukrainian war and the exchange of sanctions between Russia and the rest of the world have further exacerbated supply jitters and caused another inflation wave, sending the headline CPI to a new three-decade high of 6.8% y/y in April. The increase in food prices has been even more pronounced and imported inflation has been spilling over in domestic markets as well, raising speculations that similar aggressive rate hikes will follow while some analysts have even blamed the central bank for being late in kicking off the tightening phase.
Governor Tiff Macklem did not rule out similar rate hikes in the future, saying that borrowing costs may need to move above the neutral range of 2-3% for a period of time to bring inflation to the target. As a result, investors have become almost certain that the central bank will repeat the super-sized 50 bps rate increase in June to 1.50% and will not stop there, with futures markets pricing in at least one more 50 bps in the coming months.
BoC to stick to its guidance despite recession fears
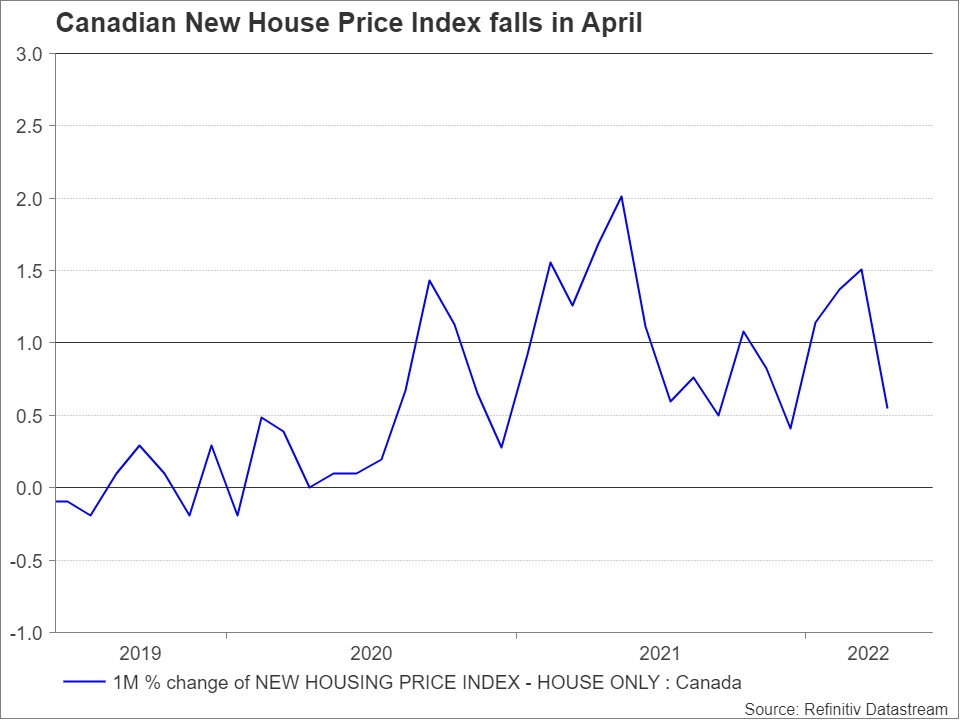
The above policy decision, however, will come at a time when traders are grappling with uncertainty about whether the swift monetary tightening campaign will result in a soft landing or will end up in an economic recession. Discouragingly, the housing sector, which is closely watched in the indebted Canadian economy, has started to show some signs of weakness as the ratio of household debt to disposable income fluctuates at a record high as of 2021Q4. Specifically, home sales dropped by 12.6% m/m in April for the first time in two years and the home price index edged down but remained strongly elevated on a yearly basis.
Following up, quarterly GDP growth figures on Tuesday created some discomfort after revealing a lower-than-expected annualized expansion of 3.1%, though the data did not alter rate hike expectations as domestic consumption sped up on the back of higher labor compensations, offsetting the pullback in exports from temporary supply constraints in the oil sector. The private savings rate rebounded as well, though it remained comfortably below the pandemic peak.
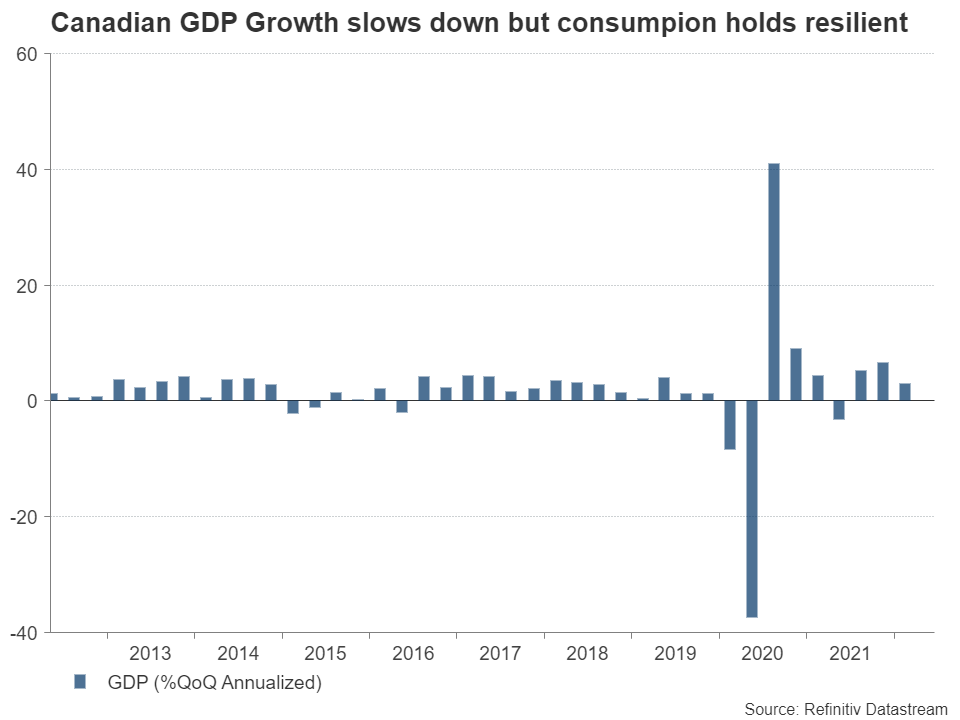
Overall, the Canadian economy is still in good shape and although the diminished labor pool may add constraints to economic growth, the BoC will probably wait for more data evidence that its aggressive strategy is harming the economy before it changes course.
Hence, given the status quo, policymakers will probably stick to the rate hike plan and avoid any serious language twists, and specifically the word recession, as investors are sensitive to any changes in economic outlook.
USD/CAD
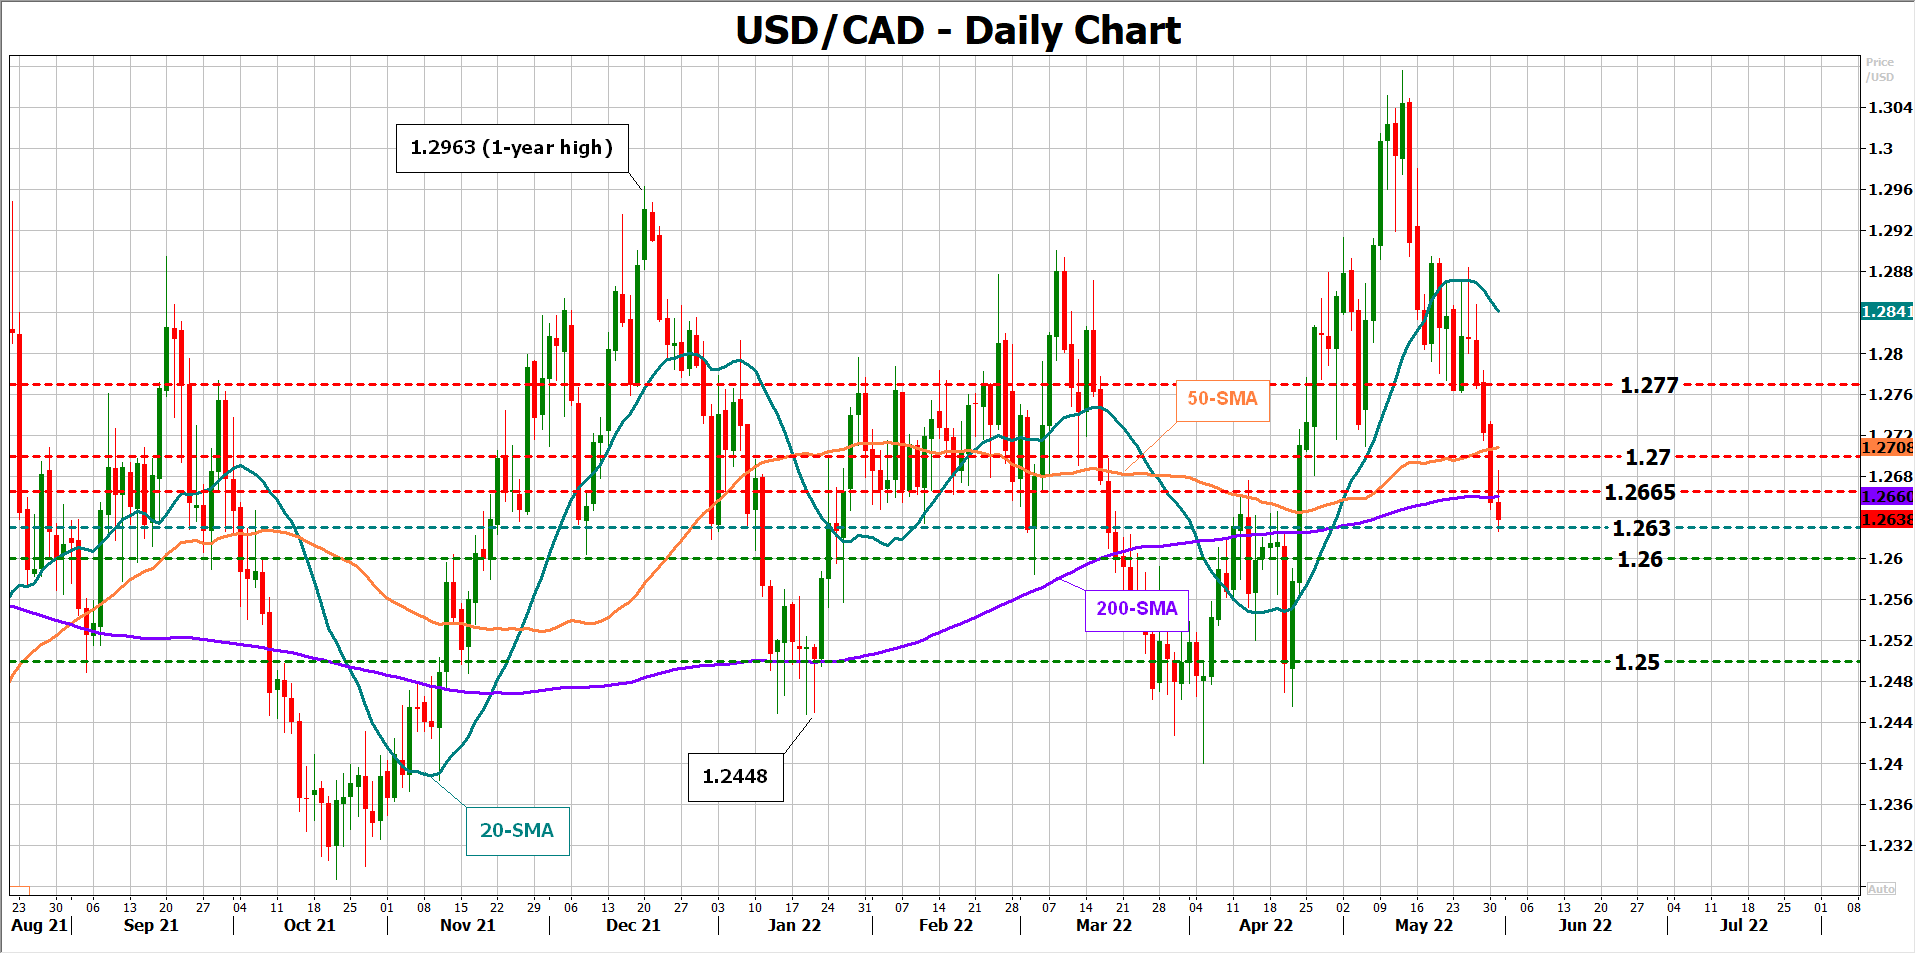
Looking at dollar/loonie, the pair is facing resistance around the 200-day simple moving average (SMA) and the 1.2665 level. For the pair to bounce above 1.2700, the central bank will need to adopt a less hawkish tone, signaling potential adverse economic effects from rate increases and opening the case for an earlier slowdown in the rate hike path than analysts expect.
Otherwise, if the BoC undermines the latest deceleration in the housing market, feeling confident that the economy can absorb additional sharp rate hikes in the year ahead, dollar/loonie could plunge below the 1.2630 – 1.2600 support region and towards the 1.2500 number.
First Impressions: Australian Q1 GDP
Output expands by a moderate 0.8%. Domestic demand robust at 1.6%. Weather disruptions and omicron wave disrupted production. Household saving ratio moderated in Q1, but still elevated at 11.4%.
Output expanded by a moderate 0.8% in the March quarter.
That was broadly in line with market expectations, market median 0.7% and a little above Westpac’s forecast of 0.6%.
Annual growth is 3.3%. The level of activity is 4.5% above that at the end of 2019, prior to the pandemic.
GDP, three measures: the GDP headline is an average of three measures: expenditure, income and production. GDP (E) printed at 0.8% qtr, GDP (I) 0.8% and GDP (P) was 0.7%.
Hours worked: The National Accounts estimate that hours worked declined by -0.9% in the quarter – constrained by wet weather / severe flooding in NSW and Qld, as well as the omicron wave. Recall that the Labour Force Survey reported hours worked down by -1.2%.
State demand: State final demand growth was strongest in Victoria, +2.4%, on the reopening from delta lockdowns, and WA, +2.2%. Qld recorded only a modest 0.8% rise, impacted by wet weather, and NSW was also on the softer side, at 1.2%, impacted by those weather disruptions. Nationally, domestic demand grew by 1.6%, broadly as anticipated.
Key surprises: The key upside surprise was “other inventories” which added 0.4ppts, whereas we had expected a contribution closer to 0.1ppt. Farm stocks, added 0.2ppts, run down at a slower rate, after a sharp Q4 decline. Public authorities inventories added 0.2ppts as well, with a sizeable accumulation – factors can range from stockpiles of covid vaccinations to gold.
The consumer: Total consumer spending increased by 1.5%, broadly as expected.
Spending on discretionary goods and services increased 4.3%, exceeding pre-pandemic levels for the first time. The reopening of domestic and international borders contributed to rises in transport services (+60.0%), recreation and culture (+4.8%) and hotels, cafes and restaurants (+5.3%). Purchase of vehicles rose 13.0% as supply constraints eased.
Essential spending declined 0.2%. Expenditure on food declined 2.0%, reflecting the continued shift towards eating out as restrictions eased. Spending on health also fell as elective surgeries and visits to health practitioners were cancelled as Omicron cases increased
Household saving ratio: Understandably, with the reopening, the household saving ratio moderated. The ratio is at 11.4% in Q1, down from a 13.4% in Q4 and after spiking to 19.7% in Q3 (associated with the delta lockdowns which constrained consumer spending and boosted by government payments).
Incomes were somewhat better than expected in the quarter, supportive of the saving ratio.
The saving ratio is still elevated at 11.4% – well above the “equilibrium rate”, which is in the order of 6%. Prospects for a further moderation in the saving ratio will support spending going forward.
Expenditure detail:
Home building activity declined, down by -1.0%, impacted by wet weather and supply headwinds (shortages of labour and materials). That was a little weaker than the partial (a -0.1%).
Business investment advanced by 1.4%, somewhat stronger than the 0.4% expected. Equipment spending rose by 3.2%, largely reversing declines over the second half of 2021 associated with delta. That was stronger than the capex survey reading of 1.2%.
Public demand expanded by 2.6%, bouncing back from a rare decline, -0.1%. Government spending has been a key growth driver – led by the health response to covid, as well as an uptrend in investment.
Net exports -1.7ppts, a hefty subtraction on a flood of imports, +8.1%, representing a catch-up following weakness over the second half of 2021 associated with the delta lockdowns.
Total inventories added 1.0ppt. Other inventories added 0.4ppts, as discussed above. A rebuild of non-farm business inventories on a flood of imports (adding 0.6ppts).
Eco Data 6/1/22
[php_everywhere instance="1"]
US Dollar Turns to Jobs Report for More Fuel
The latest US employment report will hit the markets at 12:30 GMT Friday. Forecasts and business surveys point to another solid report, although there are some signs that the labor market might be running into trouble. As for the dollar, the recent retracement still seems like a correction within a broader uptrend, not a turning point.
Hiring slowdown? Not yet
Market participants are turning pessimistic about the economy, sensing a slowdown in growth around the corner. Mortgage rates have gone through the roof in recent months and that has already started to impact the housing market, with home sales falling sharply in recent months.
Meanwhile, businesses are warning they could lay off workers as they struggle to manage costs. Rising inflation is threatening to eat into profit margins and many juggernauts like Amazon and Facebook have already announced plans to freeze hiring.
And if this shift is happening at trillion-dollar companies, it is most definitely happening in smaller firms too, where labor costs make up a larger share of total expenses. In other words, executives are looking at a potential slowdown in America and an even worse environment abroad, and have therefore started to play defense.
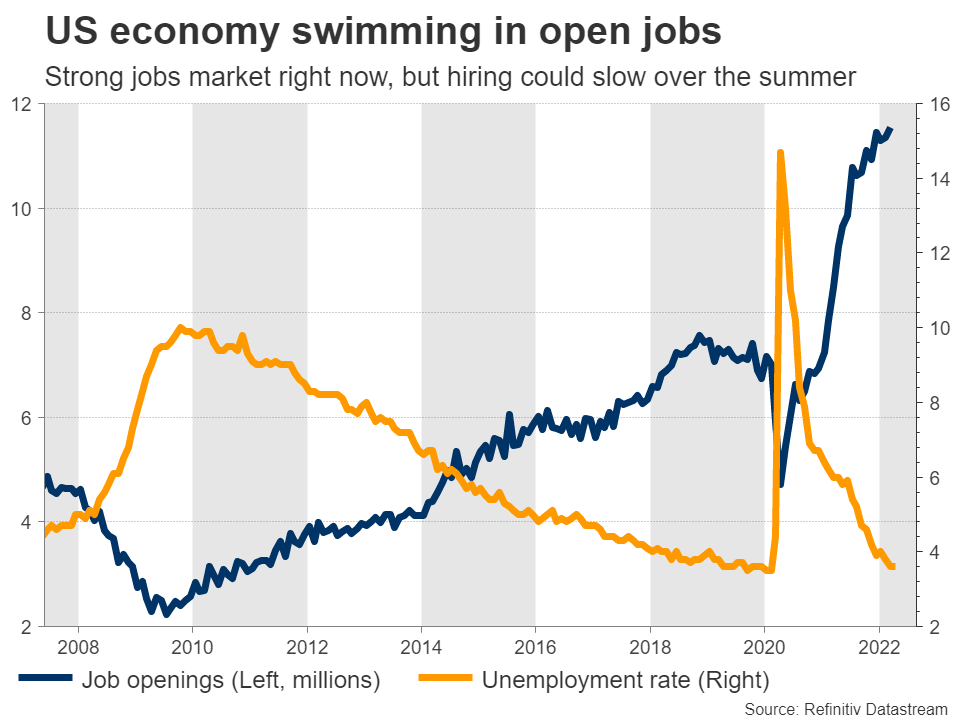
On the bright side, it is probably too early for all this to show up in this dataset since the shift is just beginning. It is likely a story for the summer.
Solid report expected
Nonfarm payrolls are expected to clock in at 320k in May while the unemployment rate is seen at 3.5%, which would be the lowest in five decades. The forecasts are supported by the S&P Global composite PMI that showed another healthy increase in employment. However, jobless claims rose during the survey week, which suggests layoffs are becoming more frequent.
If the employment data is solid overall, traders will turn their focus to the wage component. Job gains are a backward-looking metric whereas wages are considered a forward-looking indicator that can predict inflationary pressures. That’s why the Fed and investors pay such close attention to it.
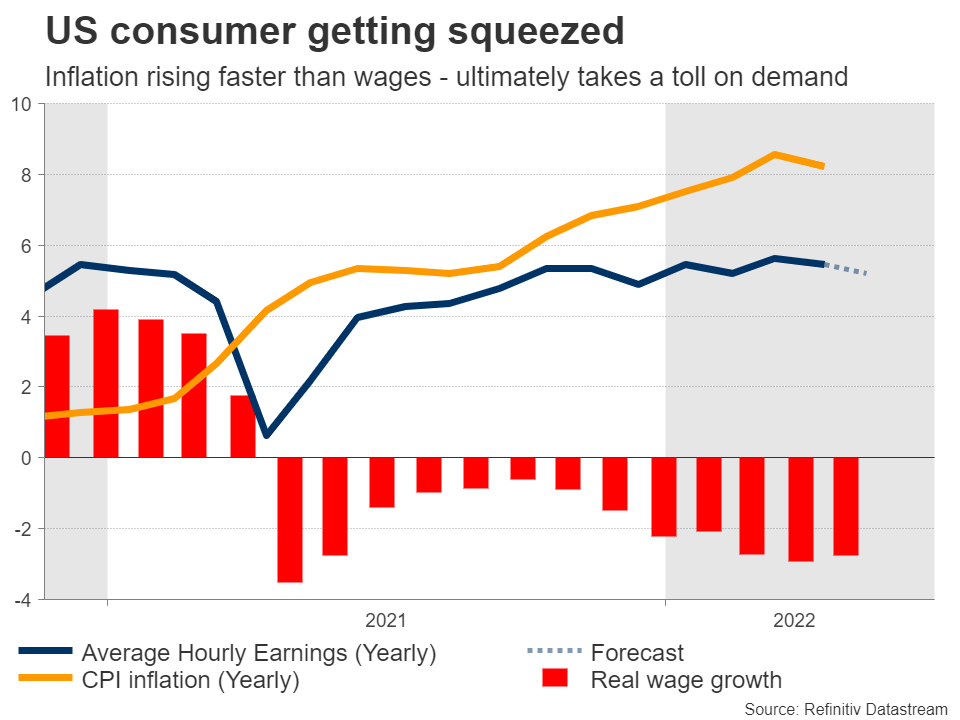
Wage growth is expected to have lost some steam, with average hourly earnings forecast to slow to 5.2% in yearly terms from 5.5% previously.
Trading playbook and dollar outlook
In the markets, the classic playbook is that the dollar tends to spike higher or lower on the employment report depending on whether it was stronger or weaker than expected, and then retrace the initial move in the following minutes.
This has been a consistent phenomenon over the last couple of years - traders fade the initial spike. Nonfarm payrolls have essentially turned into an intraday volatility event, not something that can start entire trends like in the past.
In the big picture, the outlook for the dollar seems positive despite the latest pullback. The Fed intends to press ahead with raising interest rates, and even though the US economy seems to be losing power, the situation in Europe and China is much worse. And if there is a global recession, that usually benefits the dollar as capital flows into the reserve currency.
Until the outlook for economic growth in the rest of the world begins to improve, it’s difficult to call for any trend reversal.
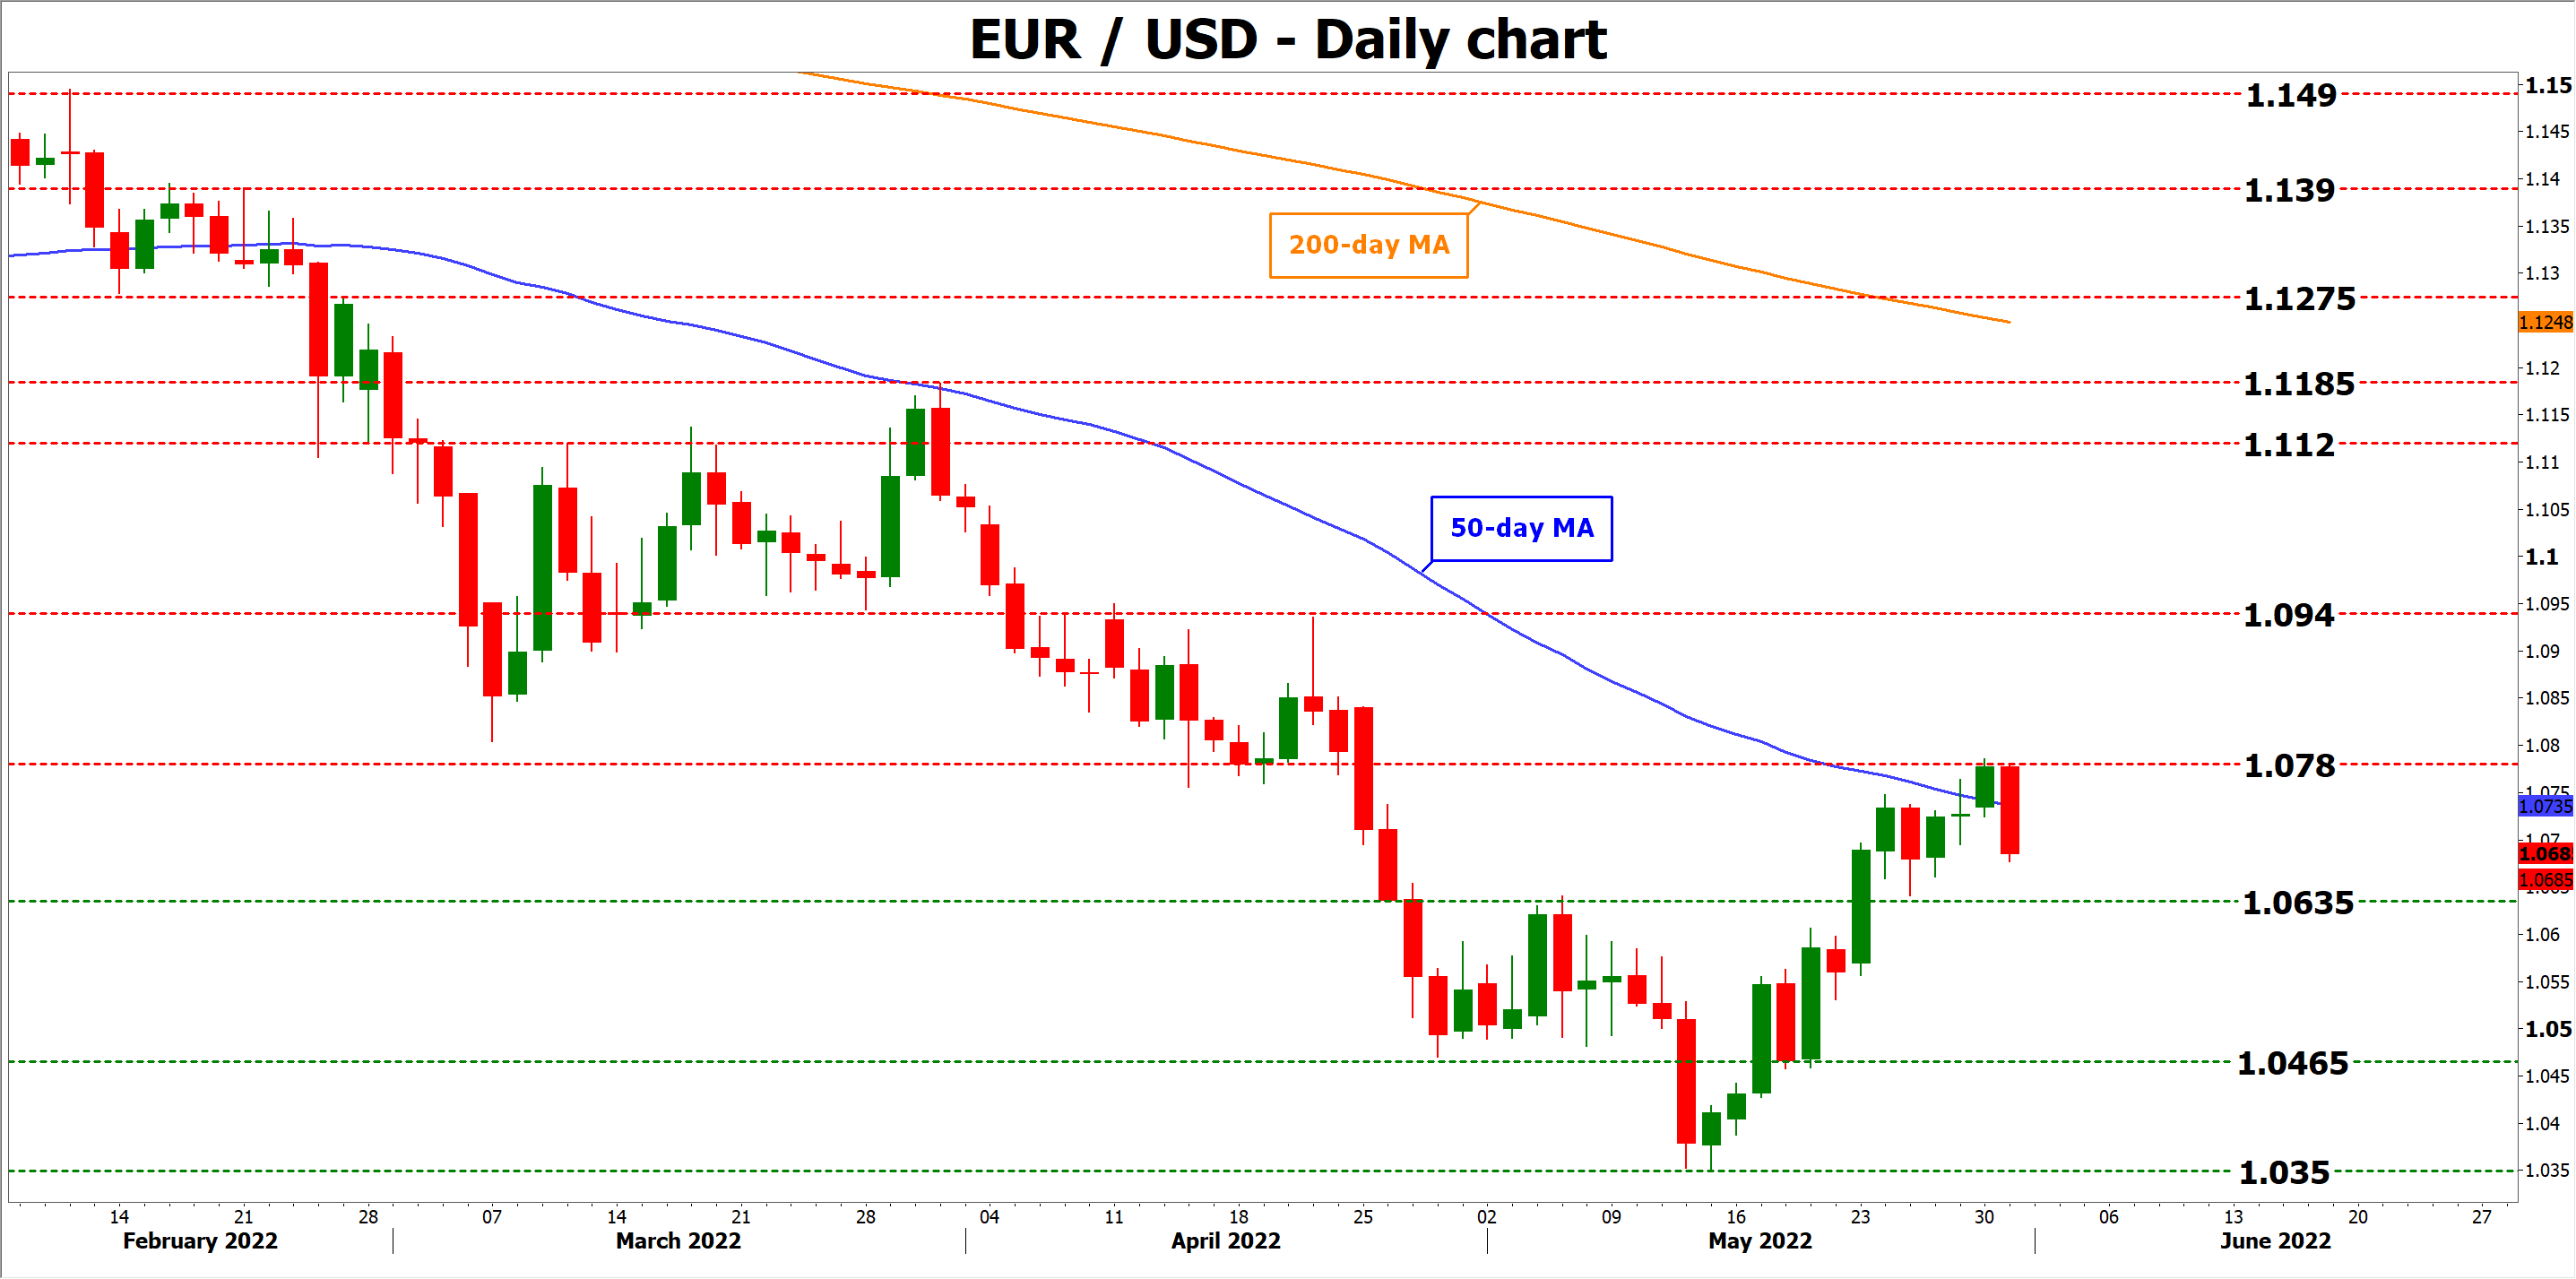
Taking a technical look at euro/dollar, the pair seems to have been rejected from its 50-day moving average, which also suggests the latest move was a correction and not a reversal. If sellers manage to pierce back below 1.0635, their next target could be the 1.0465 region.
On the upside, a move back above the 50-day MA and the 1.0780 area could open the door for another test of 1.0940.
Ahead of the official employment data on Friday, the ADP jobs report and the ISM manufacturing PMI on Wednesday could give investors a taste of what to expect.
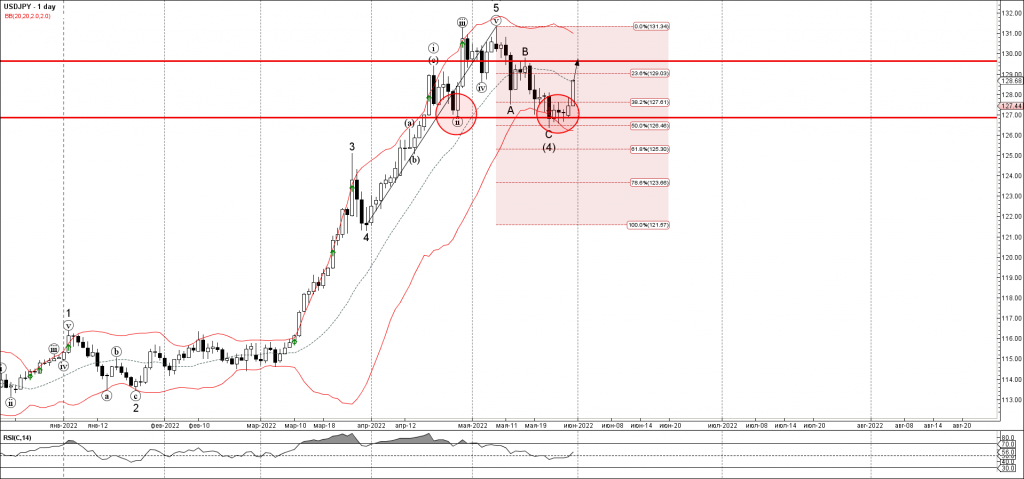
USDJPY Wave Analysis
- USDJPY reversed from support level 127.00
- Likely to rise to resistance level 129.65
USDJPY recently reversed up from the key support level 127.00 (which stopped wave (ii) in April), intersecting with lower daily Bollinger Band and by the 50% Fibonacci correction of the previous sharp upward impulse 1 from March.
The upward reversal from the support level 127.00 started the active impulse wave (5).
Given the clear daily uptrend, USDJPY can be expected to rise further toward the next resistance level 129.65 (top of wave B from the middle of May).
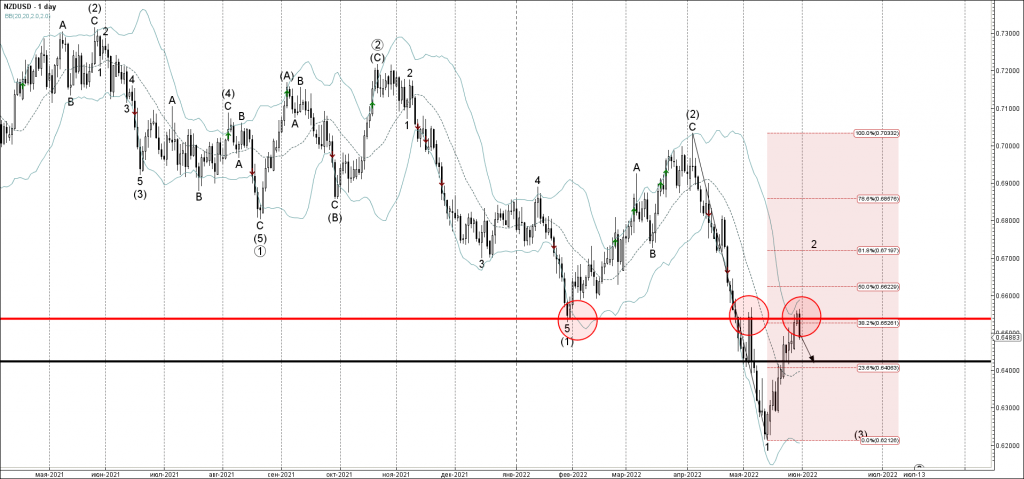
NZDUSD Wave Analysis
- NZDUSD reversed from resistance level 0.6535
- Likely to fall to support level 0.6425
NZDUSD recently reversed down from the key resistance level 0.6535 (top former multi-month low from January).
The resistance area near the resistance level 0.6535 was strengthened by the upper daily Bollinger Band and by the 38.2% Fibonacci correction of the previous sharp downward impulse 1 from April.
Given the strong downtrend and strong USD inflows, NZDUSD can be expected to fall further toward the next support level 0.6425.
Gold Report: Gold Market’s Gloomy Outlook
For the past several days, Gold’s price showed a rather muted reaction to the general news and shied away from major price swings. However, traders’ interest in the Gold market remains unending and the recent quiet price action may be even lifting suspicion as to the further direction the instrument may follow. With this outlook we aim to present the key information affecting Gold prices in the past days but also matters that could be useful in the next days. As a closure, our technical analysis could provide knowledge on important trading levels.
With Gold’s price being denominated in USD, traders main focus tends to gravitate towards the economic developments in the US. It was very characteristic that Gold’s most significant daily movements in the past week, were performed between the 23rd and 24th and of May. On the 23rd of May, Gold moved higher possibly after Atlanta Fed’s President Raphael Bostic referred to the heightening inflationary pressures bringing in focus a subject that may have not been clearly emphasized so far. Tons of information has been written about higher energy prices and supply chain disruptions that have led to low supply of goods. However, President Bostic indicated that a shortage of workers to produce goods is equally impacting the overall supply chain. Despite the US economy keeping a rather low unemployment rate, millions of job openings are kept vacant and are unable to be filled at the moment. In addition, again as per President Bostic, expanding the labor force will not be easy. In our opinion, the news seems to bring to light a hurdle that could take considerable time to be mended. Gold prices could have received some support after traders are constantly coming across evidence pointing to a prolonged return to lower inflation rates as available workers seem to be less than the open job vacancies.
Moreover, Gold finished positive on the 24th of May probably supported by fresh economic data indicating some weakness in important sectors. Both manufacturing and services PMI data dropped lower in May, with the second dropping lower than what the market expected. The news may have invited some buying interest for Gold prices, with traders turning to the shiny metal as a counter for economic uncertainty. We must note that the data may not be as worrying as some may believe given that the readings remain comfortably above 50 for now. However, we are seeing some stabilization for the time being and Gold’s upward movement can be seen as controlled. Overall, we see the market somewhat in a wait and see position. If more economic data from the US comes up questionable, we may see Gold prices strengthening.
In the following days, Gold traders have a range of important economic releases to watch out for. The star of the week comes on the 3rd of June with the US employment report for May. This event has traditionally caused strong volatility across the board and we may see Gold prices carrying out large swings. Moreover, on the 1st of June we get the ISM Manufacturing PMI and on the 3rd of June the ISM non-Manufacturing figures, both for May. On the second of June we get the weekly initial jobless claims which is also worth considering.
Technical Analysis
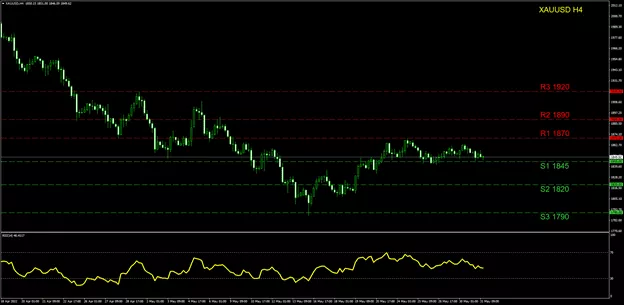
XAUUSD Daily
Since the 23rd of May, Gold has been moving in a sideways motion within the (R1) 1870 resistance and the (S1) 1845 support. Since the range is currently occupied by the price action, we must highlight the (R1) and (S1) as significant barriers for an upward or downward trend accordingly. However, at the moment to the RSI may be showing some selling interest with the indicator running across the 45 level. In the scenario of a breach above the (R1) 1870 line, we may see the (R2) 1890 barrier coming into play, while in an extreme bullish trend we may also view the price action engaging the (R3) 1920 hurdle. On the other hand, if the (S1) is breached, we may see a move to the (S2) 1820 being carried out while even lower the (S3) 1790 support coming into play.
Euro Drops as EU Bans Russian Oil
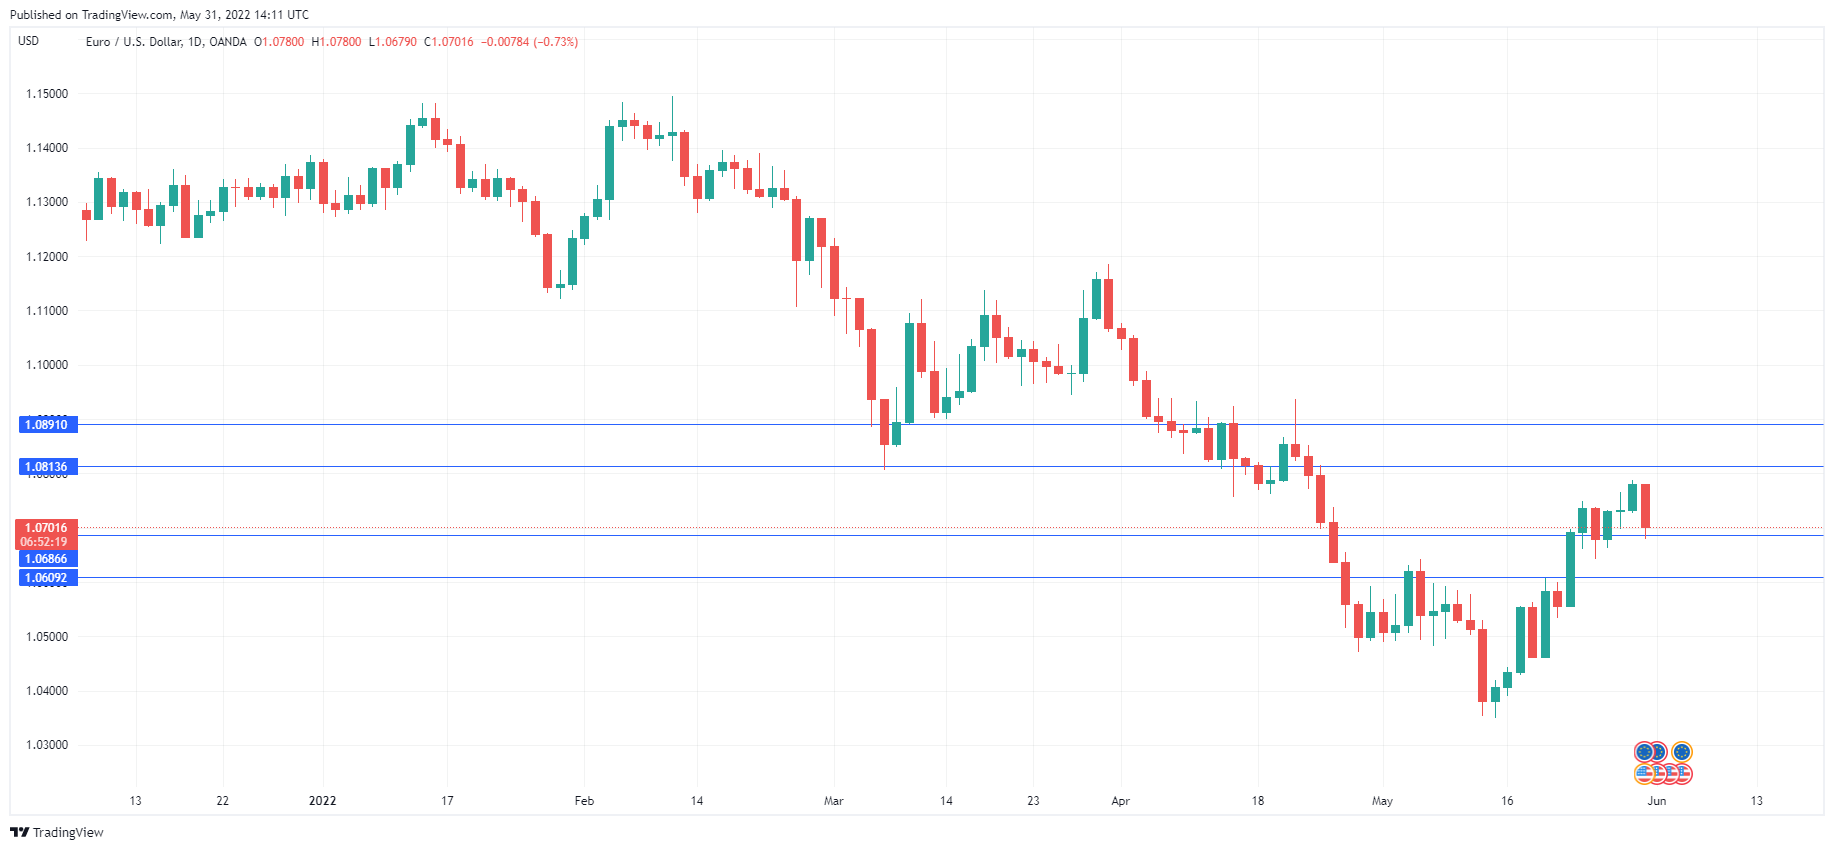
The euro is seeing red on Tuesday and dropped below the 1.07 line earlier. In the North American session, EUR/USD is trading at 1.0707, down 0.67% on the day.
EU to block most Russian oil
The EU announced on Tuesday that it had reached an agreement to ban most Russian oil imports by the end of this year. The dramatic move is a compromise in which the ban will apply to oil that arrives by sea, with an exemption for land (pipeline) oil imports. This will allow Hungary and other countries to continue to receive Russian oil. With Germany and Poland also ending pipeline imports, some 90% of Russian oil exported to Europe will be blocked. The move has sent crude oil prices higher and sent the euro sharply lower, as the new sanctions are sure to take a toll on the eurozone economy.
It’s up, up, up, for Eurozone inflation. In May, CPI hit 8.1%, setting a new record high for a seventh straight month. This was higher than the April record high of 7.4% and above the forecast of 7.8%. The reading comes on the heels of Germany’s May CPI, which surged to 8.7%. This was sharply higher from 7.8% in April and above the forecast of 8.0%. France and Spain also reported an acceleration in inflation.
The ‘usual suspects’ driving inflation are at play, with the war in Ukraine and upward pressures on energy and food prices showing no signs of easing anytime soon. As inflation is broad-based, there are forecasts that Germany’s inflation rate could top 10%. The EU’s plan to block most Russian oil imports has sent oil prices even higher, which will only exacerbate inflationary pressures in the eurozone.
EUR/USD Technical
- There is resistance at 1.0736 and 1.0865
- EUR/USD is testing support at 1.0648. The next support line is at 1.0519