Sample Category Title
EUR/AUD Daily Outlook
Daily Pivots: (S1) 1.4889; (P) 1.4941; (R1) 1.5006; More...
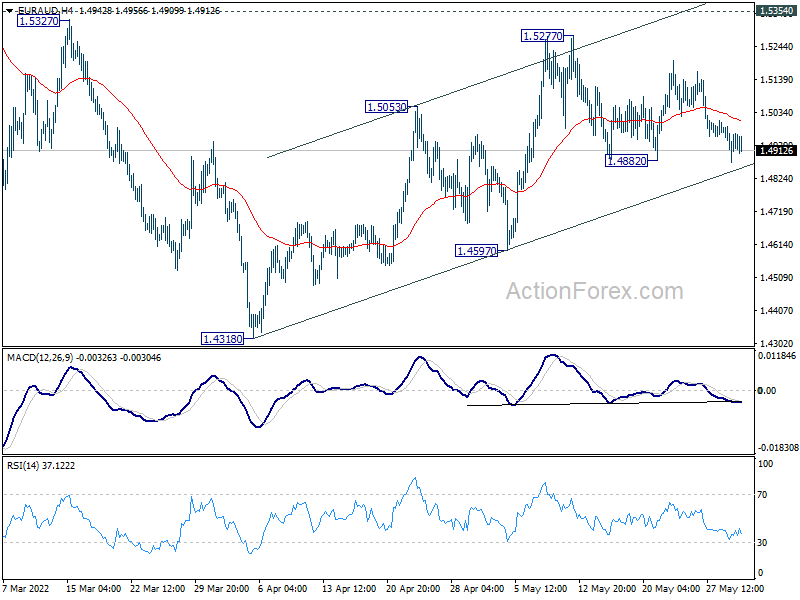
Intraday bias in EUR/AUD remains neutral and outlook is unchanged. On the downside, break of 1.4882 support will reaffirm that case that corrective rebound from 1.4318 has completed at 1.5277, ahead of 1.5354 resistance. Deeper fall would be seen to 1.4597 support, and then 1.4318 low. Also, risk will stay on the downside as long as 1.5277 resistance holds.
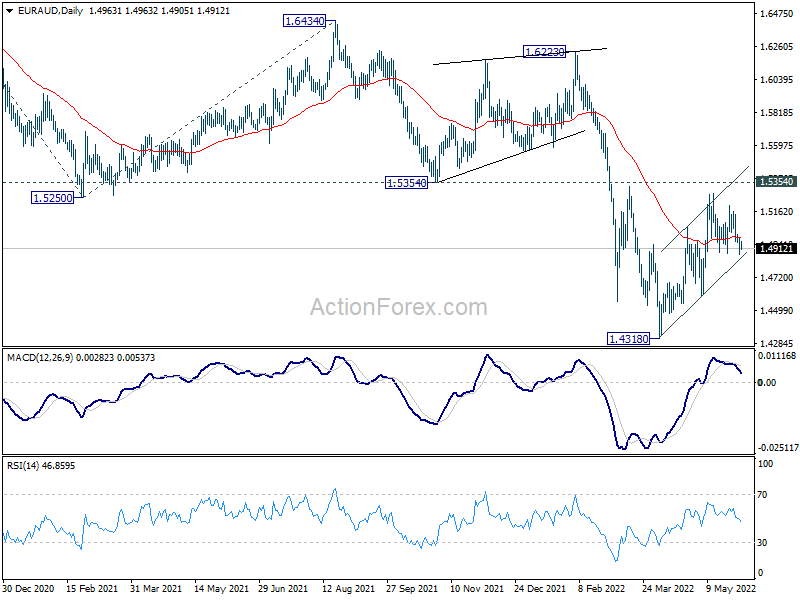
In the bigger picture, as long as 1.5354 support turned resistance holds, larger down trend from 1.9799 (2020 high) is still expected to continue. On resumption, next target is 61.8% projection of 1.9799 to 1.5250 from 1.6434 at 1.3623, which is close to 1.3624 long term support (2017 low). However, firm break of 1.5354 will indicate medium term bottoming and bring stronger rally back to 1.6434 key resistance.
EUR/CHF Daily Outlook
Daily Pivots: (S1) 1.0257; (P) 1.0296; (R1) 1.0337; More....
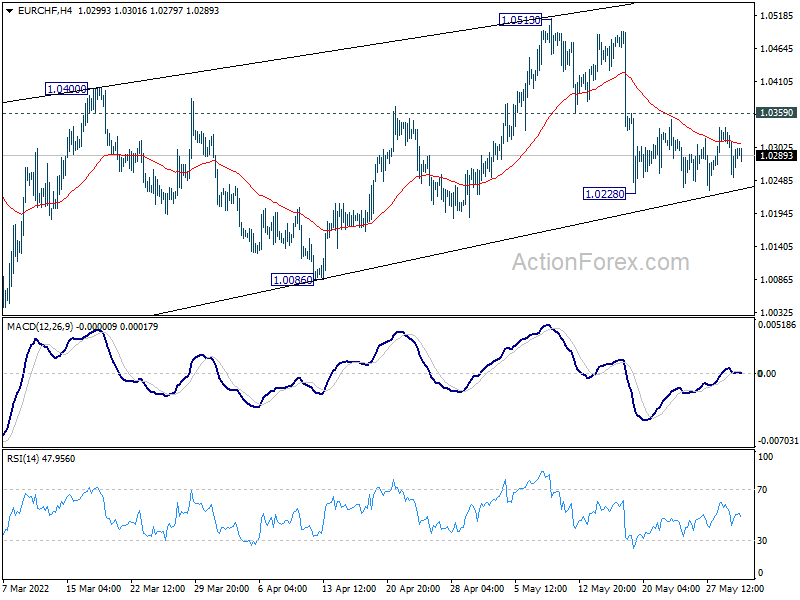
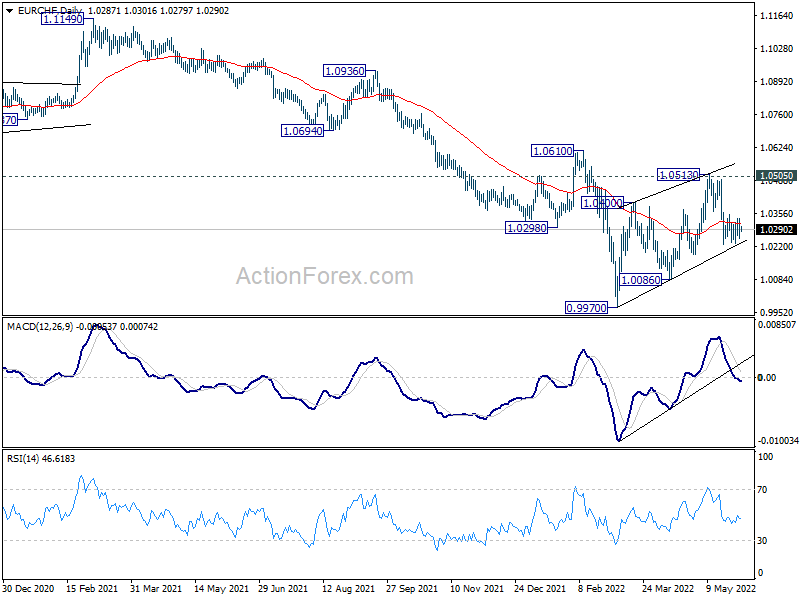
EUR/CHF is staying in consolidation from 1.0228 and intraday bias remains neutral. Further fall is expected with 1.0359 resistance intact. On the downside, below 1.0228 will reaffirm the case that corrective rebound from 0.9970 has completed at 1.0513. Deeper fall would be seen to 1.0086 support next. However, above 1.0359 will dampen this bearish view and bring stronger recovery back towards 1.0513 resistance.
In the bigger picture, as long as 1.0505 support turned resistance (2020 low) holds, long term down trend from 1.2004 (2018 high) is expected to continue. Next target is 100% projection of 1.2004 to 1.0505 to 1.1149 at 0.9650. However, firm break of 1.0505 will suggest medium term bottoming, and bring stronger rebound towards 1.1149 structural resistance.
The Lack of Desperation in Crypto for a Real Rally
Bitcoin slowed late Tuesday afternoon, retreating from local highs near $32.3K to $31.5K. Ethereum has lost 2.5% in the past 24 hours to $1930. Other altcoins in the top 10 are losing between 0.3% (BNB) and a 6.5% increase (Cardano) over the day.
Total cryptocurrency market capitalisation, according to CoinMarketCap, declined by 1.3% overnight to $1.30 trillion. Bitcoin’s dominance index rose another 0.3% to 46.3%. The cryptocurrency fear and greed index were up 1 point to 17 by Wednesday but still in “extreme fear”.
Bitcoin updated three-week highs above $32,300 on Tuesday, continuing the previous day’s rising momentum. According to CoinShares, institutional investors invested $87 million in crypto funds last week, reaching $0.52 billion since the start of the year.
Glassnode notes that most HODLers continue to build up their positions in bitcoin. A possible signal of the end of the bear market could be the capitulation of long-term investors, who sold BTC last week at an average loss of 27% compared to the quotes at the time of purchase.
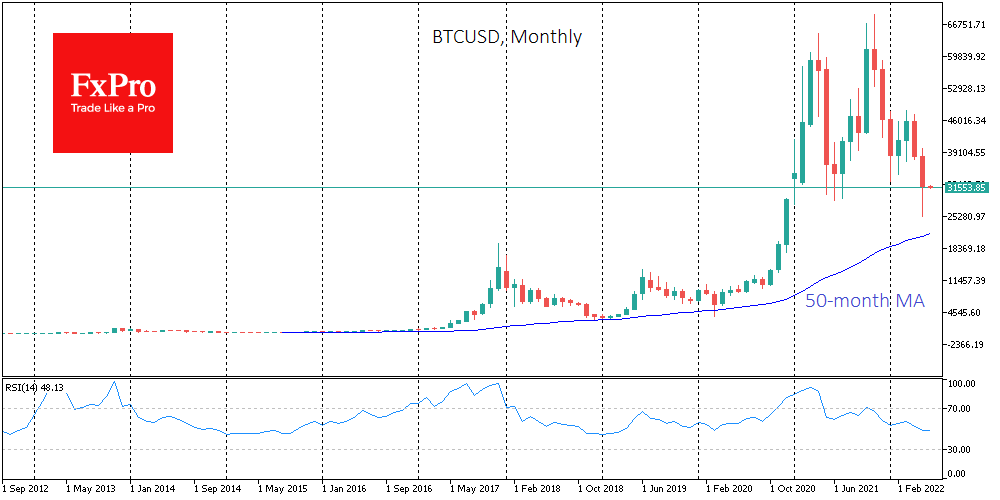
The crypto market is still full of optimists, while a real bull market is more likely to sprout from despair or oblivion. We saw despair in March 2020 and an example of oblivion – more than a year of decline since the December 2017 peaks. It has now been half as long, so we should be prepared to see a rally in a falling market in the coming months, but not a repeat of the October 2020 to April 2021 rise.
Bitcoin ended May down 17.1%, failing to live up to historical trends indicating a relatively successful month. The crypto market was adversely affected by the collapse of the Terra ecosystem. According to Glassnode, Luna Foundation Guard sold 80,081 BTC in May to support the UST stablecoin.
In terms of seasonality, June is considered a relative success for BTC. Over the past 11 years, bitcoin has ended the month up seven times and down four. The average rise was 16.7%, and the average drop was 11.3%. In the first case, BTC could end June at around $37,000, recouping almost all of May’s decline, while in the second, it could end June at near $28,200.
Daily Technical Analysis
EUR/USD
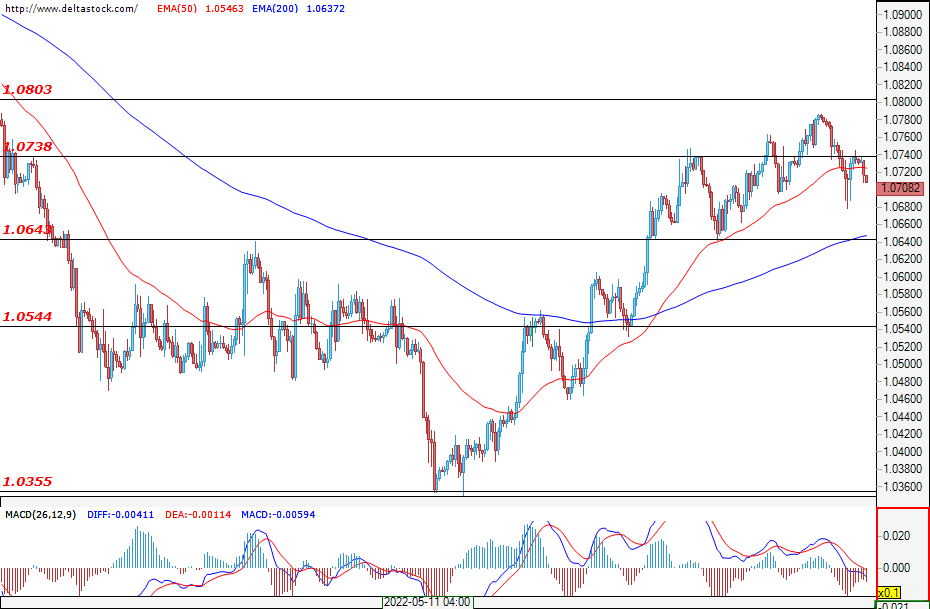
Today's trading session for the single European currency began with a breach of the support for the bears at 1.0738. The bulls then tried to regain positions, but the sellers did not back down and the breach of the aforementioned level was confirmed.. If they remain in control, then the next support they will most likely try to attack is the one at 1.0640. From the higher time frames, we can see that the next resistance that the bulls would try to face is sitting at 1.0800. During today's trading session, traders and investors will both be keeping an eye on the ADP non-farm employment change data (12:15; GMT) and on the ISM manufacturing data (14:00; GMT).
USD/JPY
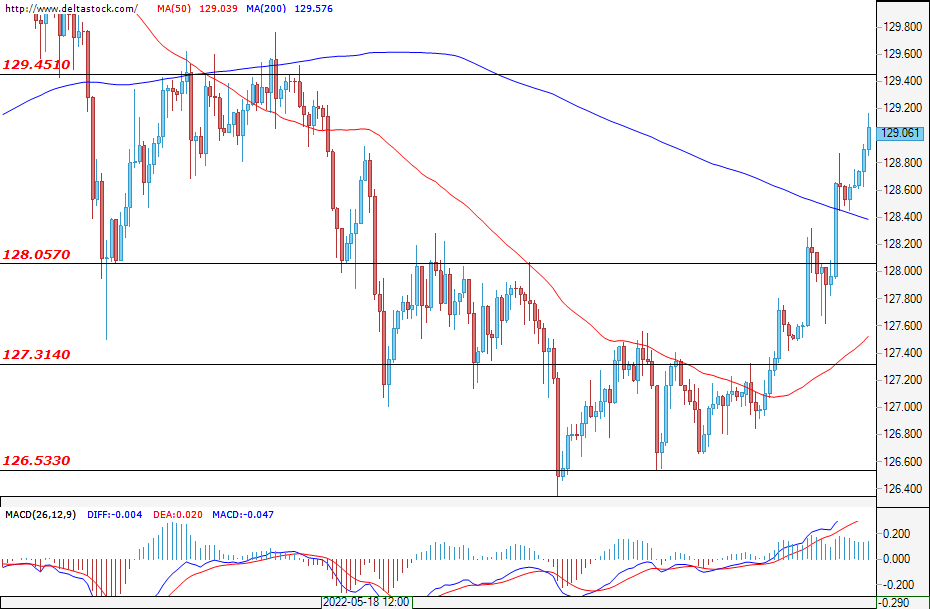
The bulls managed to rally the Ninja with more than one figure as the trading session started with a breach of the resistance at 128.05. At the time of writing the analysis, the bulls are moving towards the next resistance at 129.45, but a corrective move is quite likely, given the magnitude of the recent rally. However, if the bears do manage to turn the market around, then the first serious obstacle for them would be the support at 128.05.
GBP/USD
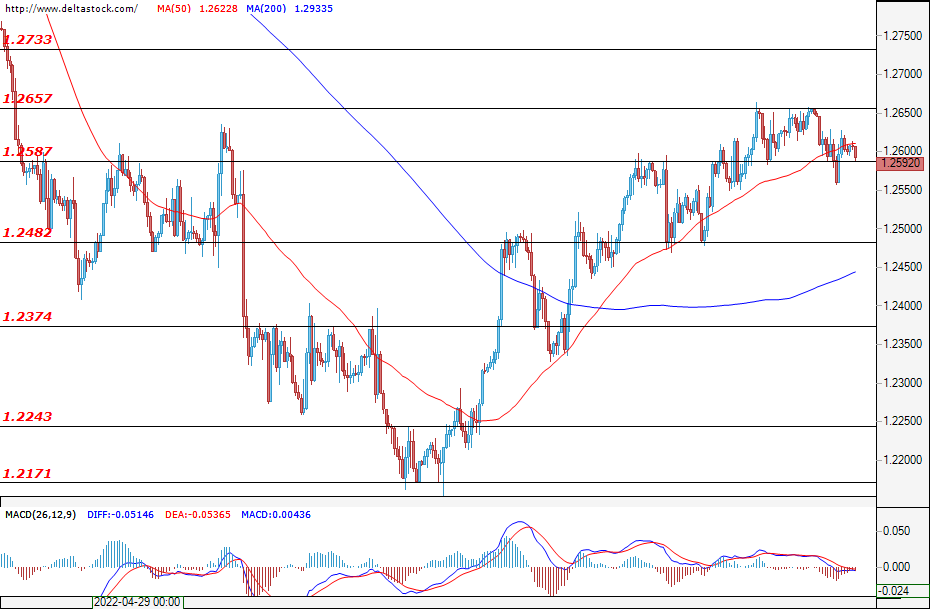
The trading session started promisingly for the bears as they managed to breach the support at 1.2587 and headed towards the next one at 1.2482. Their hopes were quickly dashed and the bulls were able to regain their positions above 1.2587. At the time of writing, the bears are again trying to break through this key support, and if they are successful, then the sell-off will most likely accelerate. If the bulls manage to tip the scales in their favour, then the first resistance they would have to deal with would be found at 1.2657.
EUGERMANY40
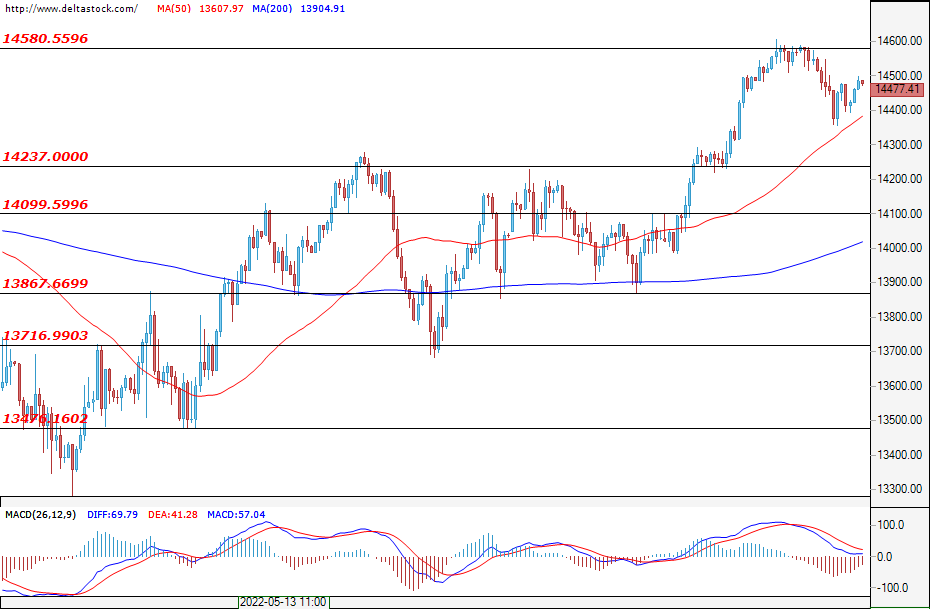
In the last few days, the German index has been moving in the range between 14237 and 14580. At the time of writing, neither the bears nor bulls are so far able to prevail. If investors manage to increase their trading volumes, then they would have to first deal with the support at 14237 and then with that at 14100. On the other hand, the bulls would have to overcome the upper border of the mentioned range, and then the resistance at 14640 – a level that has not been reached since March this year.
US30
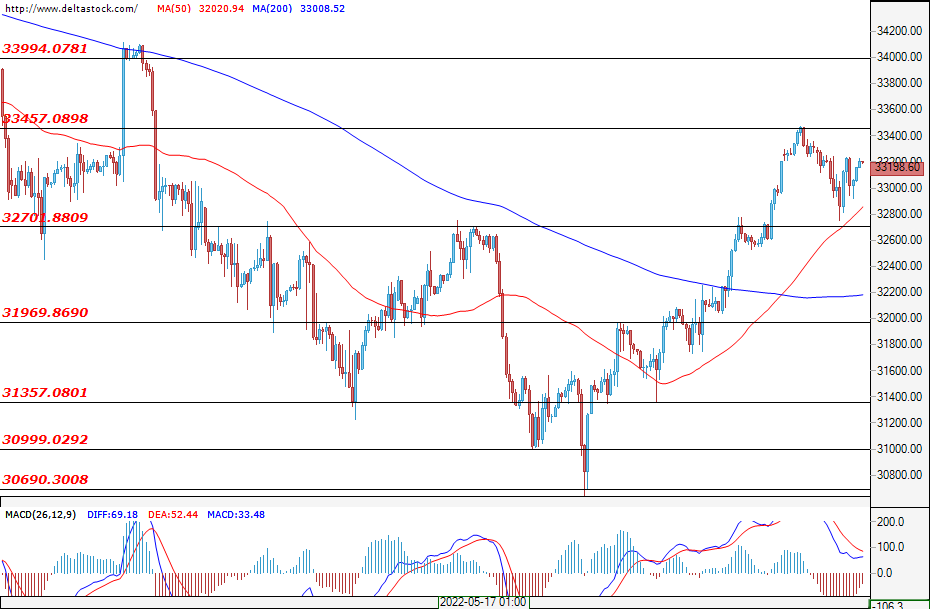
The situation with the U.S. blue chips is rather neutral as currently neither the bulls nor the bears are managing to gain enough momentum. Despite this, volatility is expected to remain elevated and sharp moves in both directions are likely. The catalyst for these moves is expected to be the data regarding the ADP non-farm employment change (12:15; GMT), the ISM manufacturing data (14:00; GMT), and the ISM prices paid data (14:00; GMT). If the news for the world's largest economy turns out to be positive, then the bulls could gain enough momentum to breach the resistance at 33457 and thus continue the rally.
GBP/USD Pair Entered a Short-Term Bearish Zone Below $1.2620
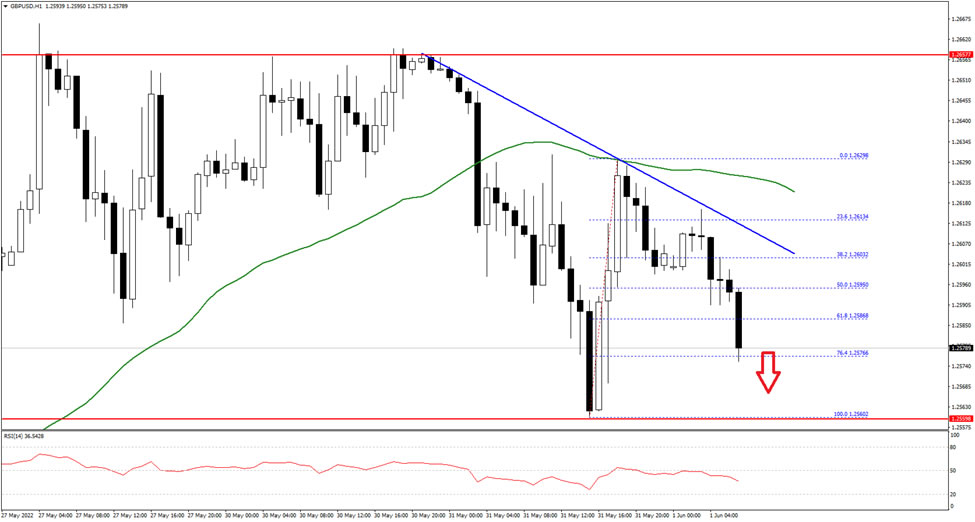
The British Pound started a fresh decline from the 1.2650 resistance against the US Dollar. The GBP/USD pair traded below the 1.2620 support zone to enter a short-term bearish zone.
The pair even declined below 1.2600 and the 50 hourly simple moving average. It is now showing bearish signs below a bearish trend line with resistance near 1.2605 on the hourly chart.
The next major resistance sits near the 1.2620 and the 50 hourly simple moving average. If there is a clear upside break above the 1.2620 resistance, the pair could rise steadily towards the 1.2650 level in the near term. The next major resistance sits near the 1.2720 level.
On the downside, an initial support is near 1.2565 on FXOpen. The main support is forming near the 1.2550 level. A break below the 1.2550 support could even push the pair below the 1.2500 support.
EUR/USD Daily Outlook
Daily Pivots: (S1) 1.0681; (P) 1.0732 (R1) 1.0786; More...
Intraday bias in EUR/USD remains neutral for the moment. On the upside, break of 1.0786, and sustained trading above 55 day EMA (now at 1.0757) will target 1.0935 resistance next. On the downside, however, break of 1.641 minor support will indicate rejection by 55 day EMA, and turn bias back to the downside for retesting 1.0348 low instead.
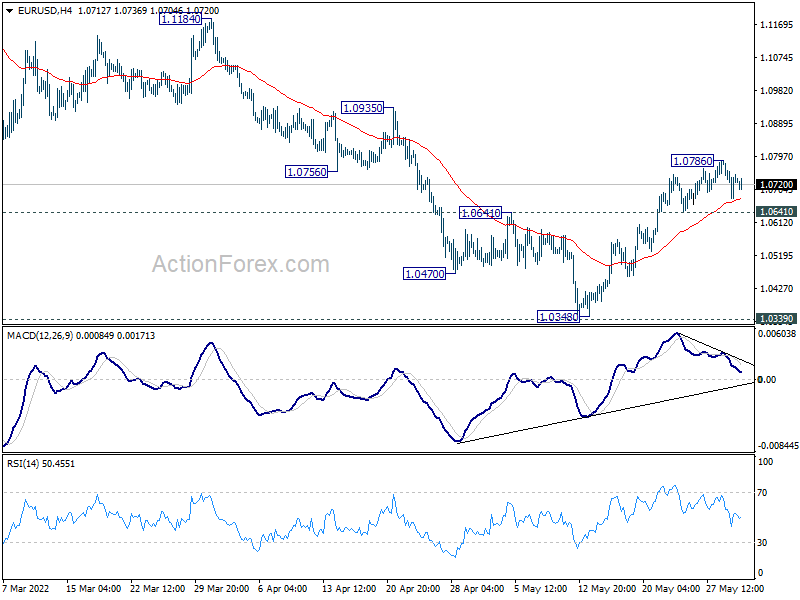
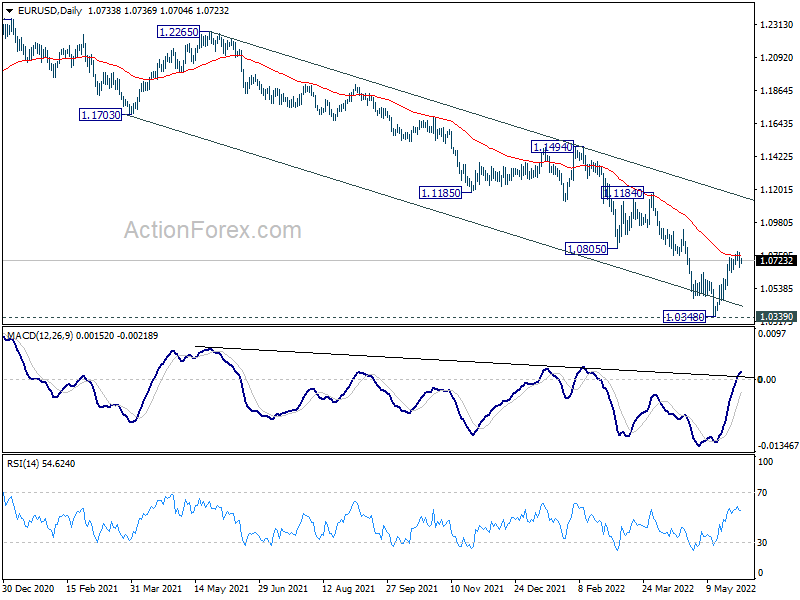
In the bigger picture, focus stays on 1.0339 long term support (2017 low). Decisive break there will resume whole down trend from 1.6039 (2008 high). Next target is 61.8% projection of 1.3993 to 1.0339 from 1.2348 at 1.0090. However, firm break of 1.0805 support turned resistance will delay this bearish case and bring medium term corrective rebound first.
GBP/USD Daily Outlook
Daily Pivots: (S1) 1.2557; (P) 1.2606; (R1) 1.2652; More...
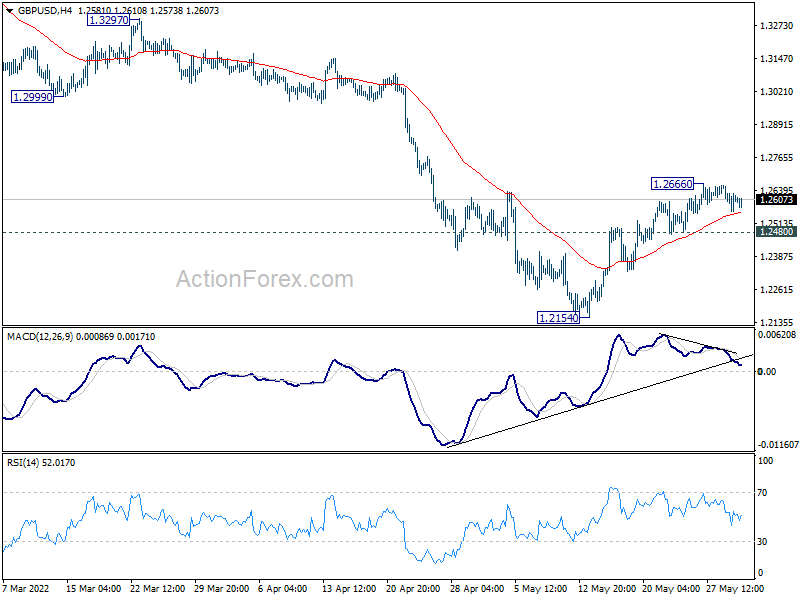
Intraday bias in GBP/USD remains neutral for the moment. On the upside, above 1.2666 will resume the rebound from 1.2154. Sustained of 55 day EMA (now at 1.2741) will target 1.2999 support turned resistance. On the downside, though, break of 1.2480 minor support will turn bias back to the downside for retesting 1.2154 low instead.
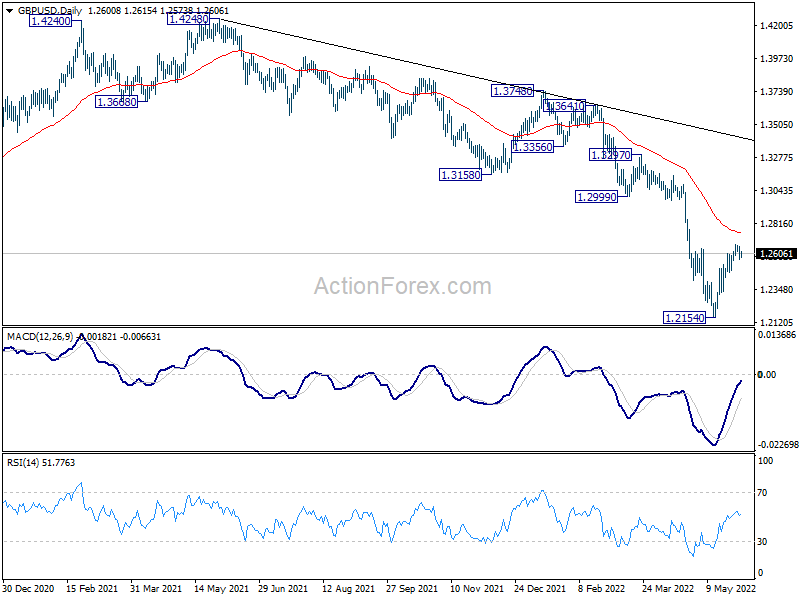
In the bigger picture, fall from 1.4248 (2018 high) could be a leg inside the pattern from 1.1409 (2020 low), or resuming the longer term down trend. Deeper decline is expected as long as 1.2999 support turned resistance holds. On resumption, next target is 1.1409 low.
USD/CHF Daily Outlook
Daily Pivots: (S1) 0.9569; (P) 0.9595; (R1) 0.9625; More...
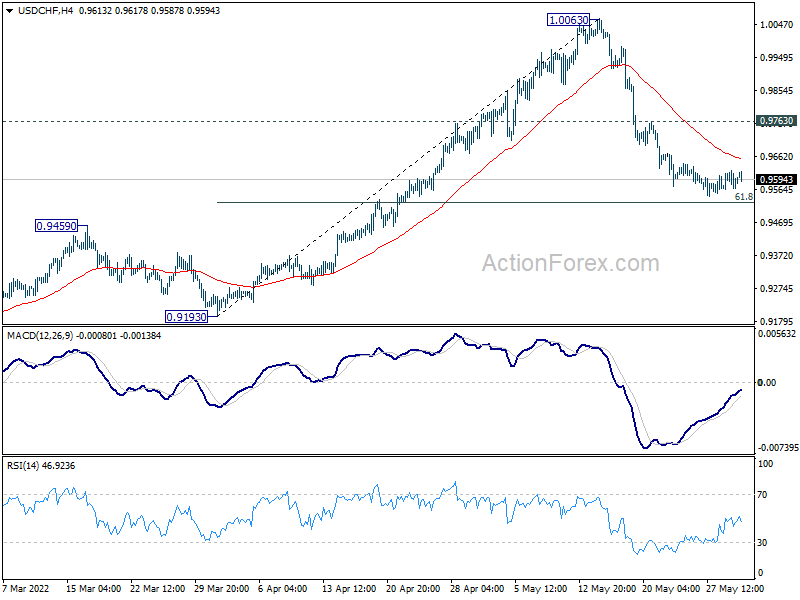
Outlook is USD/CHF is unchanged. Strong support is still expected at 61.8% retracement of 0.9193 to 1.0063 at 0.9525 to complete the pull back from 1.0063. On the upside, above 0.9763 minor resistance will turn bias back to the upside for retesting 1.0063 high. However, sustained break of 0.9525 will bring deeper decline to 0.9193 support.
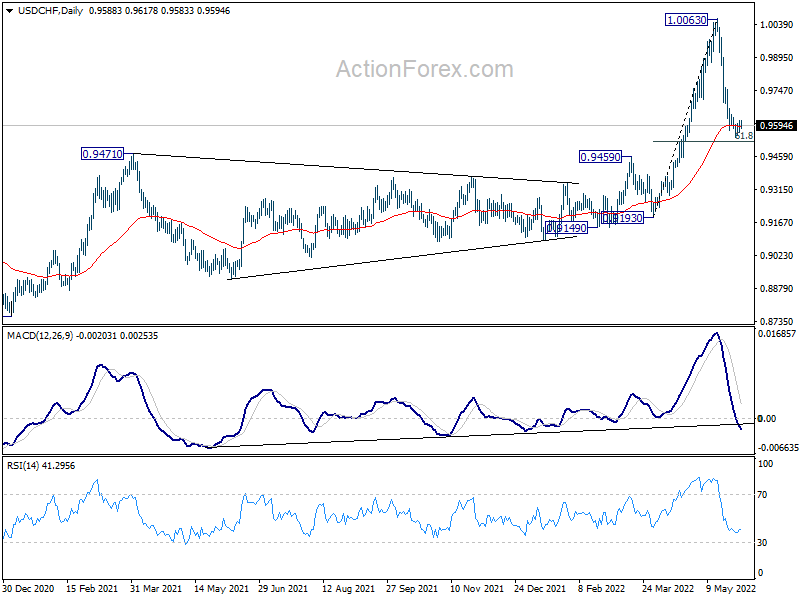
In the bigger picture, down trend from 1.0342 (2016 high) should have completed with three waves down to 0.8756 (2021 low) already. Rise from 0.8756 is likely a medium term up trend of its own. Next target is 1.0237/0342 resistance zone. This will remain the favored case as long as 0.9471 resistance turned support holds. However, sustained break of 0.9471 will extend long term range trading with another falling leg.
USD/JPY Daily Outlook
Daily Pivots: (S1) 127.04; (P) 127.43; (R1) 128.00; More...
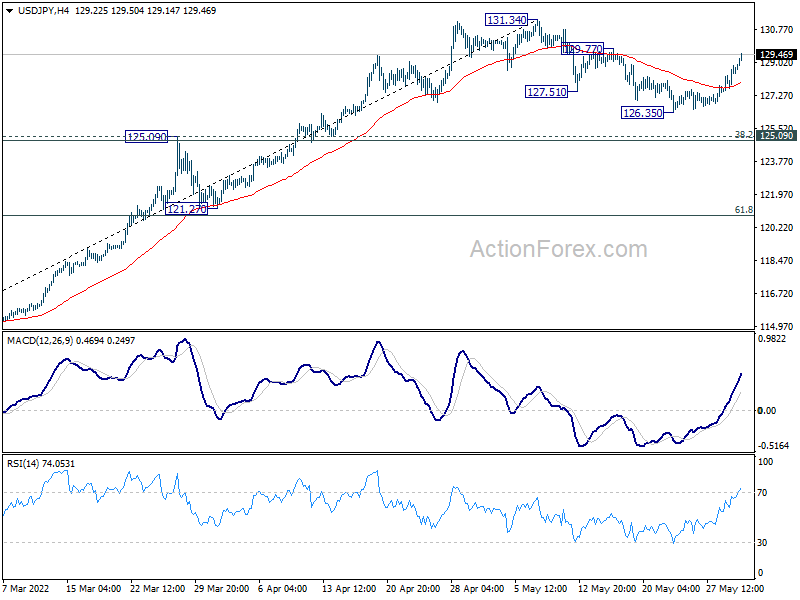
Immediate focus is now on 129.77 resistance in USD/JPY. Break there should confirm that pull back from 131.34 has completed at 126.35. Larger up trend should be resuming. Further break of 131.34 high will confirm this bullish case. Meanwhile, even if the correction from 131.34 is to extend, downside should be contained by 125.09 cluster support (38.2% retracement of 114.40 to 131.34 at 124.86) to bring rebound.
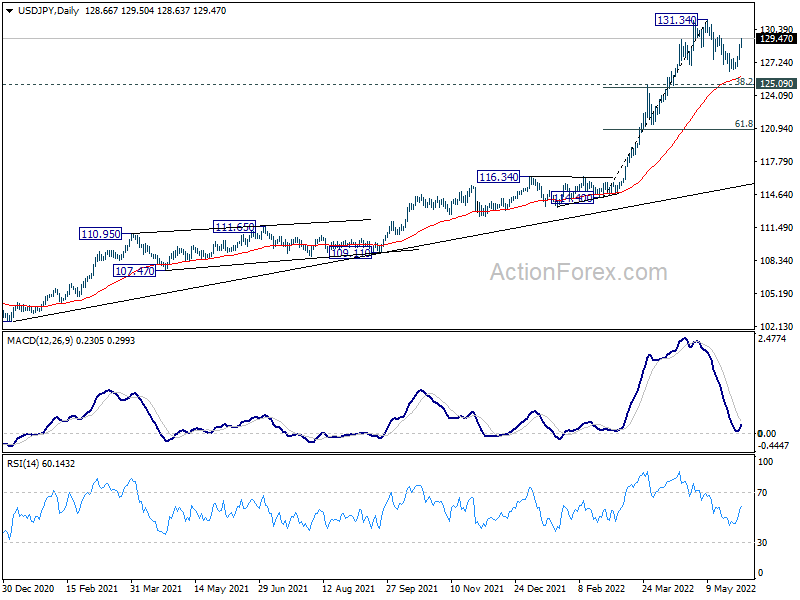
In the bigger picture, current rally is seen as part of the long term up trend form 75.56 (2011 low). Sustained trading above 61.8% projection of 75.56 (2011 low) to 125.85 (2015 high) from 98.97 at 130.04 will pave the way to 100% projection at 149.26, which is close to 147.68 (1998 high). For now, this will remain the favored case as long as 121.27 support holds.
AUD/USD Daily Report
Daily Pivots: (S1) 0.7151; (P) 0.7177; (R1) 0.7205; More...
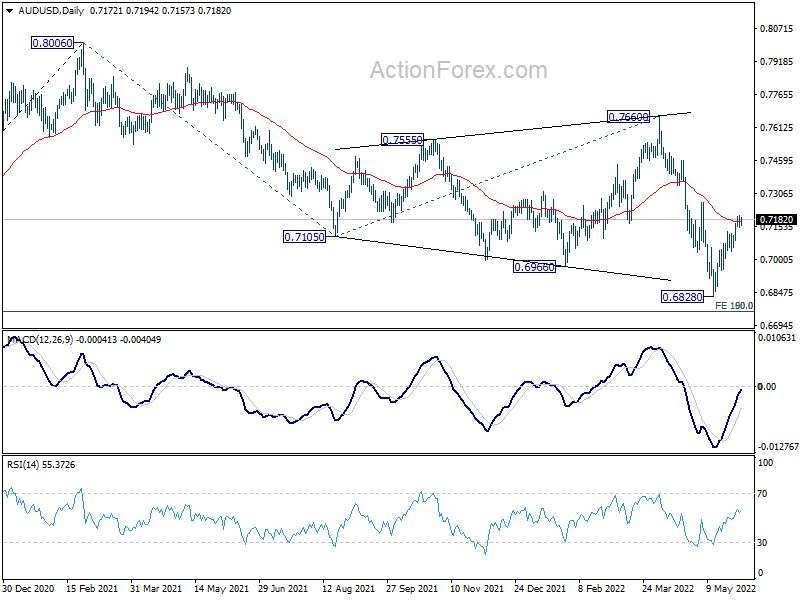
AUD/USD is losing some upside momentum, but further rise is expected with 0.7034 support intact. Firm break of 0.7265 resistance will raise the chance of larger trend reversal and target 0.7760 structural resistance next. On the downside, however, break of 0.7034 minor support will turn bias back to the downside for retesting 0.6828 low instead.
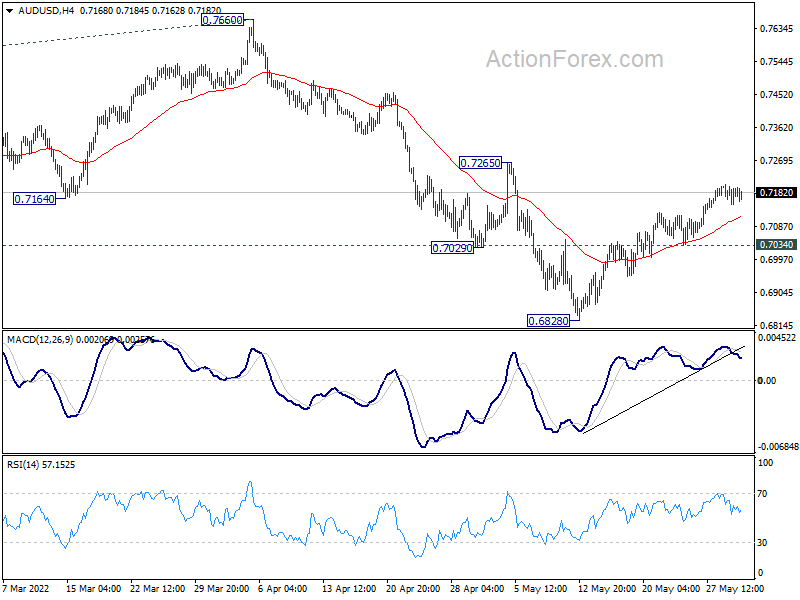
In the bigger picture, price actions from 0.8006 are seen as a corrective pattern to rise from 0.5506 (2020 low). Deeper fall could be seen to 50% retracement of 0.5506 to 0.8006 at 0.6756. This coincides with 100% projection of 0.8006 to 0.7105 from 0.7660 at 0.6760. Strong support is expected from 0.6756/60 cluster to contain downside to complete the correction. Meanwhile, firm break of 0.7660 resistance will confirm that such corrective pattern has completed, and larger up trend is ready to resume.