
Sample Category Title
USD/JPY Mid-Day Outlook
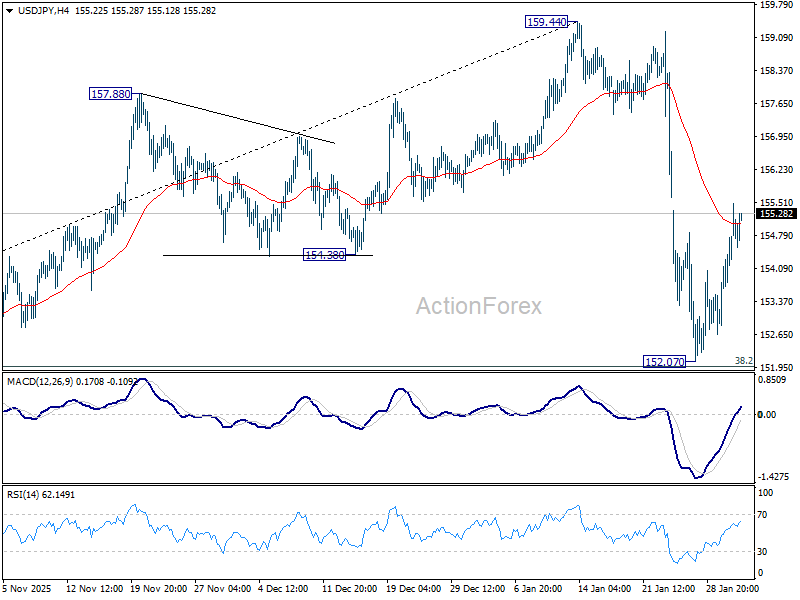
Daily Pivots: (S1) 153.49; (P) 154.15; (R1) 155.42; More...
Intraday bias in USD/JPY remains mildly on the upside for the moment. Fall from 152.07 should have completed just a head of 38.2% retracement of 139.87 to 159.44 at 151.96. Rise from 152.07 is seen as the second leg of the corrective pattern from 159.44. Sustained trading above 55 D EMA (now at 155.52) will pave the way back to retest 159.44. However, decisive break of 151.96 will argue that it is reversing whole rise from 139.87. Deeper decline would then be seen to 61.8% retracement at 147.34.
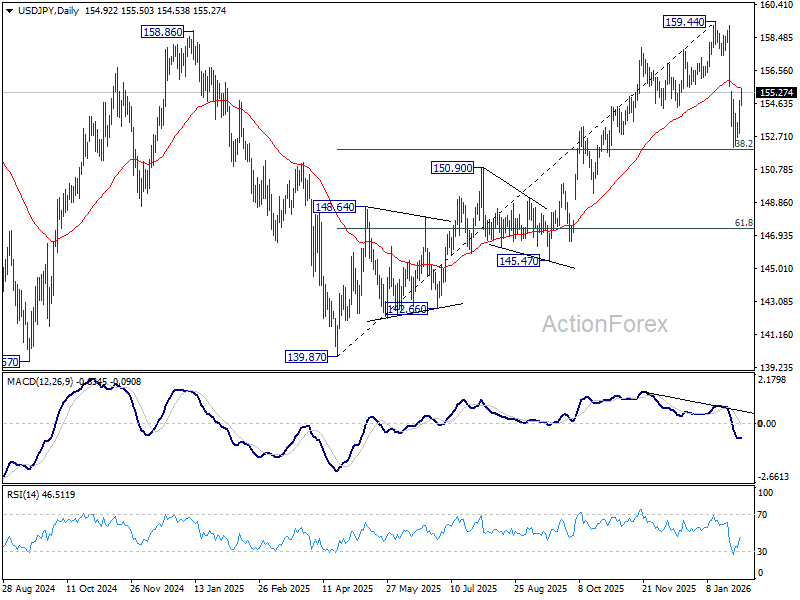
In the bigger picture, outlook is unchanged that corrective pattern from 161.94 (2024 high) should have completed with three waves at 139.87. Larger up trend from 102.58 (2021 low) could be ready to resume through 161.94. This will remain the favored case as long as 55 W EMA (now at 151.59) holds. However, sustained break of 55 W EMA will argue that the pattern from 161.94 is extending with another falling leg.
AUD/USD Mid-Day Report
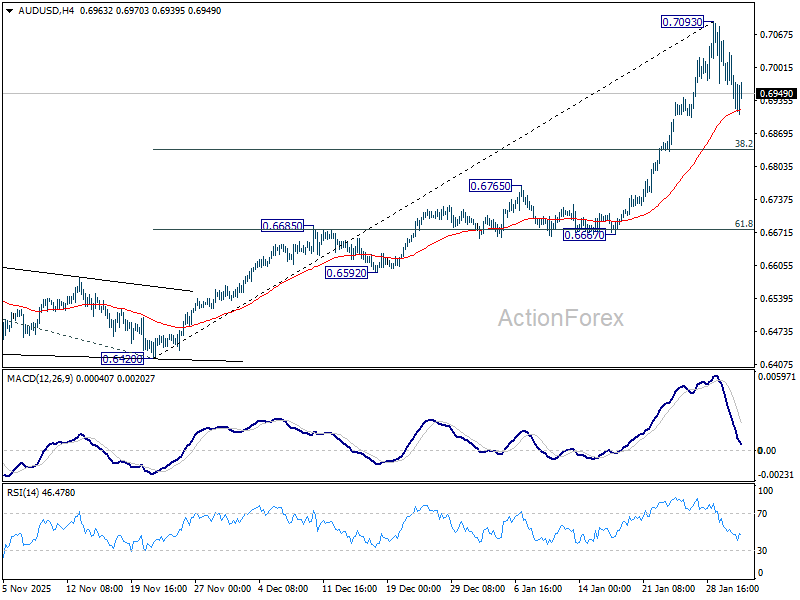
Daily Pivots: (S1) 0.6917; (P) 0.6986; (R1) 0.7033; More...
Intraday bias in AUD/USD remains neutral as consolidations continue. Risk will stay on the upside as long as 55 4H EMA (now at 0.6916) holds. Above 0.7093 will extend larger up trend to 100% projection of 0.5913 to 0.6706 from 0.6420 at 0.7213 next. Nevertheless, sustained break of 55 4H EMA will confirm short term topping, and bring lengthier consolidations before rally resumption. Deeper pullback would then be seen to 38.2% retracement of 0.6420 to 0.7093 at 0.6836.
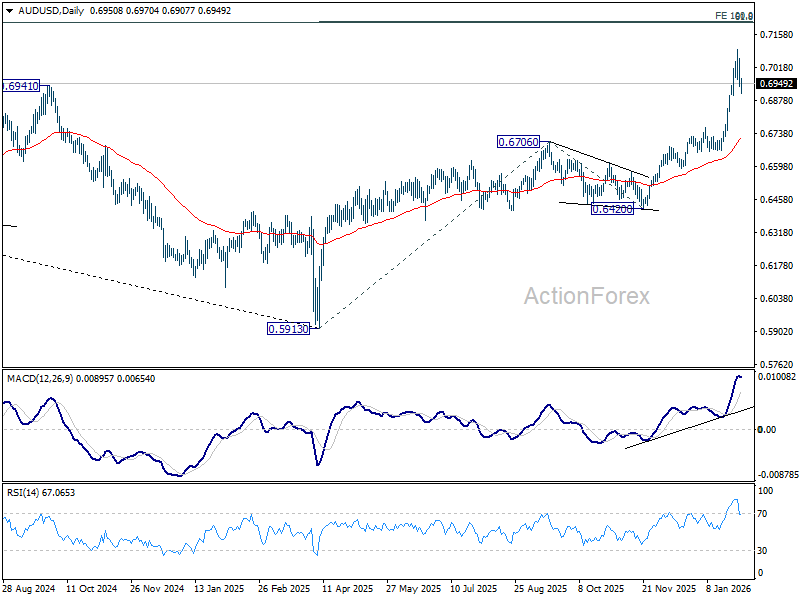
In the bigger picture, current development argues that rise from 0.5913 (2024 low) is reversing whole down trend from 0.8006 (2021 high). Further rally should be seen to 61.8% retracement of 0.8006 to 0.5913 at 0.7206. This will remain the favored case as long as 0.6706 resistance turned support holds, even in case of deep pullback.
Dollar Rises as Crypto and Tech Show Strain, Aussie Awaits RBA Guidance
Dollar extended its rebound today, though upside momentum remains restrained. Price action suggests markets are still digesting recent shifts in policy expectations rather than embracing a full risk-off move. Attention remains on the implications of Kevin Warsh being lined up as the next chair of the Fed. While Fed rate cut probabilities have barely shifted, repricing has been far more visible in higher-beta assets, notably precious metals and cryptocurrencies.
Equities have so far been more resilient, but the tone is softening. US stock futures are slightly heavier, with NASDAQ underperforming. The move has been exacerbated by weakness in Nvidia, whose shares slipped in premarket trading after reports cast doubt on a proposed USD 100 billion investment linked to OpenAI. Nvidia’s drag on tech sentiment has added to concerns that risk repricing could broaden. If equity weakness starts to align more closely with the sharp selloff already seen in crypto over the past two sessions, markets may begin to reassess overall risk appetite more forcefully.
For now, it remains unclear how tightly the recent cryptocurrency slump will correlate with tech stocks and broader sentiment. The disconnect suggests investors are selectively reducing exposure rather than exiting risk wholesale.
Looking ahead, the RBA rate decision is the next major focal point. A 25bp hike to 3.85% is well priced and unlikely to surprise. The real question lies in forward guidance. Markets are pricing roughly 55bp of tightening by year-end, implying at least one additional hike. Whether the RBA signals a return to a tightening cycle or frames the move as a one-off adjustment will be critical.
AUD/USD has already shown signs of hesitation after breaching the 0.7000 mark last week. The next directional move will hinge on both global risk sentiment and how convincingly the RBA leans toward further tightening.
For now, Dollar leads performance on the day, followed by Sterling and Euro. Swiss franc lags, trailed by Loonie and Kiwi. Aussie and Yen are trading near the middle of the pack.
In Europe, at the time of writing, FTSE is up 0.63%. DAX is up 0.74%. CAC is up 0.60%. UK 10-year yield is down -0.024 at 4.506. Germany 10-year yield is up 0.011 at 2.858. Earlier in Asia, Nikkei fell -1.25%. Hong Kong HSI fell -2.23%. China Shanghai SSE fell -2.48%. Singapore Strait Times fell -0.26%. Japan 10-year JGB yield fell -0.013 to 2.238.
UK PMI manufacturing finalized at 17-month high, inflation risks return
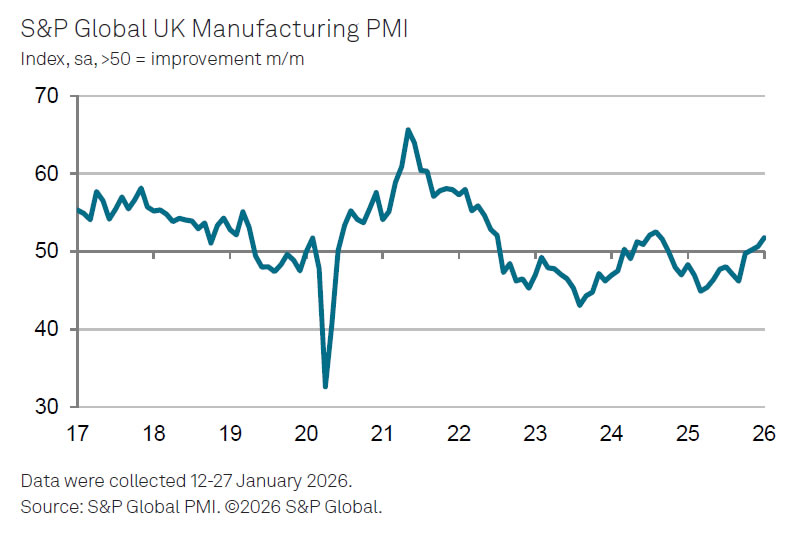
UK PMI Manufacturing was finalized at 51.8 in January, up from December’s 50.6 and marking a 17-month high. The reading signals a solid start to 2026 for the sector, showing resilience despite a challenging backdrop of geopolitical tension and trade uncertainty.
According to Rob Dobson of S&P Global Market Intelligence, growth momentum improved notably. Output and order books expanded at a faster pace, while new export business rose for the first time in four years, led by demand from Europe, China, and the US. Business confidence also rebounded, reaching its highest level since before the 2024 Autumn Budget, as firms focused on opportunities ahead rather than near-term policy and geopolitical risks.
The labor market picture showed tentative stabilization. Although hiring remained weak, the pace of job cuts slowed to its mildest in 15 months. That said, inflation pressures are resurfacing, with higher Minimum Wage and employer National Insurance costs feeding through supply chains alongside rising metals prices, posing a potential constraint on margins in coming months.
Eurozone PMI manufacturing finalized at 49.5, recovery momentum at snail's pace
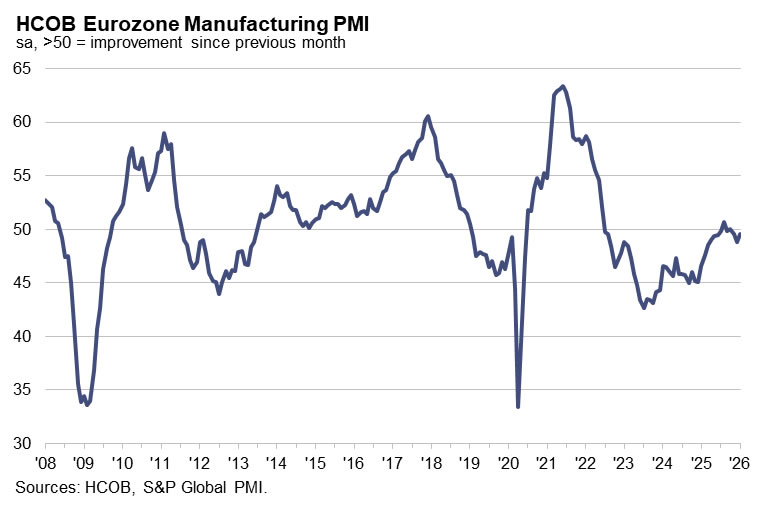
Eurozone PMI Manufacturing was finalized at 49.5 in January, up from December’s 48.8. According to Cyrus de la Rubia of Hamburg Commercial Bank, progress remains at a "snail’s pace". Order intakes continued to fall, albeit at a less severe pace than late last year, while sentiment twelve months ahead improved slightly, suggesting firms are cautiously more optimistic about future production.
The regional picture remains highly uneven. Greece led with a PMI of 54.2, a five-month high, while France surprised on the upside at 51.2 (a 43-month high). Germany showed tentative stabilization, with contraction easing to a three-month high of 49.1. In contrast, Italy (48.1)remained firmly in contraction, Austria (47.2) deteriorated sharply, and Spain (49.2) slipped into its second consecutive month of decline after previously outperforming peers.
Cost pressures also re-emerged as a key theme. Input price inflation rose noticeably, driven in part by a sharp increase in natural gas prices and firmer oil costs. At the same time, higher prices for industrial metals may reflect strengthening global demand rather than pure supply stress.
Japan PMI manufacturing finalized at 51.5, growth returns, inflation a risk
Japan’s manufacturing sector returned to expansion in January, with PMI Manufacturing finalized at 51.5. This marks the first improvement in operating conditions since mid-2025 and represents the strongest rate of growth since August 2022, offering early evidence of a cyclical recovery taking hold.
The details were encouraging. S&P Global Market Intelligence noted that output and new orders recorded their sharpest increases in almost four years, while export demand rose for the first time since 2022. Employment growth also accelerated to its fastest pace since September 2022, suggesting the sector is "gearing up for further increases in output in the months ahead."
That said, cost pressures are resurfacing as a potential constraint. Input price inflation climbed to a near one-year high, driven in part by the weaker yen, and firms passed some of those costs on to customers. Whether these price pressures intensify will be key in assessing how durable the recovery proves to be.
AUD/USD Mid-Day Report
Daily Pivots: (S1) 0.6917; (P) 0.6986; (R1) 0.7033; More...
Intraday bias in AUD/USD remains neutral as consolidations continue. Risk will stay on the upside as long as 55 4H EMA (now at 0.6916) holds. Above 0.7093 will extend larger up trend to 100% projection of 0.5913 to 0.6706 from 0.6420 at 0.7213 next. Nevertheless, sustained break of 55 4H EMA will confirm short term topping, and bring lengthier consolidations before rally resumption. Deeper pullback would then be seen to 38.2% retracement of 0.6420 to 0.7093 at 0.6836.
In the bigger picture, current development argues that rise from 0.5913 (2024 low) is reversing whole down trend from 0.8006 (2021 high). Further rally should be seen to 61.8% retracement of 0.8006 to 0.5913 at 0.7206. This will remain the favored case as long as 0.6706 resistance turned support holds, even in case of deep pullback.
Gold and Silver Fell Off a Cliff
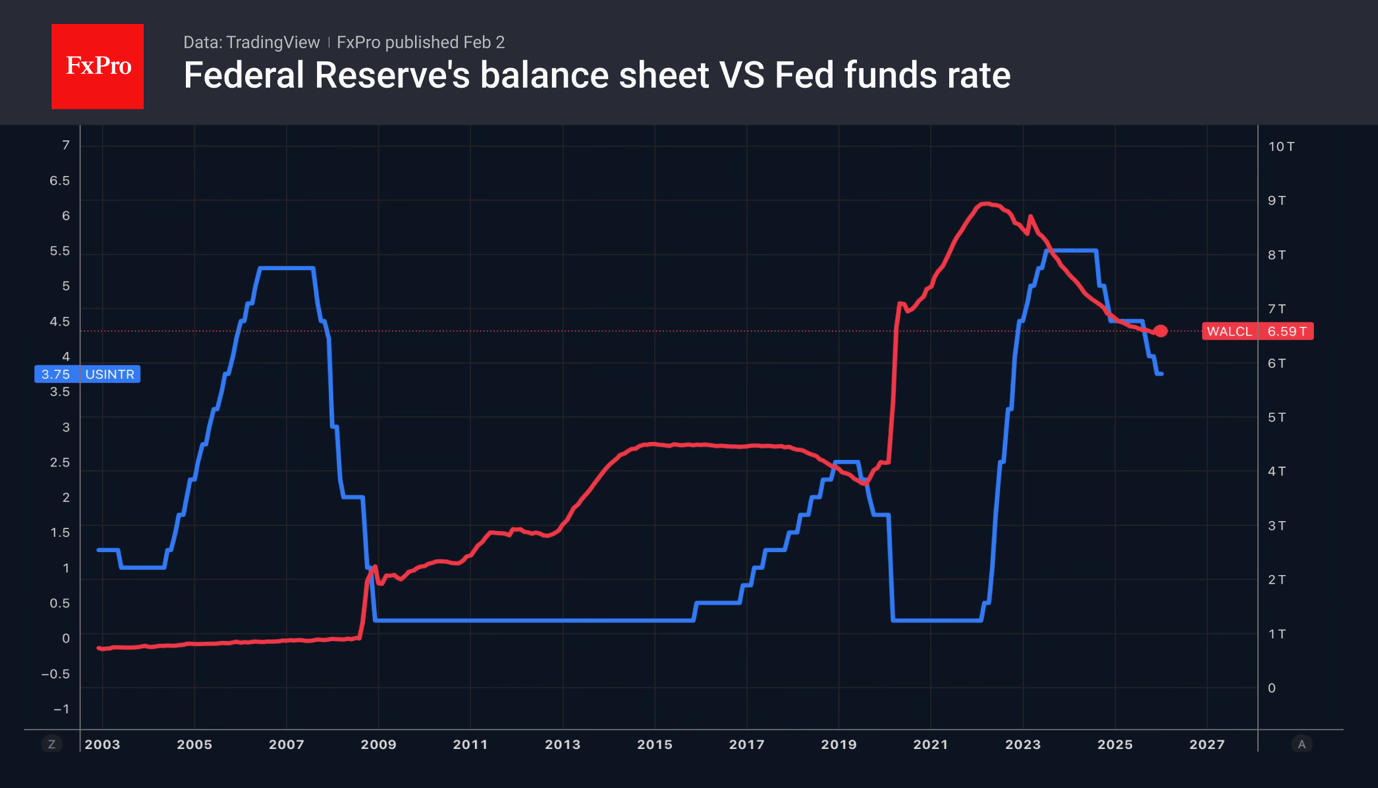
The US dollar recorded its best one-day performance since May, after Trump selected Kevin Warsh as a candidate for Fed chair. He is believed to be committed to defending the independence of the central bank, which will restore investor confidence in the US currency. He is an expert with extensive experience in the FOMC. The White House will not be able to exert as much pressure on him as it does on candidates who are close to Donald Trump and less qualified.
In fact, Warsh faces challenging tasks. He must reduce the balance sheet without scaring the markets. He must slow inflation to 2% without raising rates. Finally, he must keep a distance from the influence of the White House, which wants to weaken monetary policy.
Kevin Warsh’s appointment is intended to strengthen confidence in the US dollar and halt the Sell America trade that has bloomed recently. Washington needs money to finance its budget deficit. According to Eurizon SLJ Capital, once the markets calm down, there could be a sudden and unexpected fall in the USD index thanks to coordinated currency interventions modelled on the Plaza Accord of 1985. Last year, investors actively discussed this topic.
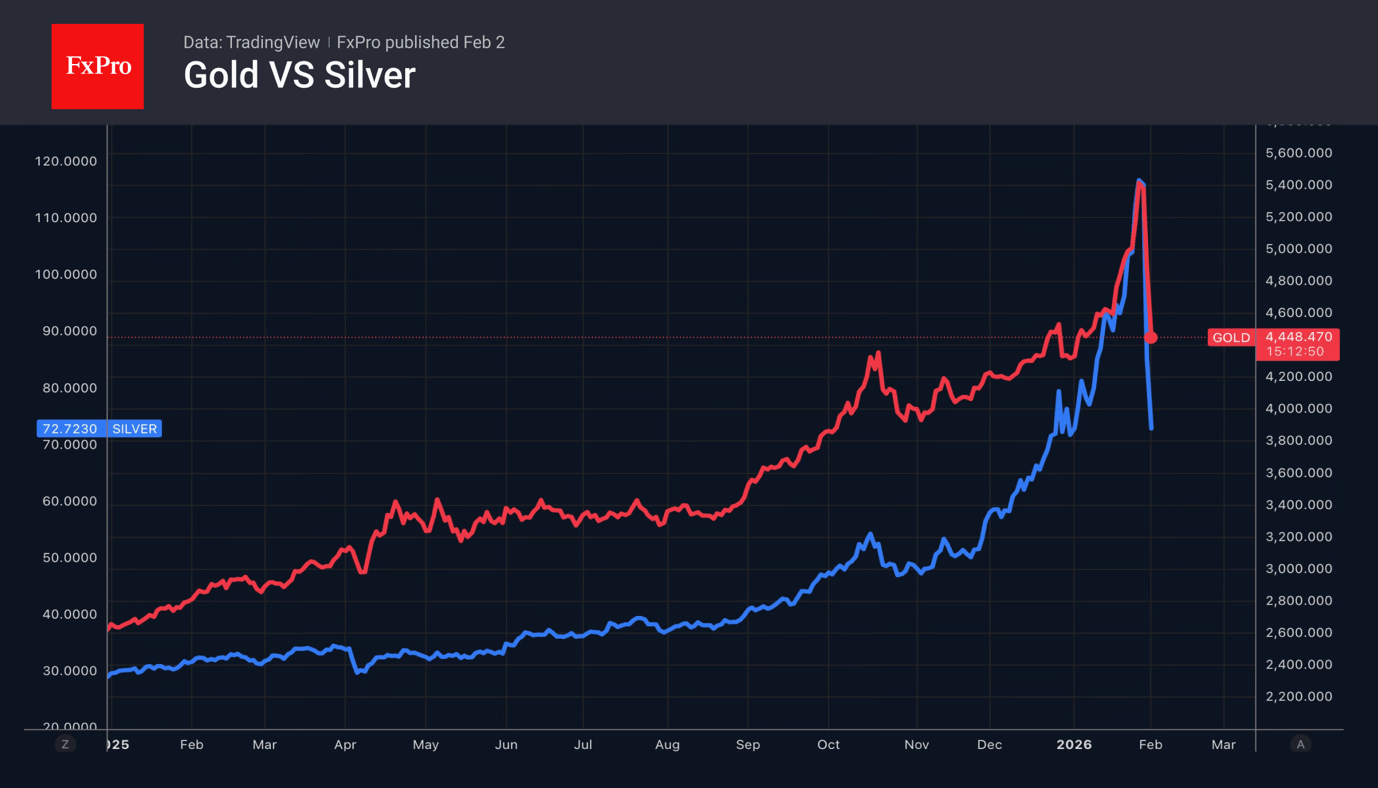
The strengthening of the US dollar led to large-scale sales of precious metals. If confidence in the greenback returns thanks to Warsh, debasement trading will become irrelevant. As a result, silver lost 31% and gold fell 11% in just one day, the worst performance of these assets since March and January 1980, respectively.
Traders taking profits on long positions and banks hedging against the risk of a decline in precious metals certainly contributed to the collapse. The January rally in Gold and Silver was largely speculative in nature. At the end of the month, the bubble burst.
Japanese Prime Minister Sanae Takaichi attempted to stabilise the situation in the USDJPY. According to her, a weak yen has both advantages and disadvantages. In particular, it creates a tailwind for exporters, which is extremely important in the context of high tariffs. The LDP leader wants to build a strong economic structure that is resistant to exchange rate fluctuations.
Nasdaq 100 Opens Lower Following Big Tech Earnings
Last week saw the release of quarterly earnings from Microsoft (MSFT), Meta Platforms (META), Tesla (TSLA) and Apple (AAPL). At the opening of Monday’s session — today, 2 February — the Nasdaq 100 index (US Tech 100 mini on FXOpen) opened with a bearish gap, sliding towards the 25,100 level.
Why Is the Nasdaq 100 Falling?
While many of the Big Tech earnings reports were strong, the broader market reaction suggests that:
→ investors have become increasingly sceptical about massive capital expenditure (capex) on artificial intelligence, as seen in Microsoft’s case;
→ even solid results, such as those delivered by Apple, are no longer triggering rallies.
It appears that market participants are placing greater emphasis on uncertainties related to:
→ the new Fed Chair;
→ the risk of another US government shutdown;
→ rising geopolitical tensions (with Greenland, Iran and Ukraine potentially joined by Cuba).
Technical Analysis of the Nasdaq 100 Chart
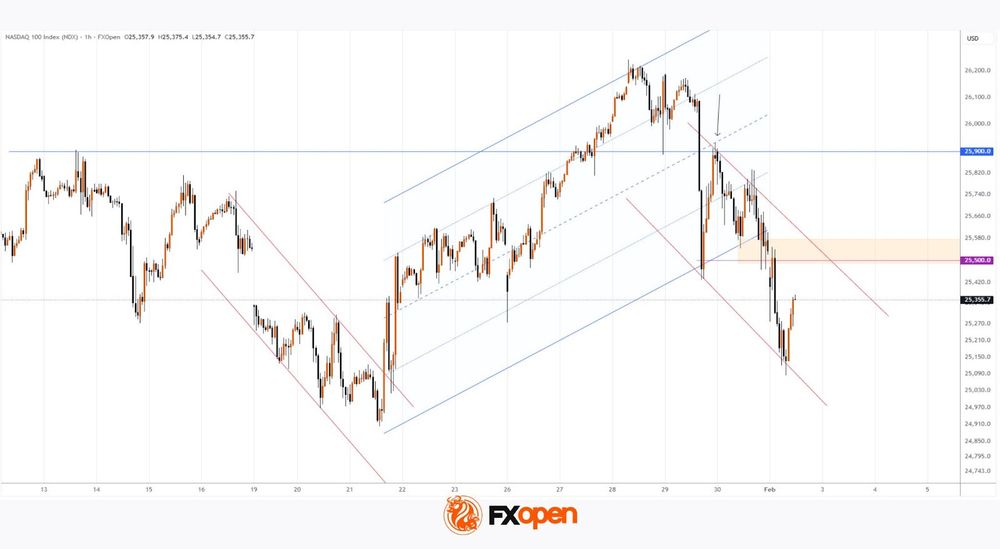
When analysing Nasdaq 100 price action (US Tech 100 mini on FXOpen) six days ago, we:
→ identified an ascending channel (shown in blue);
→ considered a scenario involving another false bullish breakout following the move above the 13 January high;
→ anticipated a modest technical correction.
Since then:
→ the price has marginally extended the channel, while its slope has remained unchanged;
→ the index declined from the upper boundary to the lower boundary of the channel, with the median acting as resistance (as indicated by the arrow);
→ this was followed by a bearish break below the lower boundary.
As a result, Nasdaq 100 price action can now reasonably be viewed as a corrective phase, with the potential to evolve into a downward trajectory (shown by the red lines).
If bears are to maintain control, it would be logical for them to assert dominance over the area around 25,500 — the zone where the ascending channel was broken.
Trade global index CFDs with zero commission and tight spreads (additional fees may apply). Open your FXOpen account now or learn more about trading index CFDs with FXOpen.
This article represents the opinion of the Companies operating under the FXOpen brand only. It is not to be construed as an offer, solicitation, or recommendation with respect to products and services provided by the Companies operating under the FXOpen brand, nor is it to be considered financial advice.
USDJPY Realises Correction: BOJ Policy Weighs on Yen
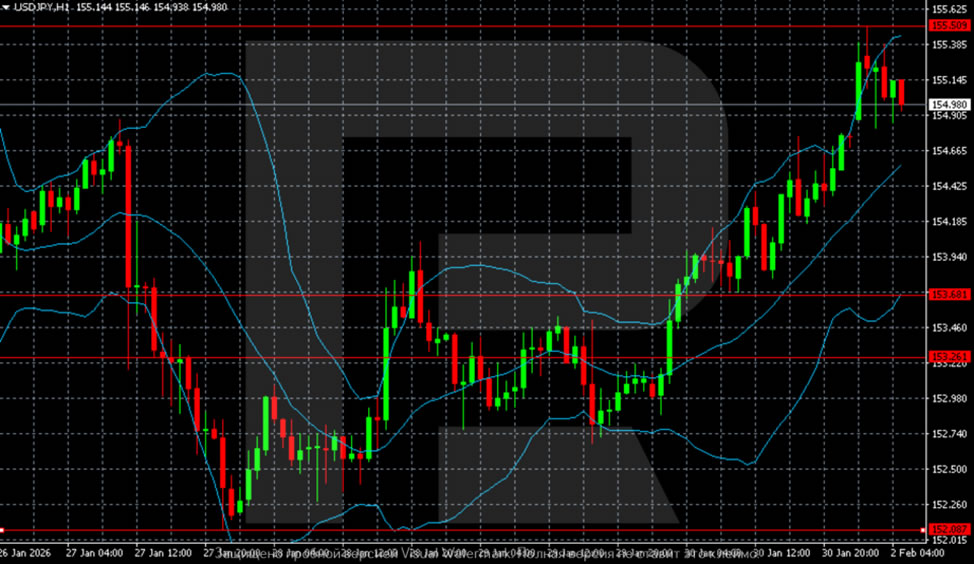
USDJPY rose to 154.98 on Monday, with the yen continuing to fall. Pressure on the currency increased after statements by Japanese Prime Minister Sanae Takaichi. Over the weekend, the politician noted that a weak yen could be a significant advantage for export industries, indicating that Takaichi continues to favour a softer exchange rate. She later clarified that her comments concerned the need to build an economy resistant to currency fluctuations.
On Friday, the yen lost about 1% against the dollar after US President Donald Trump nominated Kevin Warsh as the next Fed chairman. The market regarded this choice as more "hawkish", supporting the dollar and adding to the pressure on the yen.
An additional factor of uncertainty remains the upcoming extraordinary vote in the lower house of parliament on 8 February. Takaichi's ruling party is expected to strengthen its position and advance expansive fiscal policies, increasing the risk of higher borrowing. Against this background, both Japanese government bonds and the yen were under pressure last month.
Expectations of fiscal stimulus and discussion of tax breaks increase the burden on public finances and restrain demand for the national currency.
Technical Analysis
On the H4 chart, a corrective rebound follows after a sharp drop from the 158.50–159.00 area. The price recovered from a low in the 152.00 zone and is testing the 155.50 area, but remains below medium-term resistance. The structure still looks corrective inside the broader downward phase until the quotes settle above 156.50–157.00.
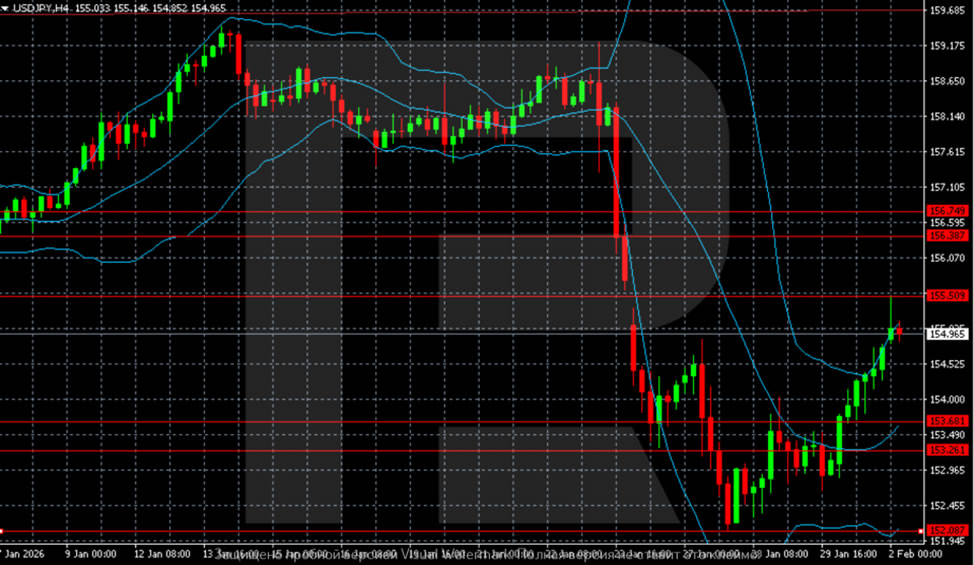
The H1 chart shows that after a sharp decline, the pair entered a recovery phase and has been sequentially updating local maxima. The price climbed above the 153.26–153.88 zone and is trading along the upper end of the Bollinger Bands, indicating continued near-term momentum. A slowdown is observed near the 155.50–155.60 level, with a possible pause or pullback within the ongoing correction.
Conclusion
In summary, the USDJPY rebound is primarily a technical correction within a broader bearish context for the yen. The move is exacerbated by political commentary favouring a weaker currency and reinforced by a hawkish Fed appointment. While near-term momentum persists, the pair faces significant resistance ahead. The fundamental backdrop of anticipated expansive fiscal policy in Japan continues to apply structural pressure on the yen, suggesting the current recovery may be limited in scope before the larger downtrend potentially resumes.
Markets Rocked by Unwinding of Gold and Silver
- The US Dollar cheered Warsh's nomination for Fed chair.
- Precious metals plunged as investors lost interest in debasement trade.
Speculations and the recent nomination of Kevin Warsh to become Fed chair have allowed the US dollar to find its footing. In the past, this former FOMC official has shown himself to be a ‘hawk’. Markets saw his appointment as a reduction in the risks of the central bank losing its independence and returned to fundamentals for a while. The greenback is backed by a strong US economy and a prolonged pause in the cycle of monetary expansion.
The explosive rally of the EUR/USD is beginning to cause discontent at the European Central Bank. Investors recall the speech by Vice-President Luis de Guindos. In 2025, he argued that with the euro at $1.2 and above, the eurozone economy would have a hard time. The head of the Bank of Austria, Martin Kocher, believes that the ECB will be forced to act by cutting rates if the euro continues to strengthen, which damages its inflation plans. His colleague from France, François Villeroy de Galhau, claims that the Governing Council will take Forex events into account when making decisions on interest rates.
Bloomberg experts do not expect the ECB to change them at its meeting on 5 February. Although most still agree that the next step will be a rate hike, fewer of them expect this to happen this year. However, the EUR/USD rally may adjust these forecasts. There are big bets in the currency market that the European Central Bank will return to easing monetary policy. On paper, it has no target for the euro exchange rate, but a strengthening currency will hamper the export-oriented economy.
The strengthening of the US Dollar has allowed the USD/JPY to rise. Investors are asking themselves whether Japan's currency interventions would be effective if it acted alone, without the US. Finance Minister Scott Bessent made it clear that the Americans were not involved.
Kevin Warsh's nomination to Fed chair had a sobering effect on gold. Its collapse from record highs showed the overly speculative nature of the previous rally. It was based on debasement trading, fuelled by mistrust of the White House's policies and the US dollar. However, if the Fed's independence remains intact, the market will begin to ask an uncomfortable question. Has its rally gone too far too fast?
UK PMI manufacturing finalized at 17-month high, inflation risks return
UK PMI Manufacturing was finalized at 51.8 in January, up from December’s 50.6 and marking a 17-month high. The reading signals a solid start to 2026 for the sector, showing resilience despite a challenging backdrop of geopolitical tension and trade uncertainty.
According to Rob Dobson of S&P Global Market Intelligence, growth momentum improved notably. Output and order books expanded at a faster pace, while new export business rose for the first time in four years, led by demand from Europe, China, and the US. Business confidence also rebounded, reaching its highest level since before the 2024 Autumn Budget, as firms focused on opportunities ahead rather than near-term policy and geopolitical risks.
The labor market picture showed tentative stabilization. Although hiring remained weak, the pace of job cuts slowed to its mildest in 15 months. That said, inflation pressures are resurfacing, with higher Minimum Wage and employer National Insurance costs feeding through supply chains alongside rising metals prices, posing a potential constraint on margins in coming months.
Eurozone PMI manufacturing finalized at 49.5, recovery momentum at snail’s pace
Eurozone PMI Manufacturing was finalized at 49.5 in January, up from December’s 48.8. According to Cyrus de la Rubia of Hamburg Commercial Bank, progress remains at a "snail’s pace". Order intakes continued to fall, albeit at a less severe pace than late last year, while sentiment twelve months ahead improved slightly, suggesting firms are cautiously more optimistic about future production.
The regional picture remains highly uneven. Greece led with a PMI of 54.2, a five-month high, while France surprised on the upside at 51.2 (a 43-month high). Germany showed tentative stabilization, with contraction easing to a three-month high of 49.1. In contrast, Italy (48.1)remained firmly in contraction, Austria (47.2) deteriorated sharply, and Spain (49.2) slipped into its second consecutive month of decline after previously outperforming peers.
Cost pressures also re-emerged as a key theme. Input price inflation rose noticeably, driven in part by a sharp increase in natural gas prices and firmer oil costs. At the same time, higher prices for industrial metals may reflect strengthening global demand rather than pure supply stress.
Silver Prices Collapse as the Market Shifts Phase
According to media reports, the silver market has experienced its largest price drop since 1980.
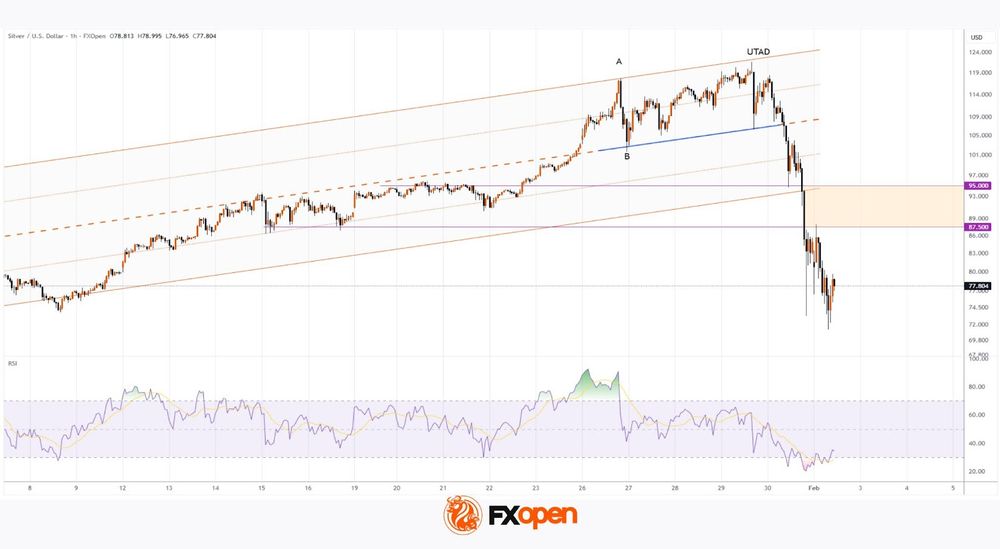
Notably, it is difficult to identify a single powerful fundamental catalyst that could clearly explain the move from the 29 January high near $120 to today’s low around $72 (approximately −40%). The geopolitical backdrop remains tense, with risks related to Iran, Greenland, Ukraine and other regions still very much in play.
The media point to a cascade of long-position liquidations, a view that aligns with the analytical conclusions of our article “For the First Time In History, the Price of Silver Has Exceeded $115”, published five days ago.
At that time, we:
→ reaffirmed the primary ascending channel and highlighted a surge in volatility during the A→B move from the upper boundary of the channel;
→ suggested that “smart money” was using broad market participation to lock in profits on long positions after an extraordinary rally (more than +200% over the past six months). In Wyckoff terms, this corresponded to a distribution phase.
These assumptions were subsequently confirmed by:
→ a brief push above the A high (the UTAD pattern — Upthrust After Distribution);
→ a sharp increase in bearish pressure. As a result, around the turn of the week, XAG/USD decisively broke not only the channel median but also its lower boundary.
Within the framework of Wyckoff methodology, this price action in silver can be interpreted as follows:
→ “smart money” has completed the distribution of long positions and shifted to selling into the market;
→ retail traders’ positions are being liquidated en masse, accelerating the decline.
In other words, following the Distribution phase, the market has entered the Mark-Down phase. The speed and violence of recent price moves — making timely decision-making particularly difficult — further support this interpretation.
Therefore, even if silver attempts a rebound under the current conditions of extreme oversoldness, any recovery is likely to face a strong resistance zone in the $87.5–95 area. This is where bears previously held a clear advantage while breaking the long-term ascending channel.
Start trading commodity CFDs with tight spreads (additional fees may apply). Open your trading account now or learn more about trading commodity CFDs with FXOpen.
This article represents the opinion of the Companies operating under the FXOpen brand only. It is not to be construed as an offer, solicitation, or recommendation with respect to products and services provided by the Companies operating under the FXOpen brand, nor is it to be considered financial advice.