Sample Category Title
Forex and Crytopcurrencies Forecasts
EUR/USD: Fed's "Boring" FOMC Protocol
The DXY dollar index hit a multi-year high of 105.05 on Friday, May 13, after a six-week rise. The last time it climbed this high was 20 years ago. However, a reversal followed, and it was already at the level of 101.50 exactly two weeks later. Following the general trend, the EUR/USD pair has also been growing since May 13, reaching the height of 1.0764 on May 27. The euro has pushed the dollar by 415 points during this time. And this is not at all the European currency that did it, but the American one. More specifically, the US Federal Reserve.
The minutes of the last Federal Open Market Committee (FOMC) meeting released on Wednesday May 25 did not bring any surprises. It had only what everyone already knew about. The content of the document simply confirmed the intention of the regulator to raise the refinancing rate by 0.5% at each of the next two meetings. Fed officials also unanimously approved a plan to start reducing the asset portfolio, which currently stands at $9 trillion, from June 1. The absence of any surprises in the FOMC protocol hurt the dollar, but it helped the shares: the stock indices S&P500, Dow Jones and Nasdaq went straight up.
The Eurozone macroeconomic calendar remained almost empty last week. As for the statistics from the US, it came out rather multidirectional. Initial jobless claims for the week fell to 210K, which is less than the expected 215K. Orders for durable goods rose by 0.4%, indicating further growth in consumer activity, which is the main driver of economic growth. However, on the other hand, US GDP for the Q1 was revised down to negative -1.5%, which is worse than both the previous estimate of -1.3% and the forecast of -1.4%.
Among medium-term factors, the aggressive policy of the US Central Bank continues to play on the side of the dollar. Its head, Jerome Powell, has repeatedly confirmed his intention to raise interest rates in order to curb inflation and prevent the economy from overheating. US annual inflation (CPI) hit 8.3% in April, more than four times the target of 2%. At the same time, according to analysts, a record rise in energy prices will continue to push inflation further upward in the coming months. And this, in turn, may push the Fed to further tighten monetary policy.
The US currency also continues to be supported by its status as a protective asset. As the armed conflict between Russia and Ukraine is expected to escalate, demand for it will continue to grow, as investors are concerned about the threat of stagflation in Europe. Rising tensions between China and Taiwan have increased craving for safe haven assets as well.
EUR/USD completed the past week at 1.0701. At the time of writing the review, on the evening of May 27, the voices of experts were divided as follows: 30% of analysts are sure that the pair will return to the movement to the south, 50% of analysts are waiting for the continuation of the ascent to the north, and the remaining 20% have taken a neutral position. There is no unity in the readings of the indicators on D1. Oscillators are 80% green, 10% red, and 10% neutral gray. At the same time, a quarter of the "green" is already in the overbought zone. There is parity among the trend indicators: 50% vote for the growth of the pair, 50% vote for its fall. The nearest resistance is located in zone 1.0750-1.0800. If successful, the bulls will try to break through the resistance of 1.0900-1.0945, then 1.1000 and 1.1050, after which they will meet resistance in the 1.1120-1.1137 zone. For the bears, task number 1 is to break through the support at 1.0640, then 1.0480-1.0500, and then update the May 13 low at 1.0350. If successful, they will move on to storm the 2017 low of 1.0340, there is only support from 20 years ago below.
A lot of statistics on consumer markets in Germany (May 30 and June 01) and the EU (May 31 and June 03) will be released this week. The publication on Wednesday, June 01 of the ISM business activity index in the US manufacturing sector is also noteworthy. On the same day, the ADP report on US non-farm employment will be published, and another piece of data from the US labor market will arrive on Friday, October 08, including such important indicators as the unemployment rate and the number of new non-farm payrolls (NFP).
GBP/USD: "Not Boring" Decision of the UK Government
The main factor behind the strengthening of the pound and the growth of the GBP/USD pair, as in the case of the euro, was the general weakening of the US currency. The two-week drop in the DXY dollar index was its worst losing streak since December 2021. However, unlike the euro, the British currency was helped by two more factors. The first is strong labor market data. The second is inflation in April, which peaked in four decades and gave investors hope for further tightening of monetary policy and higher interest rates by the Bank of England.
British Prime Minister Boris Johnson expressed his concern about the country's economic prospects last week. He said in an interview with Bloomberg TV on May 27 that he "expects a difficult period ahead" and "doesn't want to see a return to the 1970s-style wage-price spiral."
A day earlier, the decision of the government of the United Kingdom, in contrast to the "boring" of the Fed's protocol, greatly surprised the markets. UK Finance Minister Rishi Sunak announced a one-off payment of £650 to the lowest income households to help them with rising prices. The total amount of this fiscal bailout will be £15bn. And although Sunak argued that the support package would have a "minimal impact" on inflation, many analysts thought that this injection could prompt the Bank of England to revise its economic forecasts for this and next year. It is possible that the regulator will decide to take a more hawkish stance in order to limit inflationary pressure on the country's economy.
At the same time, for now, growth prospects for the UK economy remain significantly lower than on the other side of the Atlantic. And this causes many experts to doubt that the pound, together with the GBP/USD pair, can continue to grow steadily in the medium term. Especially if the tension around the Northern Ireland Protocol increases. Recall that this document is an addition to the Brexit Agreement, which regulates special trade, customs and immigration issues between the UK, Northern Ireland and the European Union.
The last chord of the past week sounded at 1.2628. 55% of experts vote for further growth of the pair, 35% for its fall, and the remaining 10% are for a sideways trend.
The situation with indicators on D1 is similar to their readings for EUR/USD. Among the trend indicators, 50% indicate the growth of the pair, and the same number indicate the fall. Among the oscillators, the balance of power is somewhat different: only 10% are looking south, another 10% are neutral, 80% are pointing north, although a quarter of them are already in the overbought zone. Supports are located at 1.2600-1.2620, 1.2475-1.2500, 1.2400, 1.2370, 1.2300, 1.2200, then 1.2154-1.2164 and 1.2075. A strong pivot point for the pair is at the psychologically important level of 1.2000. In case of further movement to the north, the pair will have to overcome the resistance 1.2675, then there are zones 1.2700-1.2750, 1.2800-1.2835 and 1.2975-1.3000.
Among the events of the upcoming week concerning the economy of the United Kingdom, we can note Wednesday, June 01, when the May value of the index of business activity in the manufacturing sector (PMI) will be published. Thursday 02 June and Friday 03 June are bank holidays in the UK.
USD/JPY: Japan Has Its Own Way. But which one?
Japanese Prime Minister Fumio Kishida has recently said that "the recent movements of the yen are driven by various factors" and has added that the government's priority is to help ease the pressure on households and businesses through various policy measures.
It is interesting to know what lies behind the wording "the recent movements of the yen". Is it the fact that USD/JPY has soared from 102.58 to 131.34 since January 2021, and the Japanese currency has weakened by 2,876 points? So this is not just some kind of "movement", but a real collapse, about which the country's households are moaning.
Inflation in the country continues to grow, which eventually causes dissatisfaction among the population. The rise in consumer prices is recorded for the eighth month in a row. They increased by 2.5% in April compared to the same month a year earlier, showing the highest growth rate since October 2014. As noted by Dow Jones, inflation has exceeded the 2.0% mark for the first time since September 2008, and this is without taking into account the effect of the consumption tax increase. But how do the leaders of the country react to this?
Whereas US and UK regulators fight inflation by tightening monetary policy, the opposite is true in Japan. According to the aforementioned Prime Minister Fumio Kishida, the authorities are aiming to meet the inflation target through the government's structural reforms, fiscal policy, and easing of the Bank of Japan's monetary policy. (Recall that the interest rate on the yen has been at a negative level of -0.1% for a long time).
Bank of Japan Governor Haruhiko Kuroda, in turn, explained that if energy prices do not show a sharp drop, Japan's core consumer price index (CPI) is likely to remain near the 2% mark for about the next 12 months.
At the same time, if we analyze the statements of both officials, certain discrepancies in their assessment of the economic situation become noticeable. On the one hand, Fumio Kishida says that the government's priority is to alleviate inflationary pressure, including by raising the wages of citizens. On the other hand, Haruhiko Kuroda says that against the background of such wage increases, a steady increase in inflation is possible. As a result, it is not yet clear at what point a compromise will be reached between the Government and the Central Bank of Japan, and what the country's economic policy will look like in the coming months.
Many investors, especially foreign ones, expect that, despite the regulator's assurances of its commitment to an ultra-soft monetary policy, it will still be forced to increase the interest rate. And, apparently, this expectation, along with the fall of DXY, provides support to the yen: the USD/JPY pair ended the last week at 127.11.
At the moment, 60% of analysts side with the bears, expecting further movement of the pair to the south, 15% vote for the resumption of the medium-term uptrend, and 25% expect movement in the sideways.
Among the indicators on D1, the alignment of forces is as follows. For oscillators, 60% are colored red, among which a third gives signals that the pair is oversold, 10% are colored green, and 30% are neutral gray. Among trend indicators, the parity is 50% to 50%. The nearest support is located at 126.35, followed by zones and levels 126.00 and 125.00 and 123.65-124.05. The goal of the bulls is to rise above the horizon of 127.55, then overcome the resistances of 128.00, 128.60 129.40-129.60, 130.00, 130.50 and renew the high of May 09 at 131.34. As the ultimate goal, the January 01, 2002 high of 135.19 is seen.
No important information regarding the state of the Japanese economy is expected to be released this week.
CRYPTOCURRENCIES: The Background Is Negative, but There Is Still Hope
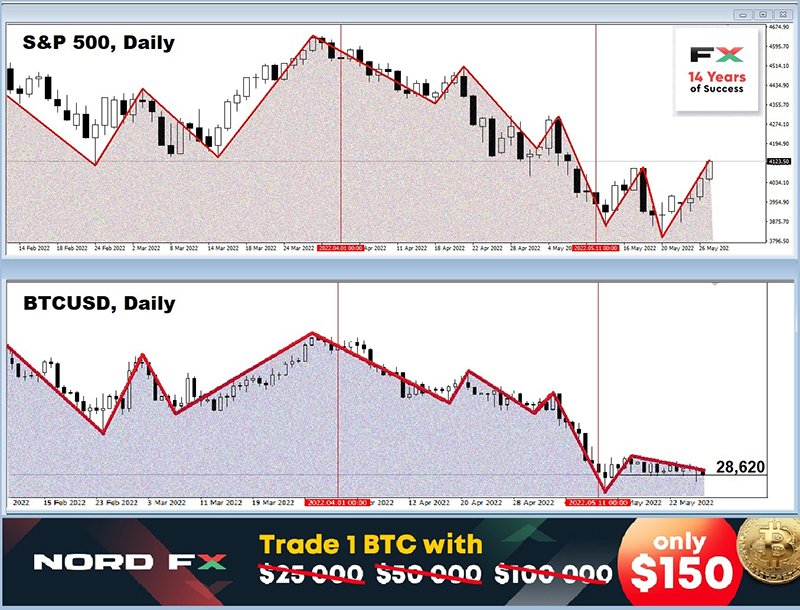
We have two pieces of news for you: good and bad. Let's start with the good one. Many experts, such as ARK Invest CEO Katherine Wood, literally dreamed that bitcoin would "get rid" of the S&P500, Dow Jones and Nasdaq stock indices, stop following them in the tail and take on a life of its own. And finally, we have seen something similar over the past two weeks. Despite the volatility in the stock markets, the bulls are desperately trying to keep the defense in the $30,000 zone from May 13 to May 27, preventing the BTC/USD pair from falling below the $28,620 support. This is where the good news ends. Let's move on to the bad one. More precisely, to the bad ones, because there are quite a lot of them.
Cryptocurrency No. 1 is trading in the negative zone for the first time in its history for the eighth week in a row. An important role in these dynamics was played by the direct correlation of BTC with stock indices, which was broken only in the last two decades of May.
Experts from Goldman Sachs noted in April that the Fed's aggressive policy could provoke recessionary phenomena in the US economy. Such expectations led to the flight of institutional investors from risky assets, including cryptocurrencies.
The overall trading activity is declining. The outflow of funds from cryptocurrency investment funds in the past two weeks has reached its highest levels since July 2021. The total amount in fund management has fallen to $38 billion. The number of transactions is also falling. The total volume of coins on crypto exchanges has decreased to 2.5 million BTC, bitcoin flows to cold wallets.
Against this background, negative statements about the main cryptocurrency are heard more and more often. The head of the ECB, Christine Lagarde, said on May 22 that the cryptocurrency does not have any security that could serve as stability. The next day, she was joined by the head of the Bank of England Andrew Bailey, according to whom bitcoin has no intrinsic value and is not suitable as a means of payment.
Scott Minerd, Investment Director of Guggenheim Partners, agrees with the heads of the Central Banks. "Currency should store value, be a means of exchange and a unit of account. There is nothing like it, they [cryptocurrencies] have not even come to a single basis," he concluded and compared the situation on the crypto market with the dot-com bubble. According to him, most digital assets are "junk", but bitcoin and ethereum will survive the crypto winter, which will be long. "When you break $30,000, $8,000 is the ultimate bottom. Therefore, I think we still have a lot of room to decline, especially with the Fed acting tough," Scott Minerd predicted.
Galaxy Digital CEO Mike Novogratz also sees the outlook for the entire financial market as grim. He believes that even despite a significant drop from their all-time highs, altcoins risk losing more than half of their value. However, despite the bearish macroeconomic background, the head of Galaxy Digital remains optimistic and believes in the recovery of the crypto market in the future. According to the head of Galaxy Digital, "The crypto community is resilient and believes that the markets still provide early entry opportunities."
Indeed, if you analyze social networks, you can see that their users, unlike institutional ones, have much more faith in a better future. Thus, the analytical company Santiment published the data of its Weighted indicator, which calculates negative and positive comments on an asset in social networks. Based on this information, a kind of mood of the crypto community is determined. According to the readings of this instrument, bitcoin has already reached the global bottom and can be expected to rise in the coming weeks. "Now is the moment when bitcoin has every chance of a limited strengthening," analysts at Santiment believe.
One of the most respected social media analysts aka Credible also believes that, despite the general bearish mood in the markets, BTC is ready to take off. Credible uses the Elliott wave theory for technical analysis, which predicts the behavior of the rate based on the psychology of the crowd, which manifests itself in the form of waves. This theory assumes that a bull market cycle goes through 5 impulse waves, with the asset correcting during the 2nd and 4th waves and rallying during the 1st, 3rd and 5th waves. In addition, each major wave consists of 5 smaller sub-waves.
According to the analyst, bitcoin is now in the middle of the main 5th wave that began at the start of 2019. In addition, BTC is currently still in the 5th sub-wave, which can push the asset to a new all-time high above $100,000. "I understand that my approach is controversial," writes Credible. "Most do not expect a new all-time high until the next halving in 2024, but I expect it sooner, in a few months."
Rekt Capital, which has over 300,000 Twitter followers, has warned that bitcoin could briefly drop 28% below its 200-week moving average. He explained that this SMA is playing the role of an ever-growing latest support. Bitcoin has fallen below this line in the past, but these periods of capitulation were very short-lived. The weekly candlestick has never closed below this SMA yet, but its shadows were as high as 28%. If this happens again now, the cryptocurrency rate will be at the level of $15,500. The 200-week moving average is currently in the $22,000 zone.
According to another cryptanalyst named Rager, "If the price of BTC declines and bounces off the 200-week moving average, as in past bearish cycles, this is a good sign. There will be a decline of only 68% of the maximum." However, according to his calculations, such declines were as high as 84% in the past, and "in the current realities, an 84% pullback would lead to $11,000." That being said, given the length of BTC's bearish cycles in 2014 and 2018, it could take 6 to 8 months before bottoming out.
Rager believes that in the short term, the price of bitcoin will continue to depend on the strength or weakness of the US stock market: "BTC has limited upside right now, but it will not strengthen until the stock markets turn around."
According to Glassnode, the ratio of open put- and call-options for BTC has increased from 50% to 70%, which indicates an increased desire of investors to secure positions from continued negative dynamics.
The open interest (OI) in call contracts with expiration at the end of July this year is concentrated around the $40,000 mark. However, participants give the greatest preference to put options, which will bring profit in case of price reduction to $25,000, $20,000 and $15,000. In other words, until the middle of the year, the market focuses on hedging risks and/or speculating on a further price reduction.
Optimists predominate over the longer distance. Contracts maturing at the end of the year have the most open positions in the range of $70,000 to $100,000. In the put option, the largest OI is concentrated between $25,000 and $30,000, that is, it is in the zone of current values.
We complete the review of good and bad news for today on this note. We only note that at the time of writing the review, on the evening of Friday May 27, the total capitalization of the crypto market is at the level of $1.194 trillion ($1.248 trillion a week ago). The Bitcoin Fear & Greed Index is firmly entrenched in the Extreme Fear zone and is at around 12 points. (Recall that it fell to 8 points on May 17, the lowest level since March 28, 2020). The BTC/USD pair is struggling to stay in the war zone, trading at $28,800.
EUR/USD Weekly Outlook
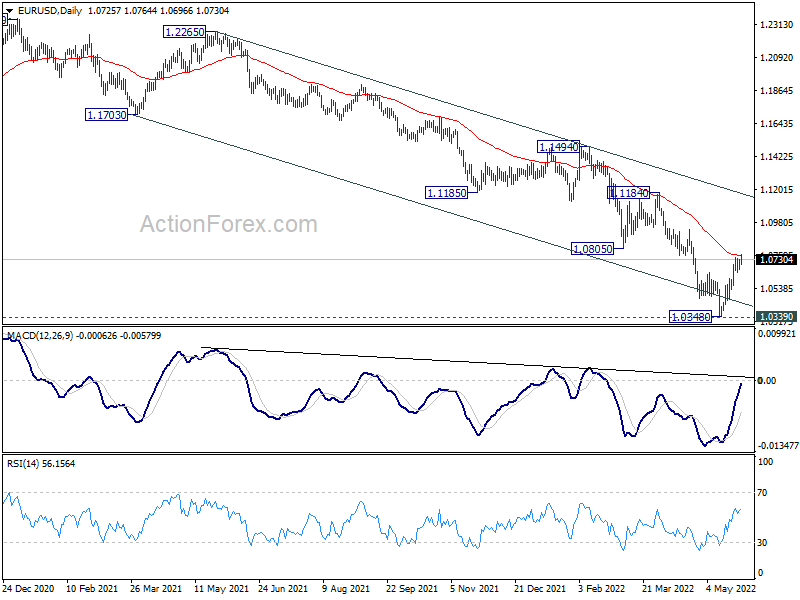
EUR/USD rebound from 1.0348 short term bottom continued last week. Initial bias stays on the upside this week. Sustained trading above 55 day EMA (now at 1.0757) will target 1.0935 resistance next. On the downside, however, break of 1.641 minor support will turn bias back to the downside for retesting 1.0348 low instead.
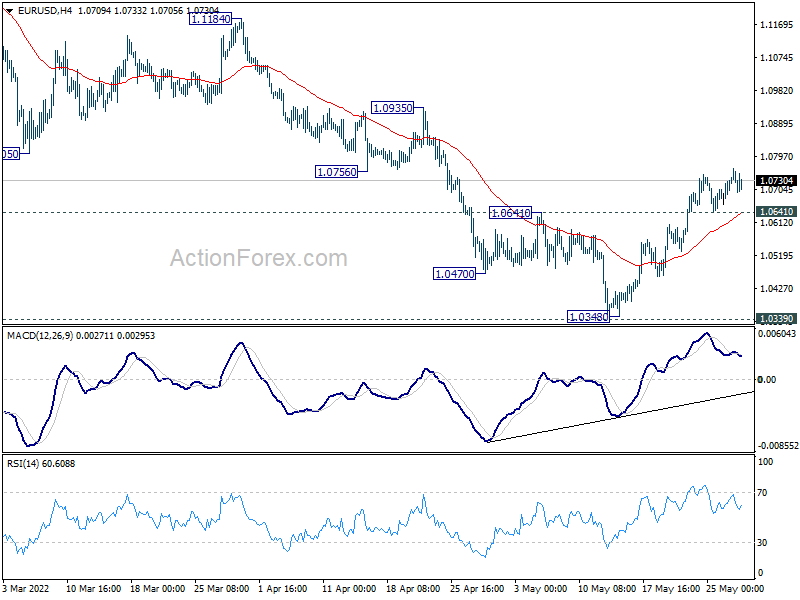
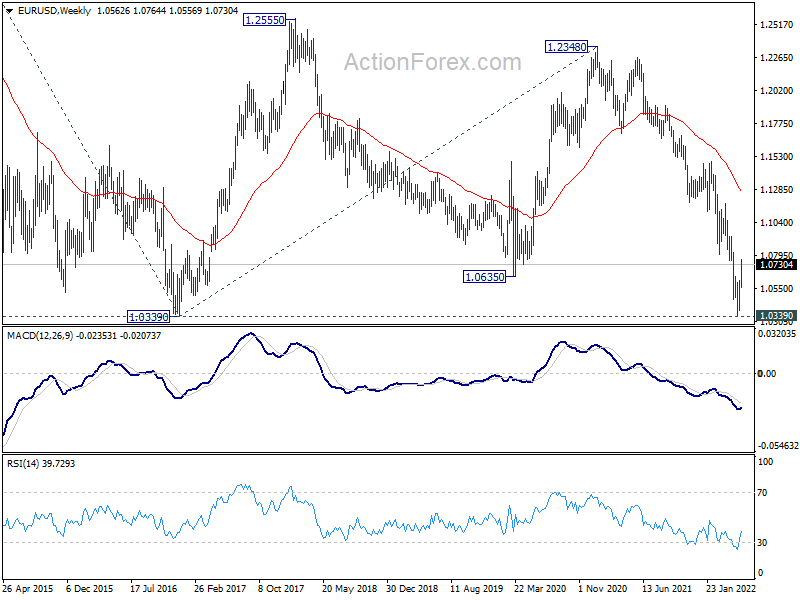
In the bigger picture, focus stays on 1.0339 long term support (2017 low). Decisive break there will resume whole down trend from 1.6039 (2008 high). Next target is 61.8% projection of 1.3993 to 1.0339 from 1.2348 at 1.0090. However, firm break of 1.0805 support turned resistance will delay this bearish case and bring medium term corrective rebound first.
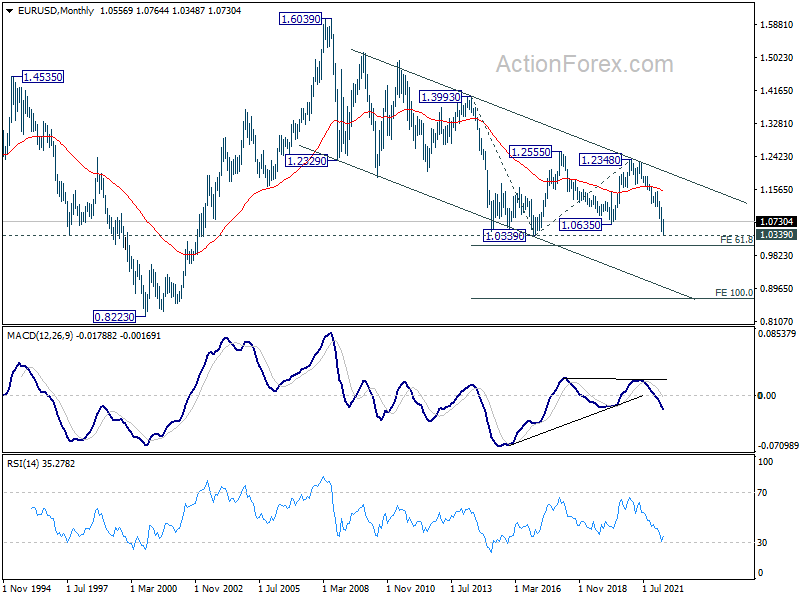
In the long term picture, current development suggests that long term down trend from 1.6039 (2008 high) is ready to resume. Break of 1.0339 will target 61.8% projection of 1.3993 to 1.0339 from 1.2348 at 1.0090. Decisive break there could bring downside acceleration towards 100% projection at 0.8694.
USD/JPY Weekly Outlook
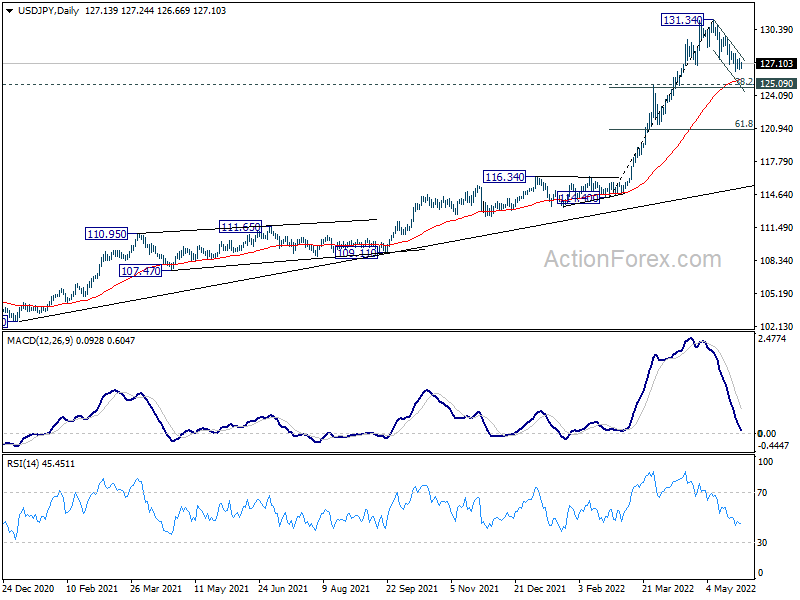
USD/JPY's correction from 131.34 continued last week and overall outlook is unchanged. Deeper decline could be seen this week, but downside should be contained by 125.09 cluster support (38.2% retracement of 114.40 to 131.34 at 124.86) to bring rebound. On the upside, break of 129.77 minor resistance will suggest that the correction is finished and bring retest of 131.34.
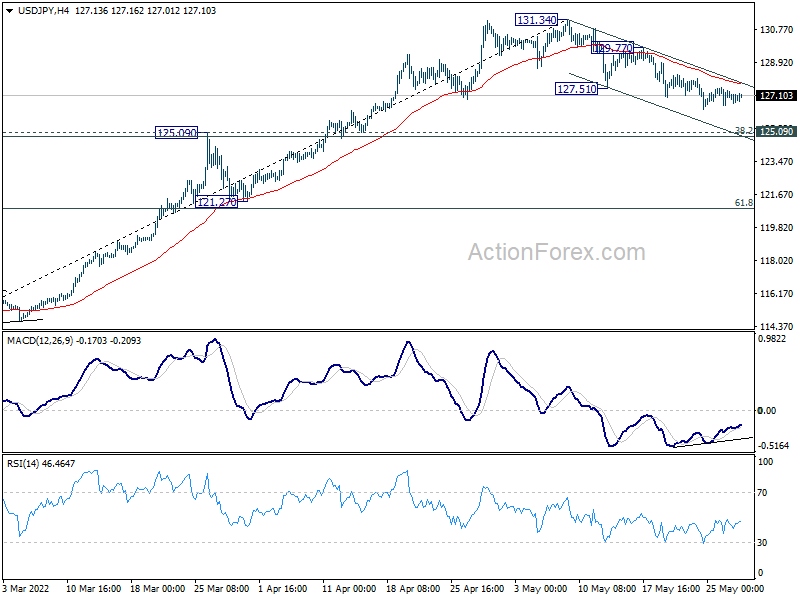
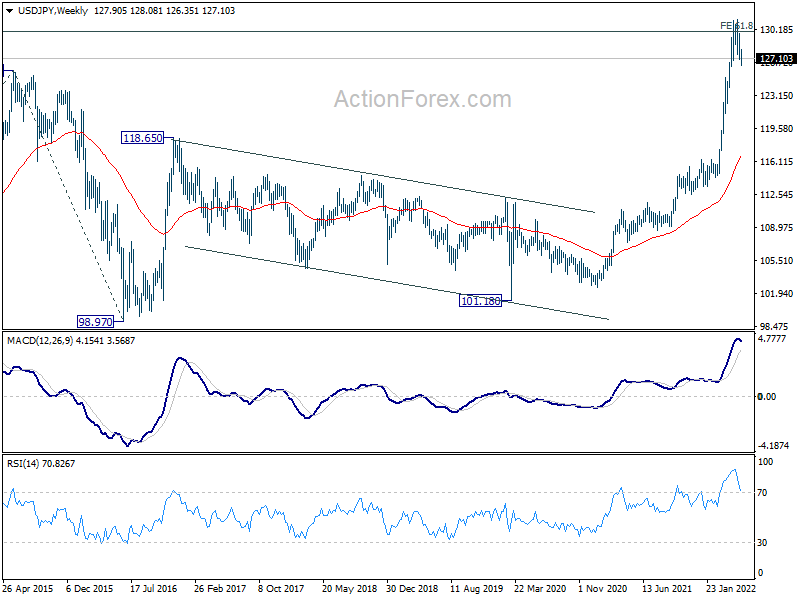
In the bigger picture, current rally is seen as part of the long term up trend form 75.56 (2011 low). Sustained trading above 61.8% projection of 75.56 (2011 low) to 125.85 (2015 high) from 98.97 at 130.04 will pave the way to 100% projection at 149.26, which is close to 147.68 (1998 high). For now, this will remain the favored case as long as 121.27 support holds.
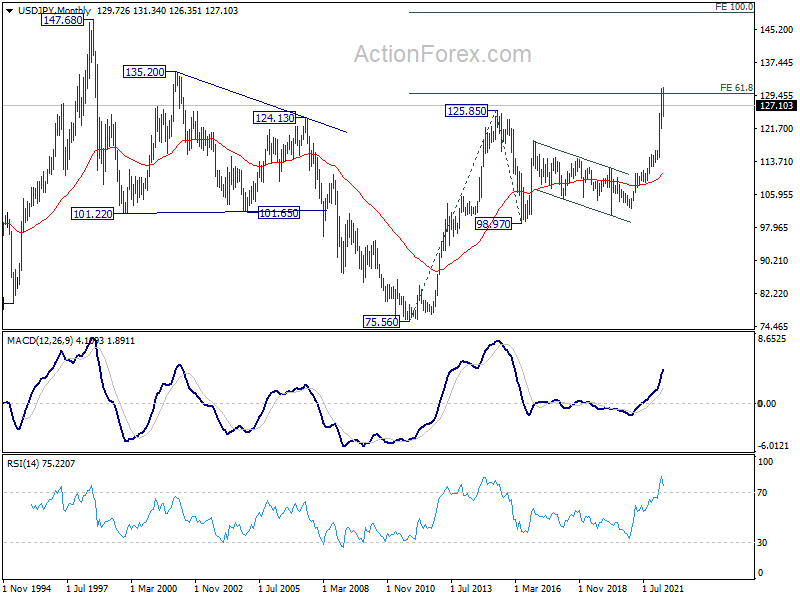
In the long term picture, the up trend from 75.56 (2011 low) long term bottom to 125.85 (2015 high) has just resumed. First target at 61.8% projection of 75.56 to 125.85 from 98.97 at 130.04 was already met. Next is 100% projection at 149.26, which is close to 147.68 (1998 high).
GBP/USD Weekly Outlook
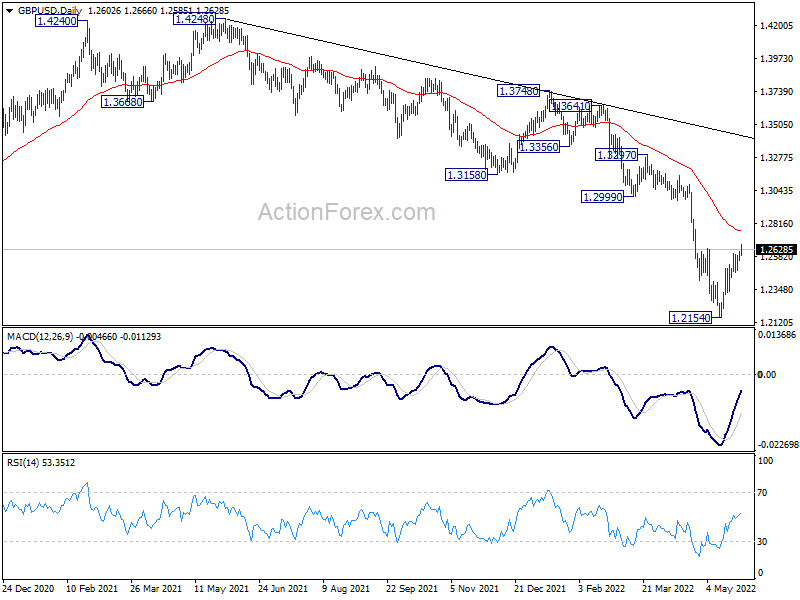
GBP/USD's rebound from 1.2154 extended higher last week. Initial bias stays on the upside for 55 day EMA (now at 1.2760). Sustained break there will target 1.2999 support turned resistance. On the downside, though, break of 1.2480 minor support will turn bias back to the downside for retesting 1.2154 low instead.
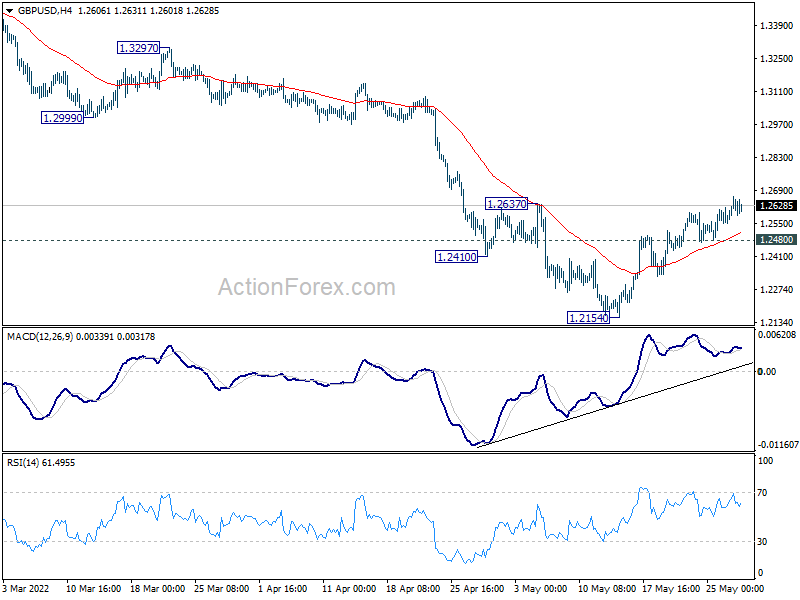
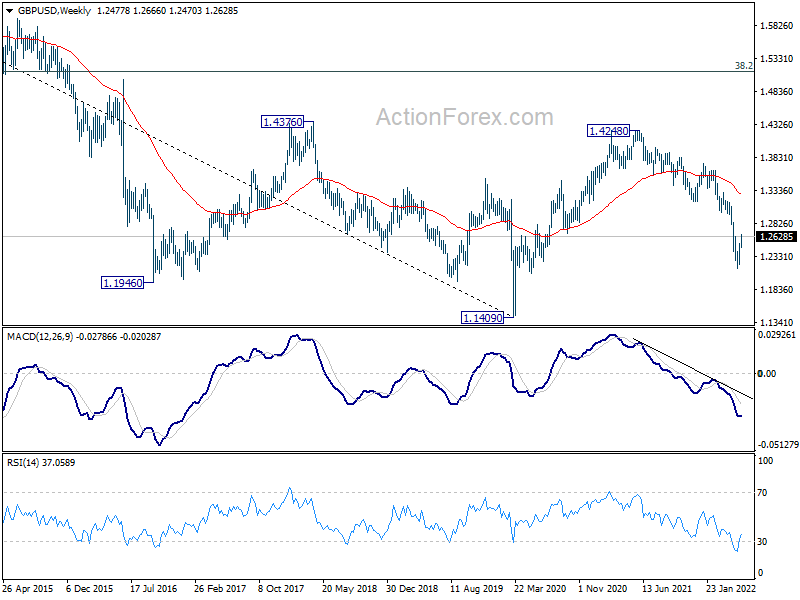
In the bigger picture, fall from 1.4248 (2018 high) could be a leg inside the pattern from 1.1409 (2020 low), or resuming the longer term down trend. Deeper decline is expected as long as 1.2999 support turned resistance holds. On resumption, next target is 1.1409 low.
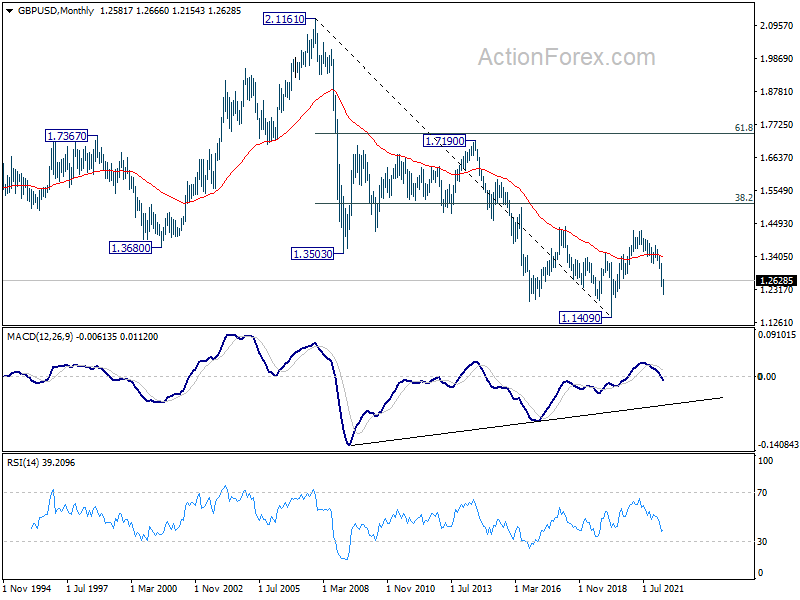
In the longer term picture, rebound from 1.1409 long term bottom should have completed at 1.4248 already, well ahead of 38.2% retracement of 2.1161 to 1.1409 at 1.5134. The development argues that price actions from 1.1409 are developing into a corrective pattern only. That is, long term bearishness is retained for resuming the downside from 2.1161 (2007 high) at a later stage.
USD/CHF Weekly Outlook
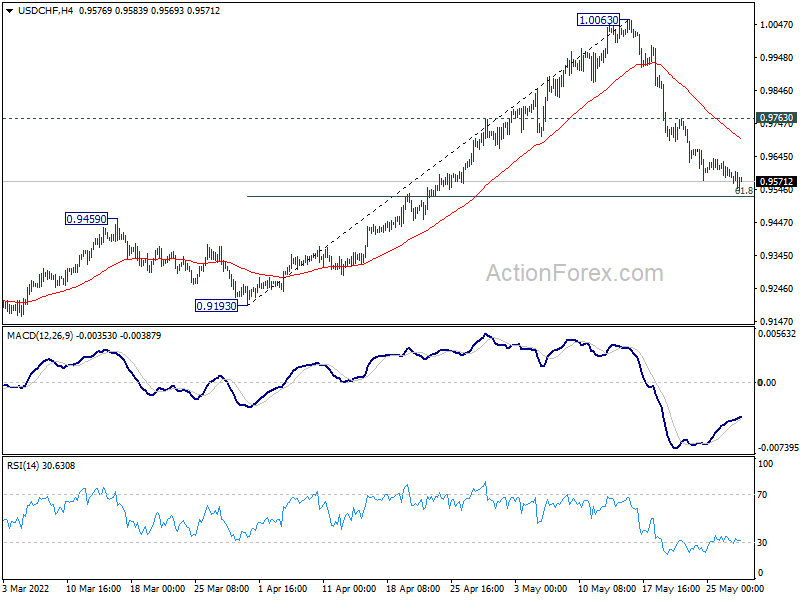
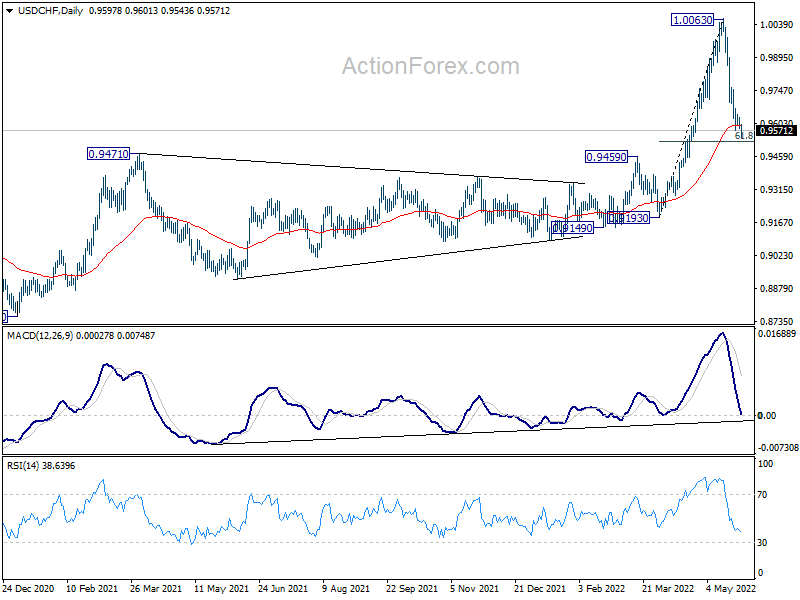
USD/CHF's correction from 1.0063 extended lower last week despite loss of downside momentum. Further decline is still in favor this week. But downside should be contained by 61.8% retracement at 0.9525 to bring rebound. On the upside, above 0.9763 minor resistance will turn bias back to the upside for recovery. However, sustained break of 0.9525 will bring deeper decline to 0.9193 support.
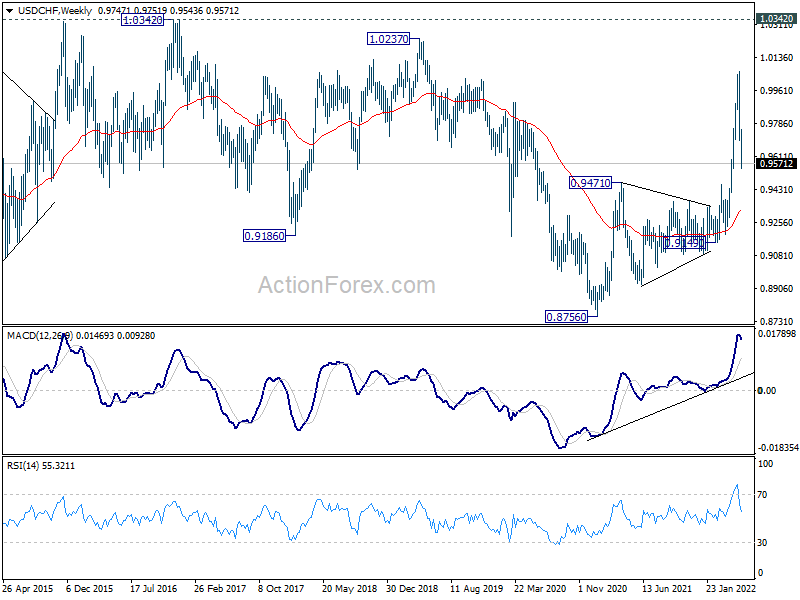
In the bigger picture, down trend from 1.0342 (2016 high) should have completed with three waves down to 0.8756 (2021 low) already. Rise from 0.8756 is likely a medium term up trend of its own. Next target is 1.0237/0342 resistance zone. This will remain the favored case as long as 0.9471 resistance turned support holds. However, sustained break of 0.9471 will extend long term range trading with another falling leg.
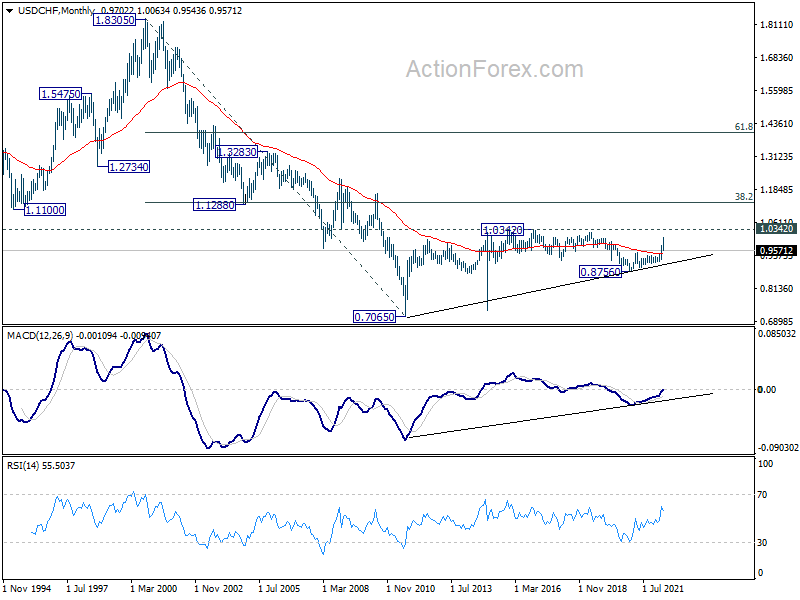
In the long term picture, current development argues that the correction from 1.0342 (2016 high) has completed at 0.8756 (2020 low) already. Rise from 0.7065 (2011 low) might be ready to resume. Firm break of 1.0342 will confirm and target 38.2% retracement of 1.8305 (2000 high) to 0.7065 at 1.1359.
AUD/USD Weekly Outlook
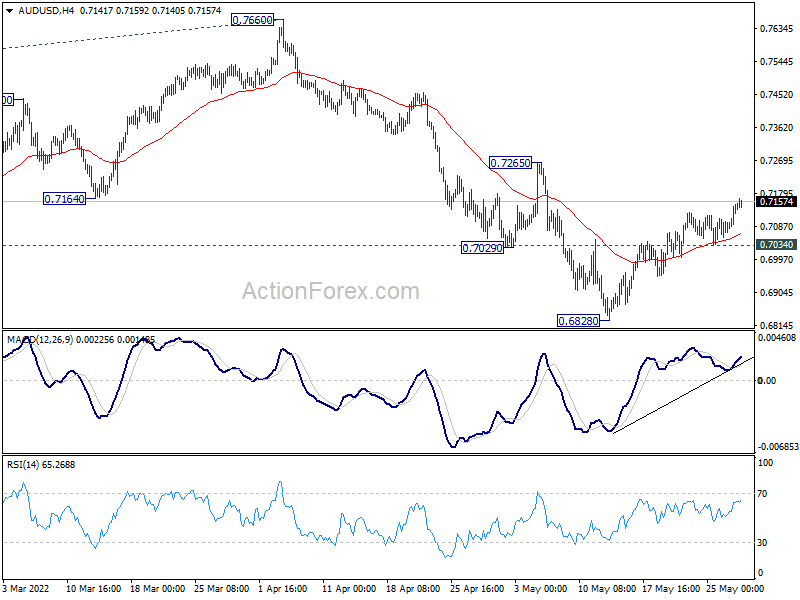
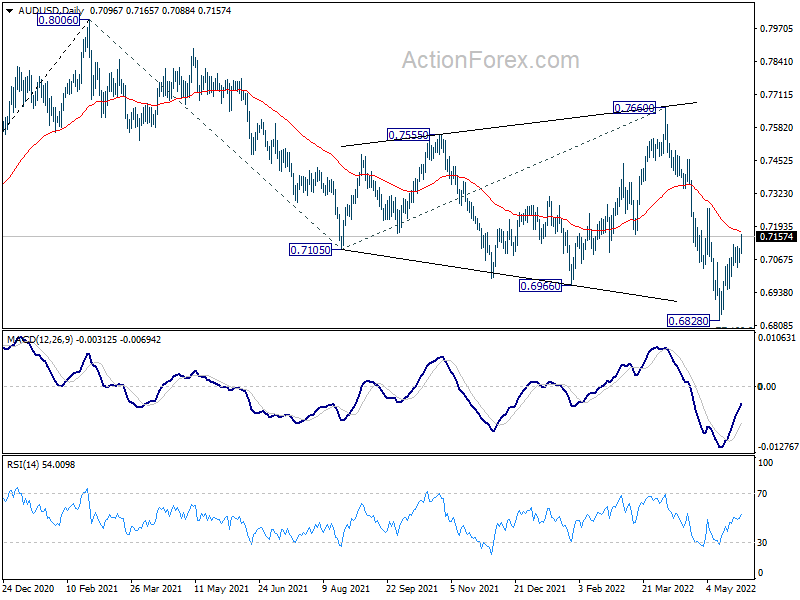
AUD/USD's rebound from 0.6828 short term bottom continued last week. Initial bias stays on the upside this week for further rally. Sustained break of 55 day EMA (now at 0.7174) will target 0.7265 resistance next. On the downside, though, break of 0.7034 minor support will turn bias back to the downside for retesting 0.6828 low.
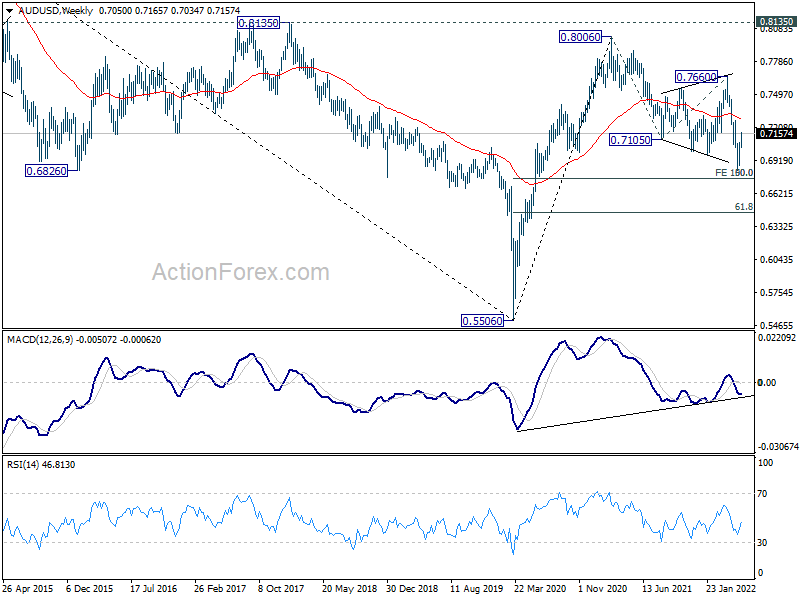
In the bigger picture, price actions from 0.8006 are seen as a corrective pattern to rise from 0.5506 (2020 low). Deeper fall could be seen to 50% retracement of 0.5506 to 0.8006 at 0.6756. This coincides with 100% projection of 0.8006 to 0.7105 from 0.7660 at 0.6760. Strong support is expected from 0.6756/60 cluster to contain downside to complete the correction. However, sustained break of 0.6756/60 would argue that AUD/USD is indeed already in a medium term down trend.
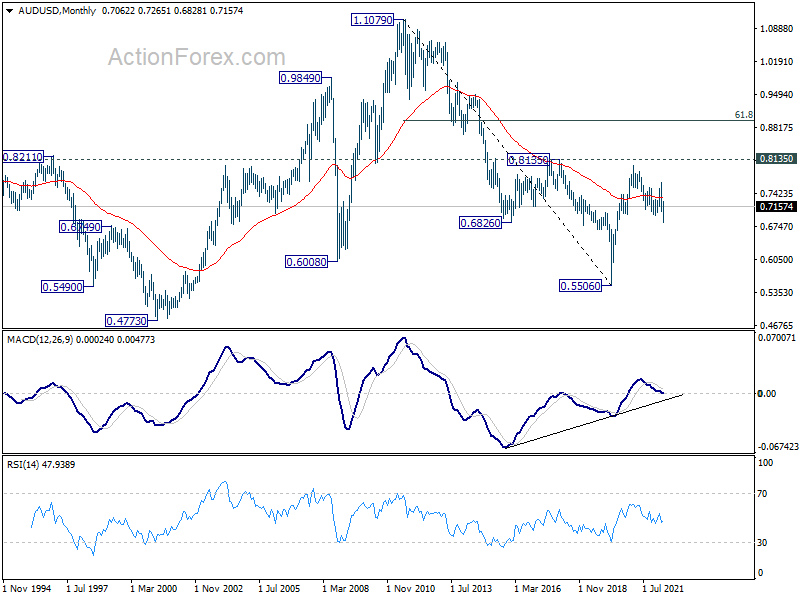
In the longer term picture, focus remains on 0.8135 structural resistance. Decisive break there will argue that rise from 0.5506 is developing into a long term up trend that reverses whole down trend from 1.1079 (2011 high). However, rejection by 0.8135 will keep long term outlook neutral at best.
USD/CAD Weekly Outlook
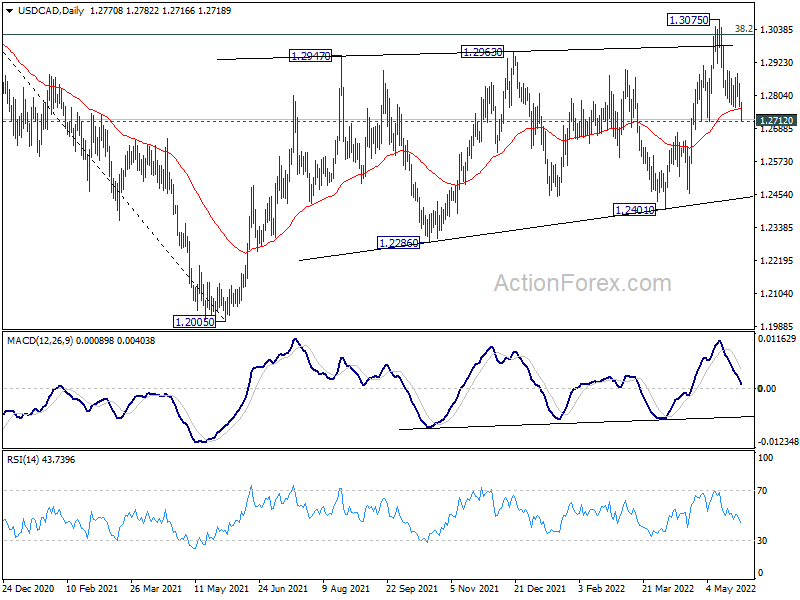
USD/CAD's fall from 1.3075 extended lower last and immediate focus is now on 1.2712 support this week. Firm break there would indicate rejection by 1.3022 key fibonacci resistance. Deeper fall would be seen back to 1.2401 support next. On the upside, though, above 1.2884 minor resistance will retain near term bullishness and turn bias back to the upside for 1.3075 high.
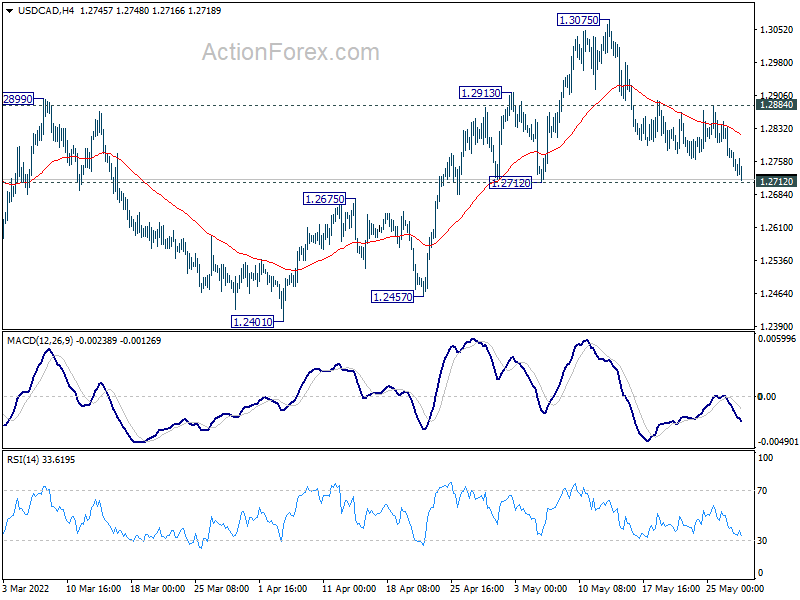
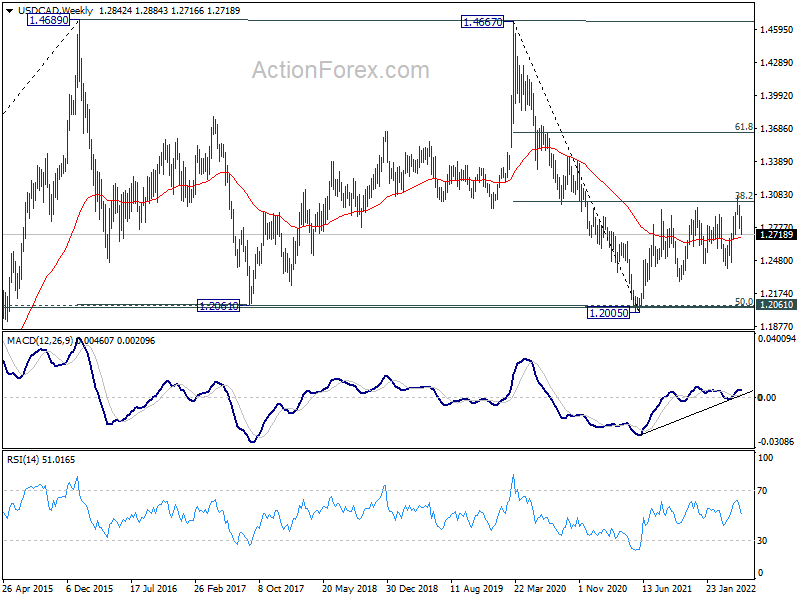
In the bigger picture, focus stays on 38.2% retracement of 1.4667 (2020 high) to 1.2005 (2021 low) at 1.3022. Sustained break there should confirm that the down trend from 1.4667 has completed after defending 1.2061 long term cluster support. Further rise would then be seen towards 61.8% retracement at 1.3650. However, rejection by 1.3022 will maintain medium term bearishness. Break of 1.2005 will resume the down trend from 1.4667 and that carries larger bearish implications too.
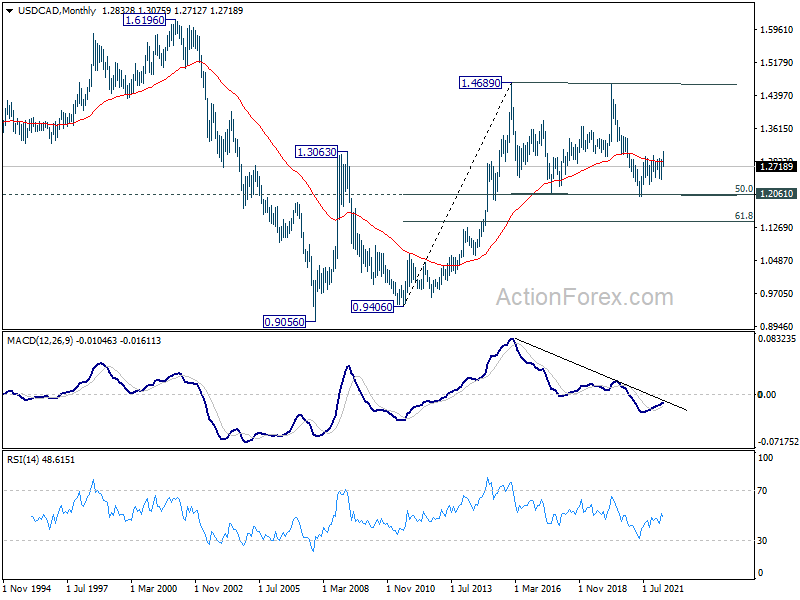
In the longer term picture, price actions from 1.4689 (2016 high) are seen as a consolidation pattern only. That is, up trend from 0.9506 (2007 low) is still expected to resume at a later stage. This will remain the favored case as long as 1.2061 support holds, which is close to 50% retracement of 0.9406 to 1.4689 at 1.2048. However, firm break of 1.2061 support will argue that USD/CAD has already started a long term down trend. Next target is 61.8% retracement of 0.9406 to 1.4689 at 1.1424.
GBP/JPY Weekly Outlook
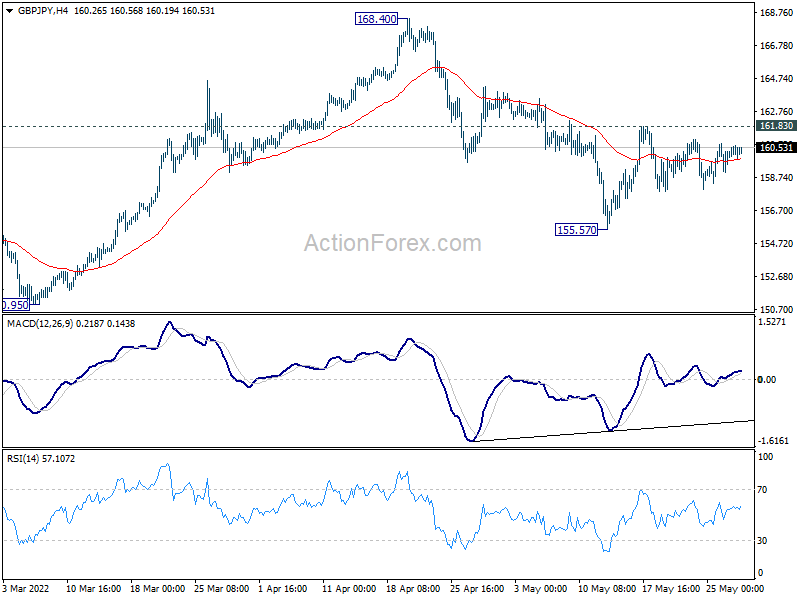
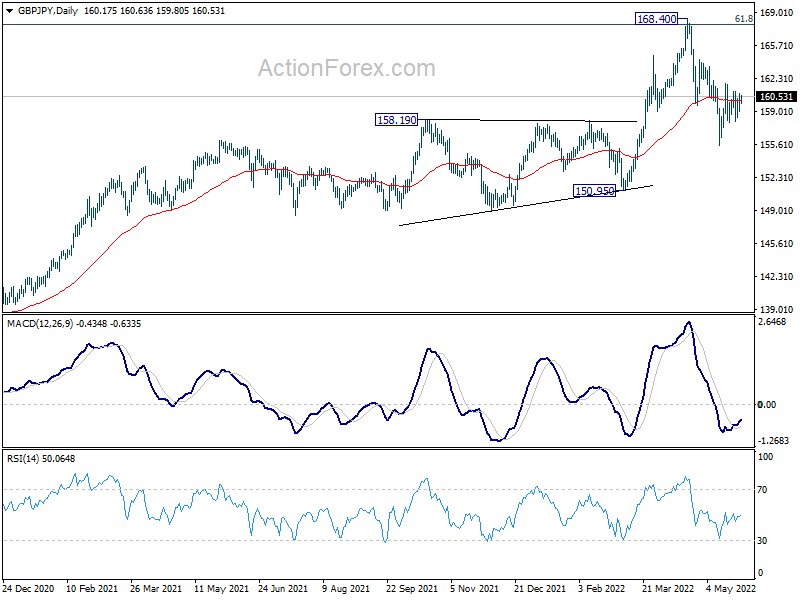
GBP/JPY stayed in corrective pattern from 168.40 last week and outlook is unchanged. Initial bias remains neutral this week. On the downside, break of 155.57 will extend the correction towards 150.96 key structural support. Nevertheless, on the upside, firm break of 162.16 will indicate that the correction has completed, and bring retest of 168.40 high next.
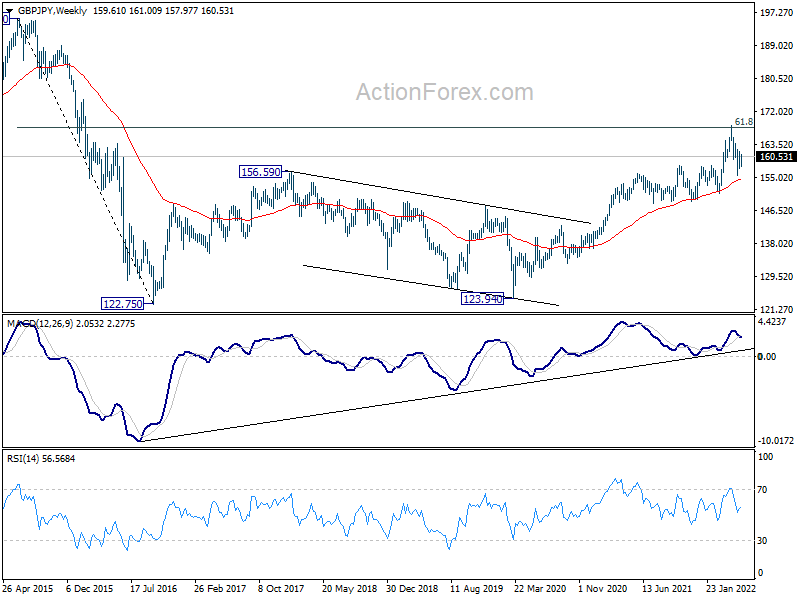
In the bigger picture, up trend from 123.94 (2020 low) is still in progress. Sustained break of 61.8% retracement of 195.86 (2015 high) to 122.75 (2016 low) at 167.93 will be a long term bullish signal, and could pave the way back to 195.86 high. This will now remain the favored case as long as 150.95 support holds, even in case of deep pull back. However, firm break of 150.95 will indicate rejection by 167.93, and bearish trend reversal.
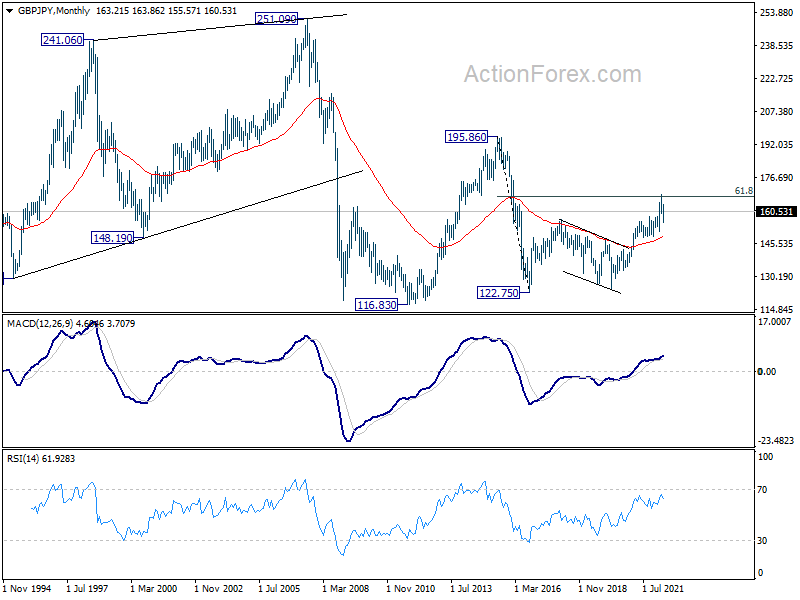
In the longer term picture, rise from 122.75 could be the third leg the the pattern from 116.83 (2011 low). Further rise will remain in favor as long as 55 month EMA (now at 148.69) holds. Sustained break of 61.8% retracement of 195.86 to 122.75 at 167.93. will pave the way to 195.86 (2015 high).
EUR/JPY Weekly Outlook
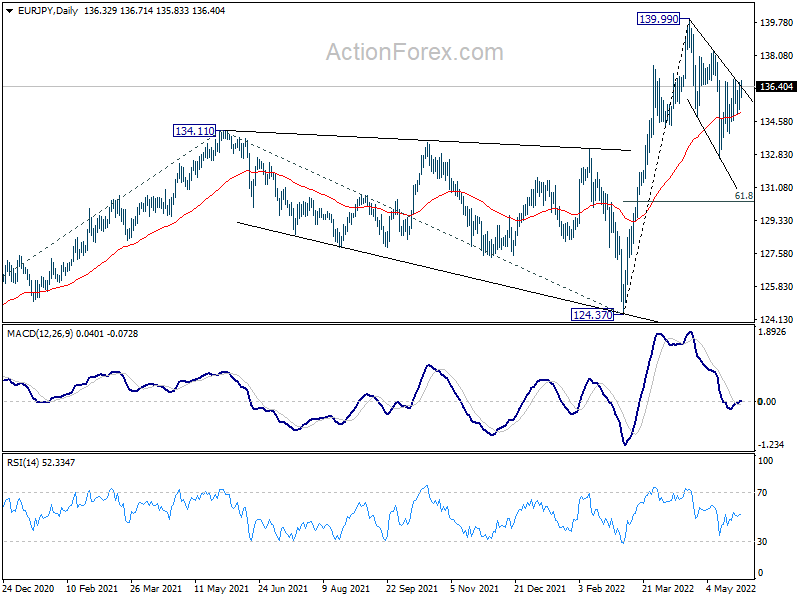
EUR/JPY stayed in the corrective pattern from 139.99 last week and outlook is unchanged. Initial bias stays neutral this week first. On the downside, break of 132.63 will target 61.8% retracement of 124.37 to 139.99 at 130.33. On the upside, break of 138.33 will indicate that the correction has completed, and bring retest of 139.99 high next.
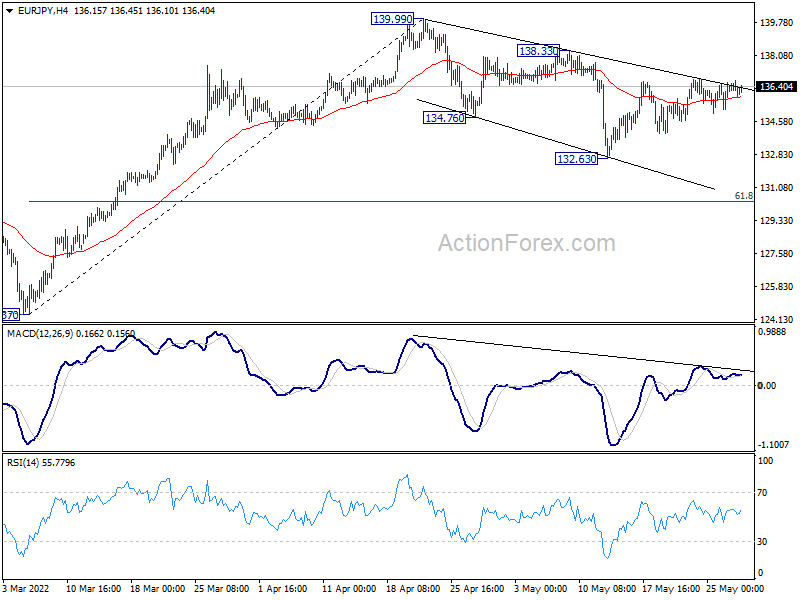
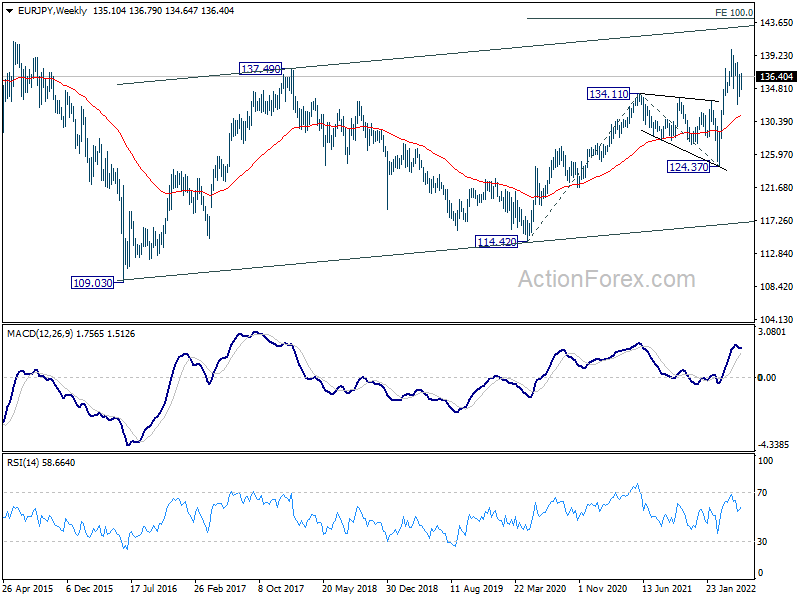
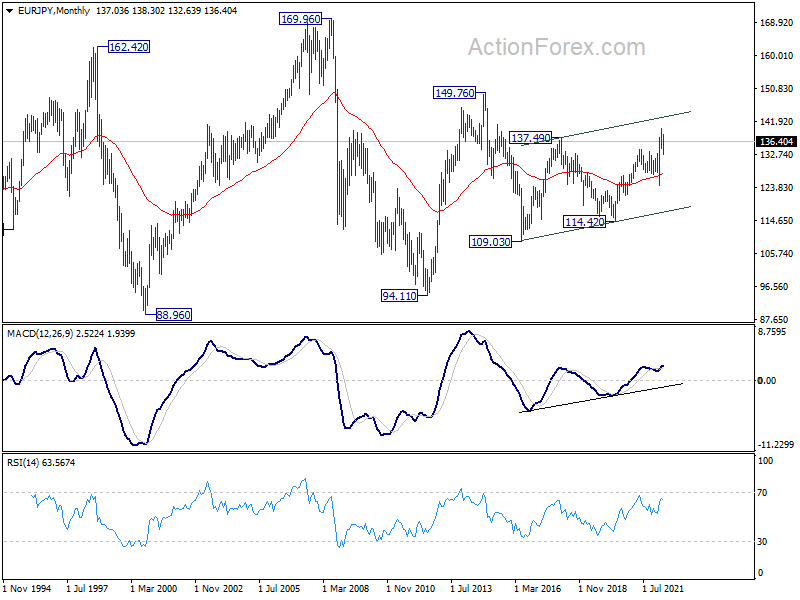
In the bigger picture, up trend from 114.42 (2020 low) is in progress. Such rise is seen as the third leg of the pattern from 109.30 (2016 low). Next target will be 100% projection of 114.42 to 134.11 from 124.37 at 144.06. In any case, outlook will now remain bullish as long as 124.37 support holds, in case of deep pull back.
In the long term picture, focus stays on 137.49 resistance (2018 high). Sustained break there will raise the chance that whole rise from 94.11 (2012 low) is resuming through 149.76 resistance. This will be a slightly favored case for now, as long as 124.37 support holds.
EUR/GBP Weekly Outlook
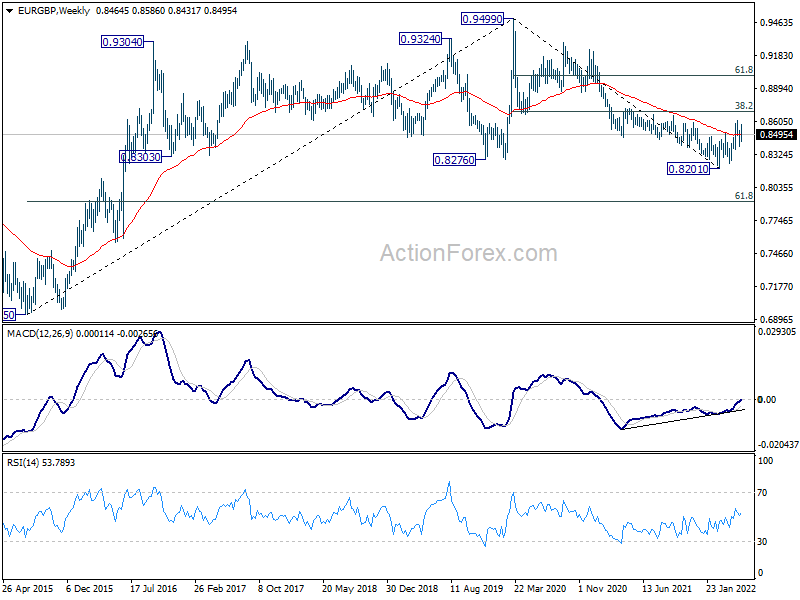
EUR/GBP stayed in range trading last weekend outlook is unchanged. Initial bias remains neutral this week first. Further rally is in favor with 0.8365 support intact. On the upside, break of 0.8617 will resume rise from 0.8201 medium term bottom to 0.8697 medium term fibonacci level. However, break of 0.8365 will dampen this bullish view, and turn bias back to the downside instead.
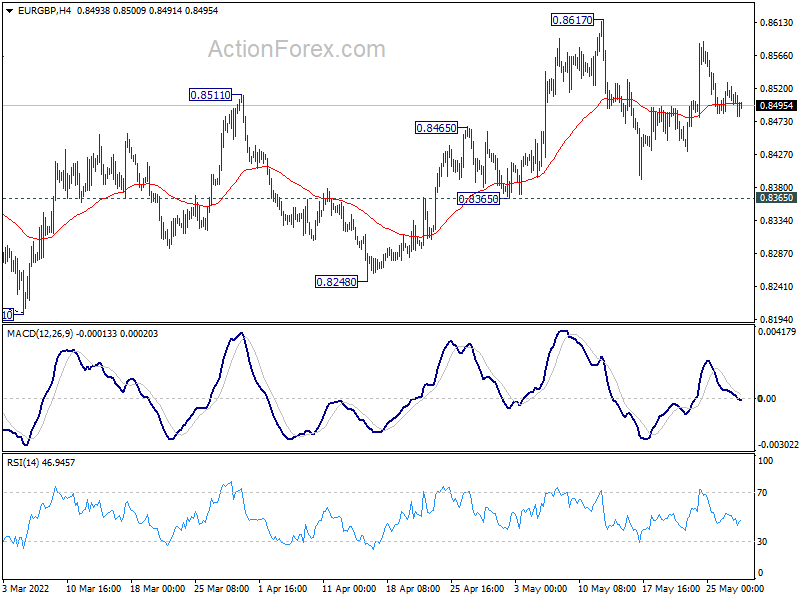
In the bigger picture, a medium term bottom could be in place at 0.8201, on bullish convergence condition in daily and weekly MACD. Rise from there could either be a correction to the down trend from 0.9499 (2020 high), or a medium term up trend itself. In either case, further rise should be seen to 38.2% retracement of 0.9499 to 0.8201 at 0.8697. Sustained break there will target 61.8% retracement at 0.9003.
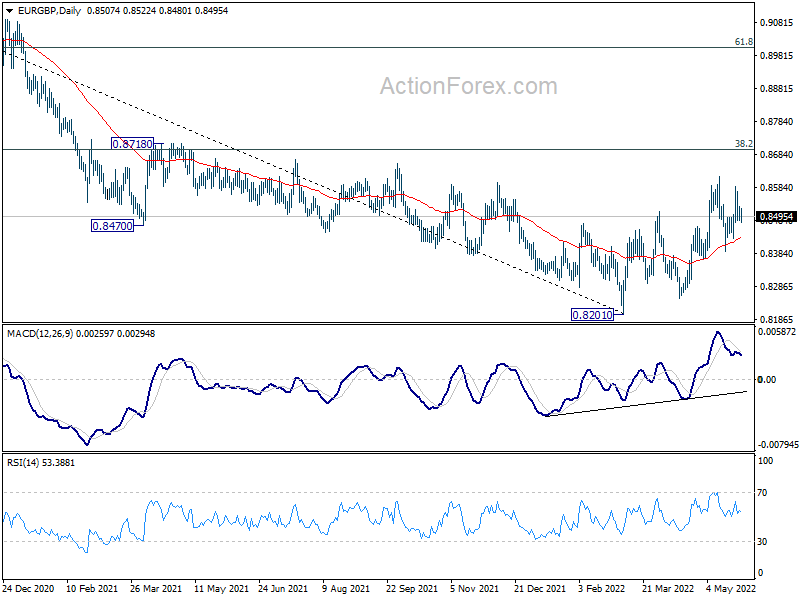
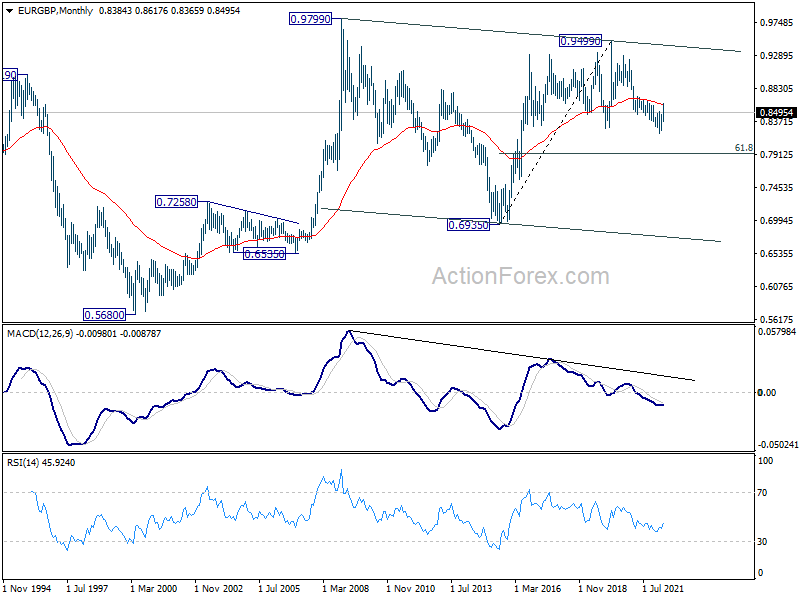
In the long term picture, current development argues that fall from 0.9499 is probably the third leg of the pattern from 0.9799 (2008 high). Sustained break of 61.8% retracement of 0.6935 to 0.9499 at 0.7917 will pave the way back to 0.6935 (2015 low) and probably below. However, sustained trading above 55 month EMA (now at 0.8604) will dampen this bearish view and bring stronger rebound.