

Sample Category Title
GBP/USD Daily Outlook
Daily Pivots: (S1) 1.2567; (P) 1.2594; (R1) 1.2636; More...
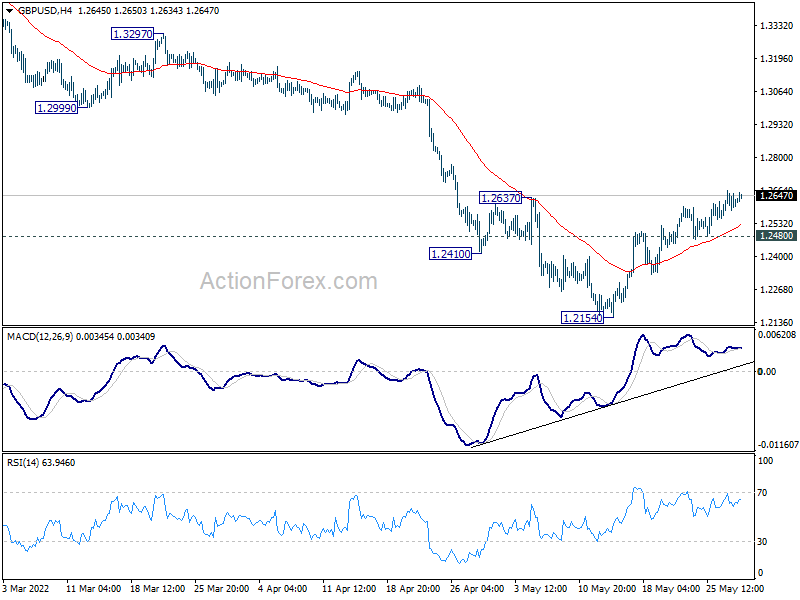
Intraday bias in GBP/USD remains on the upside as rise from 1.2154 is in progress for 55 day EMA (now at 1.2756). Sustained break there will target 1.2999 support turned resistance. On the downside, though, break of 1.2480 minor support will turn bias back to the downside for retesting 1.2154 low instead.
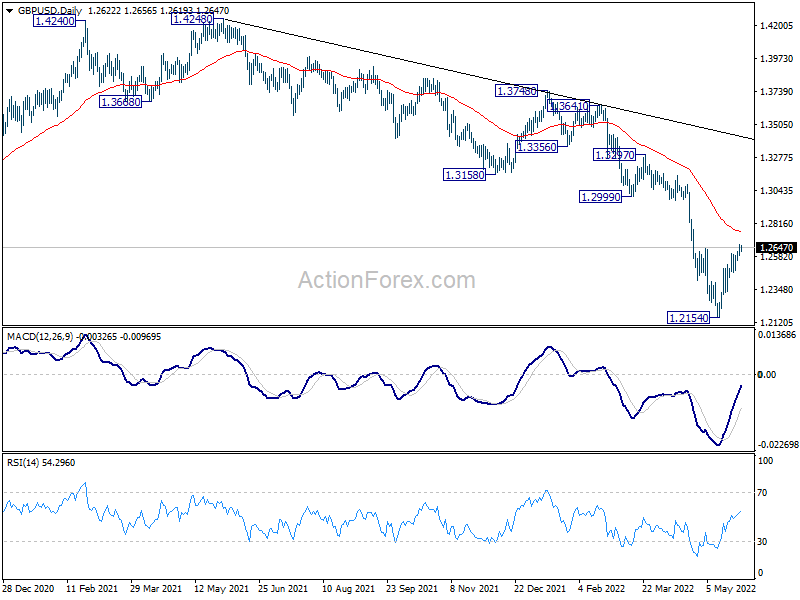
In the bigger picture, fall from 1.4248 (2018 high) could be a leg inside the pattern from 1.1409 (2020 low), or resuming the longer term down trend. Deeper decline is expected as long as 1.2999 support turned resistance holds. On resumption, next target is 1.1409 low.
USD/CHF Daily Outlook
Daily Pivots: (S1) 0.9546; (P) 0.9575; (R1) 0.9605; More...
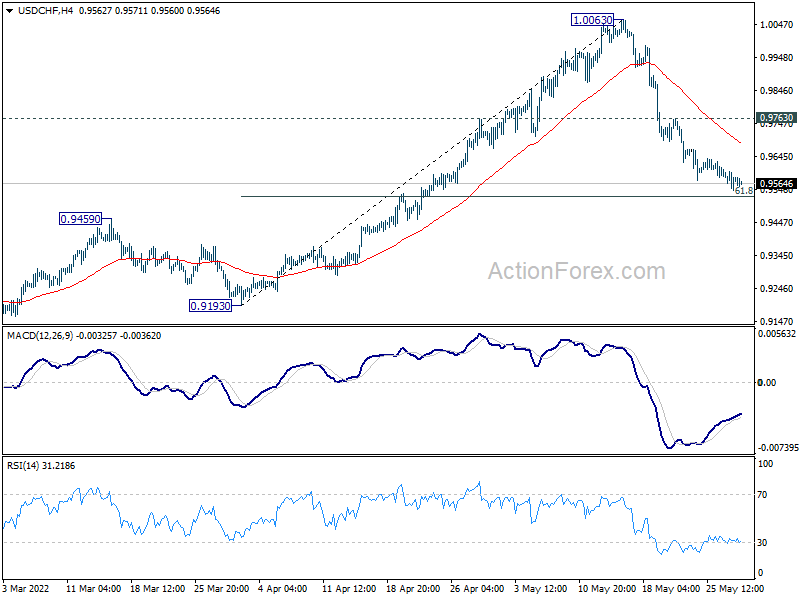
Outlook in USD/CHF remains unchanged as fall from 1.0063 could extend lower. But should be contained by 61.8% retracement of 0.9193 to 1.0063 at 0.9525 to bring rebound. On the upside, above 0.9763 minor resistance will turn bias back to the upside for recovery. However, sustained break of 0.9525 will bring deeper decline to 0.9193 support.
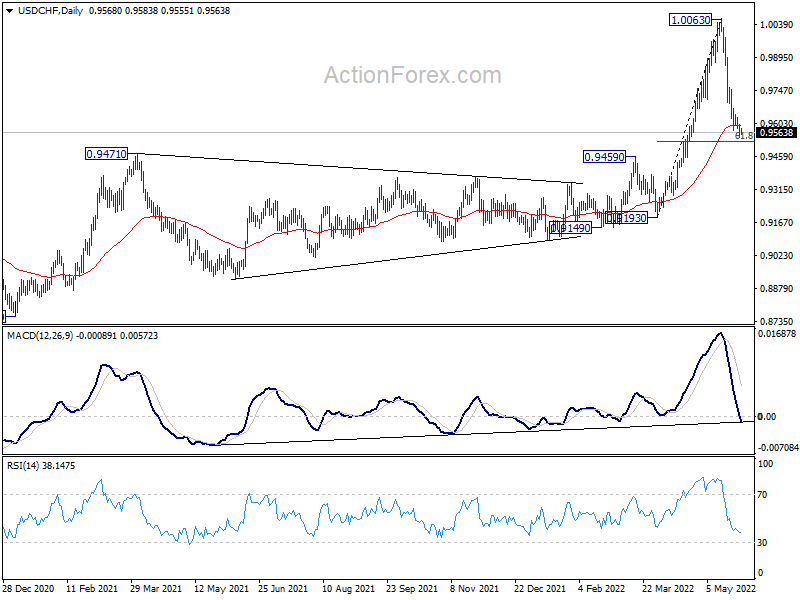
In the bigger picture, down trend from 1.0342 (2016 high) should have completed with three waves down to 0.8756 (2021 low) already. Rise from 0.8756 is likely a medium term up trend of its own. Next target is 1.0237/0342 resistance zone. This will remain the favored case as long as 0.9471 resistance turned support holds. However, sustained break of 0.9471 will extend long term range trading with another falling leg.
USD/CAD Daily Outlook
Daily Pivots: (S1) 1.2698; (P) 1.2741; (R1) 1.2764; More...
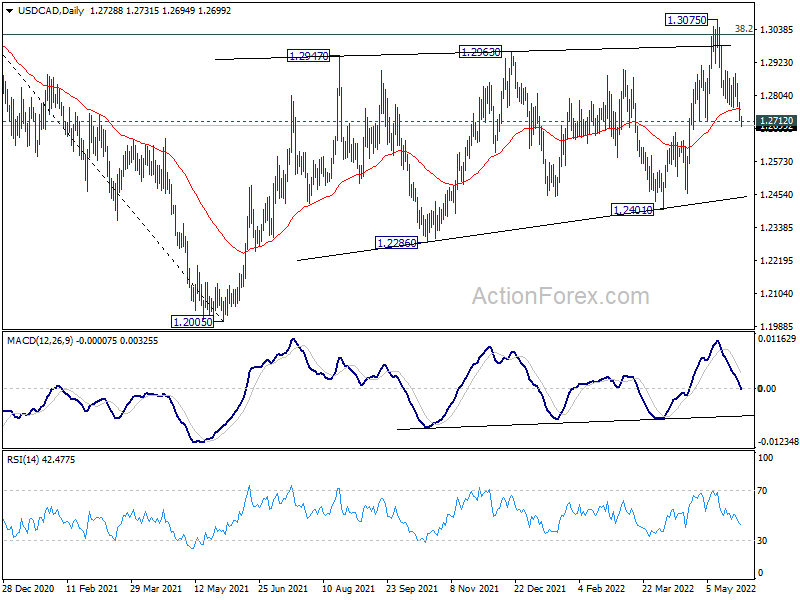
The break of 1.2712 support indicates rejection by 1.3022 key fibonacci resistance. Intraday bias in USD/CAD is back on the downside for 1.2401 support next. On the upside, though, above 1.2884 minor resistance will revive near term bullishness and turn bias back to the upside for 1.3075 high.
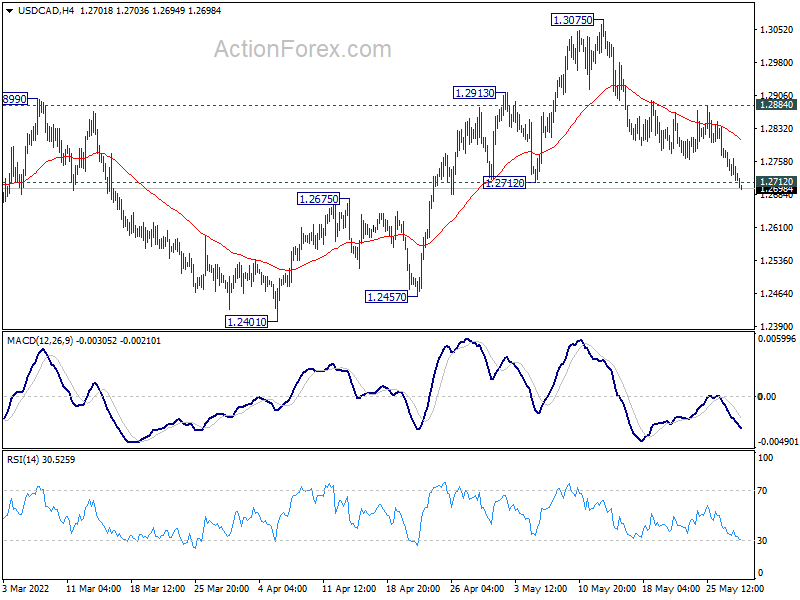
In the bigger picture, focus stays on 38.2% retracement of 1.4667 (2020 high) to 1.2005 (2021 low) at 1.3022. Sustained break there should confirm that the down trend from 1.4667 has completed after defending 1.2061 long term cluster support. Further rise would then be seen towards 61.8% retracement at 1.3650. However, rejection by 1.3022 will maintain medium term bearishness. Break of 1.2005 will resume the down trend from 1.4667 and that carries larger bearish implications too.
AUD/USD Daily Report
Daily Pivots: (S1) 0.7112; (P) 0.7139; (R1) 0.7189; More...
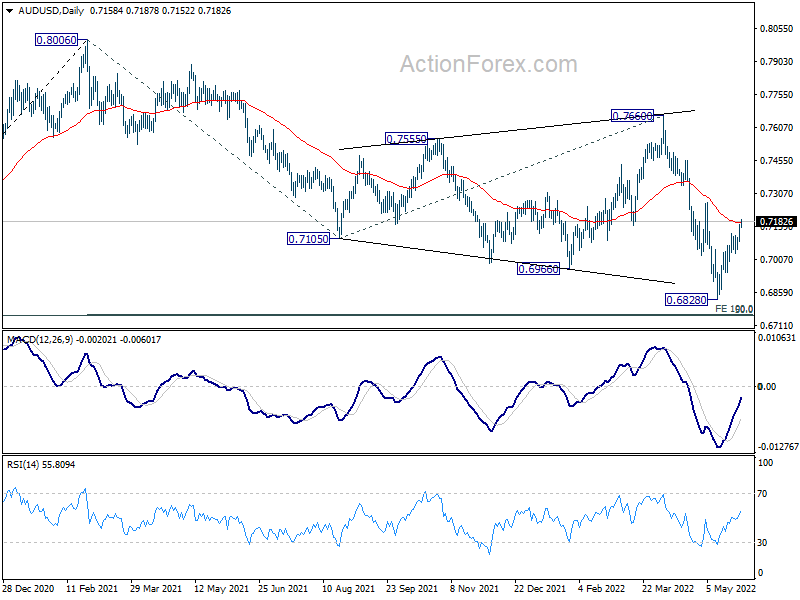
Intraday bias in AUD/USD remains on the upside, as rise from is extending. Next target is 0.7265 resistance. Firm break there will raise the chance of larger trend reversal and target 0.7760 structural resistance next. On the downside, break of 0.7034 minor support will turn bias back to the downside for retesting 0.6828 low instead.
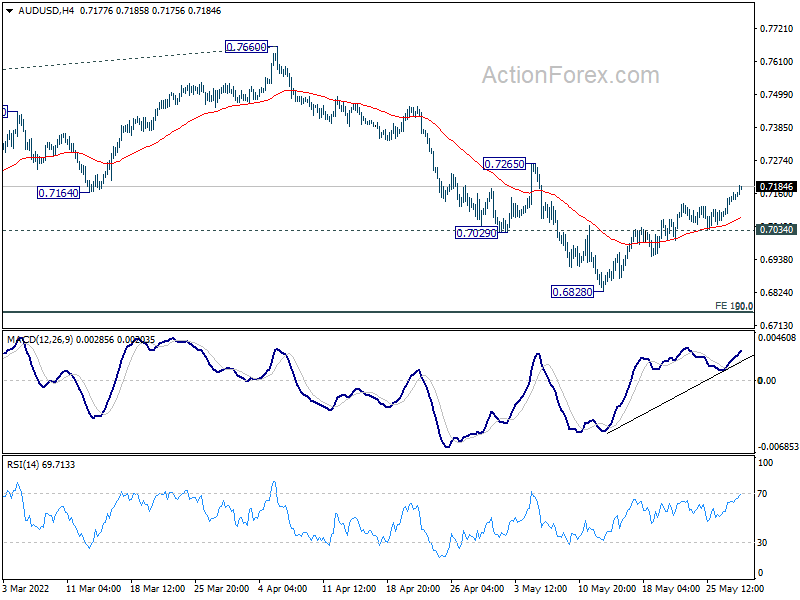
In the bigger picture, price actions from 0.8006 are seen as a corrective pattern to rise from 0.5506 (2020 low). Deeper fall could be seen to 50% retracement of 0.5506 to 0.8006 at 0.6756. This coincides with 100% projection of 0.8006 to 0.7105 from 0.7660 at 0.6760. Strong support is expected from 0.6756/60 cluster to contain downside to complete the correction. Meanwhile, firm break of 0.7660 resistance will confirm that such corrective pattern has completed, and larger up trend is ready to resume.
Risk-on Sentiment Back, Dollar Decline Continues
Markets are generally in risk-on mode in Asian session today, with rallies in major indexes, oil prices and cryptos. Dollar is extending recent correction and would likely continue further. Yen and Swiss Franc are the next weakest. On the other hand, Australian Dollar is leading New Zealand and Canadian Dollar higher. Euro and Sterling are mixed for now. Overall, it's a picture of positive market sentiments.
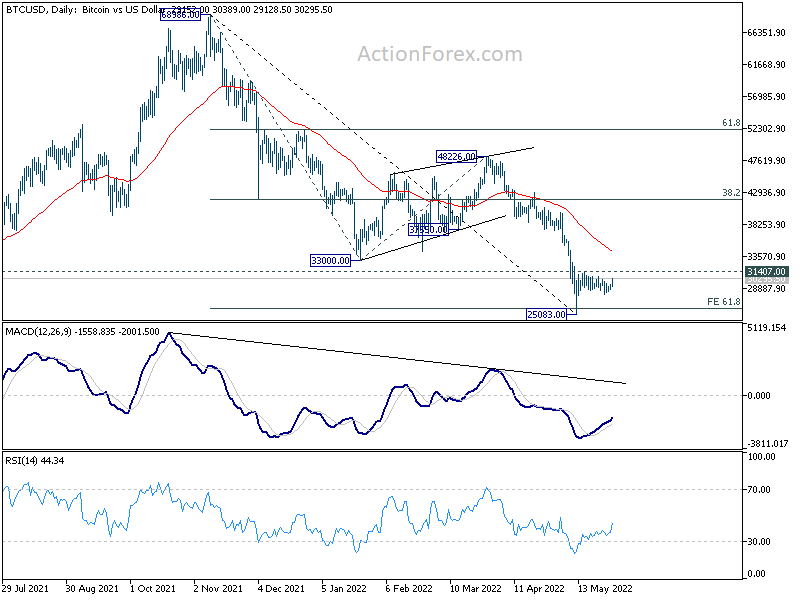
Technically, 31407 resistance in bitcoin would be a focus in the early part of the week. Firm break there will firstly resume the rebound from 25083 towards 55 day EMA (now at 34358). More importantly, that would be an early sign of larger trend reversal and open up the prospect of further rally to 38.2% retracement of 68986 to 25083 at 41853. If that happens, it would be a strong sign of return of strong risk appetite, which would be unfavorable to Dollar.
In Asia, at the time of writing, Nikkei is up 2.30%. Hong Kong HSI is up 2.05%. China Shanghai SSE is up 0.58%. Singapore Strait Times is up 0.23%. Japan 10-year JGB yield is up 0.0018 at 0.232.
RBNZ Conway: Probably some more 50 points hikes coming
RBNZ chief economist Paul Conway said today that 50bps rate hikes are the way forward, and he's confident of soft landing as the labor market is strong.
"75 wasn't seriously on the table because we are pretty convinced that we can get to where we need to get with 50-point increments," he said. Also, the central bank was "signaling there's probably some more 50 points coming over the next little while."
On the economy, Conway said "it's difficult to engineer a soft landing -- typically a significant reduction in inflation is accompanied by negative economic growth -- but there's reasons to believe New Zealand is well placed to pull it off this time around."
"The labor market is strong and that's the underlying reason why the New Zealand economy is well placed to weather the storm," he added.
BoJ Kuroda: Yen's rapid weakening not because of monetary policy
BoJ Governor Haruhiko Kuroda told the parliament today, "I don't think the BoJ's monetary policy was the factor behind a rapid yen weakening. The recent yen weakening may have been driven by an abnormal situation where oil prices topped $130 per barrel."
He also said that the rapid depreciation of Yen was "undesirable". But the situation was improving with Dollar easing back to around 127 Yen.
Meanwhile, Kuroda also repeated the pledge to maintain powerful monetary easing to help the economy from recovering.
BoC rate hike, US ISMs and NFP
BoC is widely expected to raise interest rate by another 50bps to 1.50% this week. Governor Tiff Macklem had recently noted that interest rates may need to go above the neutral range, estimated to be between 2% and 3%. Thus BoC should indicate that more tightening is still on the way. But Macklem would probably wait at least until July's monetary policy report before talking about how high rates would top.
In terms of central bank activities, Fed will also publish Beige Book anecdote report. On the data front, US ISMs and non-farm payrolls will be the biggest events of the week. Others include Eurozone CPI flash, Canada GDP, Swiss GDP, China PMIs. Here are some highlights for the week:
- Monday: Germany import prices, CPI flash; Swiss KOF economic barometer; Canada current account.
- Tuesday: New Zealand building permit, ANZ business confidence; Japan unemployment rate, retail sales, industrial production, consumer confidence, housing starts; Australia building permits, current account; China PMIs; Swiss trade balance, retail sales; France GDP, consumer spending; Swiss GDP; Germany unemployment; UK M4 money supply, mortgage approvals; Eurozone CPI flash; Canada GDP, US house price index, Chicago PMI, consumer confidence.
- Wednesday: Australia AiG manufacturing, GDP; Japan capital spending, PMI manufacturing; China Caixin PMI manufacturing; Germany retail sales; Swiss PMI manufacturing; Eurozone PMI manufacturing final, unemployment rate; UK PMI manufacturing final; Canada PMI manufacturing, BoC rate decision; US ISM manufacturing, Fed's Beige Book report.
- Thursday: New Zealand overseas trade index; Australia retail sales, trade balance; Japan monetary base; Eurozone PPI; US Challenger job cuts, ADP employment, jobless claims, non-farm productivity, factory orders; Canada building permits.
- Friday: Australia AiG construction; German Trade balance; France industrial production; Eurozone PMI services final, retail sales; Canada labor productivity; US non-farm payrolls, ISM PMI services.
AUD/USD Daily Report
Daily Pivots: (S1) 0.7112; (P) 0.7139; (R1) 0.7189; More...
Intraday bias in AUD/USD remains on the upside, as rise from is extending. Next target is 0.7265 resistance. Firm break there will raise the chance of larger trend reversal and target 0.7760 structural resistance next. On the downside, break of 0.7034 minor support will turn bias back to the downside for retesting 0.6828 low instead.
In the bigger picture, price actions from 0.8006 are seen as a corrective pattern to rise from 0.5506 (2020 low). Deeper fall could be seen to 50% retracement of 0.5506 to 0.8006 at 0.6756. This coincides with 100% projection of 0.8006 to 0.7105 from 0.7660 at 0.6760. Strong support is expected from 0.6756/60 cluster to contain downside to complete the correction. Meanwhile, firm break of 0.7660 resistance will confirm that such corrective pattern has completed, and larger up trend is ready to resume.
Economic Indicators Update
| GMT | Ccy | Events | Actual | Forecast | Previous | Revised |
|---|---|---|---|---|---|---|
| 06:00 | EUR | Germany Import Price Index M/M Apr | 2.00% | 5.70% | ||
| 07:00 | CHF | KOF Leading Indicator May | 102.3 | 101.7 | ||
| 09:00 | EUR | Eurozone Economic Sentiment Indicator May | 104.9 | 105 | ||
| 09:00 | EUR | Eurozone Industrial Confidence May | 7.5 | 7.9 | ||
| 09:00 | EUR | Eurozone Services Sentiment May | 14.3 | 13.5 | ||
| 09:00 | EUR | Eurozone Consumer Confidence May F | -21.1 | -21.1 | ||
| 12:00 | EUR | Germany CPI M/M May P | 0.50% | 0.80% | ||
| 12:00 | EUR | Germany CPI Y/Y May P | 7.60% | 7.40% | ||
| 12:30 | CAD | Current Account (CAD) Q1 | -0.2B | -0.8B |
BoJ Kuroda: Yen’s rapid weakening not because of monetary policy
BoJ Governor Haruhiko Kuroda told the parliament today, "I don't think the BOJ's monetary policy was the factor behind a rapid yen weakening. The recent yen weakening may have been driven by an abnormal situation where oil prices topped $130 per barrel."
He also said that the rapid depreciation of Yen was "undesirable". But the situation was improving with Dollar easing back to around 127 Yen.
Meanwhile, Kuroda also repeated the pledge to maintain powerful monetary easing to help the economy from recovering.
RBNZ Conway: Probably some more 50 points hikes coming
RBNZ chief economist Paul Conway said today that 50bps rate hikes are the way forward, and he's confident of soft landing as the labor market is strong.
"75 wasn't seriously on the table because we are pretty convinced that we can get to where we need to get with 50-point increments," he said. Also, the central bank was "signaling there's probably some more 50 points coming over the next little while."
On the economy, Conway said "it's difficult to engineer a soft landing -- typically a significant reduction in inflation is accompanied by negative economic growth -- but there's reasons to believe New Zealand is well placed to pull it off this time around."
"The labor market is strong and that's the underlying reason why the New Zealand economy is well placed to weather the storm," he added.
Technical Outlook and Review
DXY:
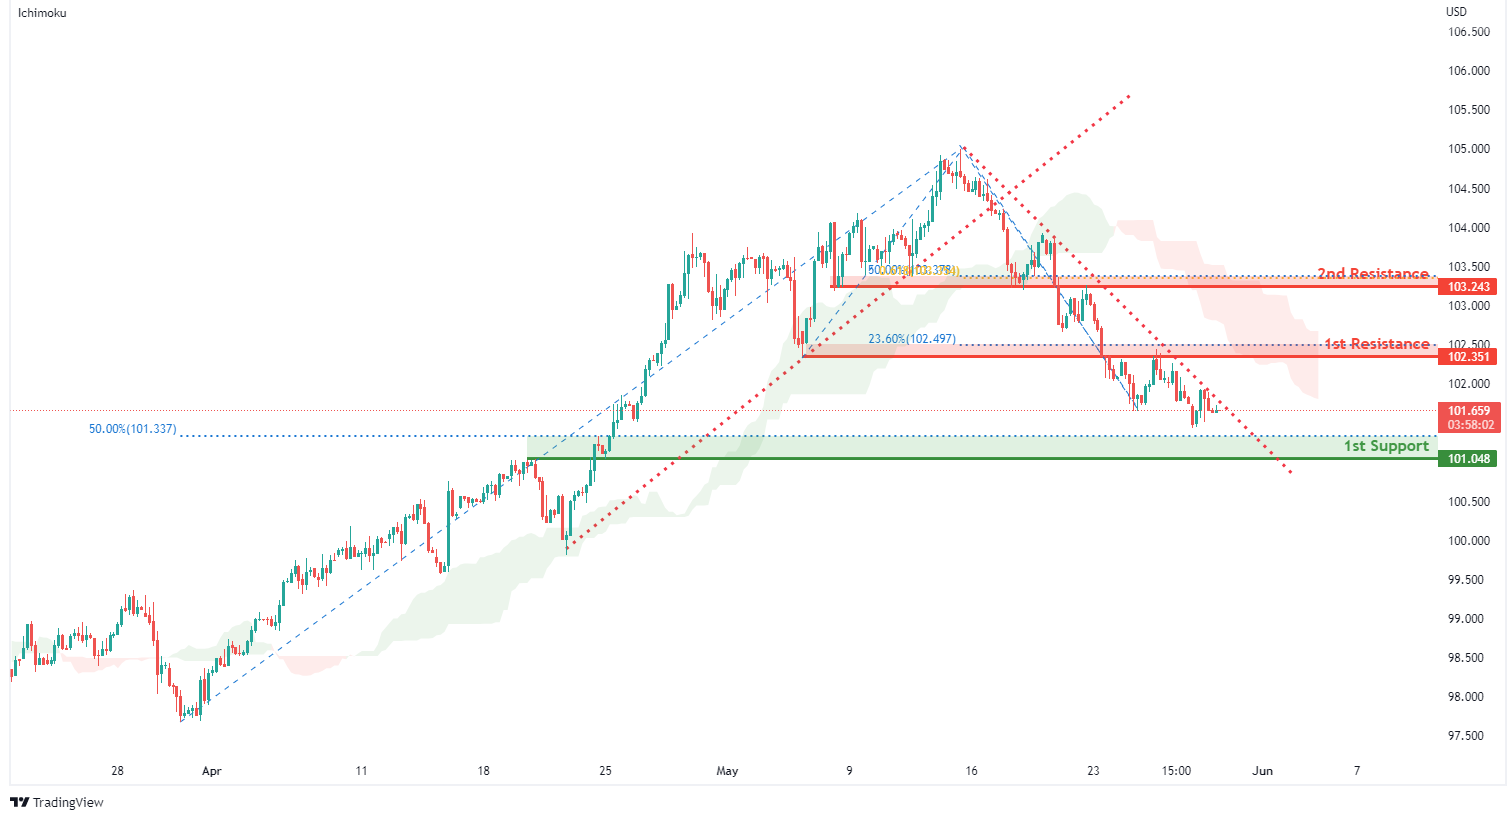
On the H4, with prices moving below the ichimoku indicator and breakout from the ascending trendline, we have a bearish bias that price will drop to our 1st support at 101.048 where the horizontal pullback support and 50% Fibonacci retracement are from our 1st resistance at 102.351 in line with the horizontal overlap resistance and 23.6% fibonacci retracement. Alternatively, price may break 1st resistance structure and head for 2nd resistance at 103.243 where the horizontal overlap resistance, 61.8% fibonacci projection and 50% fibonacci retracement are.
Areas of consideration:
- H4 time frame, 1st resistance at 102.351
- H4 time frame, 1st support at 101.048
XAU/USD (GOLD):
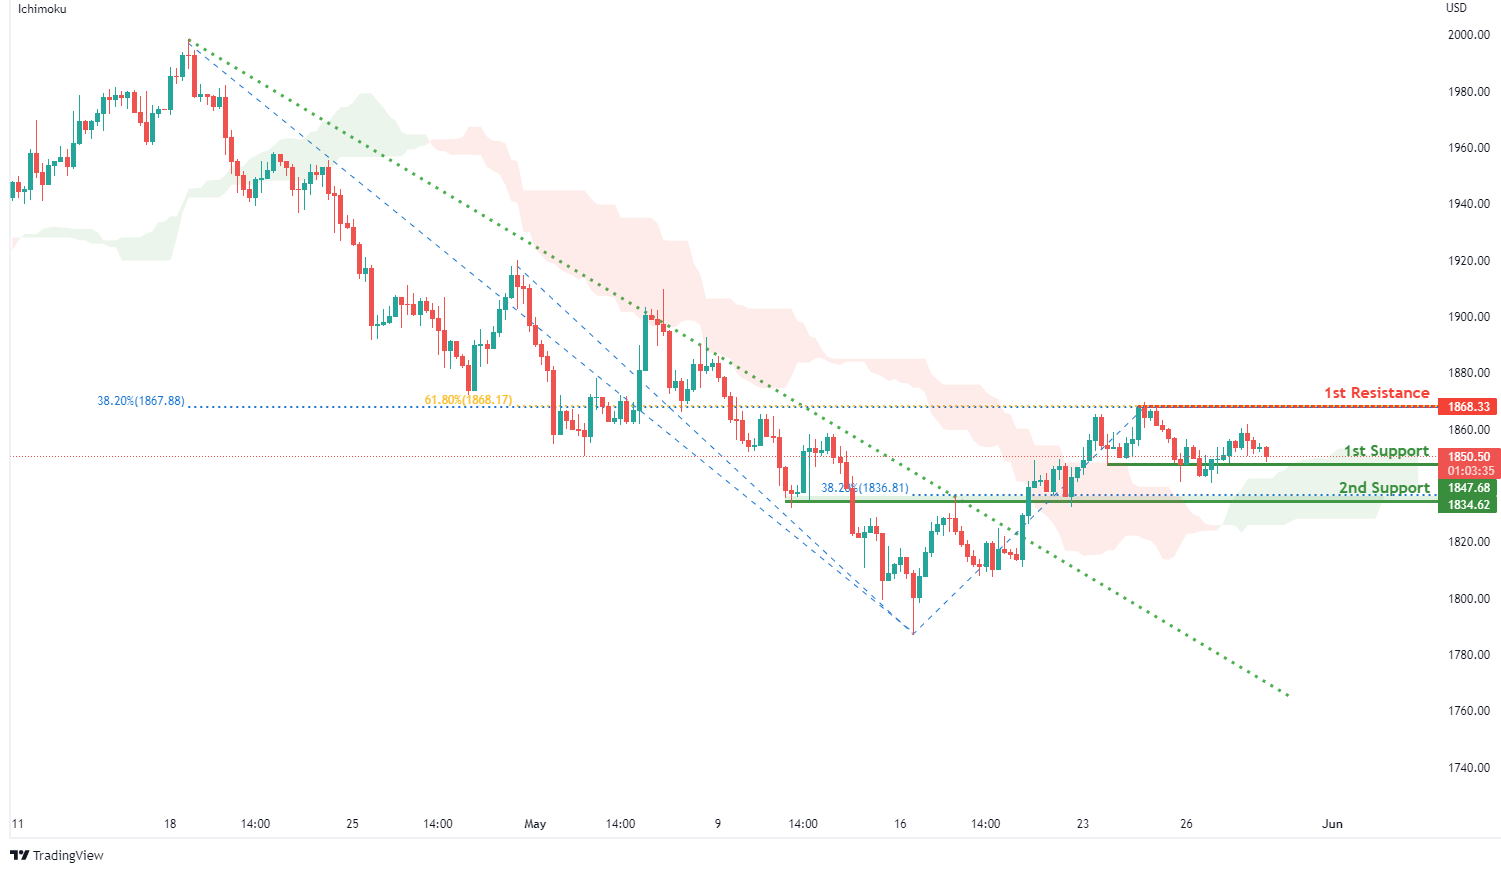
On the H4, with prices moving above the ichimoku cloud and breakout from descending trendline, we have a bullish bias that price will rise from our 1st support at 1847.68 where the horizontal pullback support is to our 1st resistance at 1868.33 in line with the horizontal swing high resistance,61.8% Fibonacci retracement and 38.2% Fibonacci retracement. Alternatively, price may break 1st support structure and head for 2nd support at 1834.62 where the horizontal overlap support and 38.2% fibonacci retracement are.
Areas of consideration:
- H4 time frame, 1st Resistance at 1868.33
- H4 time frame, 1st Support at 1847.68
GBP/USD:
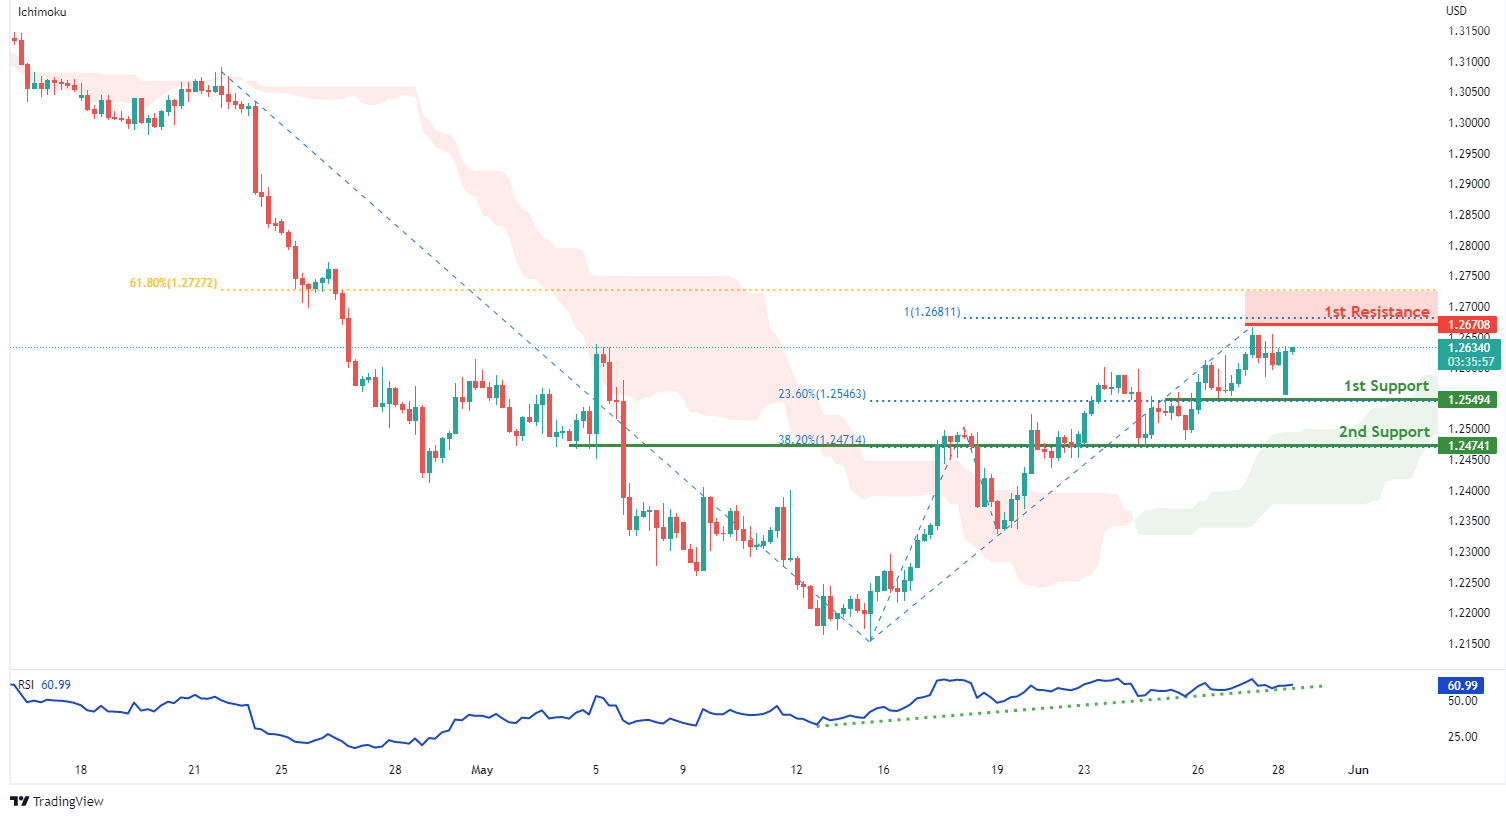
On the H4, with price moving above the ichimoku indicator and the RSI indicator moving in an uptrend momentum, we have a bullish bias that price will rise from our 1st support at 1.25494 where the horizontal overlap support and 23.6% fibonacci retracement are to our 1st resistance at 1.26708 in line with the 61.8% Fibonacci retracement, 100% Fibonacci projection and swing high resistance. Alternatively, price may break 1st support structure and head for 2nd support at 1.24741 where the horizontal overlap support and 38.2% Fibonacci retracement are.
Areas of consideration:
- H4 1st resistance at 1.26708
- H4 1st support at 1.25494
USD/CHF:
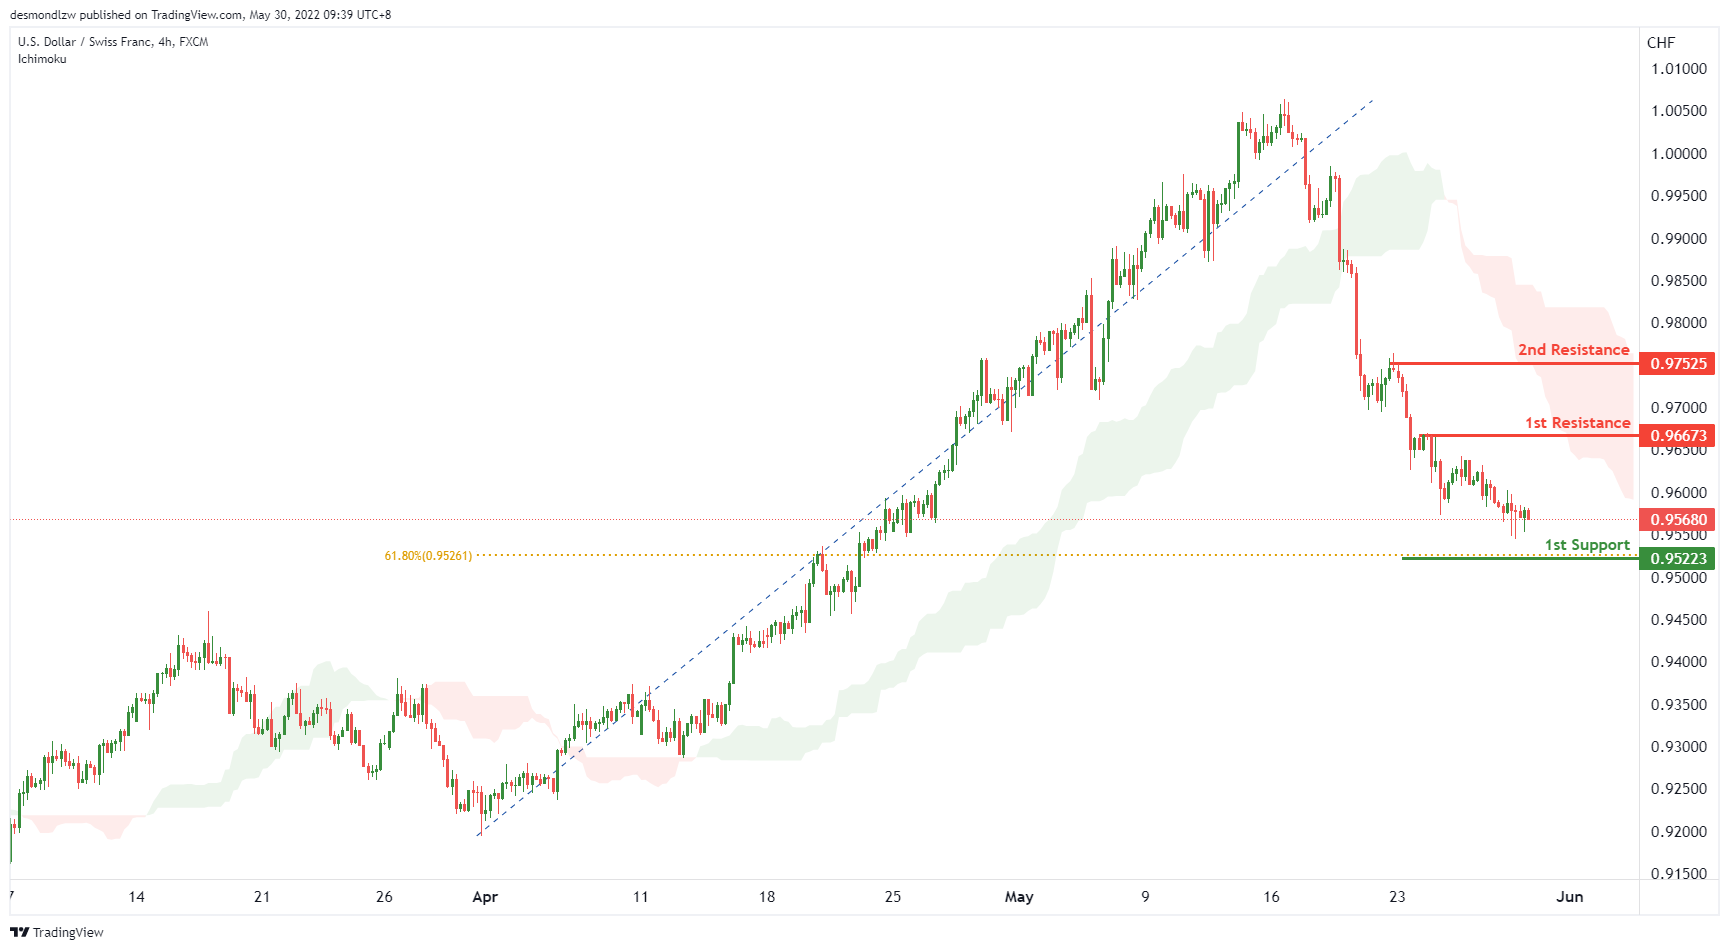
On the H4, with price moving below the ichimoku cloud, we have a bearish bias that price will drop to our 1st support at 0.95223 where the 61.8% Fibonacci retracement is from our 1st resistance at 0.96673 in line with the pullback resistance. Alternatively, price may break 1st resistance structure and head for 2nd resistance at 0.97525 where the swing high resistance is.
Areas of consideration
- 1st support level at 0.95223
- 1st resistance level at 0.96673
EUR/USD :
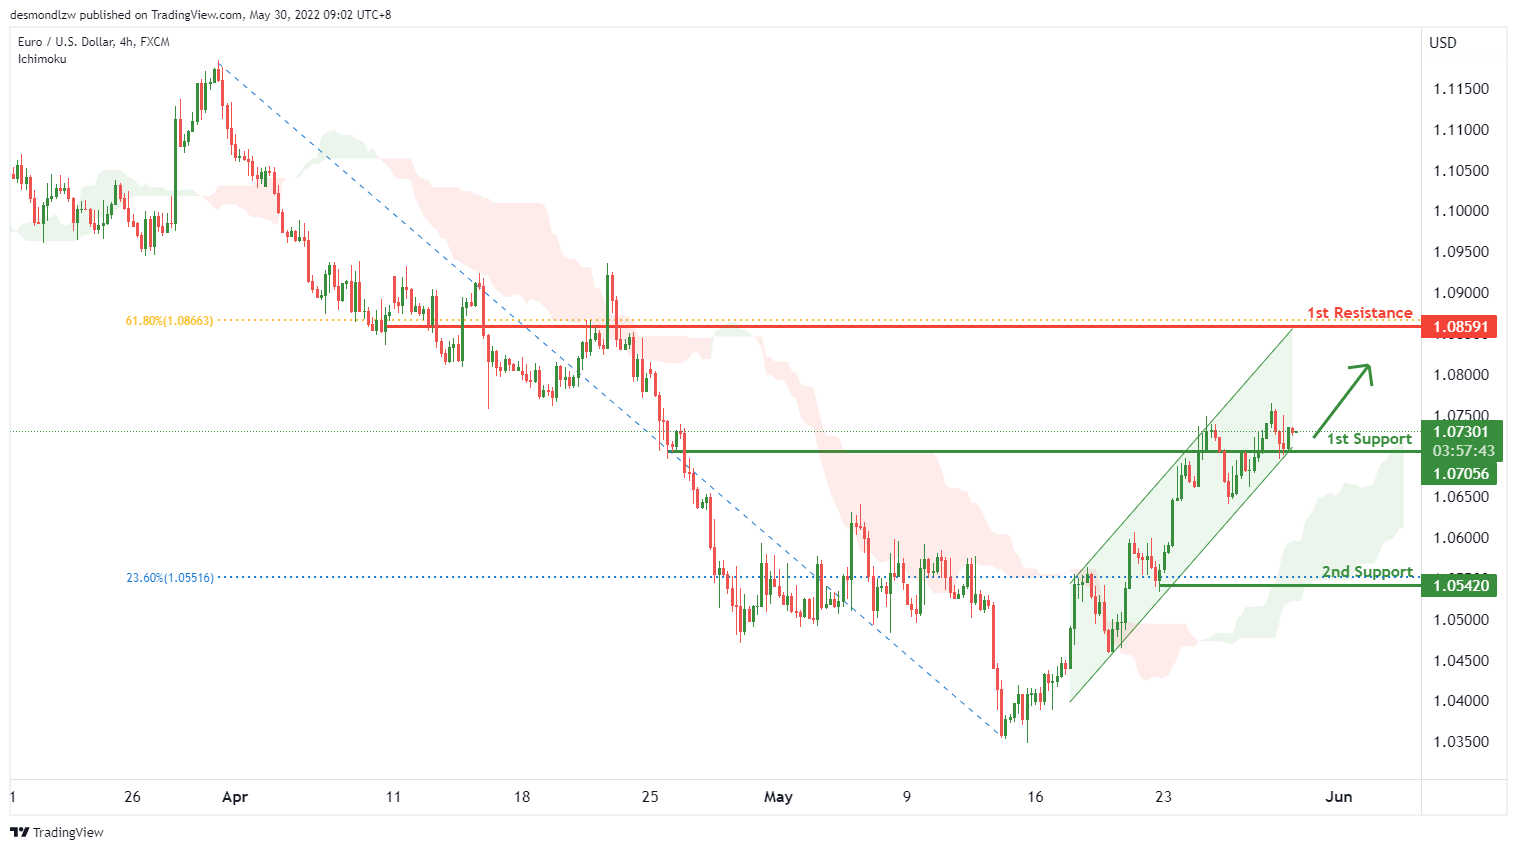
On the H4, with price moving above the ichimoku cloud and within the ascending trend channel, we have a bullish bias that price will rise to our 1st overlap resistance at 1.0591 where the 61.8% Fibonacci retracement is from our 1st support at 1.070556, where price has recently bounced off. Alternatively, price may break 1st support structure and head for 2nd support at 1.0542in line with the 23.6% fibonacci retracement.
Areas of consideration :
- H4 1st resistance at 1.0591
- H4 1st support at 1.070556
USD/JPY:
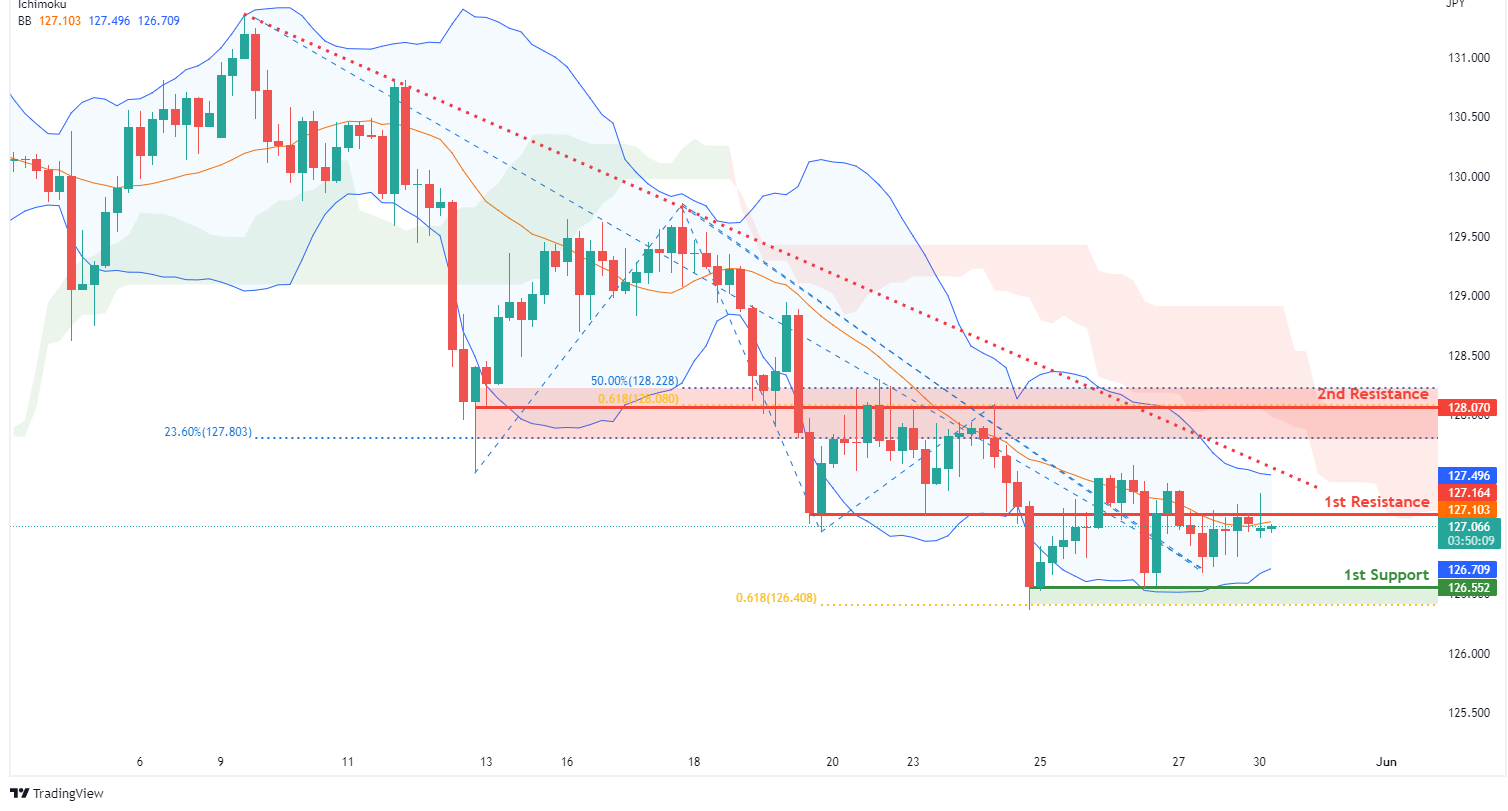
On the H4, with prices moving below the ichimoku indicator and passing the basis line of the bollinger band in a downtrend, we have a bearish bias that price will drop from our 1st resistance at 127.164 where the horizontal overlap resistance is to our 1st support at 126.552 in line with the swing low support, 61.8% Fibonacci projection and 23.6% fibonacci retracement. Alternatively, price may break 1st resistance structure and head for 2nd resistance at 128.070 where the horizontal overlap resistance, 61.8% fibonacci projection and 50% Fibonacci retracement are.
Areas of consideration:
- H4 time frame, 1st resistance at 127.164
- H4 time frame, 1st support at 126.552
AUD/USD:
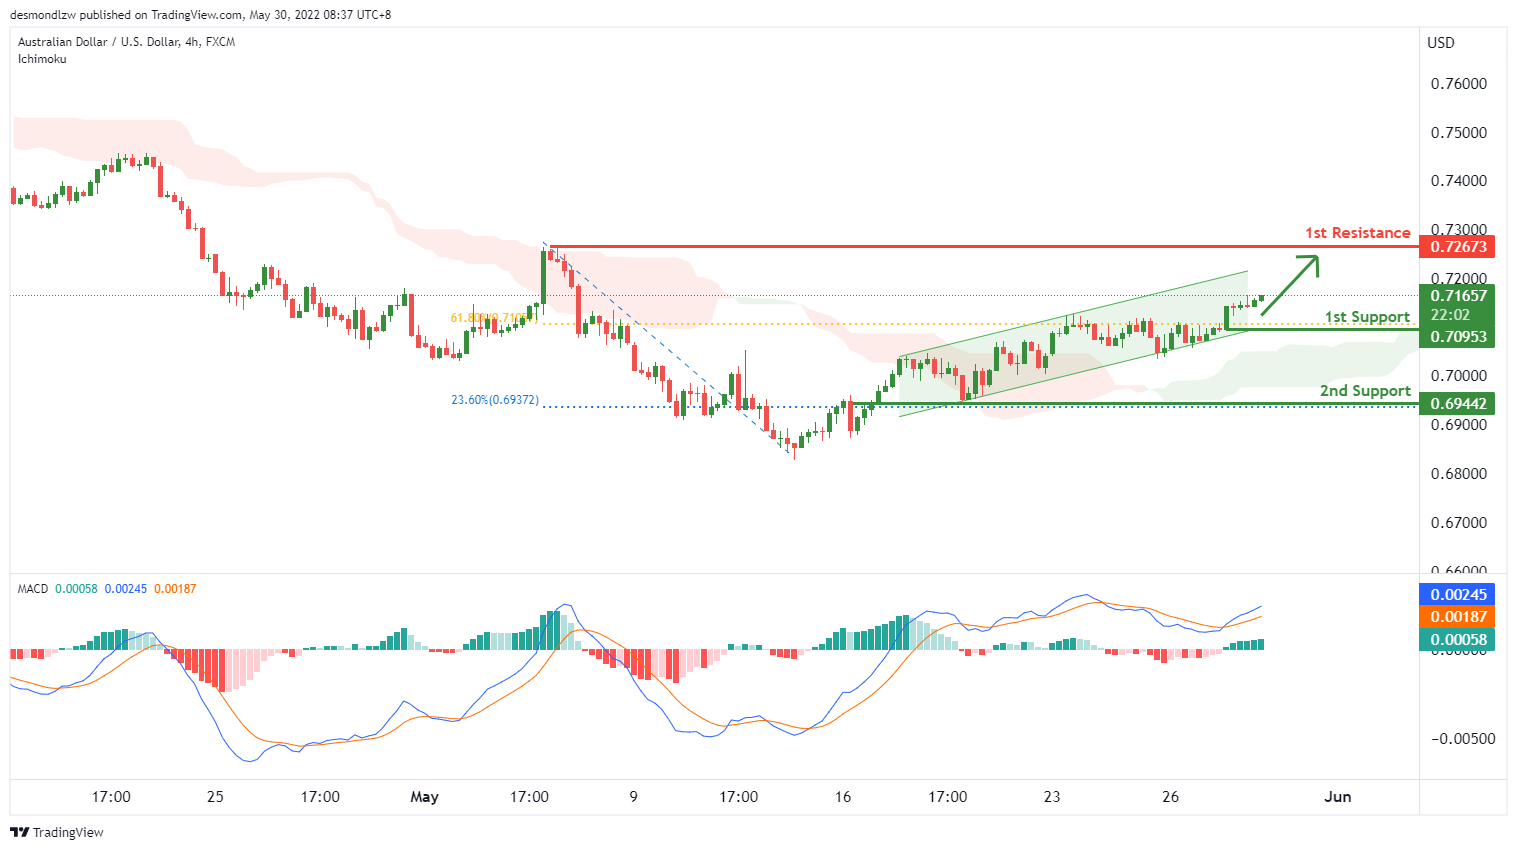
On the H1, with price moving above the ichimoku cloud and price moving within the ascending trend channel, we have a bullish bias that price will rise to our 1st resistance at 0.72673 where the swing high is from our 1st support at 0.70953 in line with the 61.8% Fibonacci retracement. Additionally, price is moving into a bullish pressure as shown in the MACD indicator which supports our bullish bias. Alternatively, price may break support structure and head for 2nd support at 0.69442 where the horizontal pullback support and 23.6% Fibonacci retracement is.
Areas of consideration
- H1 1st resistance at 0.72673
- H1 1st support at 0.70953
NZD/USD:
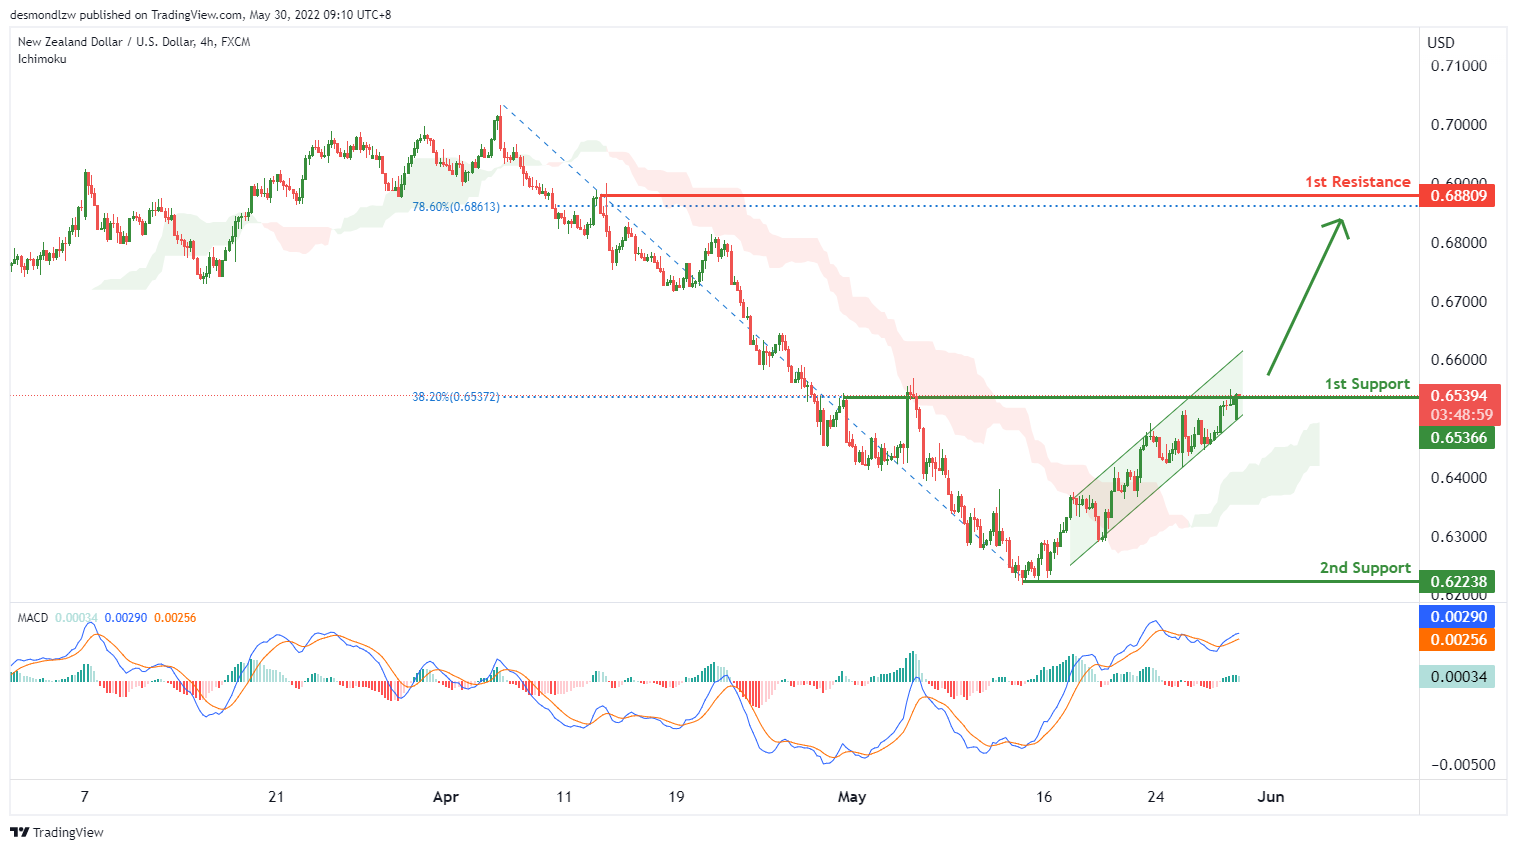
On the H4, with price moving above the ichimoku cloud, we have a bullish bias that price will rise to our 1st resistance at 0.68809 where the swing high resistance is in line with the 78.6% fibonacci retracement from our 1st support at 0.65366 in line with the overlap support and38.2% Fibonacci retracement. Additionally, price is moving in the bullish pressure area as shown on the MACD indicator. Alternatively, price may reverse from the support and head for 2nd support at 0.62238 in line with the swing low.
Areas of consideration:
- H4 time frame, 1st support at 0.65366
- H4 time frame, 1st resistance at 0.68809
USD/CAD:
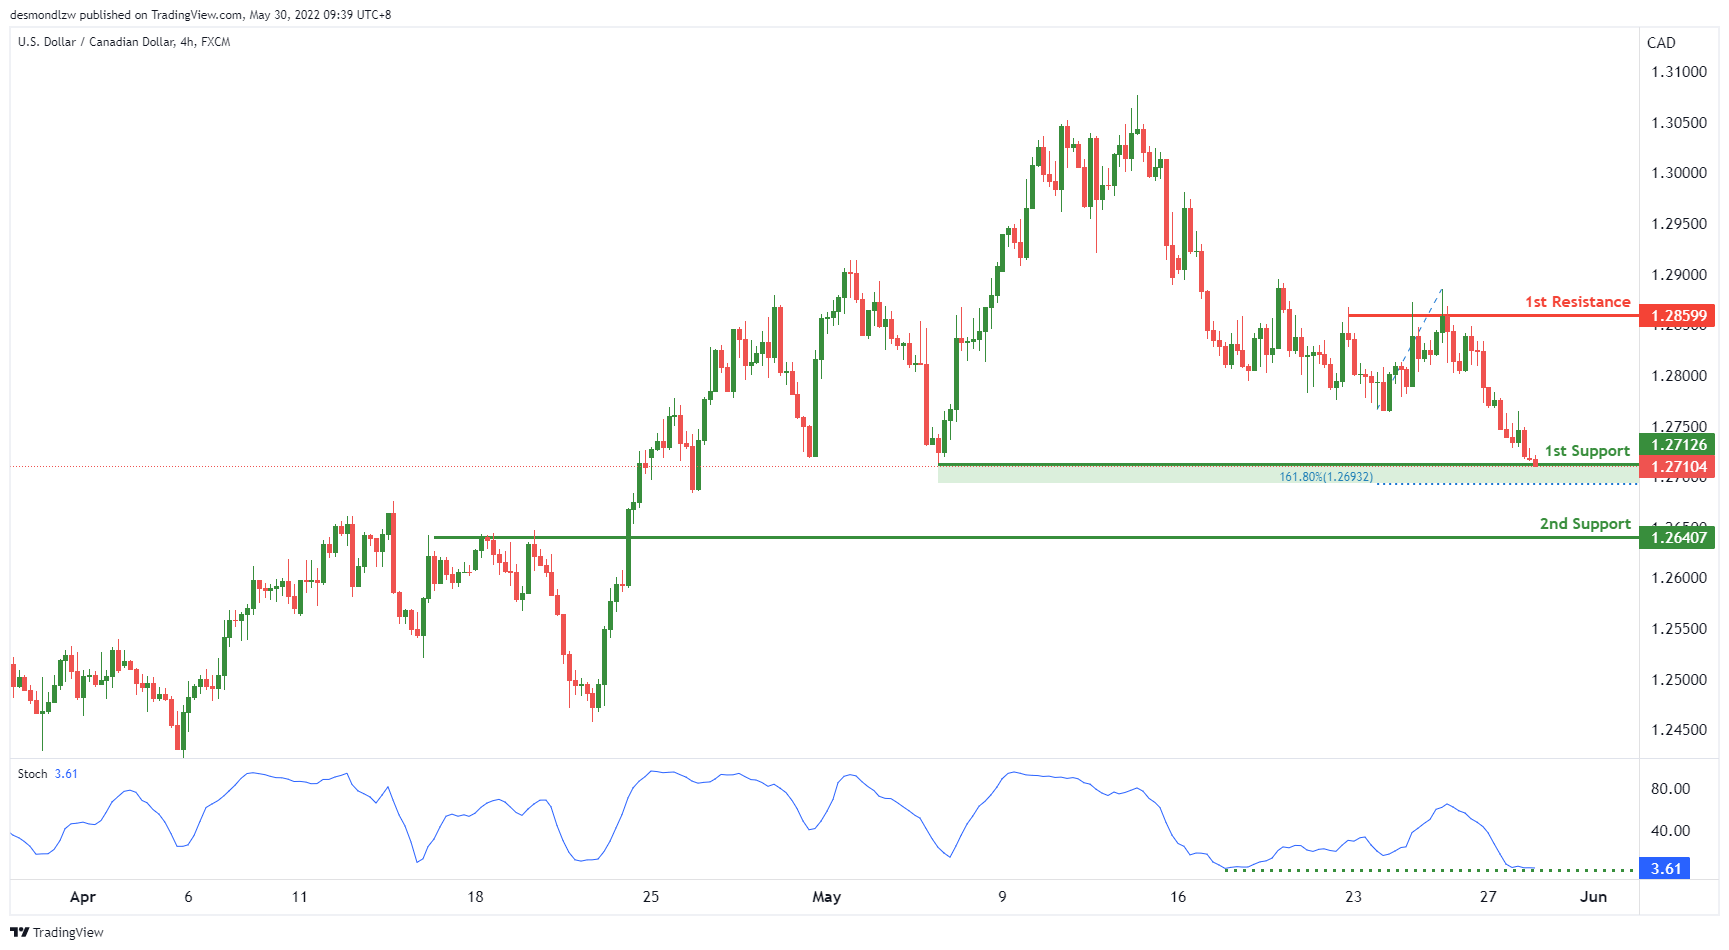
On the H4, with price expected to bounce off the stochastics, we have a bullish bias that price will rise to our 1st resistance at 1.28599 where the horizontal swing high resistance from our 1st support at 1.27126 in line with the swing low support.
Areas of consideration:
- H4 time frame, 1st resistance at 1.28559
- H4 time frame, 1st support at 1.27126
OIL:
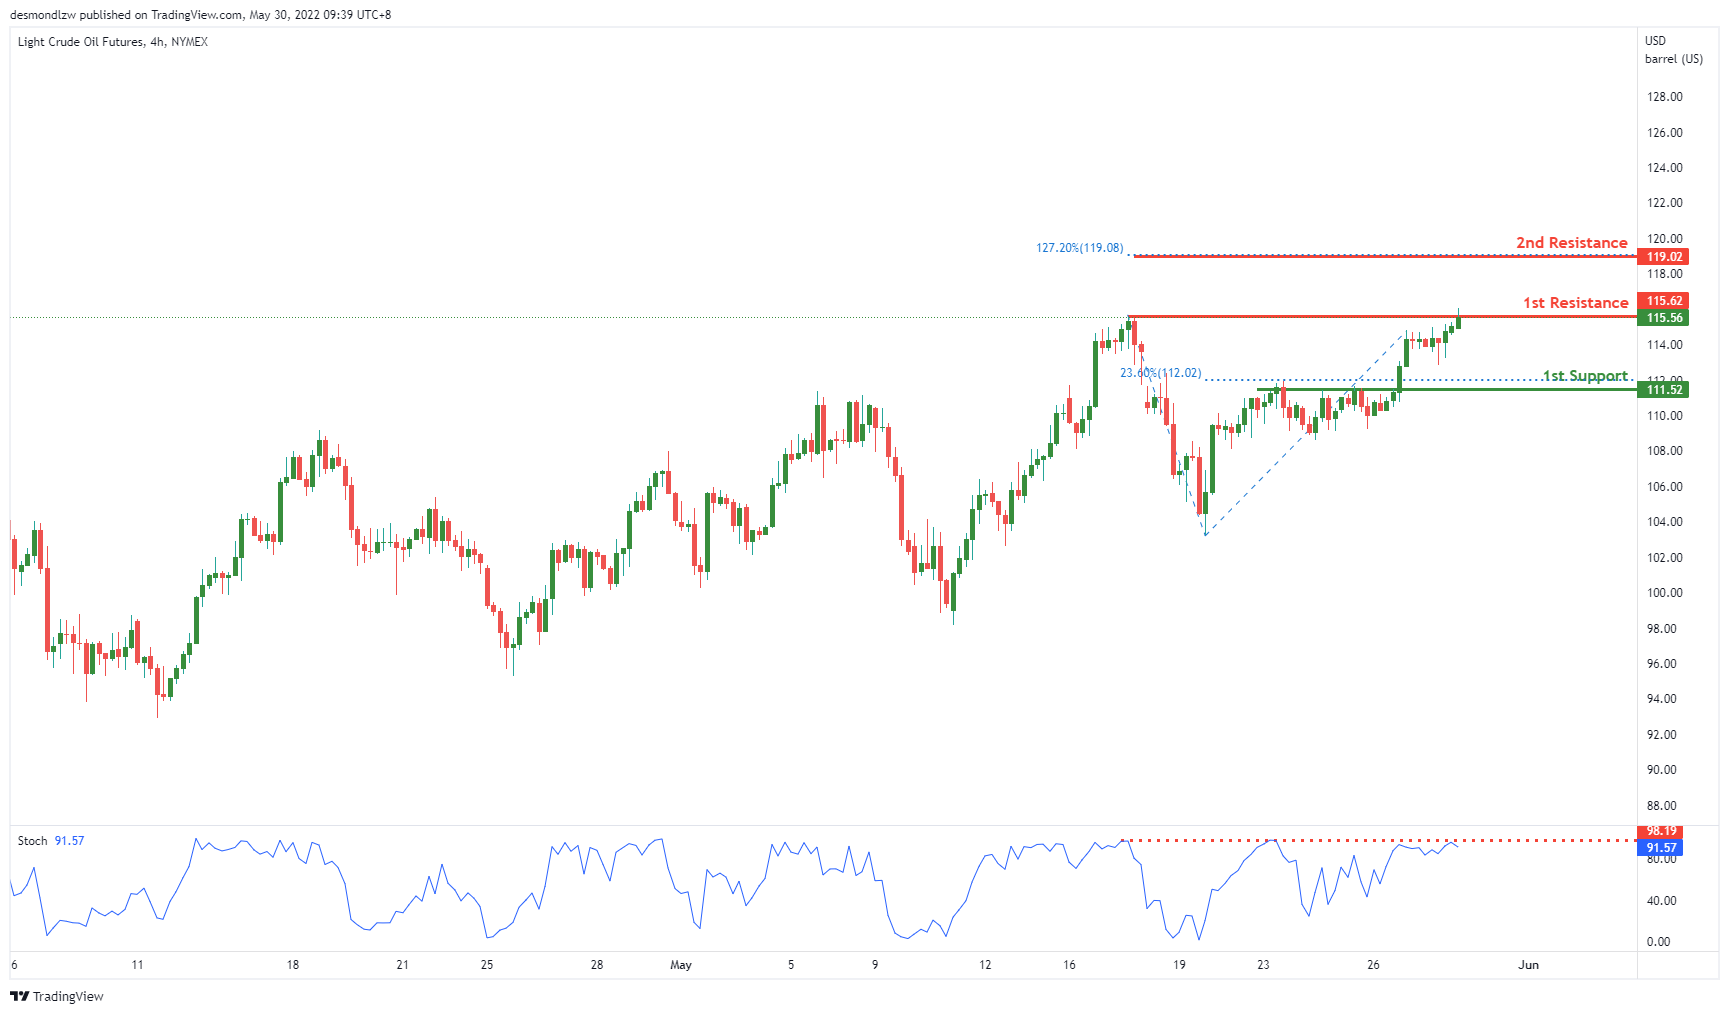
On the H4, with price expected to reverse off the stochastics indicator, we have a bearish bias that price will drop to our 1st support at 111.62 where the 23.6% Fibonacci retracement is from our 1st resistance at 119.02 in line with the swing high resistance. Alternatively, price may break 1st resistance structure and head for 2nd resistance at 119.02 where the 127.2% Fibonacci extension is.
Areas of consideration:
- H4 time frame, 1st resistance of 119.02
- H4 time frame, 1st support of 111.52
Dow Jones Industrial Average:
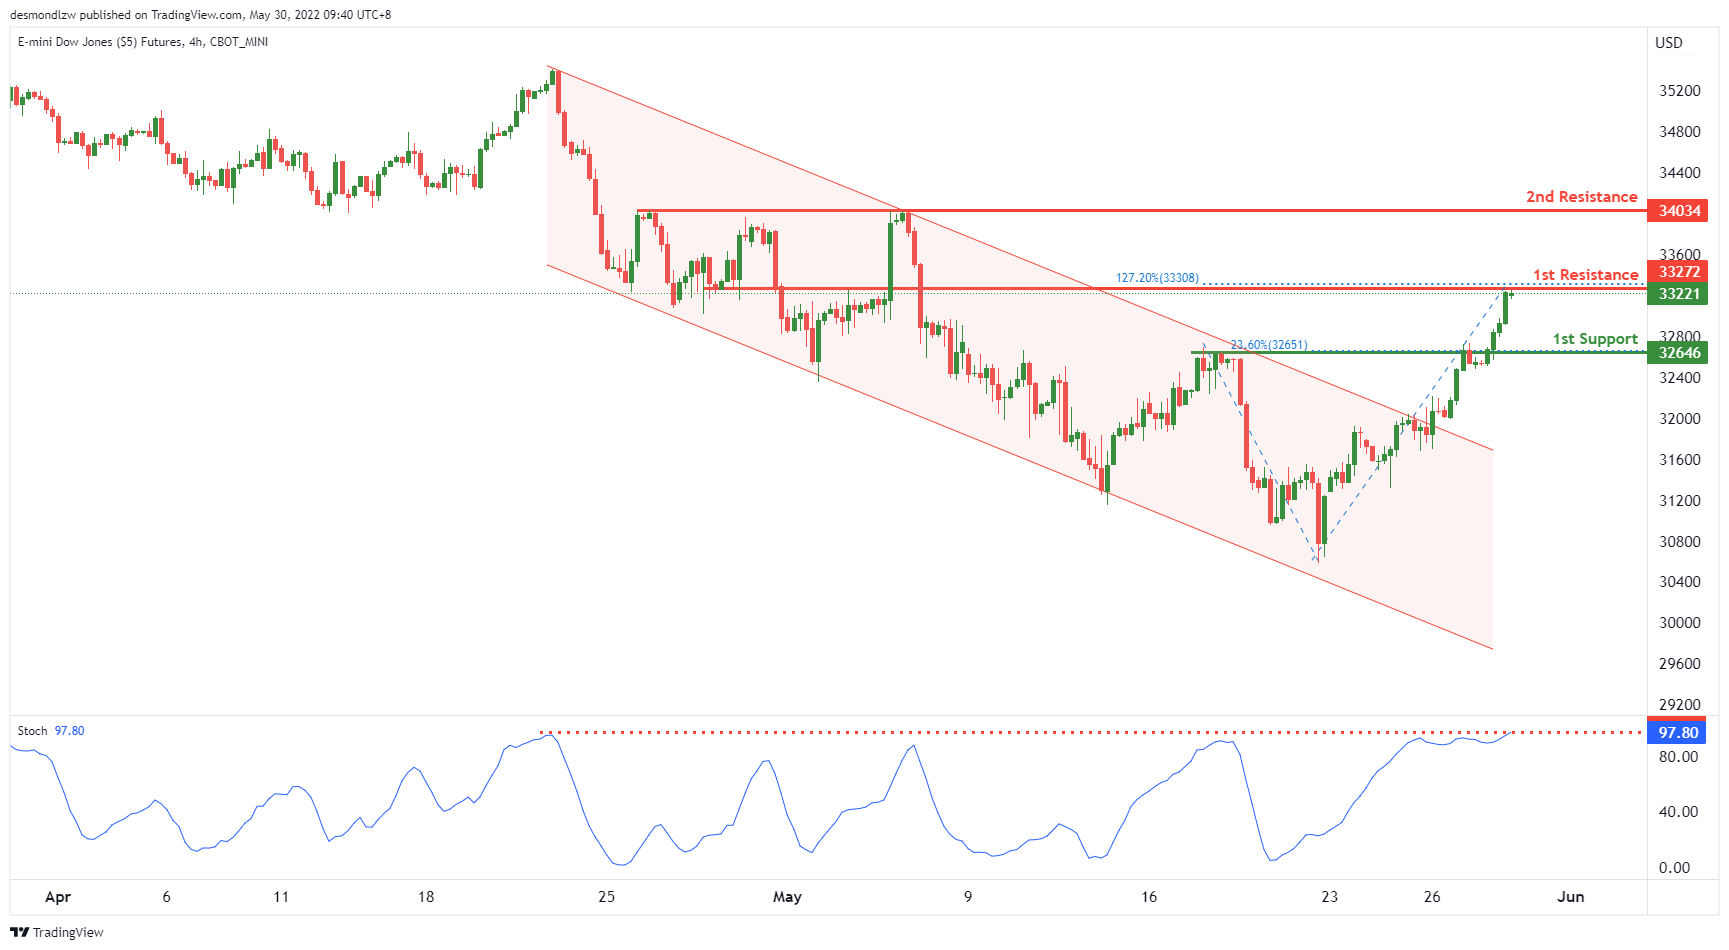
On the H4, with price expected to reverse off the stochastics indicator, we have a bearish bias that price will drop to our 1st support at 32646 where the 38.2% Fibonacci retracement is from our 1st resistance at 33221 in line with the swing high resistance. Alternatively, price may break 1st resistance structure and head for 2nd resistance where the horizontal swing high resistance is.
Areas of consideration :
- H4 time frame, 1st resistance at 33221
- H4 time frame, 1st support at 32646
AUDJPY Buying The Dips At The Blue Box Area
In this technical blog we’re going to take a quick look at the Elliott Wave charts of AUDJPY, published in members area of the website. As our members know, we’ve been favoring the long side in AUDJPY due to incomplete bullish sequences the pair is showing in the weekly cycle from the March 2020 low. Consequently, we recommended members to avoid selling the pair, while keep favoring the long side. Recently AUDJPY made a pull back that has given us good trading opportunities. We expected the pair to find buyers at the extreme zone from the 04/21 peak. In the further text we are going to explain the Elliott Wave Forecast and trading strategy.
AUDJPY Elliott Wave 4 Hour Chart 05.11.2022
Current view suggests AUDJPY is doing black pull back against the 78.77 low. Pull back is showing incomplete sequences at the moment. First leg of the pull back looks like 5 waves structure, which means correction is having form of Elliott Wave Zig Zag pattern. We believe (C) wave is still in progress toward 88.71-85.41 area ( Blue Box – buying zone) .
We don’t recommend selling the pair against the main bullish trend. Strategy is waiting for the price to reached marked blue box zone, before entering the long side again. As the main trend is bullish we expect buyers to appear at the blue box for 3 waves bounce at least. Once bounce reaches 50 Fibs against the (B) blue high, we will make long position risk free ( put SL at BE). Invalidation for the trade would be break of marked invalidation level 85.41.
As our members know, Blue Boxes are no enemy areas , giving us 85% chance to get a bounce.
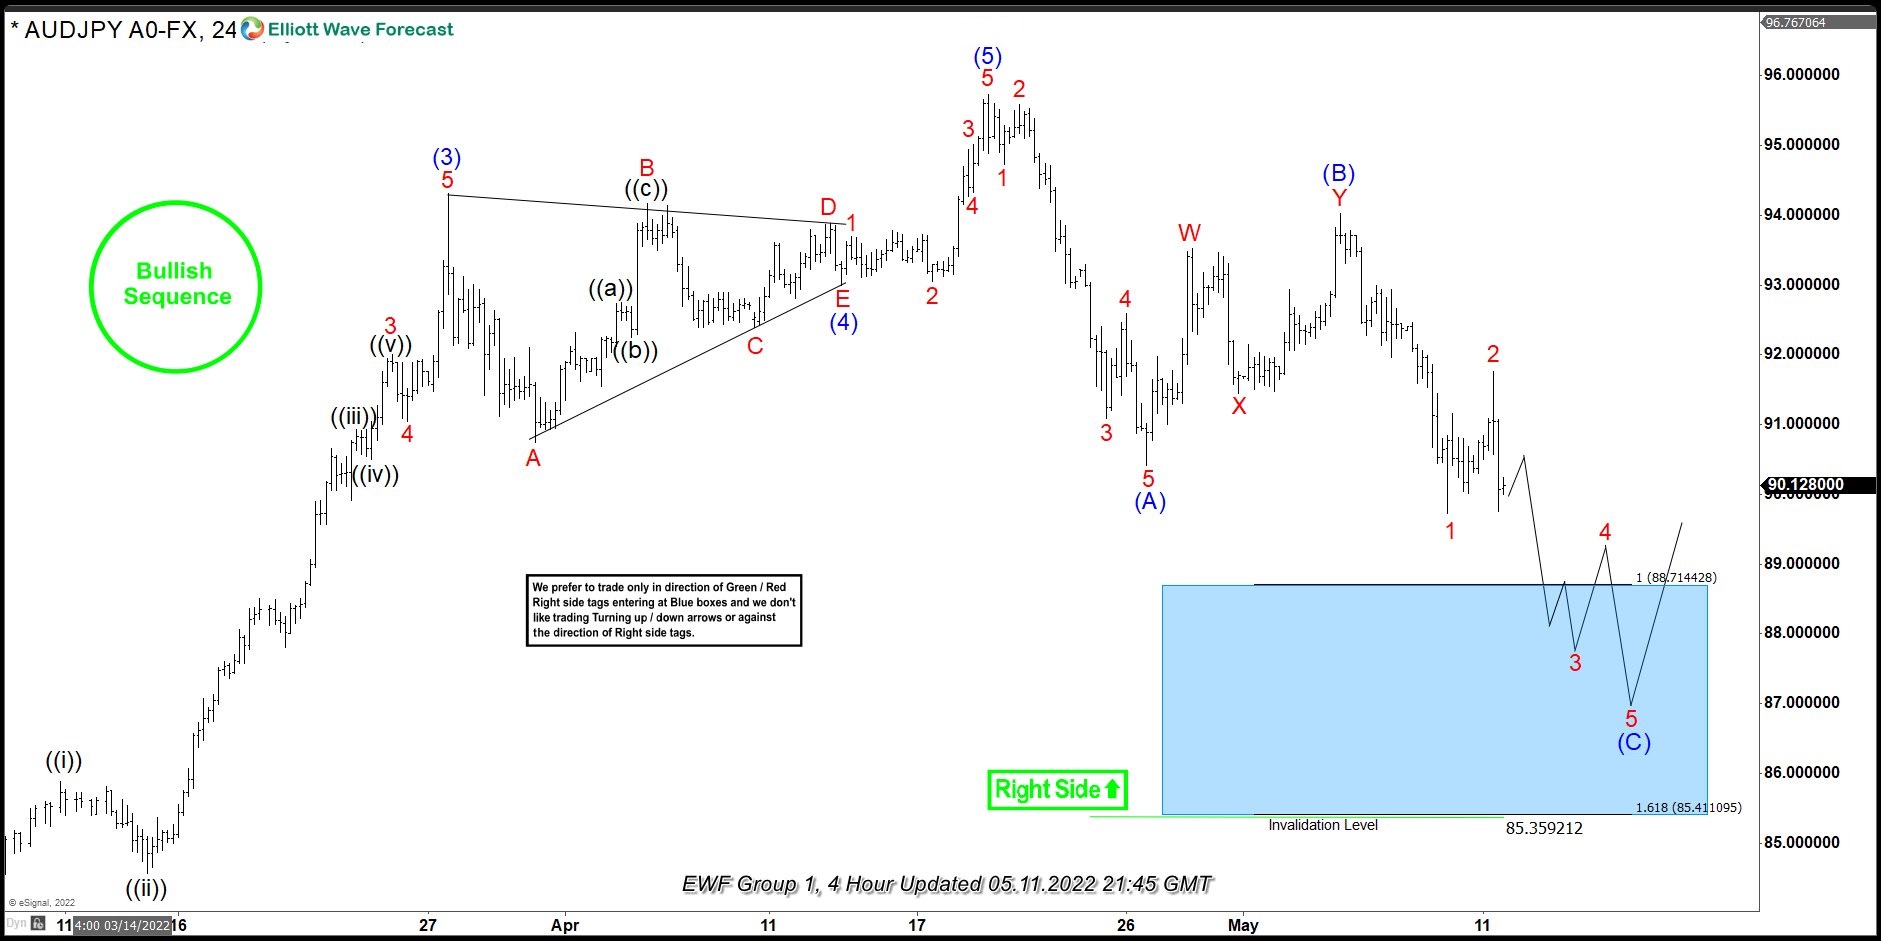
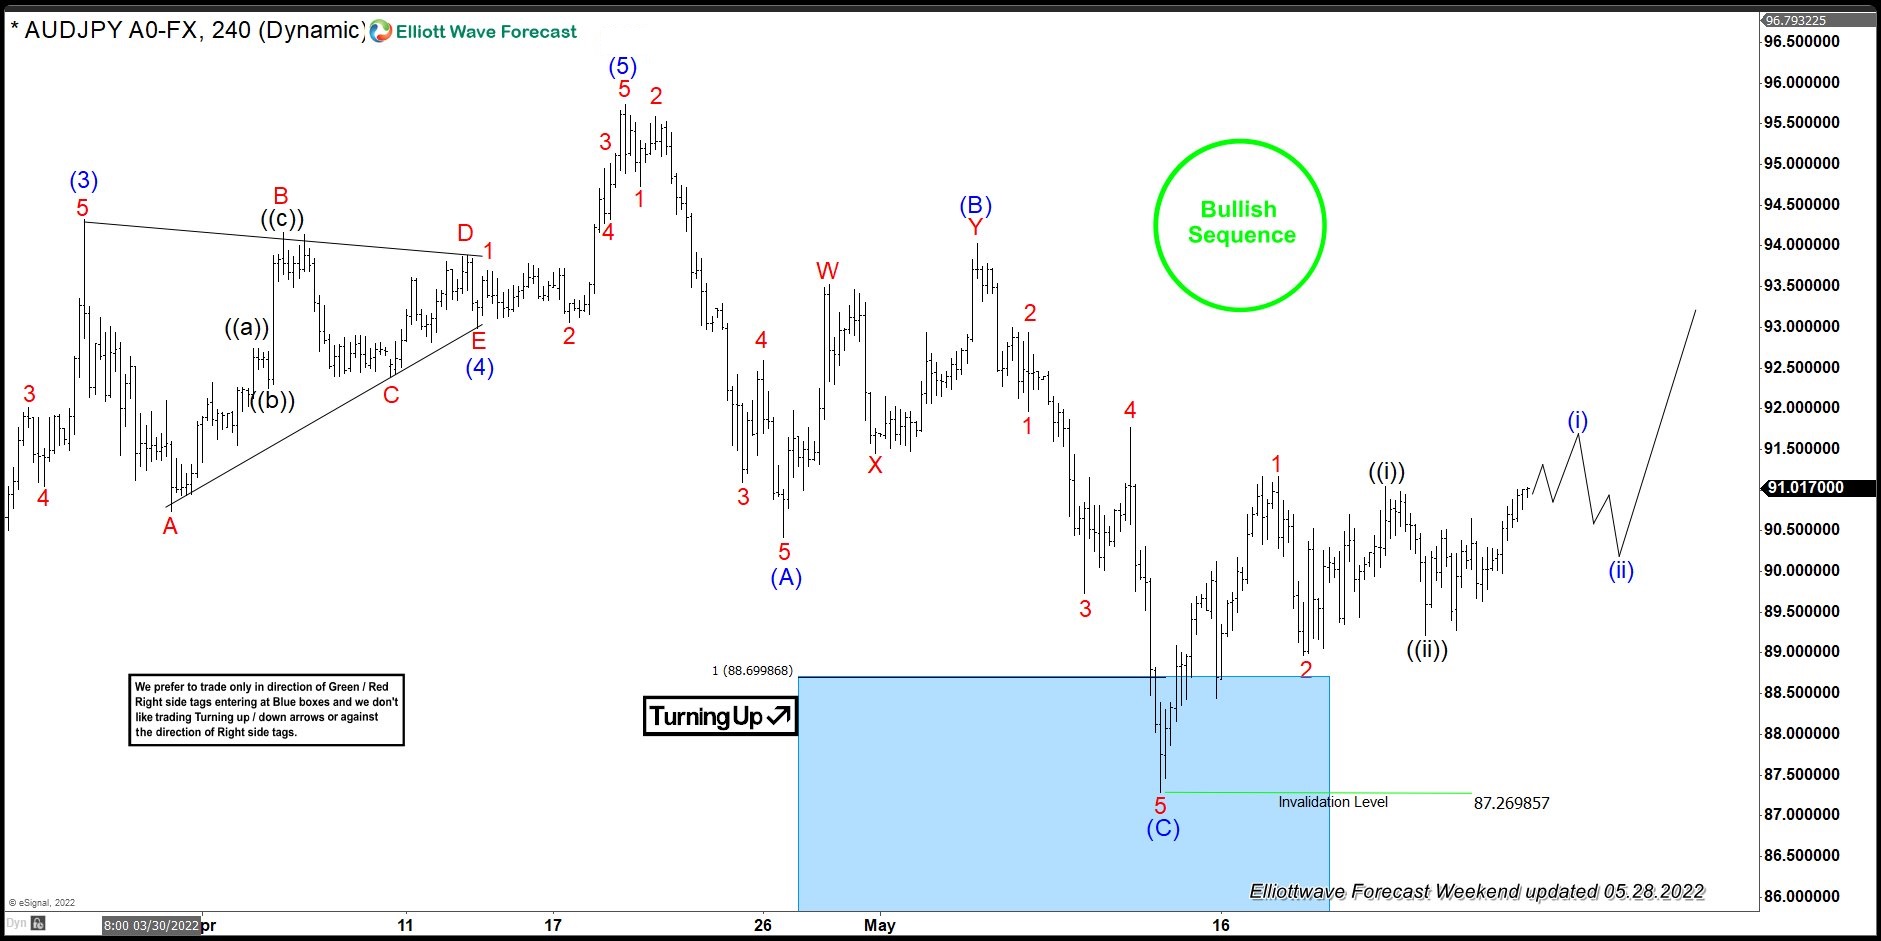
AUDJPYAUDJPY Elliott Wave 4 Hour Chart 05.11.2022
AUDJPY made leg down as expected. The pair found buyers at the Blue Box area and we are getting good reaction from there. Pull back completed at 87.26 low. The rally from the blue box already reached 50 fibs against the (B) connector. Consequently, we booked partial profits and made trades risk free ( put SL at BE). Now we need to see break of April 21st peak in order to confirm next leg up is in progress. In short term we would like to see break above 1 red high : 91.16 which will open possibility for further extension toward 92.99-93.93 area next.
Note: Some labeling have been removed in order to protect clients’ privileges.
Keep in mind that market is dynamic and presented view could have changed in the mean time. You can check most recent charts in the membership area of the site. Best instruments to trade are those having incomplete bullish or bearish swings sequences. We put them in Sequence Report and best among them are shown in the Live Trading Room
Eco Data 5/30/22
[php_everywhere instance="1"]