Sample Category Title
GBPJPY Rangebound after Decline Halts
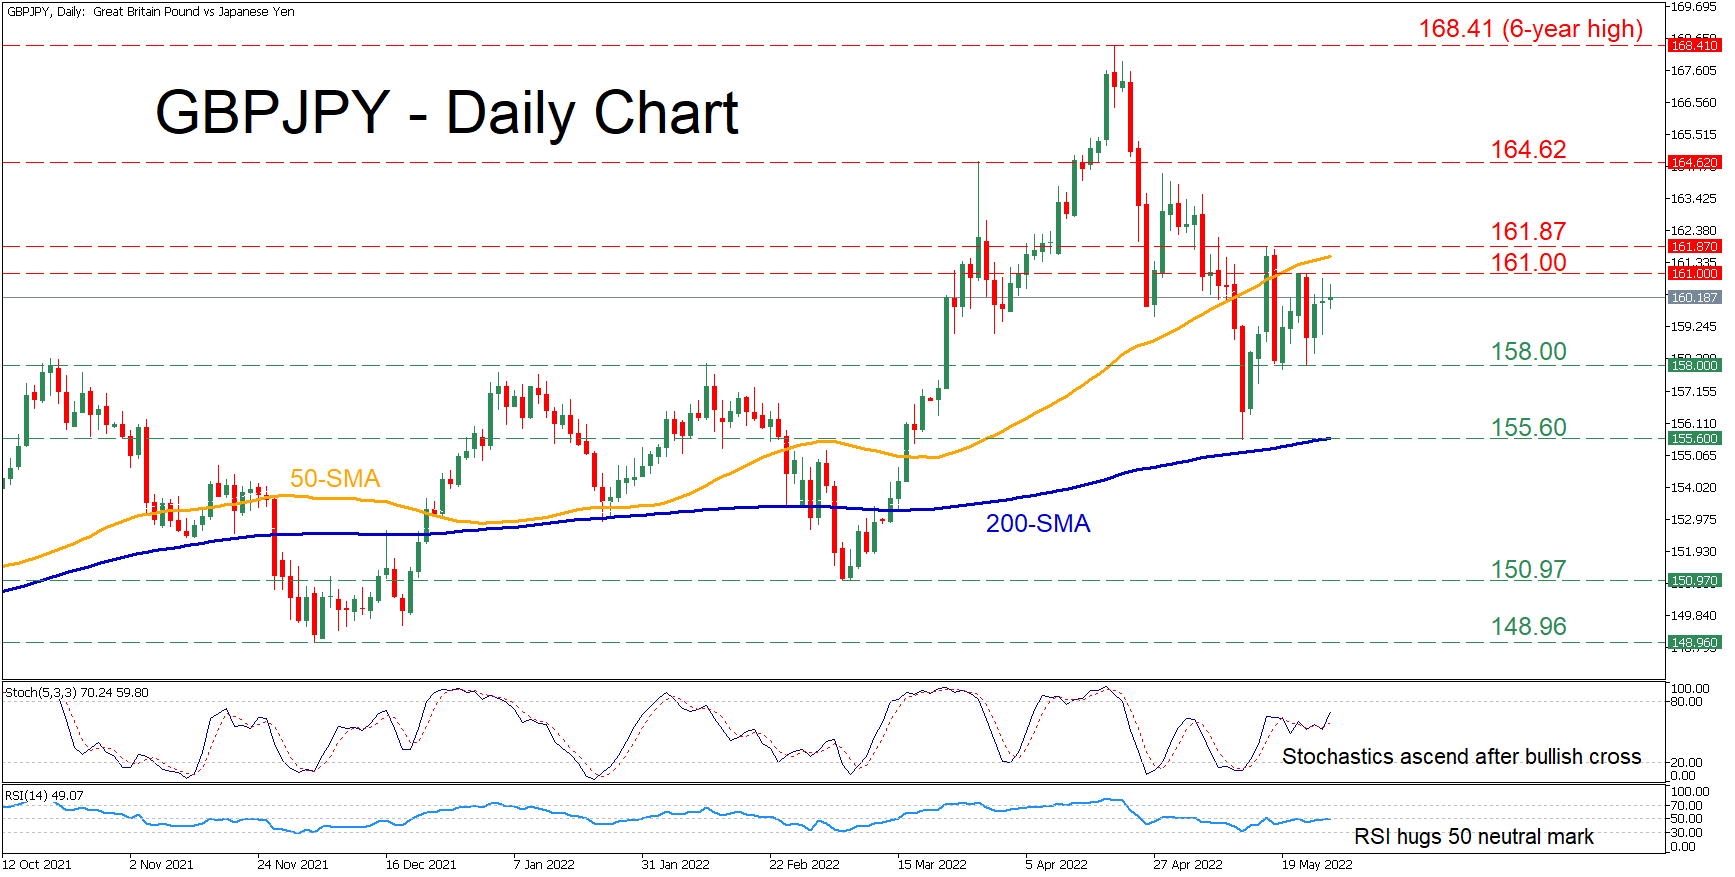
GBPJPY has experienced a sharp decline after peaking at the six-year high of 168.41 in early April. However, the pair has managed to find its feet and is currently trading sideways, while near-term risks seem to be tilted to the upside.
The momentum indicators endorse a cautiously positive tone. The stochastic oscillator is sloping upwards after posting a bullish cross, while the RSI is trying to cross above its 50-neutral threshold.
Should buying pressure persist, initial resistance could be encountered at the 161.00 psychological mark. Jumping above this region, the bulls could aim at the 161.87 barrier before the attention shifts to 164.62. Violating this area, the price may ascend to challenge the 6-year peak of 168.41.
On the flipside, bearish actions could push the price towards the crucial 158.00 support level. Diving beneath that region, the 155.60 barricade, which overlaps with the 200-day simple moving average (SMA), might prove to be the next obstacle for the bears. Failing to halt there, the February low of 150.97 could appear on the radar, a violation of which would set the stage for 148.96.
In brief, GBPJPY appears to be attempting to push higher and partially erase its recent pullback. Nevertheless, a dive below the 155.60 floor may signal the resumption of its recent downtrend.
Gold Remains Supported But Bulls Need Break of Pivotal Barrier to Resume
Spot gold regained traction and rose on Friday, following a shallow dip in past two days. Near-term action has established above 200DMA that adds to bullish near-term bias, however it is still ranging between 200DMA ($1839) and $1867 (Fibo 38.2% of $1998/$1786).
The metal is on track for the second consecutive bullish weekly close, inflated by weaker dollar that adds to positive near-term tone.
Formation of 10/200DMA golden-cross and rising 14-d momentum emerging into positive territory, underpin the action, but bulls need confirmation on sustained break above $1867 pivot that will signal bullish continuation and expose targets $1886/92 (100DMA / 50% retracement of $1998/$1786) and psychological $1900 barrier.
Res: 1867; 1874; 1886; 1892
Sup: 1848; 1839; 1836; 1810
Dollar Index: Dollar On Track for Second Big Weekly Loss on Cooling Expectations for Aggressive Fed
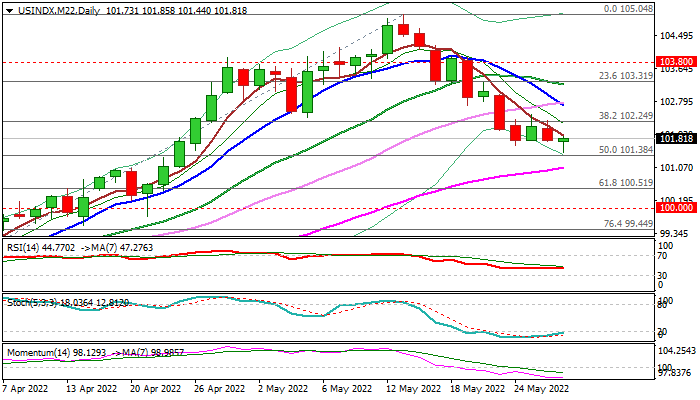
The dollar index dipped to new one-month low in early Friday, with fresh weakness signaling continuation of the downtrend from 105.04 peak (20-year high, posted on May 13), after bears were paused for consolidation in past three days.
The greenback remains deflated as traders lowered their expectations for aggressive Fed’s action in coming months, on signals that the US central bank may slow or even pause its policy tightening cycle in the next meetings.
Dissonant tones from some FOMC members on initial hawkish stance and weak economic data, add to the notion.
The index is on track for the second consecutive strong weekly loss, but bears face headwinds from important support at 101.38 (50% of 97.72/105.04 upleg, reinforced by weekly Tenkan-sen) that may further delay bearish continuation.
Daily studies show rising negative momentum, while 10/20/30DMA’s are in bearish setup and formed a multiple bear-crosses, adding to downside pressure.
The near-term action is expected to remain below broken Fibo 38.2% support at 102.24, to keep bears intact for final push through 101.38 pivot that would open way for test of targets at 101.51/00 (Fibo 61.8% / psychological).
Res: 102.34; 102.45; 102.69; 103.00
Sup: 101.38; 101.04; 100.51; 100.00
USDCAD Trickles Toward SMAs as Sellers Retake Control
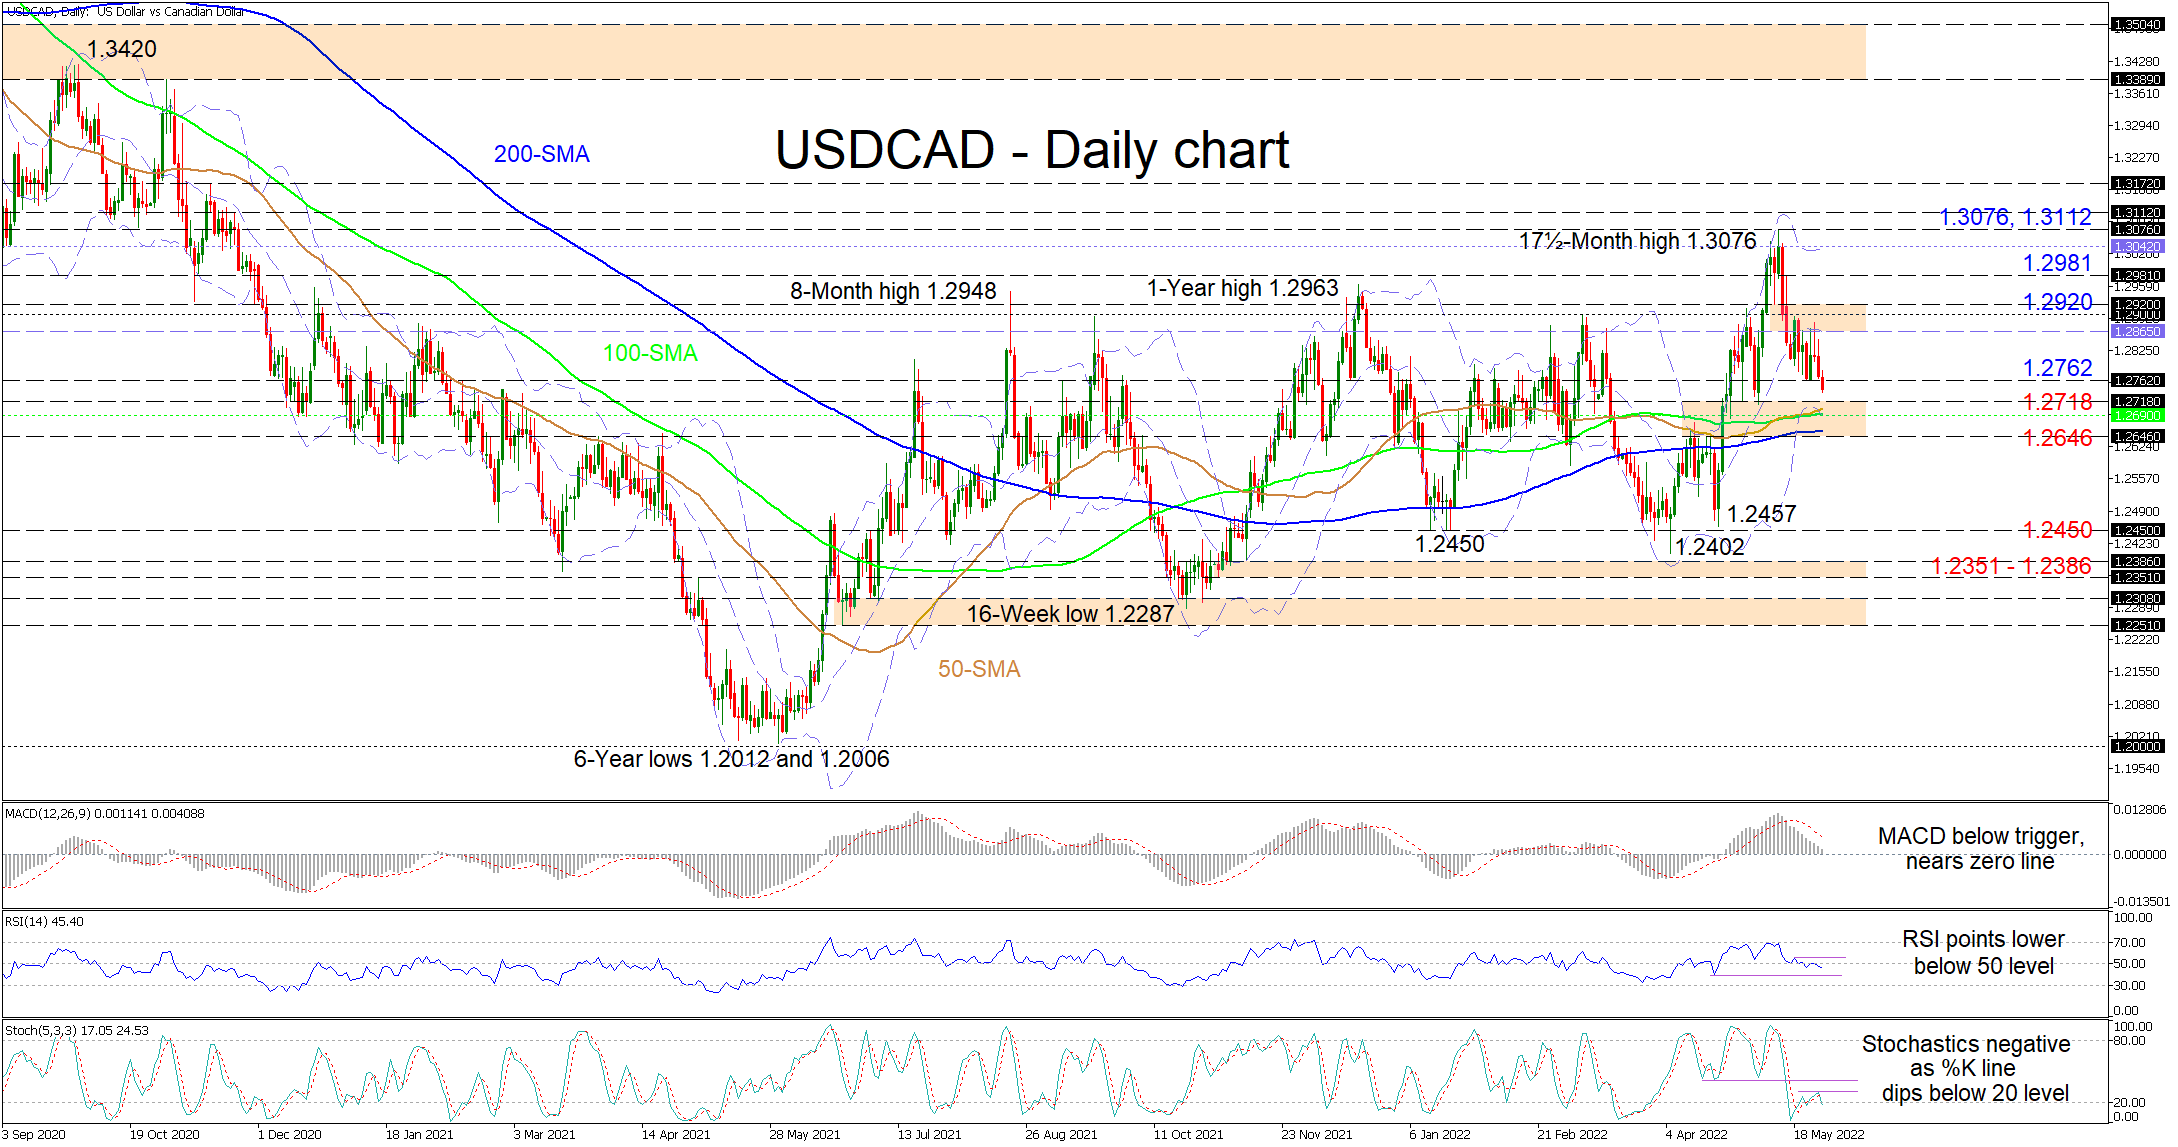
USDCAD is extending its retreat from the recorded 17½-month high of 1.3076, heading lower towards the converged simple moving averages (SMAs), which are not now endorsing any sturdy price trend. The pair has retracted within the region of a trading range that had lingered for a period of nearly ten months.
The short-term oscillators are reflecting the increase in negative momentum. The MACD, in the positive area, has distanced itself below its red trigger and is approaching the zero mark, while the RSI is falling in bearish territory. Moreover, the renewed negative charge of the stochastic oscillator is promoting additional downward price action in the pair.
To the downside, an initial fortified support section from the 1.2718 barrier until the inside swing low of 1.2646 exists. This includes all the SMAs and the lower Bollinger band and could prove to be a difficult task for sellers to accomplish. However, if this upside defence fails to dismiss selling intentions, the price may then tumble towards the April 21 trough of 1.2457, simultaneously testing the 1.2450 support too. In the event bearish pressures continue to overwhelm, the 1.2402 low and the adjacent 1.2351-1.2386 support band could draw traders’ attention.
On the flipside, if buyers unearth some positive traction somewhere within the 1.2646-1.2718 support zone, resistance could commence from the 1.2762 obstacle before the price jumps to test the resistance region linking the mid-Bollinger band at 1.2865 with the 1.2920 inside swing low. Breaching this, not too far above the 1.2981 high may come into play. Further hikes in the price may then encourage the bulls to aim for the upper Bollinger band at 1.3042 before challenging the 1.3076 peak and the 1.3112 high, where selling in the pair intensified back in November 2020.
Summarizing, USDCAD’s recently readopted bearish tone is weighing on the directionless SMAs. For positive developments to remain on the table, the price would need to hold north of the SMAs. A climb above the 1.2900 handle could boost buying interest, while a close below the SMAs may reinforce negative tendencies in the pair.
WTI Oil Outlook: Oil Prices Remain Supported by Global Supply Concerns
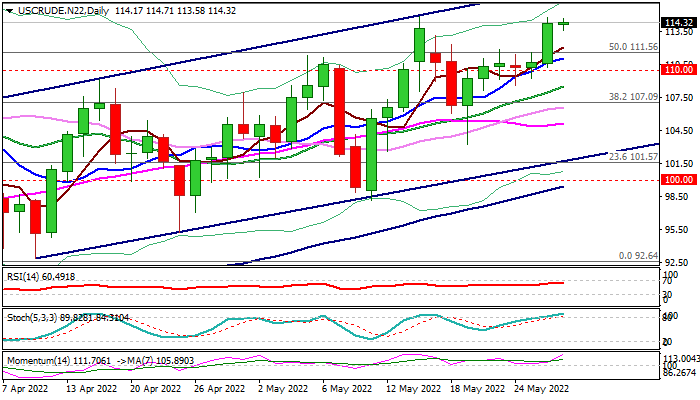
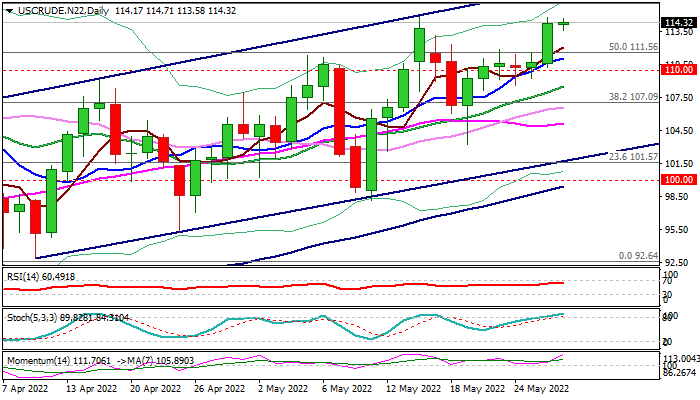
WTI oil is consolidating near new two-week high after Thursday’s 3.3% advance and maintaining firm tone, amid concerns about global supply.
Talks about EU ban on Russian oil, although so far without consensus as Hungary opposes the decision and expectations for increased demand on upcoming US summer driving season, continue to support oil prices.
In addition, the OPEC+ group will stick to its oil production deal, reached last year and raise July output targets by 432,000 barrels per day, despite call from the Western countries for higher output increase that would further underpin oil prices.
The WTI contract is on track for strong weekly gains and for a fourth consecutive weekly close above $110 level, with daily studies in full bullish setup and supportive for further advance, as the action is also supported by thickening daily Ichimoku cloud.
Bulls pressure May 16 high at 114.87, violation of which would expose pivotal barriers at 116.03 and 117.40 (Fibo 61.8% of $130.48/$92.64 / upper bull-channel boundary).
Broken 50% retracement level at 111.56 marks solid support which is required to hold and keep bulls intact.
Lower pivots lay at 110.00/108.96 (psychological/daily cloud top) and break here would weaken near-term structure.
Res: 114.87; 116.03; 116.60; 117.40.
Sup: 113.16; 111.56; 110.00; 108.96.
US Dollar Index Retreats ahead of US Inflation Data
American stocks rose sharply after relatively strong corporate earnings from companies like Macy’s and Dollar General. Macy’s shares jumped by over 16% after the firm’s net sales rose to $5.35 billion in the first quarter. Comparable sales rose by 13% while its net income doubled to $286 million. In a separate report, Dollar General said that same-store sales rose by 4.4% in the quarter as growth continued. These results provided hope that the situation among retailers was not as dire as posted by companies like Target and Walmart. Stocks also rose after Broadcom agreed to pay $61 billion to acquire Vmware.
The US dollar index declined after weak economic numbers from the United States. Data published on Thursday showed that the housing sector continued to deteriorate in April. Pending home sales declined by 3.9% on a month-on-month basis. This decline was worse than the median estimate of -2.0%. These numbers came a few days after further data revealed that new home sales declined by 16%. Meanwhile, data by the statistics agency showed that the economy declined by 1.5% on a QoQ basis. Later today, the US will react to the latest PCE data.
The economic calendar will be muted as investors shift to the long weekend in the United States. The economic data to watch will be the upcoming Swedish retail sales numbers. Another important event will be a statement by Philip Lane, ECB’s chief economist. He will likely hint that the bank will start hiking interest rates in July. Meanwhile, in the US, the statistics agency will publish the latest real personal consumption index.
EURUSD
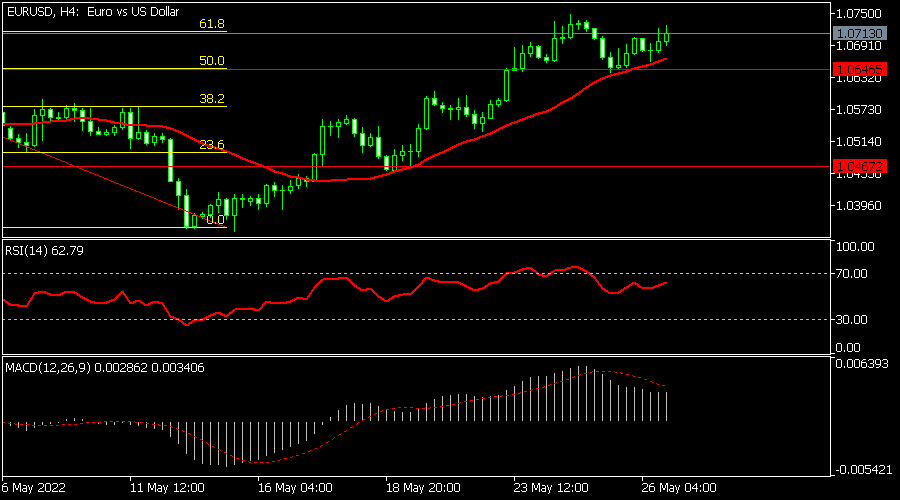
The EURUSD pair continued rising after the weak data from the US. The pair rose to a high of 1.0712, which is close to its highest level since April. The pair rose above the important support level at 1.0646. It also rose above the 25-day moving average while the MACD has remained above the neutral level. It has also risen above the 61.8% Fibonacci retracement level. Therefore, the pair will likely keep rising as bulls target the key resistance at 1.0800.
USDCHF
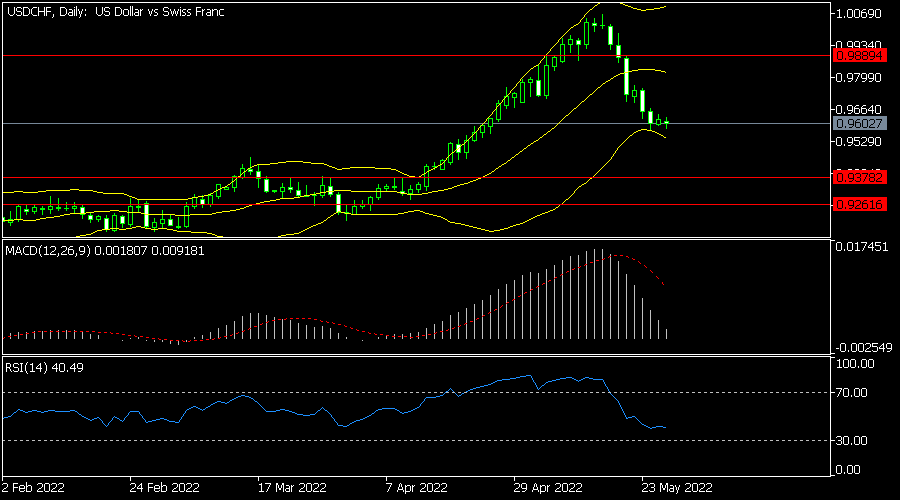
The USDCHF pair has been in a strong bearish trend in the past few days. The pair has moved from the year-to-date high of 1.00 to the current 0.9600. On the daily chart, the pair has moved along the lower side of the Bollinger Bands. The line of the MACD has crossed the histogram while the RSI has been moving downwards. The pair will likely keep falling as the downward trend continued.
USDCAD
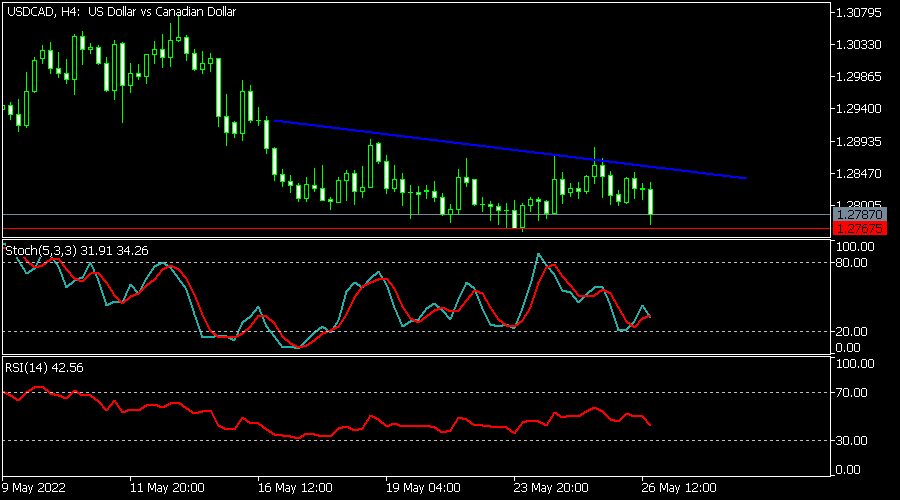
The USDCAD pair has been in a tight range in the past few days. The pair is trading at 1.2786, where it has been in the past few days. The pair is slightly below the descending trendline shown in blue. At the same time, the Stochastic Oscillator and the RSI have been moving downwards. The pair will likely have a bearish breakout if it manages to move below the support at 1.2767.
EUR/USD Pair Moved into a Positive Zone above $1.0700
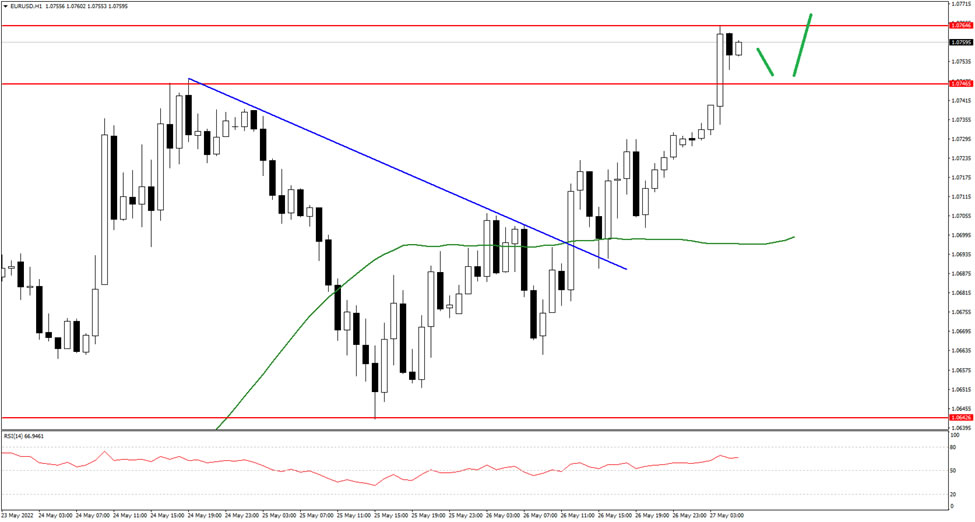
The Euro started a fresh increase from the 1.0650 support zone against the US Dollar. The EUR/USD pair surpassed the 1.0700 level to move into a positive zone.
The price even traded above the 1.0720 level and the 50 hourly simple moving average. It traded as high as 1.0765 and is currently consolidating gains. An immediate support is near the 1.0745 level.
The next key support is near 1.0720, below the pair could decline towards the 1.0700 level and the 50 hourly simple moving average in the near term. Any more losses might send the pair towards the 1.0650 level.
On the upside, the pair might struggle near 1.0780 on FXOpen. The next major resistance is near the 1.0800 level. A break above the 1.0780 and 1.0800 resistance levels could start a decent increase towards the 1.0900 level in the near term.
GBP/JPY Daily Outlook
Daily Pivots: (S1) 159.21; (P) 160.02; (R1) 161.02; More...
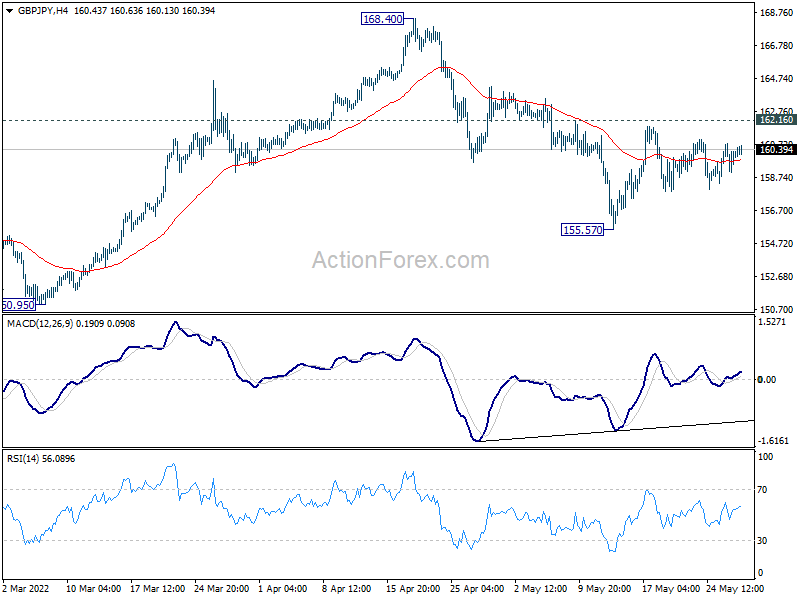
Intraday bias in GBP/JPY remains neutral for the moment. On the downside, break of 155.57 will extend the correction towards 150.96 key structural support. Nevertheless, on the upside, firm break of 162.16 will indicate that the correction has completed, and bring retest of 168.40 high next.
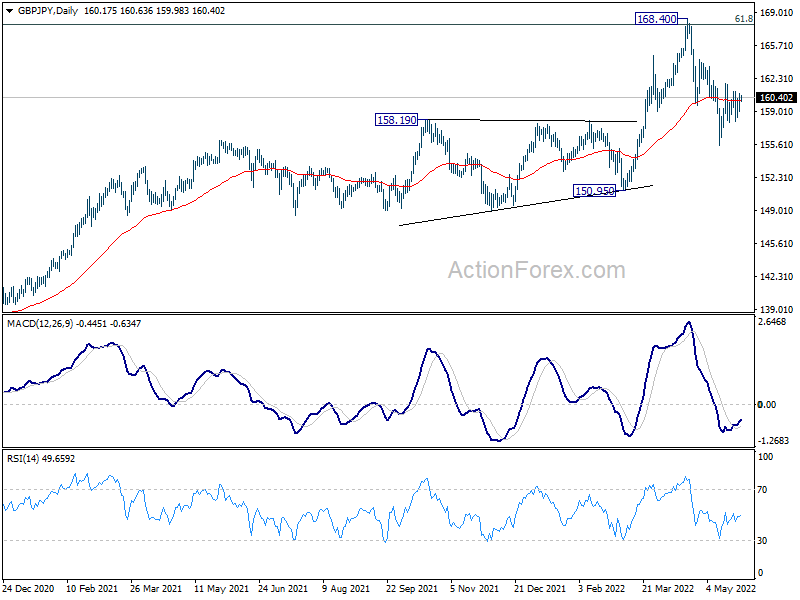
In the bigger picture, up trend from 123.94 (2020 low) is still in progress. Sustained break of 61.8% retracement of 195.86 (2015 high) to 122.75 (2016 low) at 167.93 will be a long term bullish signal, and could pave the way back to 195.86 high. This will now remain the favored case as long as 150.95 support holds, even in case of deep pull back. However, firm break of 150.95 will indicate rejection by 167.93, and bearish trend reversal.
EUR/JPY Daily Outlook
Daily Pivots: (S1) 135.49; (P) 136.06; (R1) 136.90; More....
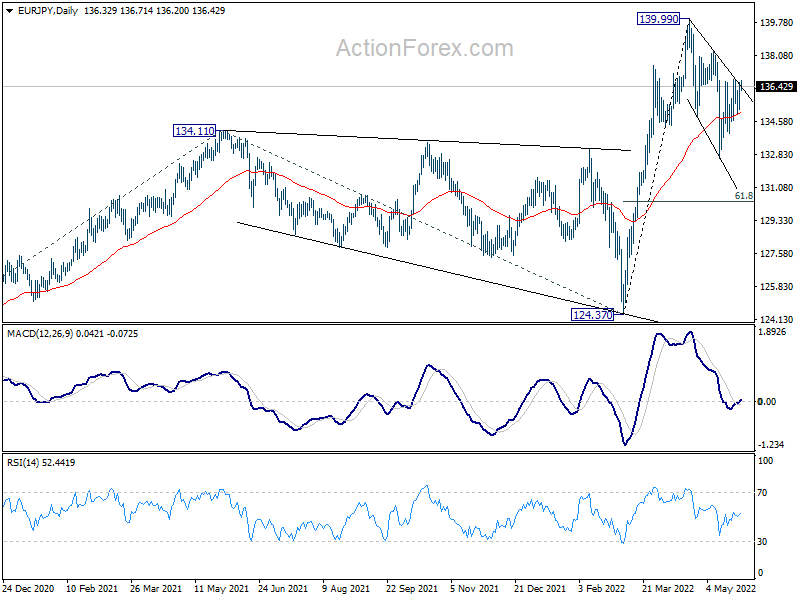
Intraday bias in EUR/JPY remains neutral for the moment. Corrective pattern from 139.99 could still extend lower. On the downside, break of 132.63 will resume the fall and target 61.8% retracement of 124.37 to 139.99 at 130.33. On the upside, break of 138.33 will indicate that the correction has completed, and bring retest of 139.99 high next.
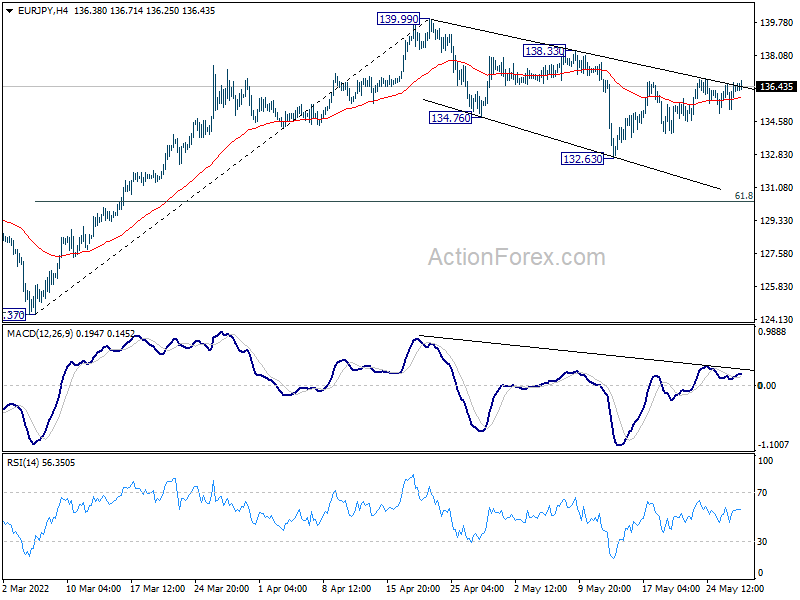
In the bigger picture, up trend from 114.42 (2020 low) is in progress. Such rise is seen as the third leg of the pattern from 109.30 (2016 low). Next target will be 100% projection of 114.42 to 134.11 from 124.37 at 144.06. In any case, outlook will now remain bullish as long as 124.37 support holds, in case of deep pull back.
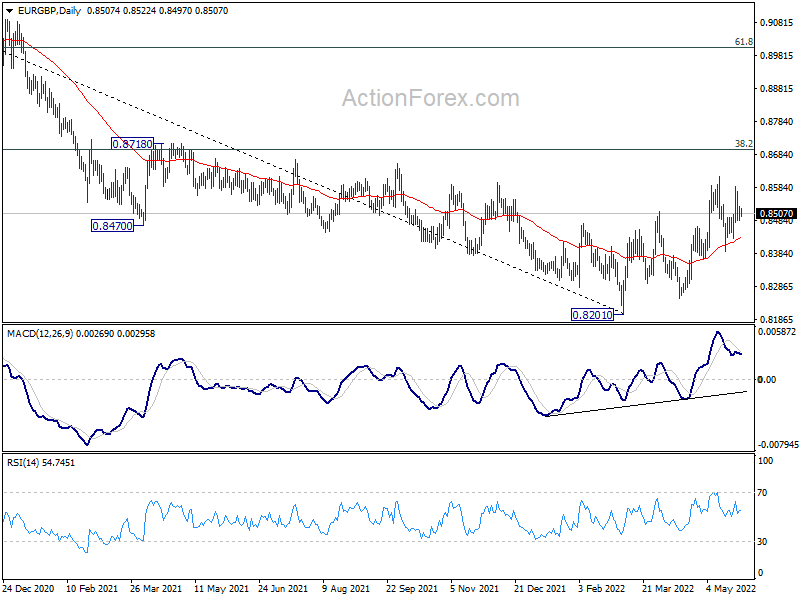
EUR/GBP Daily Outlook
Daily Pivots: (S1) 0.8487; (P) 0.8508; (R1) 0.8531; More...
Intraday bias in EUR/GBP stays neutral as range trading continues. As long as 0.8365 support holds, further rally is still in favor. On the upside, break of 0.8617 will resume rise from 0.8201 medium term bottom to 0.8697 medium term fibonacci level. However, break of 0.8365 will dampen this bullish view, and turn bias back to the downside instead.
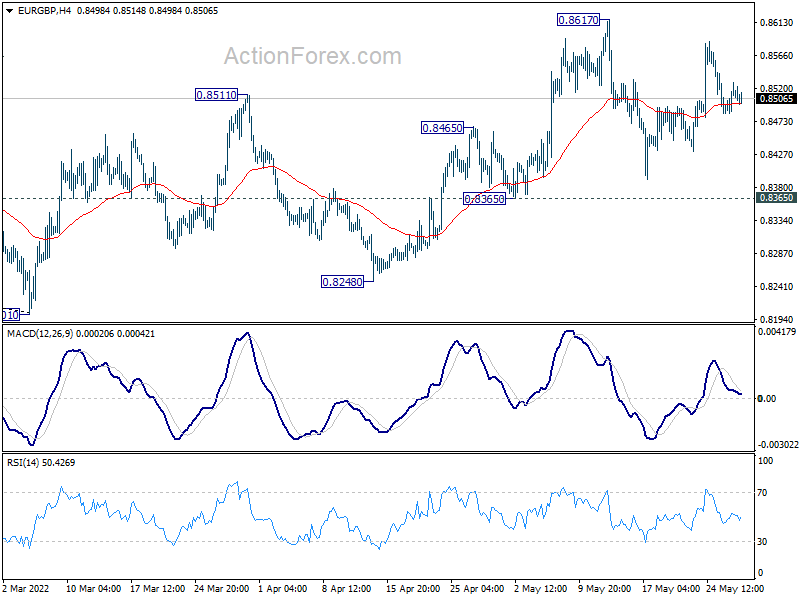
In the bigger picture, a medium term bottom could be in place at 0.8201, on bullish convergence condition in daily and weekly MACD. Rise from there could either be a correction to the down trend from 0.9499 (2020 high), or a medium term up trend itself. In either case, further rise should be seen to 38.2% retracement of 0.9499 to 0.8201 at 0.8697. Sustained break there will target 61.8% retracement at 0.9003.