

Sample Category Title
EUR/AUD Daily Outlook
Daily Pivots: (S1) 1.5055; (P) 1.5110; (R1) 1.5168; More...
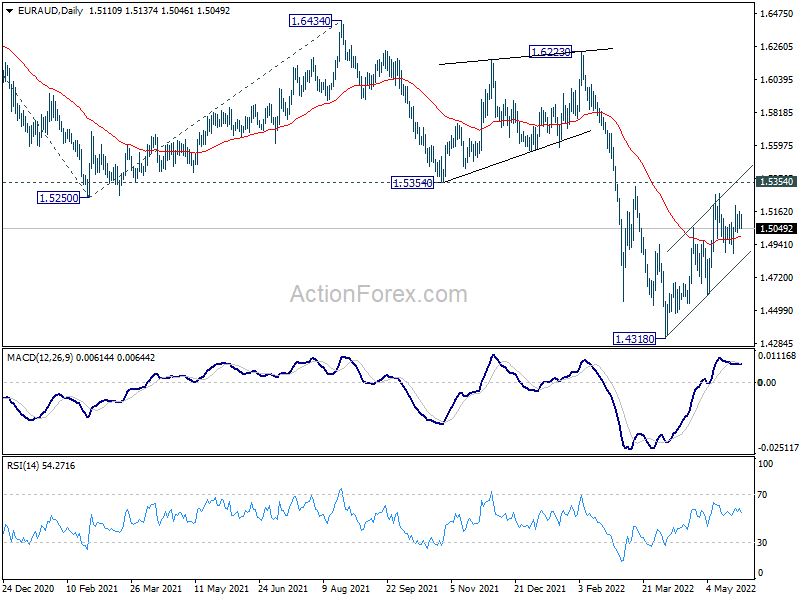
Intraday bias in EUR/AUD remains neutral for the moment. On the downside, break of 1.4882 support will reaffirm that case that corrective rebound from 1.4318 has completed at 1.5277, ahead of 1.5354 resistance. Intraday bias will be back on the downside for 1.4597 support first. Break there will bring retest of 1.4318 low. For now, risk will stay on the downside as long as 1.5277 resistance holds.
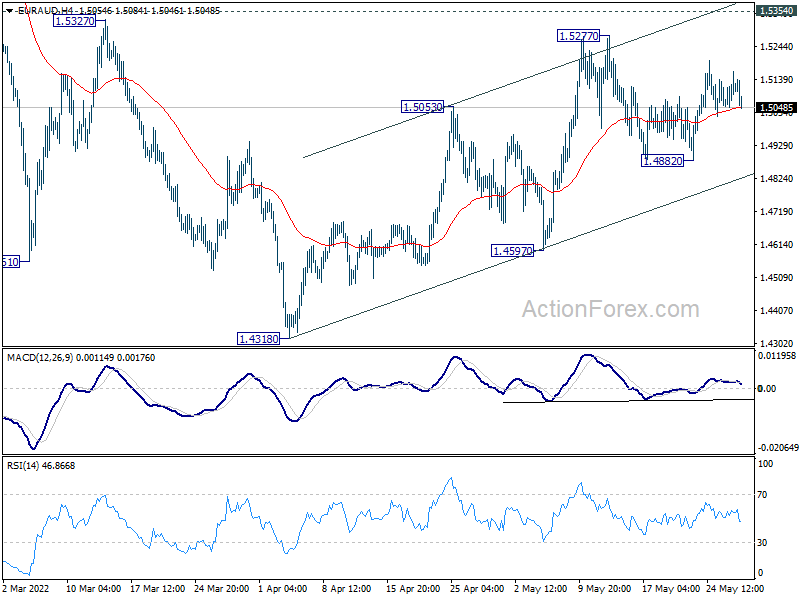
In the bigger picture, as long as 1.5354 support turned resistance holds, larger down trend form 1.9799 (2020 high) is still expected to continue. On resumption, next target is 61.8% projection of 1.9799 to 1.5250 from 1.6434 at 1.3623, which is close to 1.3624 long term support (2017 low). However, firm break of 1.5354 will indicate medium term bottoming and bring stronger rally back to 1.6434 key resistance.
EUR/CHF Daily Outlook
Daily Pivots: (S1) 1.0255; (P) 1.0282; (R1) 1.0316; More....
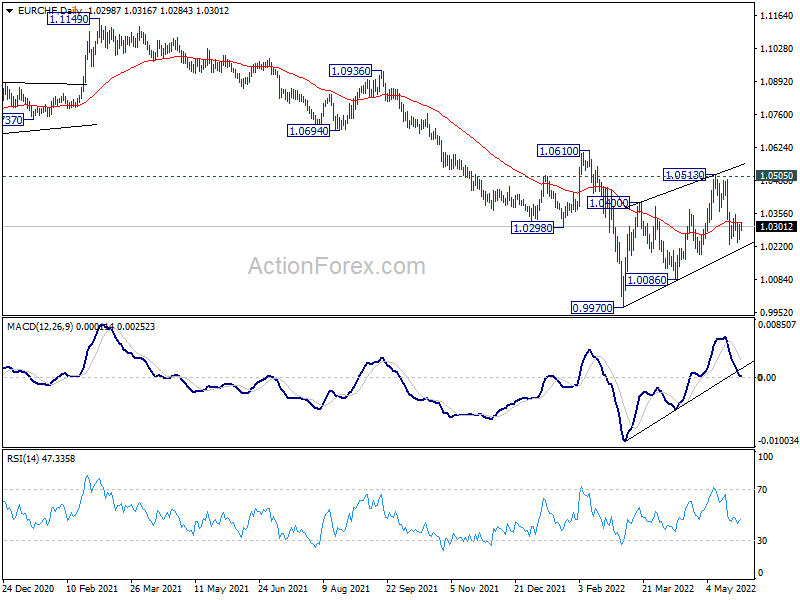
Intraday bias in EUR/CHF stays neutral at this point. Outlook is unchanged that corrective rebound from 0.9970 should have completed with three waves up to 1.0513, after rejection by 1.0505 key resistance. Below 1.0228 will target 1.0086 support. Firm break there will bring retest of 0.9970 low. However, break of 1.0359 will dampen this bearish view and bring stronger recovery back towards 1.0513 resistance.
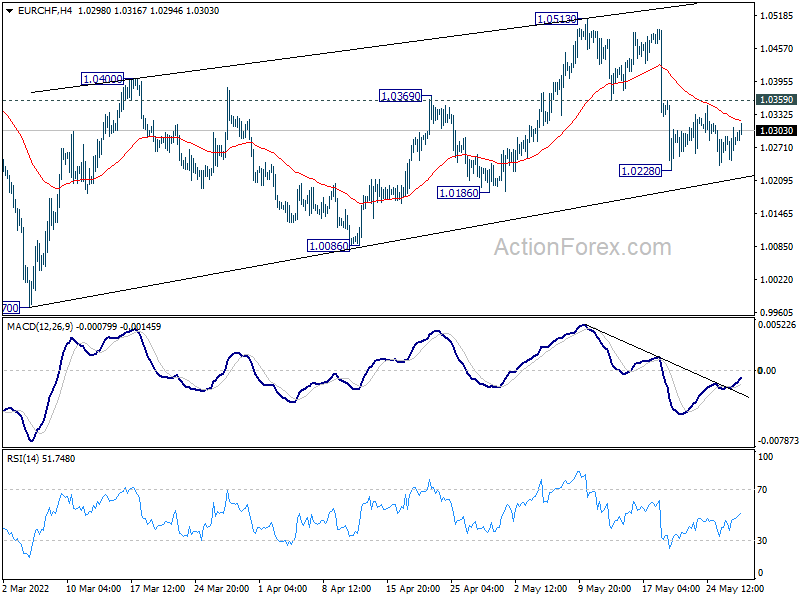
In the bigger picture, as long as 1.0505 support turned resistance (2020 low) holds, long term down trend from 1.2004 (2018 high) is expected to continue. Next target is 100% projection of 1.2004 to 1.0505 to 1.1149 at 0.9650. However, firm break of 1.0505 will suggest medium term bottoming, and bring stronger rebound towards 1.1149 structural resistance.
USD/CAD Daily Outlook
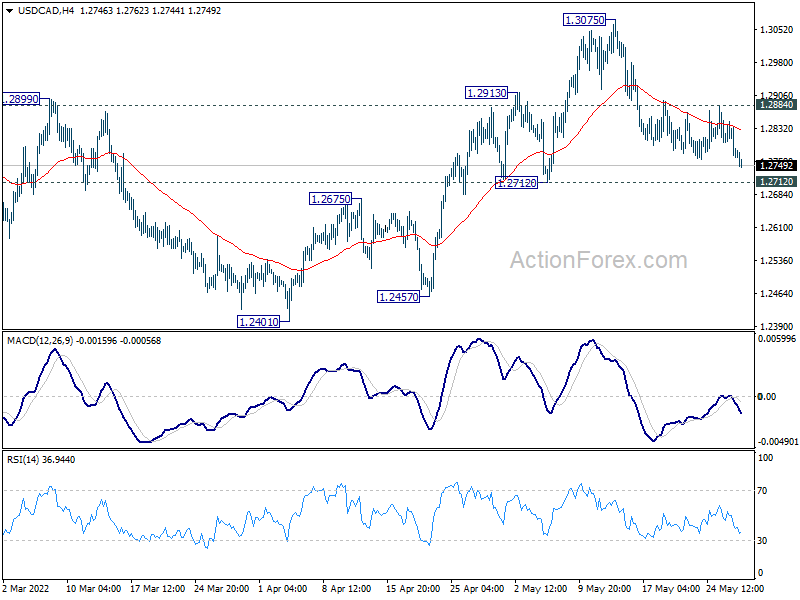
Daily Pivots: (S1) 1.2744; (P) 1.2796; (R1) 1.2824; More...
Intraday bias in USD/CAD remains neutral and outlook is unchanged. Further rise is mildly in favor with 1.2712 support intact. On the upside, above 1.2884 will turn bias to the upside for retesting 1.3075 high. Break there and sustained trading above 1.3022 fibonacci level will carry larger bullish implications. On the downside, however, break of 1.2712 support will indicate rejection by 1.3022 key fibonacci resistance, and bring deeper decline back to 1.2401 support.
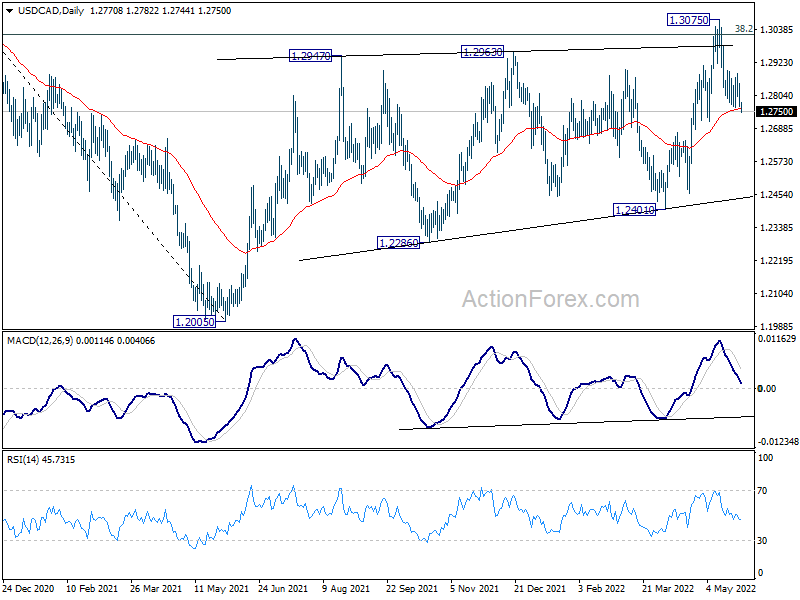
In the bigger picture, focus stays on 38.2% retracement of 1.4667 (2020 high) to 1.2005 (2021 low) at 1.3022. Sustained break there should confirm that the down trend from 1.4667 has completed after defending 1.2061 long term cluster support. Further rise would then be seen towards 61.8% retracement at 1.3650. However, rejection by 1.3022 will maintain medium term bearishness. Break of 1.2005 will resume the down trend from 1.4667 and that carries larger bearish implications too.
AUD/USD Daily Report
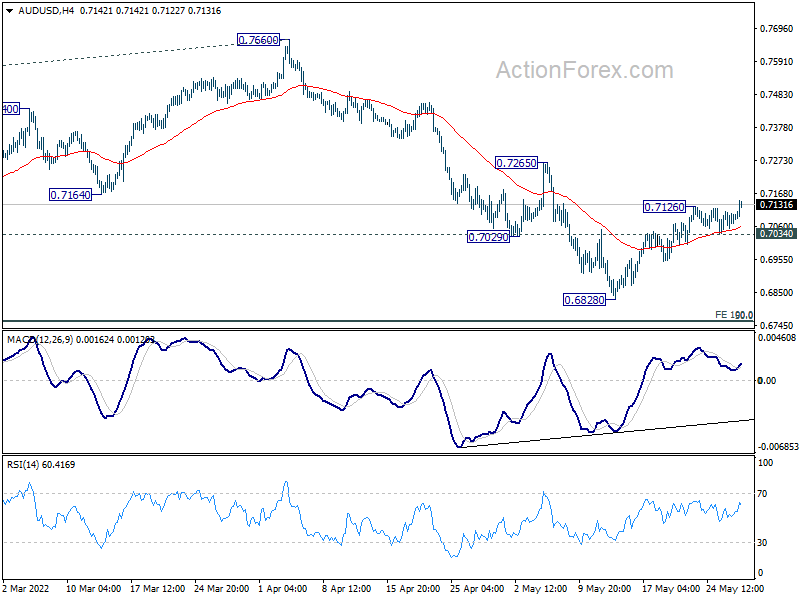
Daily Pivots: (S1) 0.7068; (P) 0.7089; (R1) 0.7121; More...
AUD/USD's rebound from 0.6828 resumed after brief retreat. Intraday bias is back on the upside for 55 day EMA (now at 0.7173). Break there will target 0.7265 resistance next. On the downside, though, break of 0.7034 minor support will turn bias back to the downside for retesting 0.6828 low.
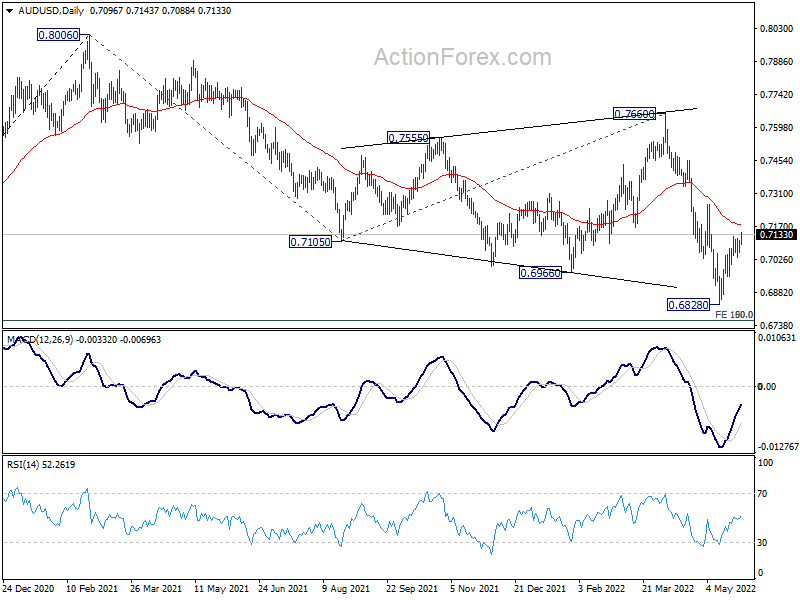
In the bigger picture, price actions from 0.8006 are seen as a corrective pattern to rise from 0.5506 (2020 low). Deeper fall could be seen to 50% retracement of 0.5506 to 0.8006 at 0.6756. This coincides with 100% projection of 0.8006 to 0.7105 from 0.7660 at 0.6760. Strong support is expected from 0.6756/60 cluster to contain downside to complete the correction. However, sustained break of 0.6756/60 would argue that AUD/USD is indeed already in a medium term down trend.
USD/JPY Daily Outlook
Daily Pivots: (S1) 126.56; (P) 127.07; (R1) 127.59; More...
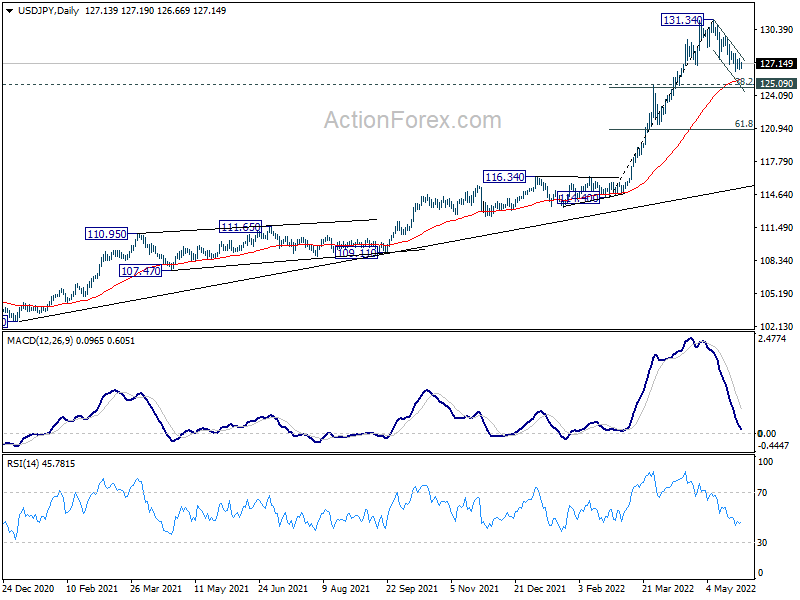
USD/JPY's correction from 131.34 could still extend lower. But downside should be contained by 125.09 cluster support (38.2% retracement of 114.40 to 131.34 at 124.86) to bring rebound. On the upside, break of 129.77 minor resistance will suggest that the correction is finished and bring retest of 131.34.
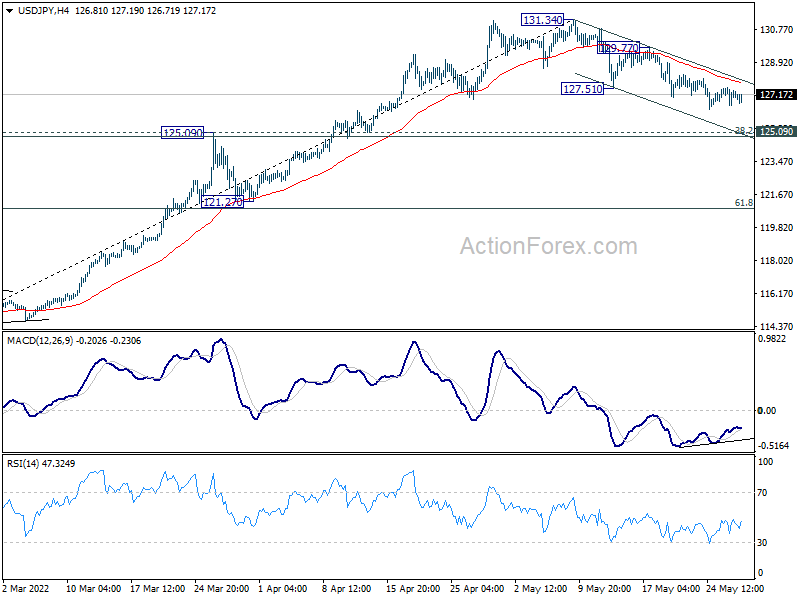
In the bigger picture, current rally is seen as part of the long term up trend form 75.56 (2011 low). Sustained trading above 61.8% projection of 75.56 (2011 low) to 125.85 (2015 high) from 98.97 at 130.04 will pave the way to 100% projection at 149.26, which is close to 147.68 (1998 high). For now, this will remain the favored case as long as 121.27 support holds.
USD/CHF Daily Outlook
Daily Pivots: (S1) 0.9570; (P) 0.9602; (R1) 0.9620; More...
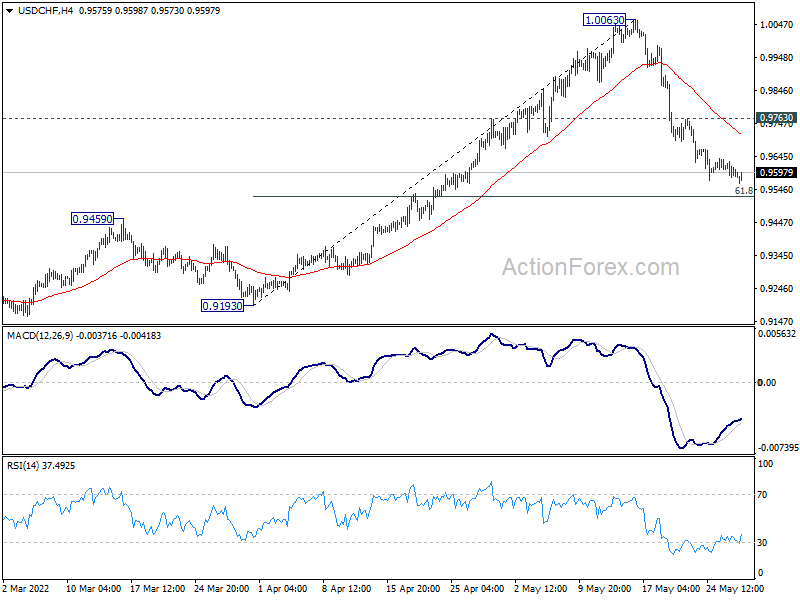
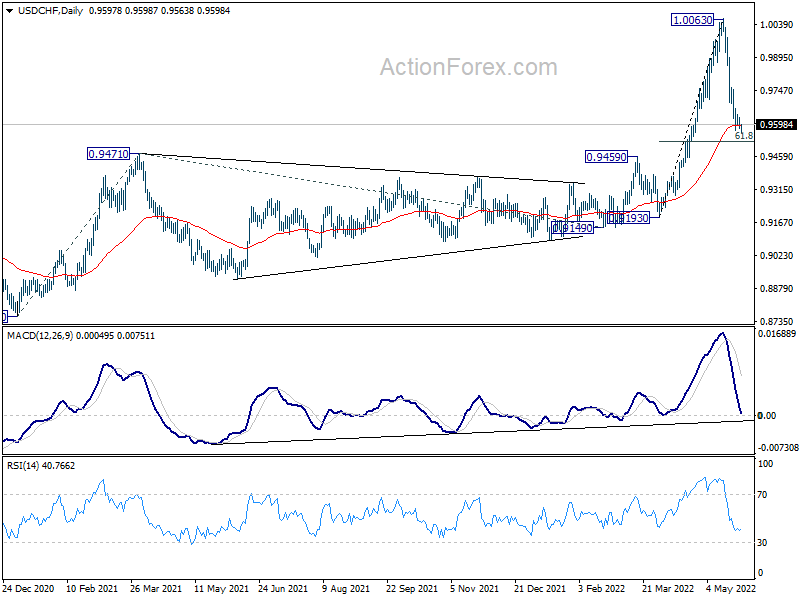
No change in USD/CHF's outlook. While further decline cannot be ruled out, downside should be contained by 61.8% retracement of 0.9193 to 1.0063 at 0.9525 to bring rebound. On the upside, above 0.9763 minor resistance will turn bias back to the upside for recovery. However, sustained break of 0.9525 will bring deeper decline to 0.9459 support.
In the bigger picture, down trend from 1.0342 (2016 high) should have completed with three waves down to 0.8756 (2021 low) already. Rise from 0.8756 is likely a medium term up trend of its own. Next target is 161.8% projection of 0.8756 to 0.9471 from 0.9149 at 1.0306, which is close to 1.0342 (2016 high). This will remain the favored case as long as 0.9459 resistance turned support holds.
EUR/USD Daily Outlook
Daily Pivots: (S1) 1.0685; (P) 1.0709 (R1) 1.0755; More...
EUR/USD's rebound from 1.0348 resumed after brief retreat. Intraday bias is back on the upside. Firm break of 55 day EMA (now at 1.0758 will target 1.0935 resistance next. On the downside, however, break of 1.641 minor support will turn bias back to the downside for retesting 1.0348 low instead.
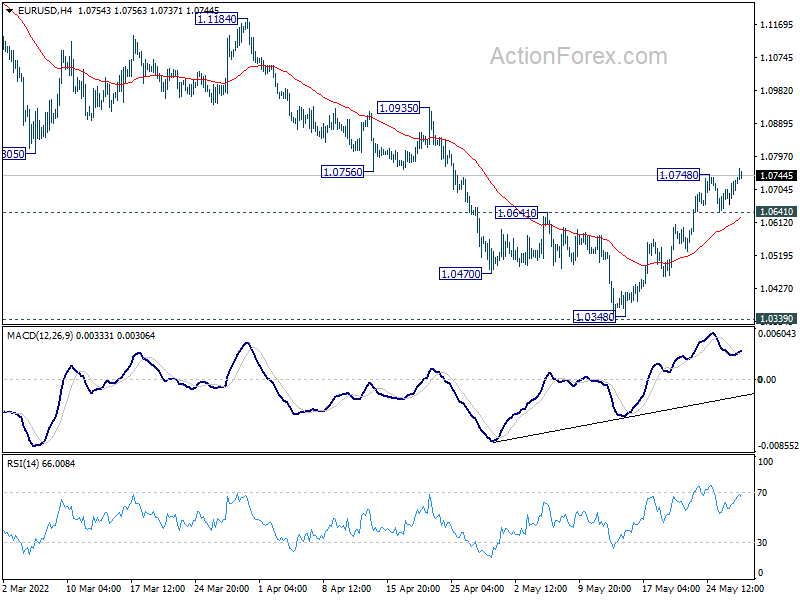
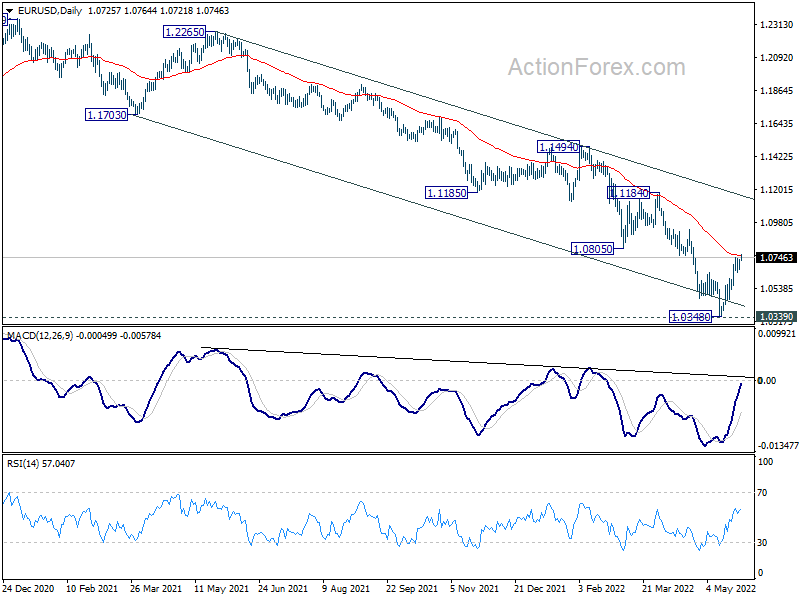
In the bigger picture, focus stays on 1.0339 long term support (2017 low). Decisive break there will resume whole down trend from 1.6039 (2008 high). Next target is 61.8% projection of 1.3993 to 1.0339 from 1.2348 at 1.0090. However, firm break of 1.0805 support turned resistance will delay this bearish case and bring medium term corrective rebound first.
Daily Technical Analysis
EUR/USD
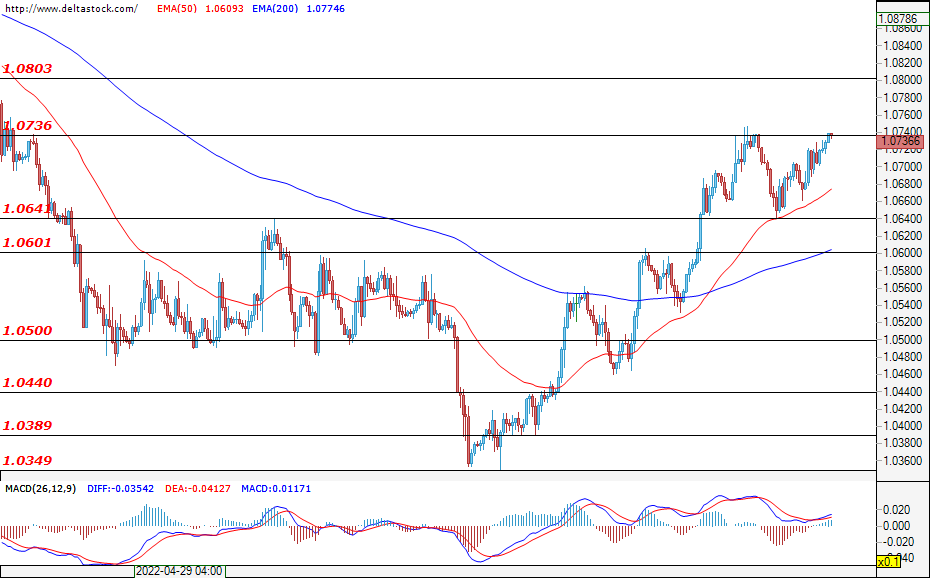
The euro continues to demonstrate compelling strength versus the U.S. dollar and gained ground against the greenback, reaching the resistance at 1.0730. At the time of writing, the bulls are struggling to overcome this critical resistance, where a confirmed breach could be considered as a reversal signal of the long-term downtrend, and the recovery would most probably continue towards the next key resistance at 1.0800. If the buyers overcome this psychological level, then we could expect a further increase towards 1.0925. However, in case the zone at 1.0800 withholds the bullish pressure, then a consolidation in the range of 1.0641 – 1.0800 will be the most likely scenario. Despite the positive sentiment, the current levels could be considered as a great opportunity for the sellers to re-enter the market, and if this happens, we might witness a retracement towards the support zone at 1.0600. Higher volatility can be expected when the core PCE deflator and personal income for the U.S. are both announced at 12:30 GMT.
USD/JPY
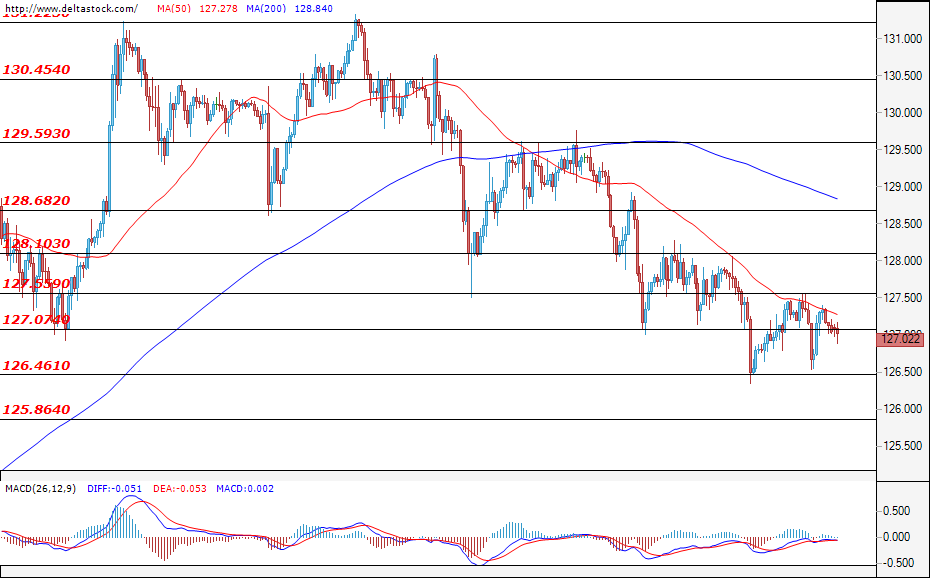
The forecasts for today’s trading session are for the pair to consolidate within the range of 127.60 – 126.46 as the downward movement was limited to the support zone at 126.46. A confirmed breach of the lower border of the range may lead the pair towards a test of the next support level at 125.86. In the opposite direction, a successful breach of the resistance at 127.60 would probably nudge the pair towards a test of the key resistance at 128.10.
GBP/USD
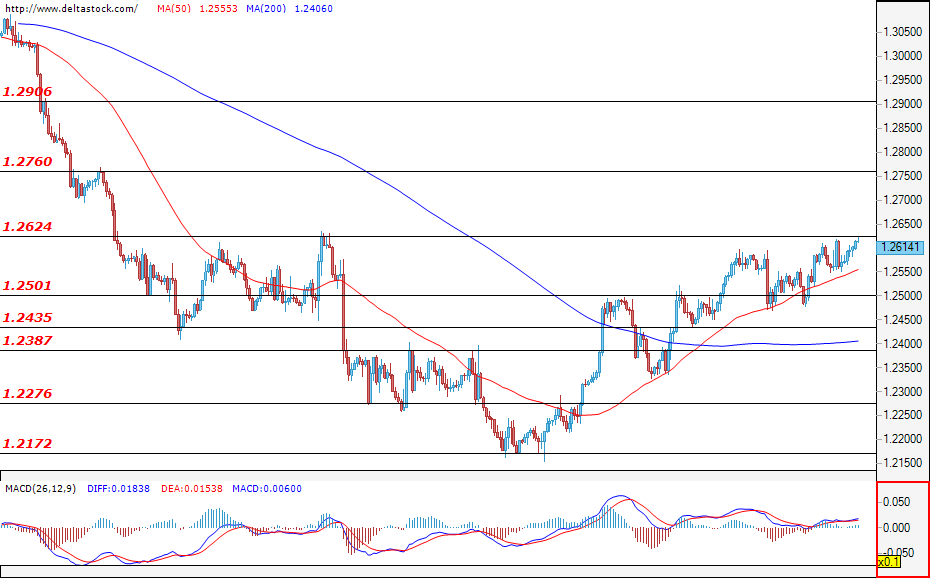
The pair is headed towards a test of the critical resistance level at 1.2624, and if the bulls do not lose momentum and successfully violate this zone, then the next target would be the resistance at 1.2760. However, if the bears manage to regain control, then a corrective move towards the support at 1.2500 could take place instead. Considering the complex economic situation, the pair may enter a consolidation phase in the range of 1.2624 – 1.2500 as the market participants are still cautious and expect news regarding the conflict between Ukraine and Russia before taking a decision on whether to take a short or a long position.
EUGERMANY40
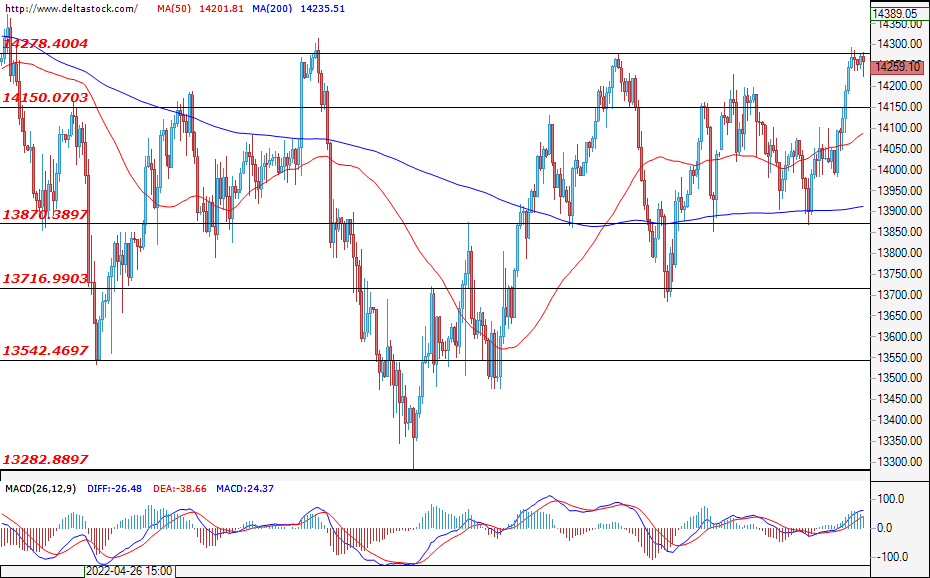
During yesterday’s trading session, the German index significantly increased its value, reaching the resistance level of 14278. This level managed to twice resist the bullish pressure since the beginning of this month, and another rebound from this resistance zone would suggest a decrease in the price and a test of the support at 14150. A confirmed breach of the mentioned support may lead to a further depreciation towards the support at 13870.
US30
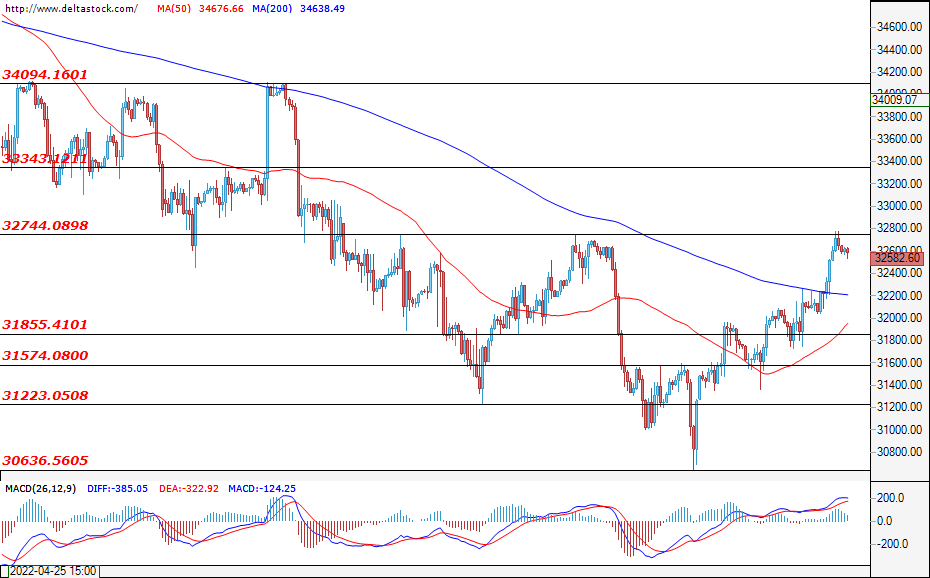
The attack of the bulls was thwarted by the critical resistance at 32744, and at the time of writing this analysis, the buyers seem to lose momentum. The expectations for today’s trading session are for trading to remain below this level, and therefore a decline towards 32200 seems to be the most reasonable scenario. In case the price reaches the mentioned level, then the buyers would most probably take the chance to re-enter the market and head the price towards another test of the critical resistance at 32744.
Cryptocurrencies Went Down Out of Consolidation
On Thursday, Bitcoin was down 1.1%, ending the day at around $29.5K, despite a buoyant stock market performance. Selling resumed on Friday morning, pushing the price back to $28.9K.
The observed divergence is bucking the trend of close correlation that has developed over the last few days.
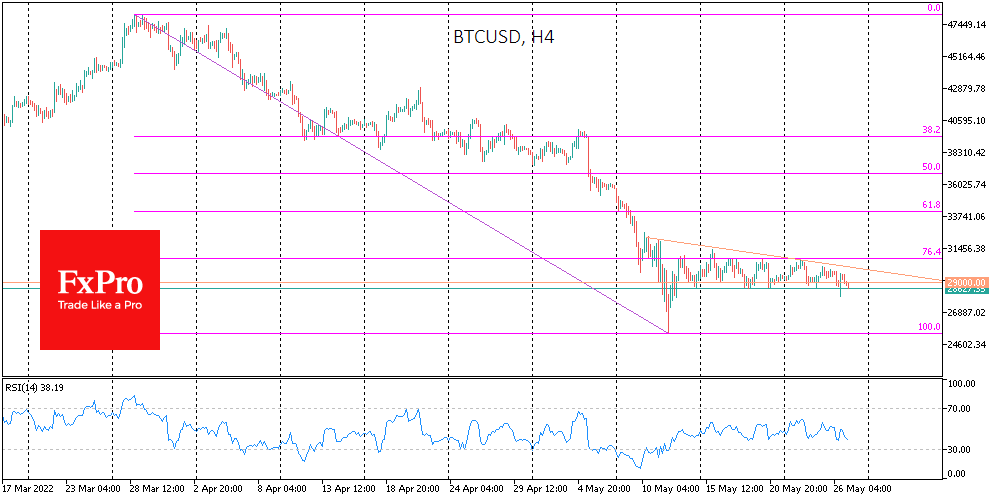
Yesterday’s sharp 5.5% dip in BTCUSD within hours to $28K was much less of a move than expected, as there was more than a 3% rise in the Nasdaq in the background. As a result, bitcoin was sharply recovered due to increased risk appetite.
As a result, on the intraday charts, the converging triangle has turned into a channel with more frequent tests of the lower boundary near $29K. In our view, the previous consolidation might be just another phase of consolidation, which, when completed, would quickly take the price to the next lower level, as it did from April to May.
The final target of the central mass of bears might be the area of $20-23k, but the movement there might be stretched in time and decomposed into stages.
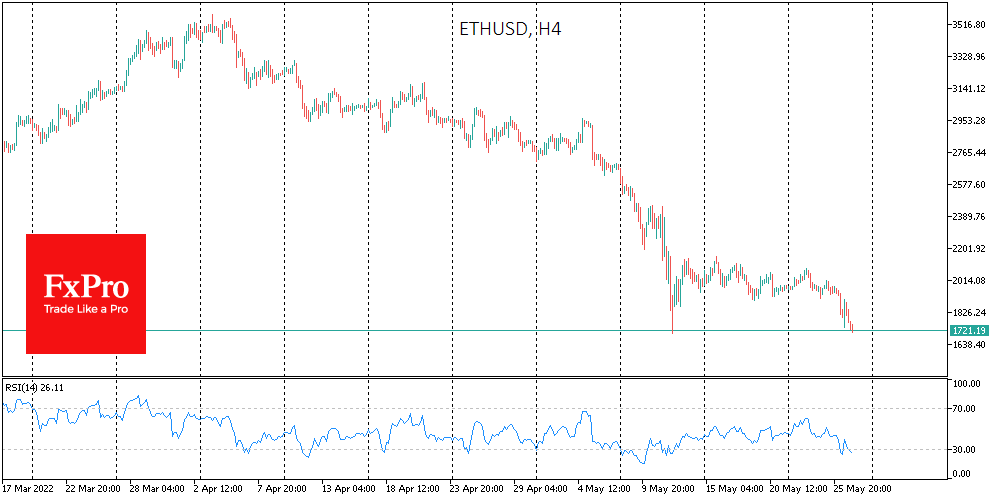
Confirming that bears dominate the crypto market is Ethereum, which has lost about 10% in the last 24 hours to $1750, finding itself in a lower bound since April 2021. In ETHUSD, a final landing is seen in the $1200-1300 area.
Other altcoins in the top 10 have fallen from 2% (XRP) to 13.8% (Solana).
Total cryptocurrency market capitalisation, according to CoinMarketCap, fell 5% overnight to $1.20 trillion.
The cryptocurrency fear and greed index was unchanged by Friday, remaining at 12 points (‘extreme fear’) on the back of solid Bitcoin momentum.
Bitcoin’s mining difficulty fell by 4.33% to 29.9 trillion hashes, the most significant drop last July. According to Arcane Research, the profitability of mining continues to plummet.
The CEO of Coinbase, the largest US cryptocurrency exchange, said the crypto industry’s history and prospects are convincing more US congress members to support the development of digital assets.
Investment management firm ARK Investment Management has reapplied to the SEC to launch a bitcoin-ETF.
Tether, the issuer of the USDT stablecoin, has launched a new stablecoin cryptocurrency, MXNT, pegged to the Mexican peso. It will be moveable on Ethereum, Tron and Polygon blockchains.
Oil Rally Could Overshadow Optimism
US indices gained for the second day as the FOMC minutes helped improving the investor mood.
Fed minutes released on Wednesday weren’t as hawkish as many investors feared: the Fed deciders mostly agreed that inflation is too high and labour market is too tight and that they should raise the rates by 50bps for the next two meetings.
But, there was no sign that the Fed would go down the 75bp hike road. Some members thought the price pressures won’t get much worse, and the Atlanta Fed President Bostic even suggested that, given that economic data has taken a step backward, the central bank could even pause on rate hikes in September!
That’s perhaps a daring statement, as a single month softness in inflation data doesn’t necessarily suggest that the US is out of the woods just yet; gas and food prices continue rising at pace, and threaten the price stability.
But the latest FOMC minutes confirm that the Fed is ready to scale back on the tightening plans, if only it could!
Rising oil prices could overshadow optimism
The S&P500 had a nice rebound this week, as the index regained the 4000 mark after testing the 3800 level last week. Nasdaq jumped the most.
But the US futures are slightly in the negative at the time of writing, as the rally in energy prices certainly throw a shadow on the latest optimism, keeping the inflation worries tight, as the soaring energy prices are one of the major responsible for the skyrocketing inflation.
The barrel of US crude rallied above the $115 mark, and consolidates above this level this morning.
Softening dollar
The US dollar index eases, as the US 10-year yield steadies around the 2.75% mark.
Softer dollar plays in favour of the EURUSD. The pair is testing the 50-DMA offers (1.0750) to the upside. Less hawkish Fed, and more hawkish European Central Bank (ECB) comments justify a further recovery toward the 1.10 mark into the summer months.
Gold remains bid above the 200-dma ($1842 per ounce), but the upside momentum is fading as the improving risk appetite moves capital toward riskier, and better yielding assets.
Bitcoin, on the other hand, didn’t benefit from the past sessions’ risk rally, and the price of coin is now pushing below the $30K mark. The ECB warns that the cryptocurrencies are a big threat to the financial stability. There is a stronger case for a further drawback in Bitcoin’s price in the coming weeks, than a rebound.