Sample Category Title
GBP/USD Daily Outlook
Daily Pivots: (S1) 1.2567; (P) 1.2594; (R1) 1.2636; More..
GBP/USD's rebound from 1.2154 extended with break of 1.2637 resistance. Intraday bias is now on the upside and further rally would be seen to 55 day EMA (now at 1.2756). Sustained break there will target 1.2999 support turned resistance next. On the downside, though, break of 1.2480 minor support will turn bias back to the downside for retesting 1.2154 low instead.
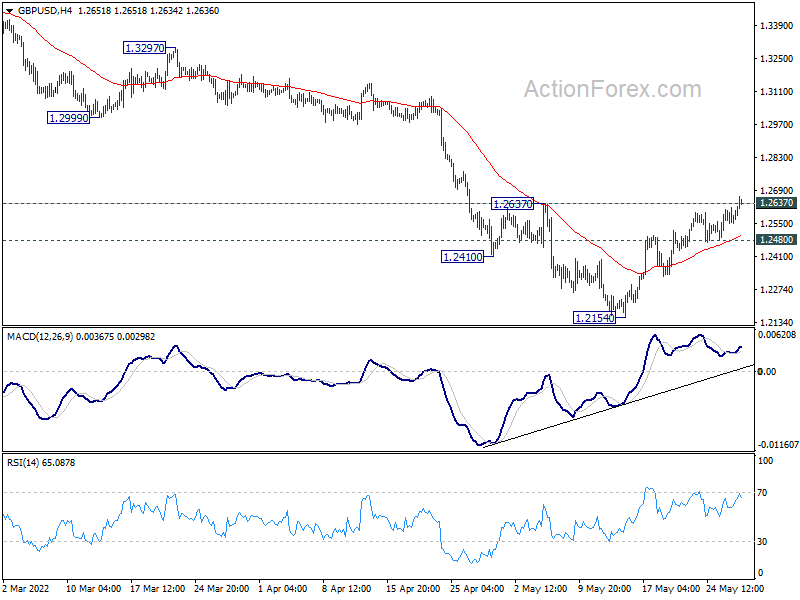
In the bigger picture, based on current momentum, fall from 1.4248 (2018 high) at least at the same degree as the rise from 1.1409 (2020 low). That is, fall from 1.4248 could be a leg inside the pattern from 1.1409, or resuming the longer term down trend. In either case, deeper decline is expected as long as 1.2999 support turned resistance holds. Next target is 1.1409 low.
Dollar Back Under Pressure as Risk-On Sentiment Returns
Dollar is back under pressure in today, as the rebound in US stocks carry forward to Asia. Swiss Franc is also paring some gains too while Yen softens slightly. Australian and New Zealand Dollars are firm together while Sterling while Euro is mixed. Return of risk-on sentiment, as well as extended pull back in treasury yields could drag the greenback further lower before the week closes.
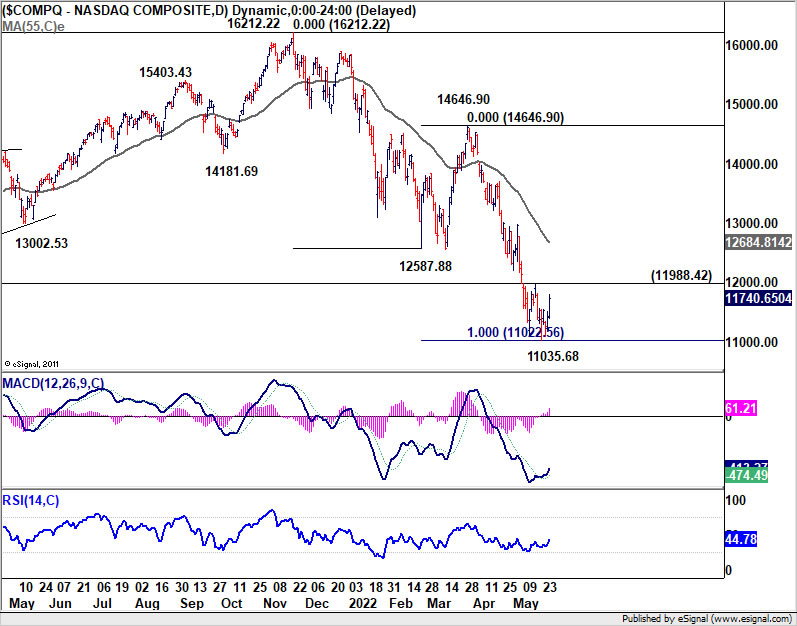
Technically, NASDAQ has been the relatively poor performer recently among major US indexes. As the rebound extends, focus will be on 11988.42 resistance. Firm break there should confirm that a stronger rebound, at least a bear market rally, is underway for 12587.88 support turned resistance ahead in the coming weeks. Such development, if happens, would likely be accompanied by deeper correction in Dollar in general. This will be the focus for today and the early part of next week.
In Asia, at the time of writing, Nikkei is up 0.59%. Hong Kong HSI is up 2.34%. China Shanghai SSE is up 0.08%. Singapore Strait Times is up 0.42%. Japan 10-year JGB yield is down -0.0055 at 0.230. Overnight, DOW rose 1.61%. S&P 500 rose 1.99%. NASDAQ rose 2.68%. 10-year yield rose 0.007 to 2.756.
BoJ Kuroda: Prices won't rise sustainably without wage hikes
BoJ Governor Haruhiko Kuroda told the parliament today that core inflation (all items excluding fresh food) is "likely to remain around 2% for about 12 months", unless energy prices drop sharply.
However, he emphasized that "prices won't rise sustainably, stably unless accompanied by wage hikes." That's seen as in indication that recent rise in inflation is not enough to lead to exit of the ultra-loose monetary policy.
Also from Japan, Tokyo CPI core was unchanged at 1.9% yoy in May, below expectation of 2.0% yoy.
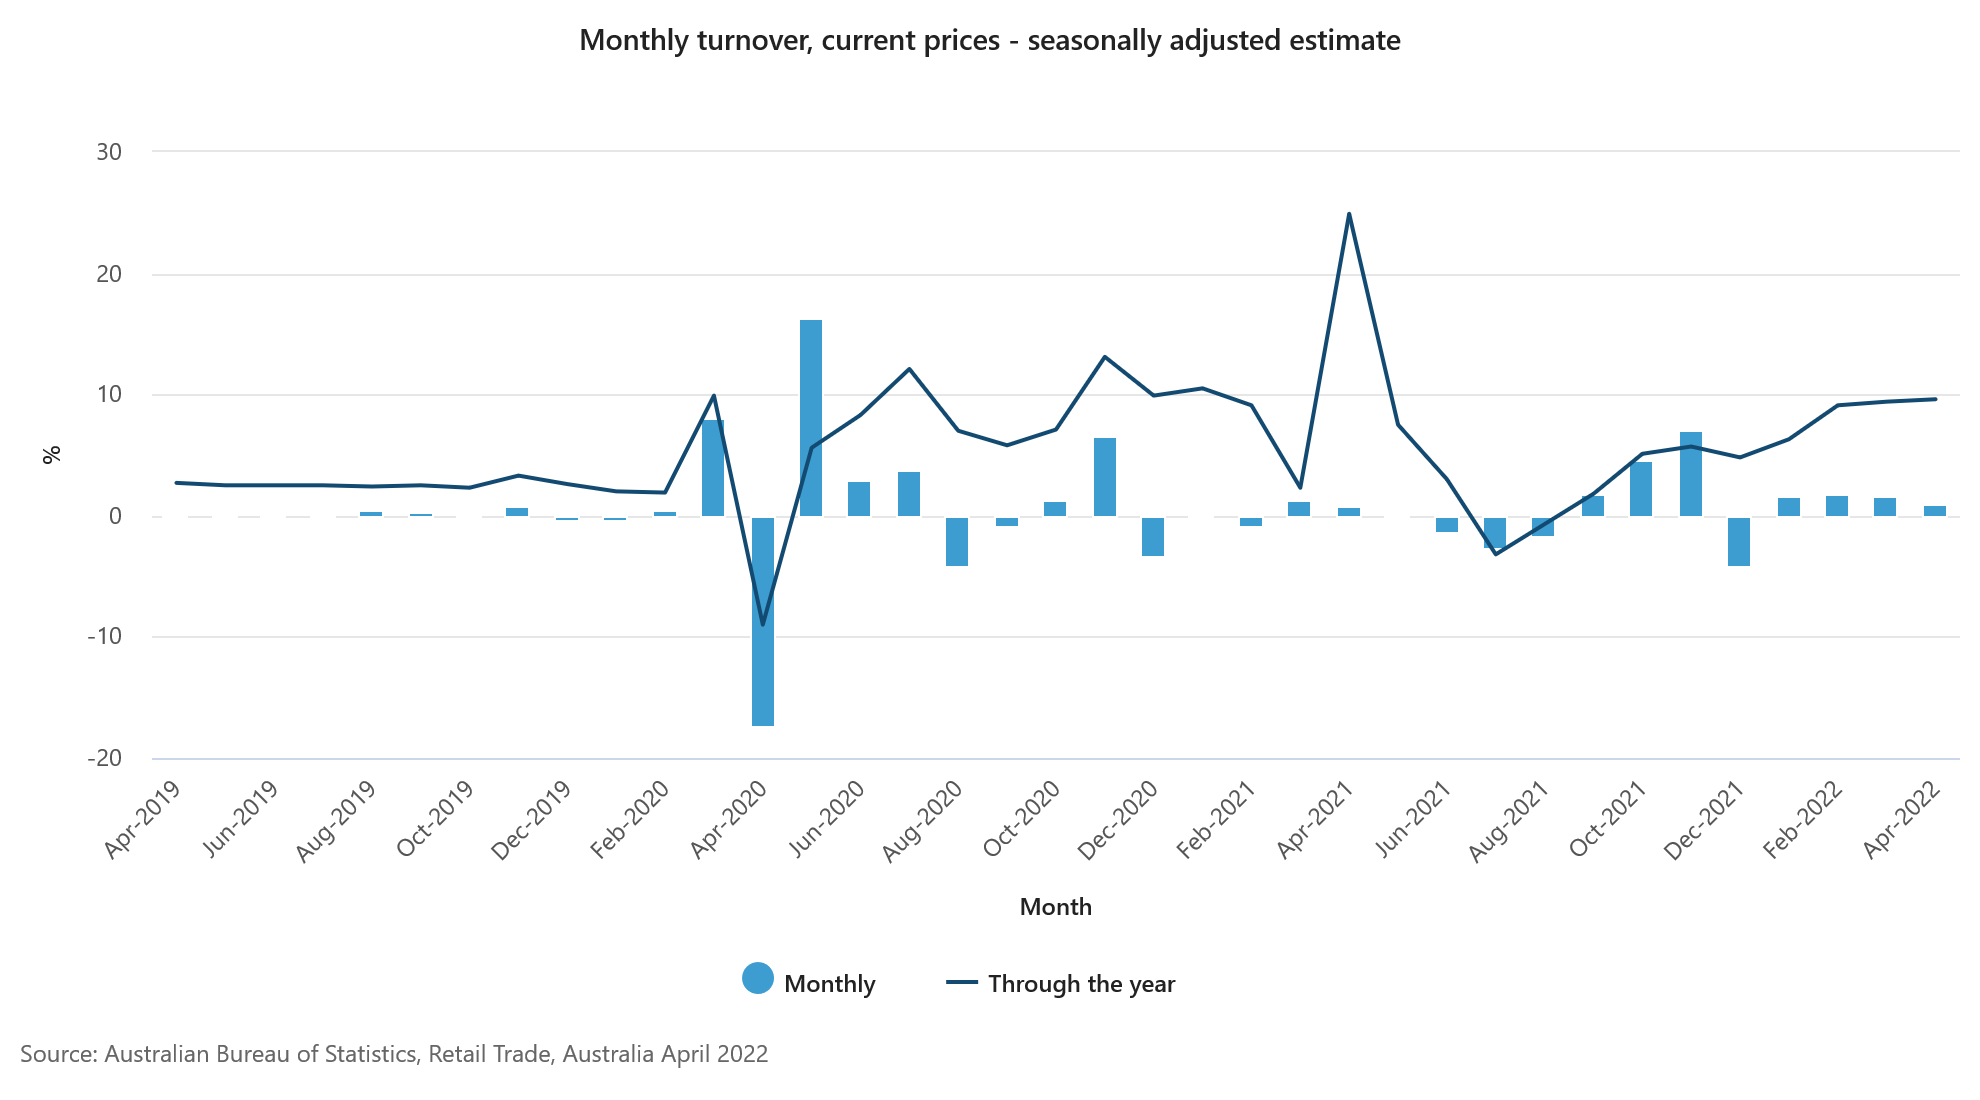
Australia retail sales rose 0.9% mom in Apr, driven by higher food prices
Australia retail sales rose 0.9% mom in April, slightly below expectation of 1.0% mom. For the 12-month period, sales rose 9.6% yoy.
New South Wales was the only state or territory to record a fall, down -0.3%. Queensland had the largest rise in retail turnover, up 1.6%. Turnover also rose in Victoria (1.1%), Western Australia (2.2 %), South Australia (1.4%), Tasmania (2.0%), the Australian Capital Territory (0.5%) and the Northern Territory (0.7%).
ABS said: "The strength in retail turnover is being driven by spending across the food industries. High food prices have combined with increased household spending over the April holiday period as more people are travelling, dining out and holding family gatherings.
Looking ahead
Eurozone M3 money supply is the only feature in European session. US will release personal income and spending with PCE inflation, goods trade balance.
GBP/USD Daily Outlook
Daily Pivots: (S1) 1.2567; (P) 1.2594; (R1) 1.2636; More..
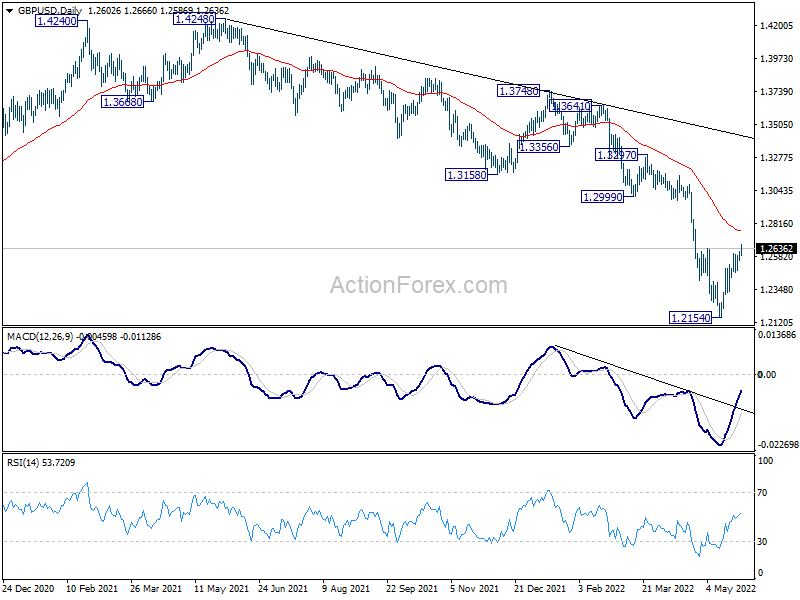
GBP/USD's rebound from 1.2154 extended with break of 1.2637 resistance. Intraday bias is now on the upside and further rally would be seen to 55 day EMA (now at 1.2756). Sustained break there will target 1.2999 support turned resistance next. On the downside, though, break of 1.2480 minor support will turn bias back to the downside for retesting 1.2154 low instead.
In the bigger picture, based on current momentum, fall from 1.4248 (2018 high) at least at the same degree as the rise from 1.1409 (2020 low). That is, fall from 1.4248 could be a leg inside the pattern from 1.1409, or resuming the longer term down trend. In either case, deeper decline is expected as long as 1.2999 support turned resistance holds. Next target is 1.1409 low.
Economic Indicators Update
| GMT | Ccy | Events | Actual | Forecast | Previous | Revised |
|---|---|---|---|---|---|---|
| 23:30 | JPY | Tokyo CPI Core Y/Y May | 1.90% | 2.00% | 1.90% | |
| 01:30 | AUD | Retail Sales M/M Apr | 0.90% | 1.00% | 1.60% | |
| 08:00 | EUR | Eurozone M3 Money Supply Y/Y Apr | 6.30% | 6.30% | ||
| 12:30 | USD | Personal Income M/M Apr | 0.60% | 0.50% | ||
| 12:30 | USD | Personal Spending Apr | 0.70% | 1.10% | ||
| 12:30 | USD | PCE Price Index M/M Apr | 0.80% | 0.90% | ||
| 12:30 | USD | PCE Price Index Y/Y Apr | 6.60% | 6.60% | ||
| 12:30 | USD | Core PCE Price Index M/M Apr | 0.40% | 0.30% | ||
| 12:30 | USD | Core PCE Price Index Y/Y Apr | 4.60% | 5.20% | ||
| 12:30 | USD | Goods Trade Balance (USD) Apr P | -114.8B | -127.1B | ||
| 12:30 | USD | Wholesale Inventories Apr P | 2.00% | 2.30% | ||
| 14:00 | USD | Michigan Consumer Sentiment Index May F | 59.1 | 59.1 |
Friendly Friday
Asian markets have begun the day in an altogether positive mode after Wall Street outperformed overnight. Driving the equity rally were good results from department store retailers, notably high-end ones. The only blotch was Gap, which fell down a Gap with its stock price punished accordingly. That allowed the perpetually circling and no desperate buy-the-dip mafia to load up on risk positioning again with the US Dollar also falling. It also allowed markets to ignore a downward revision of US Q1 GDP QoQ to -1.50%, Kansas Fed Manufacturing Index for May falling to 19, and Pending New Home Sales for April slumping deeper into negative territory at -9.1%. The latter is particularly ironic as recent soft housing data had been responsible for some previously ugly sessions on Wall Street recently. Still, why let the facts get in the way of the desperation to buy the dip.
Notable once again, are that US 10-year yields are once again retesting the four-decade downtrend line, which by my estimates comes in around 2.75%. Fears of gasoline and diesel shortages during the US driving season also pushed oil prices over 3.0% higher overnight. Some unofficial gossip ahead of next week's monthly OPEC+ JTC meeting suggests that the grouping will stick to its scheduled 432,000 bpd incremental increase. Brent crude could test the top of my $120.00 a barrel medium-term range next week. I can’t see US yields and oil moving higher being constructive for equities next week.
In data out of Asia today, Tokyo’s Core CPI in May remained at 1.90%, although with the Bank of Japan saying inflation is driven by external factors, and not the Japanese consumer, we shouldn’t expect any change in their ultra-low forever stance. Australian Preliminary Retail Sales eased, as expected, to 0.90% with no serious cost-of-living cracks appearing as yet in the Lucky Country. China’s Industrial Profits (YTD) YoY for April fell to 3.50% from 8.50% in March. The Shanghai shutdowns and covid-zero policies account for the slowdown, but market impact was minimal as the number was right on market expectations. China will have bigger fish to fry going forward as it tries to keep growth and the property market on track, while enacting sweeping lockdowns across parts of the country thanks to its covid-zero policy.
The rest of Asia’s calendar is light with Singapore PPI likely to be ignored after yesterday's firmer Industrial Production data eased slowdown fears. Europe’s calendar is similarly second tier. US Personal Income and Personal Spending for April, along with the PCE Price Index and Michigan Consumer Sentiment round out the week. Personal Income and Expenditure and the PCE Index could settle nerves on inflation and Fed tightening if they print on the low side, ditto for Michigan Consumer Sentiment. That would set Wall Street up for another positive season to round out the week and weigh on the US Dollar.
Apart from oil, most of this week has been one of frantic range trading, as the herd runs this way and that on swings in risk sentiment. Lots of noise, little substance, although reading the financial press swinging from doom to bloom day-to-day has been mentally tiring.
Next week sees the arrival of June and its “business time.” Asia sees the release of China and India PMIs and Australian GDP and Trade Balances. Europe has German, French and Eurozone Inflation, as well as the ongoing saga of an EU oil ban on Russia. Russia has kindly offered to allow exports of wheat from Ukraine and Russia, in return for sanctions relief.
I believe June will be a watershed month for Europe, the UK, and America as to the depth of their commitment to a war economy and Russia. Perversely, if they blink for short-term national gains, it would be quite a tailwind for global equities and bonds. The financial markets are a harsh mistress.
June also brings us a bevvy of US data and a Bank of Canada policy decision next week. US data releases include the house price index, JOLTS Job Openings and ADP Employment, and ISM Manufacturing before the one ring to rule them all, Friday’s Non-Farm Payrolls. Oddly enough, the most important event of them all is being largely ignored by markets to their peril.
In the Dark Tower of the Fed, they have $8.5 trillion of debt instruments they need to get rid of. Quantitative tightening starts next week, scaling up to $95 bio a month by September. I’d hate to see the mark-to-market P&L on that position, but I guess when you can print money, it doesn’t matter. It may well matter to markets though with the Fed also set to tighten by 0.50% per month over the coming months (including June). I am yet to be convinced that the Fed can pull this off without causing another taper tantrum or sending the US 10-years well North of 3.0%, or both. They, like everyone else, will be hoping inflation indicators flatten in the months ahead, to keep the bids out there in the bond market. All I’ll say is don’t mistake short-term noise in the equity market as a structural turn in direction higher.
Asian equities shrug off weaker China industrial profits
Wall Street staged a powerful rally overnight thanks to mostly impressive results from US retailers. The S&P 500 rallied by 1.99%, the Nasdaq leapt 2.68%, and the Dow Jones climbed by 1.62%. Although the rallies were impressive, the price action was very much in line with the schizophrenic behaviour of Wall Street these past few weeks, and I have no doubt that one piece of bad news will send the FOMO gnomes scurrying for the exit. In Asia, US futures have eased by around 0.15% as profit-taking from the overnight session makes its way through the market.
The impressive overnight rally has allowed Asian markets to ignore weakening China Industrial Profits this morning, and with a slow news day this far, Asia looks set to end the week on a positive note. Japan’s Nikkei 225 is 0.50% higher, with South Korea’s Kospi rallying by 0.90%. Taipei, meanwhile, has jumped by 1.65%, coat-tailing the Nasdaq.
Mainland China equities are also higher, the Shanghai Composite rising by 0.50%, with the CSI 300 gaining 0.62%. Meanwhile, the market always looking for a reason to buy, Hong Kong, has leapt 2.93% higher. Singapore has risen by 0.45% today, with Kuala Lumpur underperforming, losing 0.10%. Jakarta has posted a 1.50% gain, Bangkok is up by 0.80%, and Manila is 0.70% higher. Australian markets are also enjoying a friendly Friday, the ASX 200 and All Ordinaries climbing by 1.0%.
Except for UK markets, which posted only modest gains after the energy company windfall tax announcements, Europe performed well yesterday. Asia’s strong session should give Europe another positive start today, although, weekend risk will likely cap any rallies. US markets are a coin-toss these days and if PCE data is on the high side tonight, so will Fed tightening sentiment be. That could easily reverse yesterday's outperformance.
Improved risk sentiment sends US Dollar lower
The choppy range trading of the past few session continued overnight as the US Dollar swung on day-to-day moves in risk sentiment. A powerful session by Wall Street, along with almost unchanged closes in US bond markets saw improved risk sentiment send the greenback lower overnight. The dollar index fell 0.31% to 101.76 overnight. Strangely for Asia of late, the directional move has continued today, pushing the index down 0.24% to test support at 101.50. Failure of 101.50 opens a potential test of major support at 101.00. Resistance is distant at 102.50.
Not unexpectedly, EUR/USD was a major beneficiary as risk sentiment swung higher. The single currency rose 0.47% to 1.0730 and this morning has pushed through resistance at 1.0750, rising 0.25% to 1.0755. That brings the multi-decade trendline resistance, today at 1.0830, back into view. I would require a weekly close above 1.0830 to waver in my negative outlook and I remain convinced we are just one negative Russia energy headline away from the whole rally evaporating. Support remains at 1.0650.
GBP/USD added just 0.20% to 1.2610 overnight, gains tempered by the Government’s energy company windfall tax and energy subsidy announcements. Today, Sterling has outperformed, rising 0.35% to 1.2655, taking out resistance at 1.2640. It has resistance at 1.2700 now, with support at 1.2600 and 1.2470.
USD/JPY eased slightly overnight, losing another 0.20% to 126.85 on US Dollar weakness this morning. The cross remains at the mercy of move in US bond yields, and with those being benign this week, USD/JPY has continued to grind out long positioning. The chart suggests USD/JPY has further downside potential that could target 125.00. Only a move through trendline resistance at 127.80 changes the picture.
AUD/USD and NZD/USD moved sideways overnight but have posted decent gains in Asia as risk sentiment finishes Asia’s week on a high note. AUD/USD has 0.62% to 0.7140 and is eyeing resistance at 0.7150. It could potentially extend gins above 0.7200, while support is at 0.7050. NZD/USD had risen by 0.65% to 0.6520 today, taking out 0.6500 and leaving its next target as 0.6570. Support is at 0.6450.
Asian FX is moving higher today but is not reflecting the US Dollar weakness seen versus the G-10. USD/CNY, USD/CNH, USD/SGD, USD/INR, and USD/THB have fallen around 0.15% today, with the region’s ugly ducklings of late, KRW, IDR and MYR all rising by around 0.40%. That suggests that the positioning we are seeing today is being driven by fast-money flows. Unfortunately, fast-money leaves as fast as it arrives and thus, I am taking today’s gains with a grain of salt.
Oil rallies sharply
Oil prices rallied sharply overnight as markets continued to fret over tight US galena and diesel supplies ahead of the summer driving season. News that President Biden is investigating restarting mothballed US refineries had zero impact on markets. That is not surprising as refineries, like aircraft parked in the desert, don’t have a simple on/off switch. News is also emerging that suggests OPEC+ will only raise production next week by the previously agreed 432,000 bpd, providing another supportive factor in a tight market. The street may also be pricing in peak virus in China with Shanghai’s port back to 95% of normal operations.
Brent crude jumped 2.55% to $117.30 a barrel overnight, adding just 0.20% to $117.50 in quiet Asian trading. WTI leapt by 3.11% to $114.10 a barrel, where it remains in Asia today. The firm price action this week leaves both contracts poised to potentially test the upper end of my medium-term ranges, at $120.00 and $115.00 respectively, today, or early next week. That will be a severe test of resolve around Russian sanctions as rather surprisingly, it has resulted in no material movement on easing restrictions on Iran and Venezuela, which would go a long way to changing the global supply picture. WTI’s relative outperformance is due to US gasoline and diesel supplies. The US though doesn’t have an oil problem, it has a pipeline and refining bottleneck problem.
Brent crude should find some resistance at $118.00 initially. After that, the chart shows nothing until $124.00 a barrel. Support is at $114.00 and $112.00 a barrel. The 2022 support line lies at $104.00, and only a weekly close below that signals the end of the bull market. WTI still has resistance at $115.50 and $116.60, but after that, that chart is empty until the $128.00 region, the top of the Ukraine/Russia spike. Support is at $110.35 and then $108.00 a barrel. Its long-term, 2022 support line lies at $101.50.
Gold trades sideways
Gold seems determined to bore traders to death after another inconclusive overnight range-trading session. It finished 0.13% lower at $1851.00 an ounce. In Asia, some pre-weekend risk hedging has lifted it slightly higher to $1854.00 an ounce. Most concerning about the overnight price action by gold, was that despite a broadly weaker US Dollar seen elsewhere, and the rally in risk asset positioning overnight, gold actually finished the session lower. Its inability to rally on US Dollar weakness is an ominous sign and risks are increasing for a serious downside washout of long positions.
Gold has nearby support at $1840.00, followed by $1836.00 an ounce. Failure sees the possibility of a mini-capitulation by longs that could reach as far as $1780.00 an ounce. Gold has resistance at $1860.00, $1870.00, and $1886.00 an ounce, its 100-day moving average.
Australia retail sales rose 0.9% mom in Apr, driven by higher food prices
Australia retail sales rose 0.9% mom in April, slightly below expectation of 1.0% mom. For the 12-month period, sales rose 9.6% yoy.
New South Wales was the only state or territory to record a fall, down -0.3%. Queensland had the largest rise in retail turnover, up 1.6%. Turnover also rose in Victoria (1.1%), Western Australia (2.2 %), South Australia (1.4%), Tasmania (2.0%), the Australian Capital Territory (0.5%) and the Northern Territory (0.7%).
ABS said: "The strength in retail turnover is being driven by spending across the food industries. High food prices have combined with increased household spending over the April holiday period as more people are travelling, dining out and holding family gatherings.
BoJ Kuroda: Prices won’t rise sustainably without wage hikes
BoJ Governor Haruhiko Kuroda told the parliament today that core inflation (all items excluding fresh food) is "likely to remain around 2% for about 12 months", unless energy prices drop sharply.
However, he emphasized that "prices won't rise sustainably, stably unless accompanied by wage hikes." That's seen as in indication that recent rise in inflation is not enough to lead to exit of the ultra-loose monetary policy.
Also from Japan, Tokyo CPI core was unchanged at 1.9% yoy in May, below expectation of 2.0% yoy.
Technical Outlook and Review
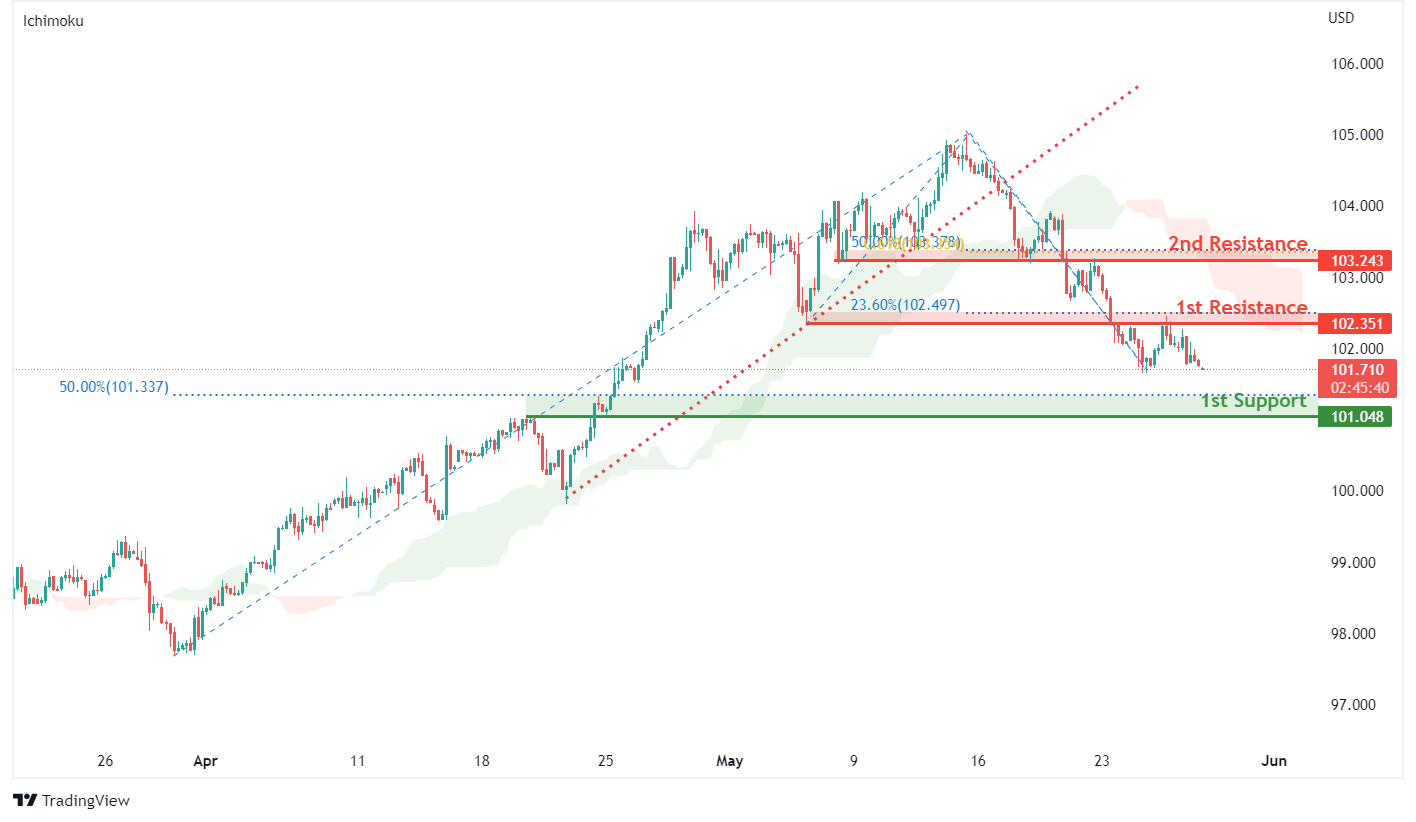
DXY:
On the H4, with prices moving below the ichimoku indicator and breakout from the ascending trendline, we have a bearish bias that price will drop to our 1st support at 101.048 where the horizontal pullback support and 50% Fibonacci retracement are from our 1st resistance at 102.351 in line with the horizontal overlap resistance and 23.6% fibonacci retracement. Alternatively, price may break 1st resistance structure and head for 2nd resistance at 103.243 where the horizontal overlap resistance, 61.8% fibonacci projection and 50% fibonacci retracement are.
Areas of consideration:
- H4 time frame, 1st resistance at 102.351
- H4 time frame, 1st support at 101.048
XAU/USD (GOLD):
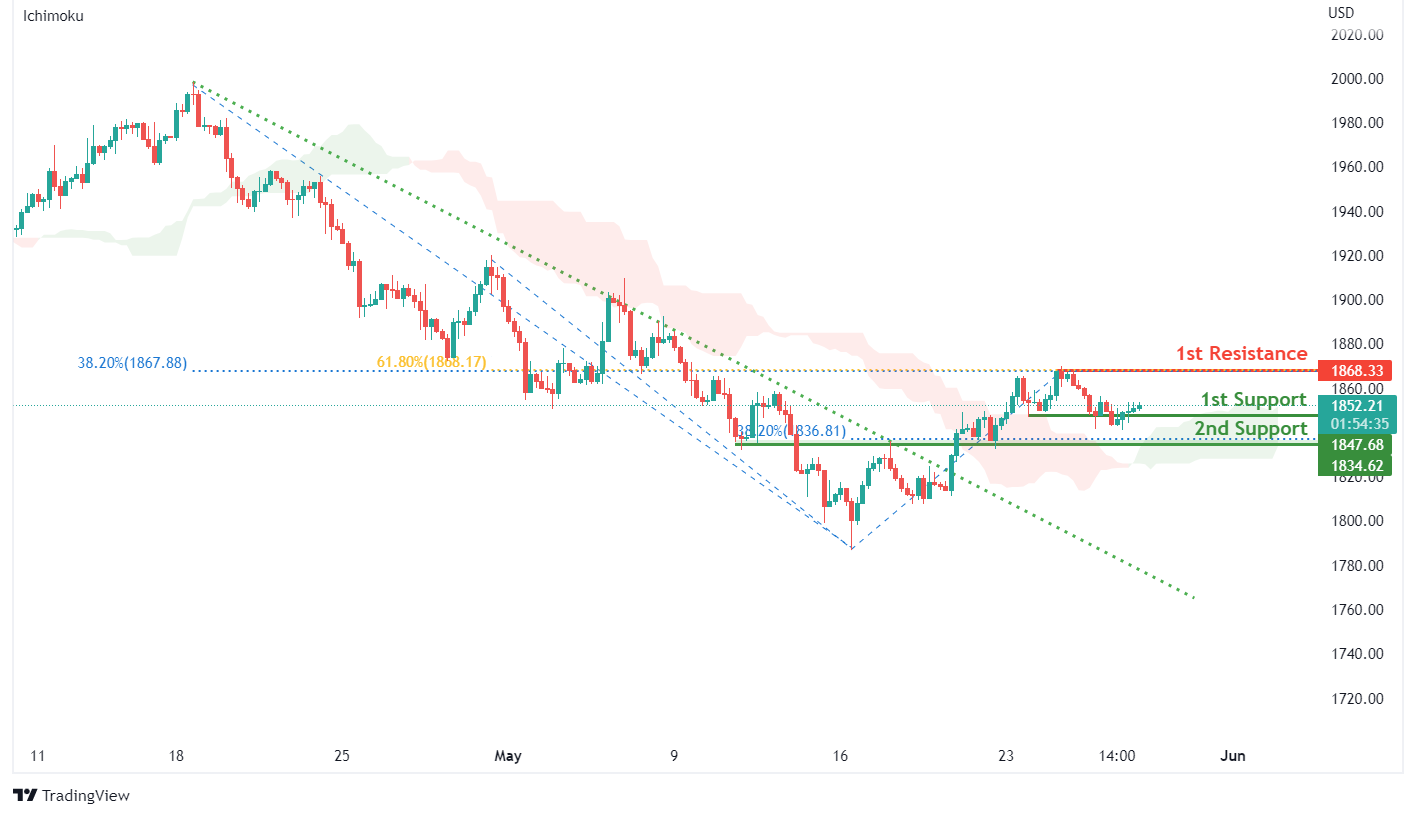
On the H4, with prices moving above the ichimoku cloud and breakout from descending trendline, we have a bullish bias that price will rise from our 1st support at 1847.68 where the horizontal overlap support is to our 1st resistance at 1868.33 in line with the horizontal swing high resistance,61.8% Fibonacci retracement and 38.2% Fibonacci retracement. Alternatively, price may break 1st support structure and head for 2nd support at 1834.62 where the horizontal overlap support and 38.2% fibonacci retracement are.
Areas of consideration:
- H4 time frame, 1st Resistance at 1868.33
- H4 time frame, 1st Support at 1847.68
GBP/USD:
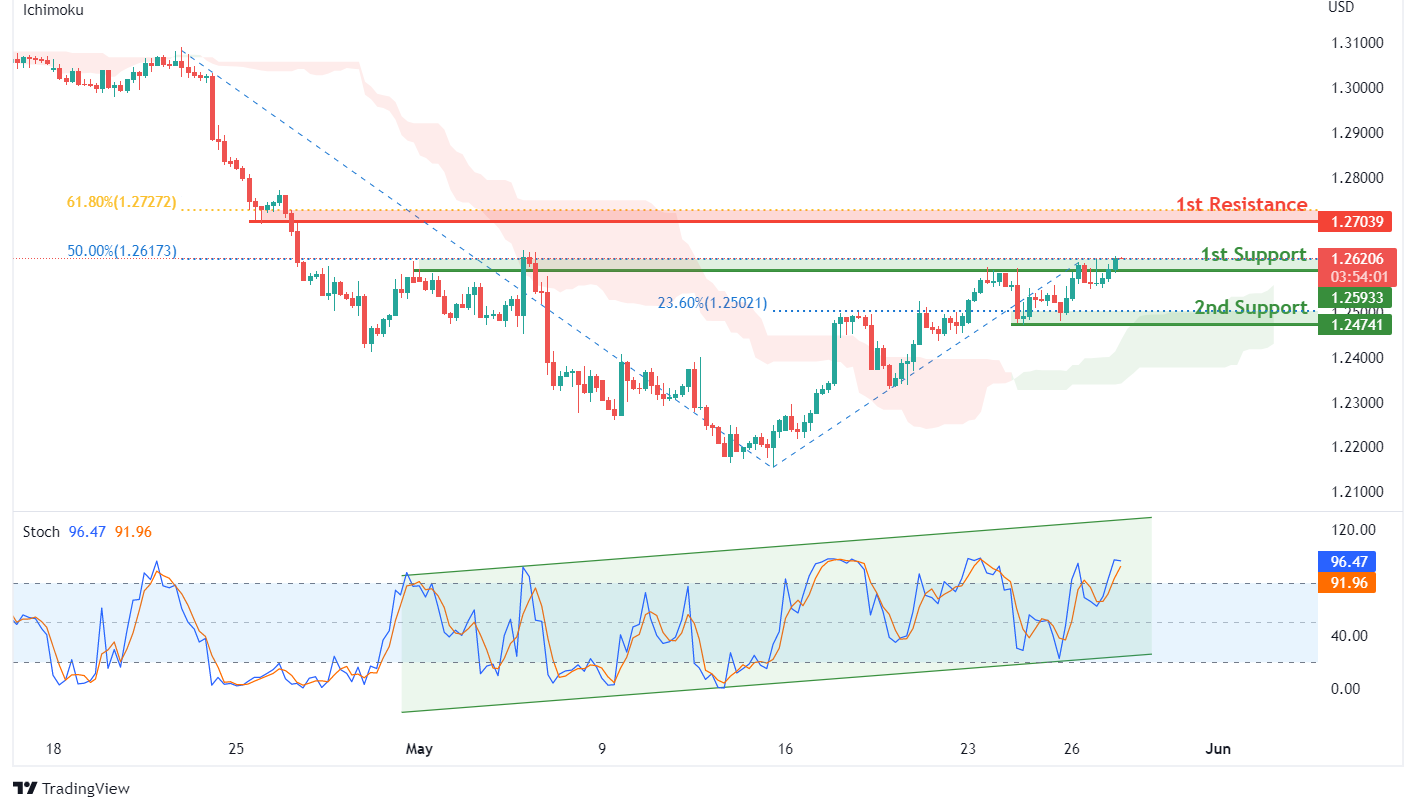
On the H4, with price moving above the ichimoku indicator and the stochastic indicator moving in an uptrend channel, we have a bullish bias that price will rise from our 1st support at 1.25933 where the horizontal overlap support and 50% fibonacci retracement to our 1st resistance at 1.27039 in line with the 61.8% Fibonacci retracement and pullback resistance. Alternatively, price may break 1st support structure and head for 2nd support at 1.24741 where the horizontal swing low support and 23.6% Fibonacci retracement are.
Areas of consideration:
- H4 1st resistance at 1.27039
- H4 1st support at 1.25933
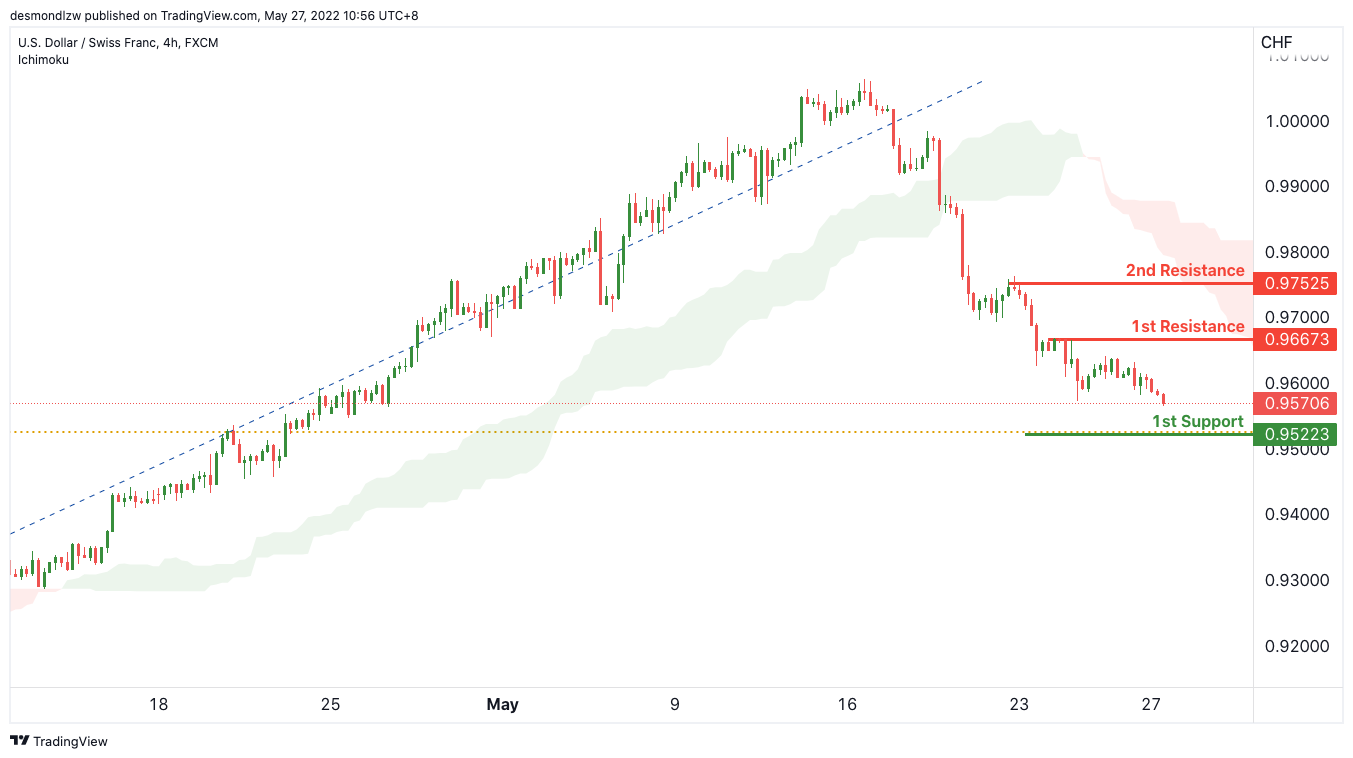
USD/CHF:
On the H4, with price moving below the ichimoku cloud, we have a bearish bias that price will drop to our 1st support at 0.95223 where the 61.8% Fibonacci retracement is from our 1st resistance at 0.96673 in line with the pullback resistance. Alternatively, price may break 1st resistance structure and head for 2nd resistance at 0.97525 where the swing high resistance is.
Areas of consideration
- 1st support level at 0.95223
- 1st resistance level at 0.96673
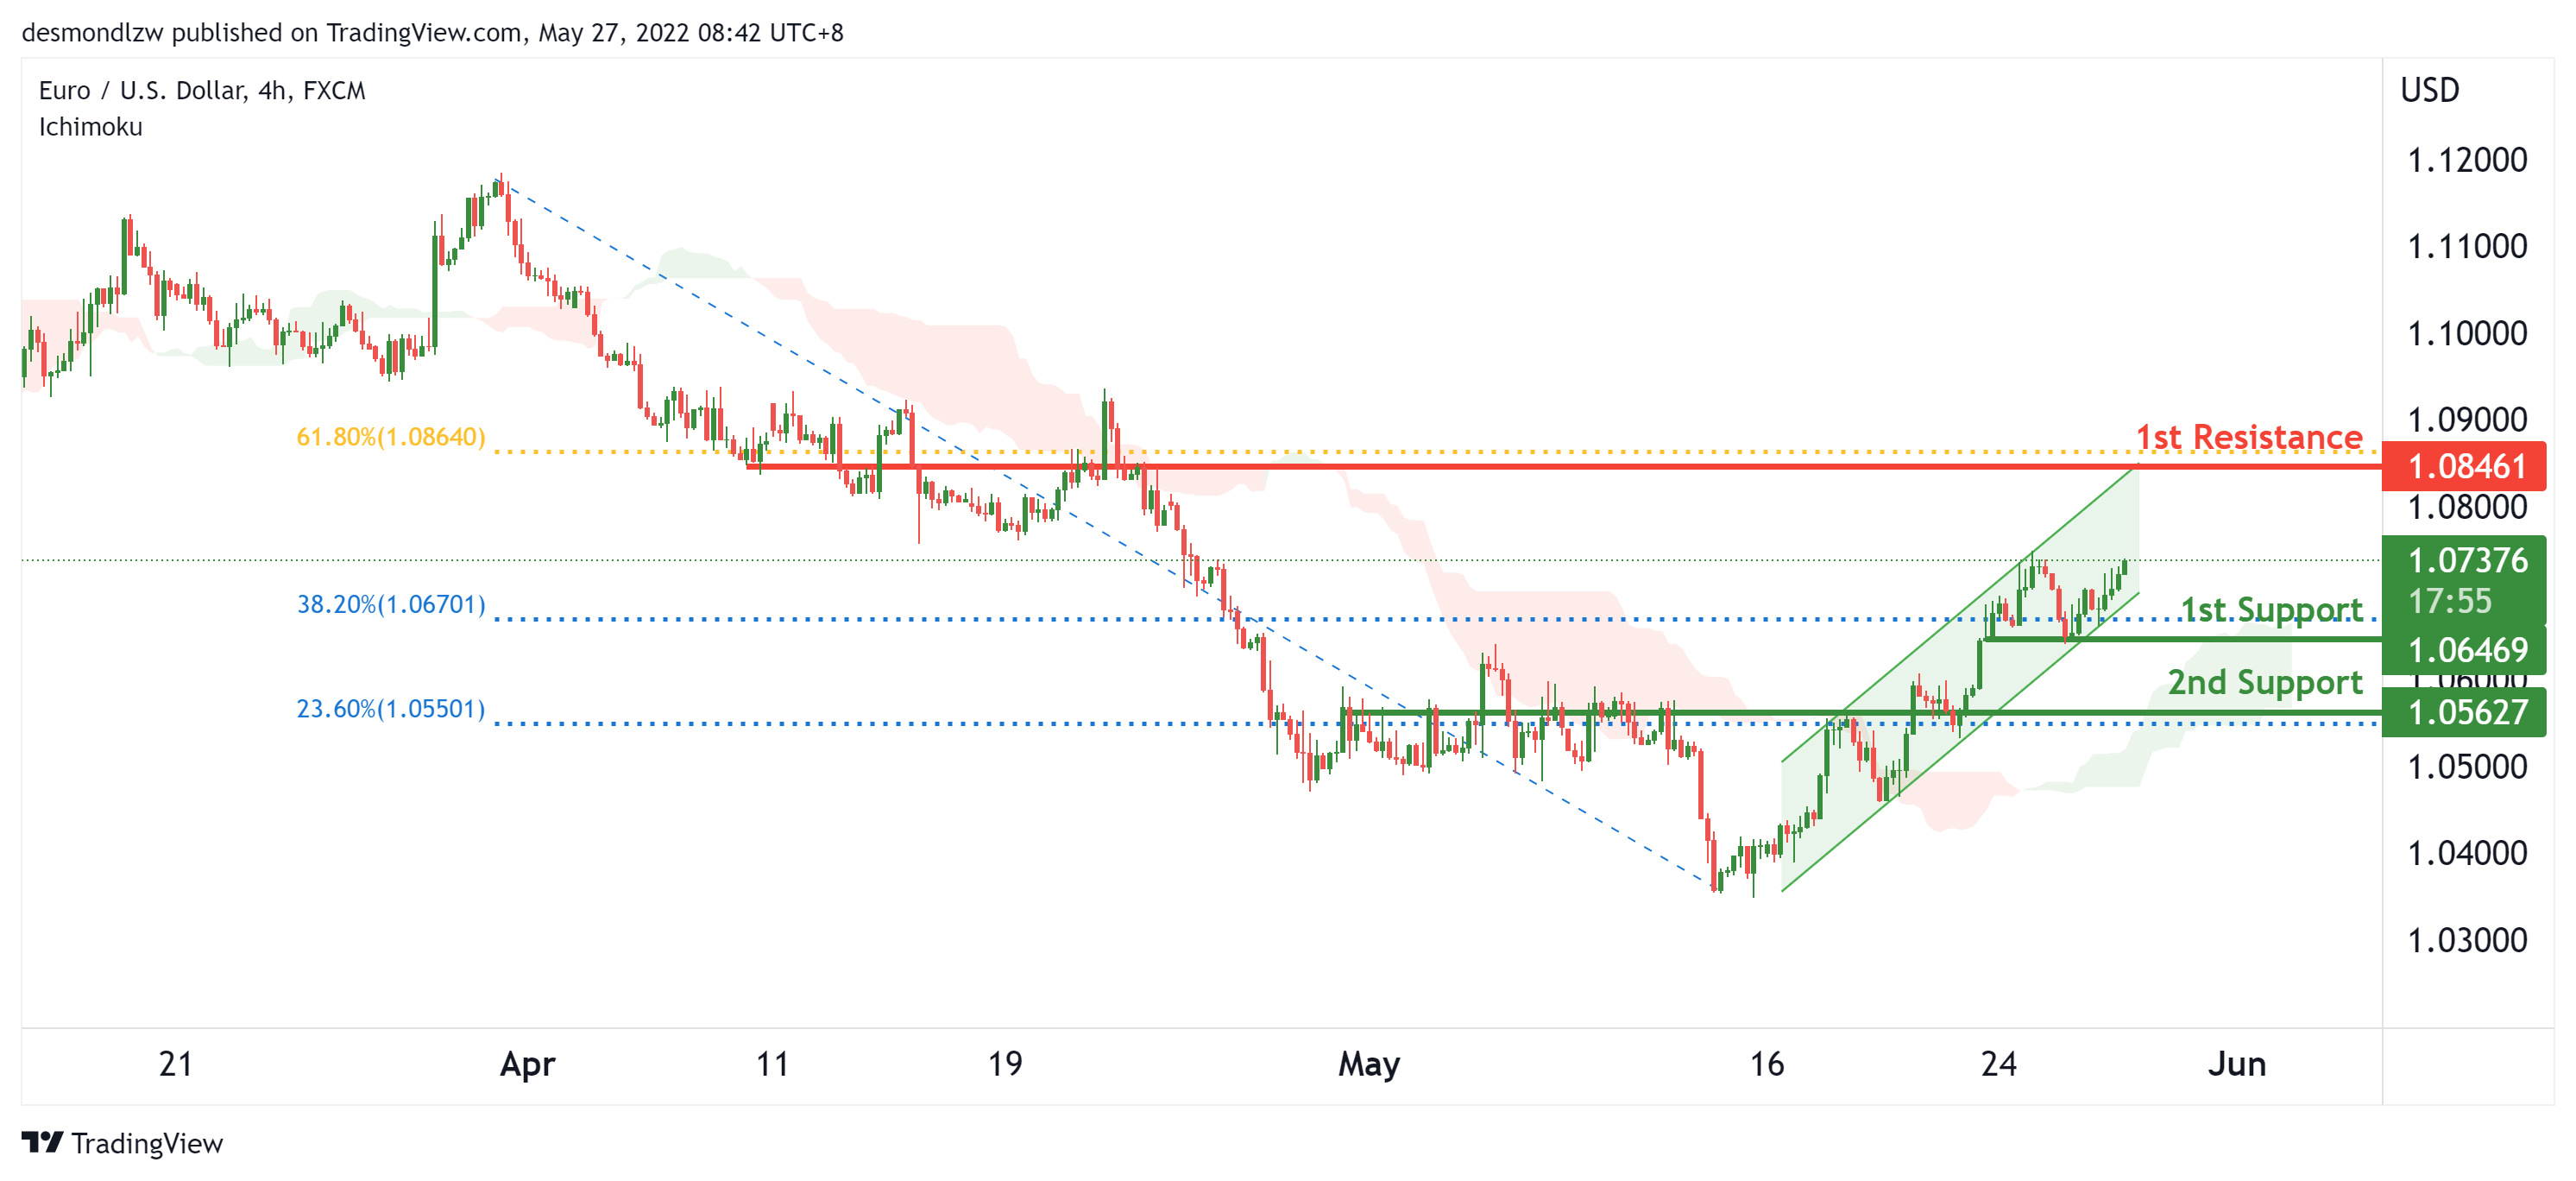
EUR/USD :
On the H4, with price moving above the ichimoku cloud, we have a bullish bias that price will rise to our 1st overlap resistance at 1.08461 where the 61.8% Fibonacci retracement is from our 1st support at 1.06469 in line with the 38.2% Fibonacci retracement and pullback support. Alternatively, price may break 1st support structure and head for 2nd support at 1.05627 where the horizontal overlap resistance is.
Areas of consideration :
- H4 1st resistance at 1.08461
- H4 1st support at 1.06469
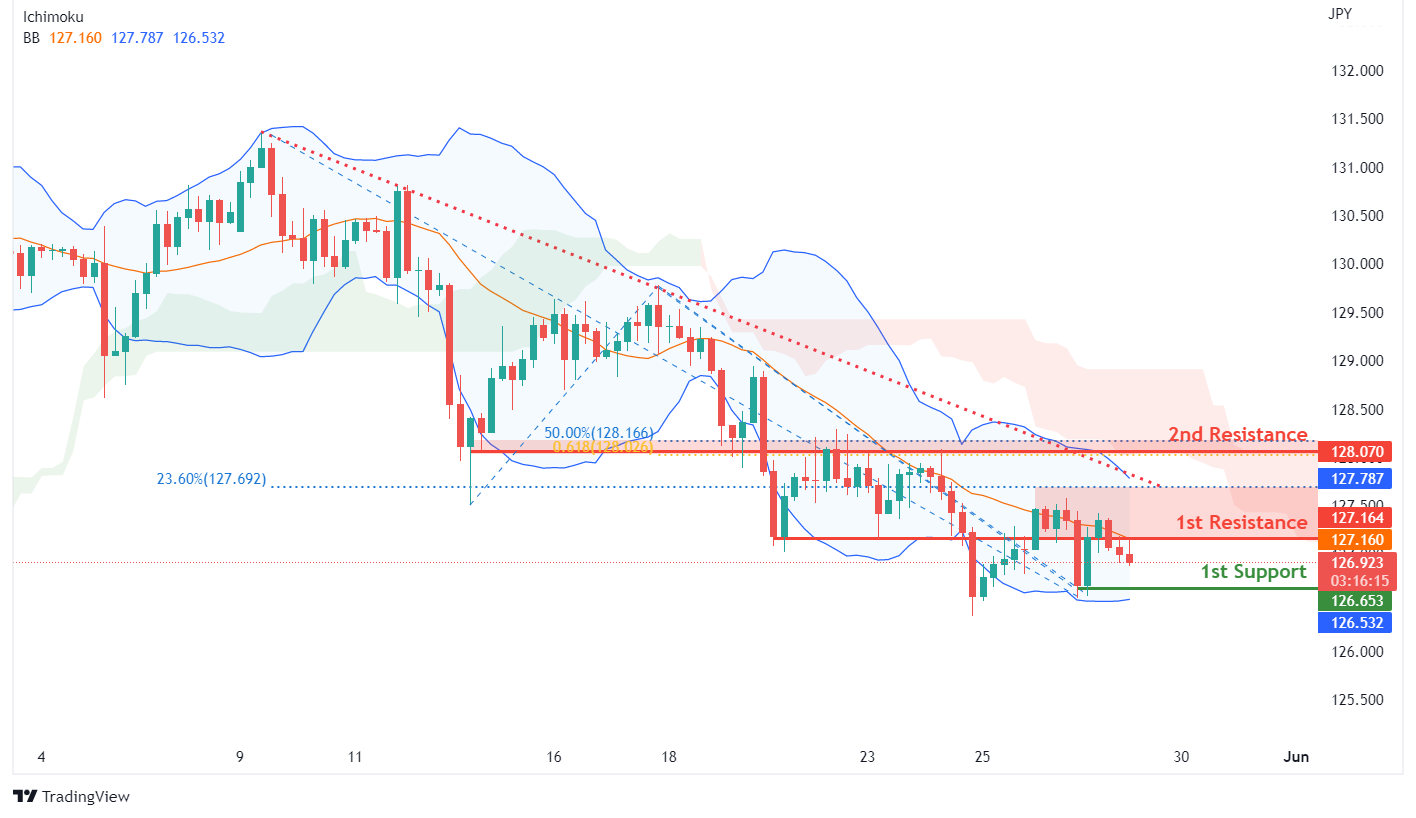
USD/JPY:
On the H4, with prices moving below the ichimoku indicator and passing the basis line of the bollinger band in a downtrend, we have a bearish bias that price will drop from our 1st resistance at 127.164 where the horizontal overlap resistance and 23.6% fibonacci retracement are to our 1st support at 126.653 in line with the swing low support. Alternatively, price may break 1st resistance structure and head for 2nd resistance at 128.070 where the horizontal overlap resistance, 61.8% fibonacci projection and 50% Fibonacci retracement are.
Areas of consideration:
- H4 time frame, 1st resistance at 127.469
- H4 time frame, 1st support at 126.653
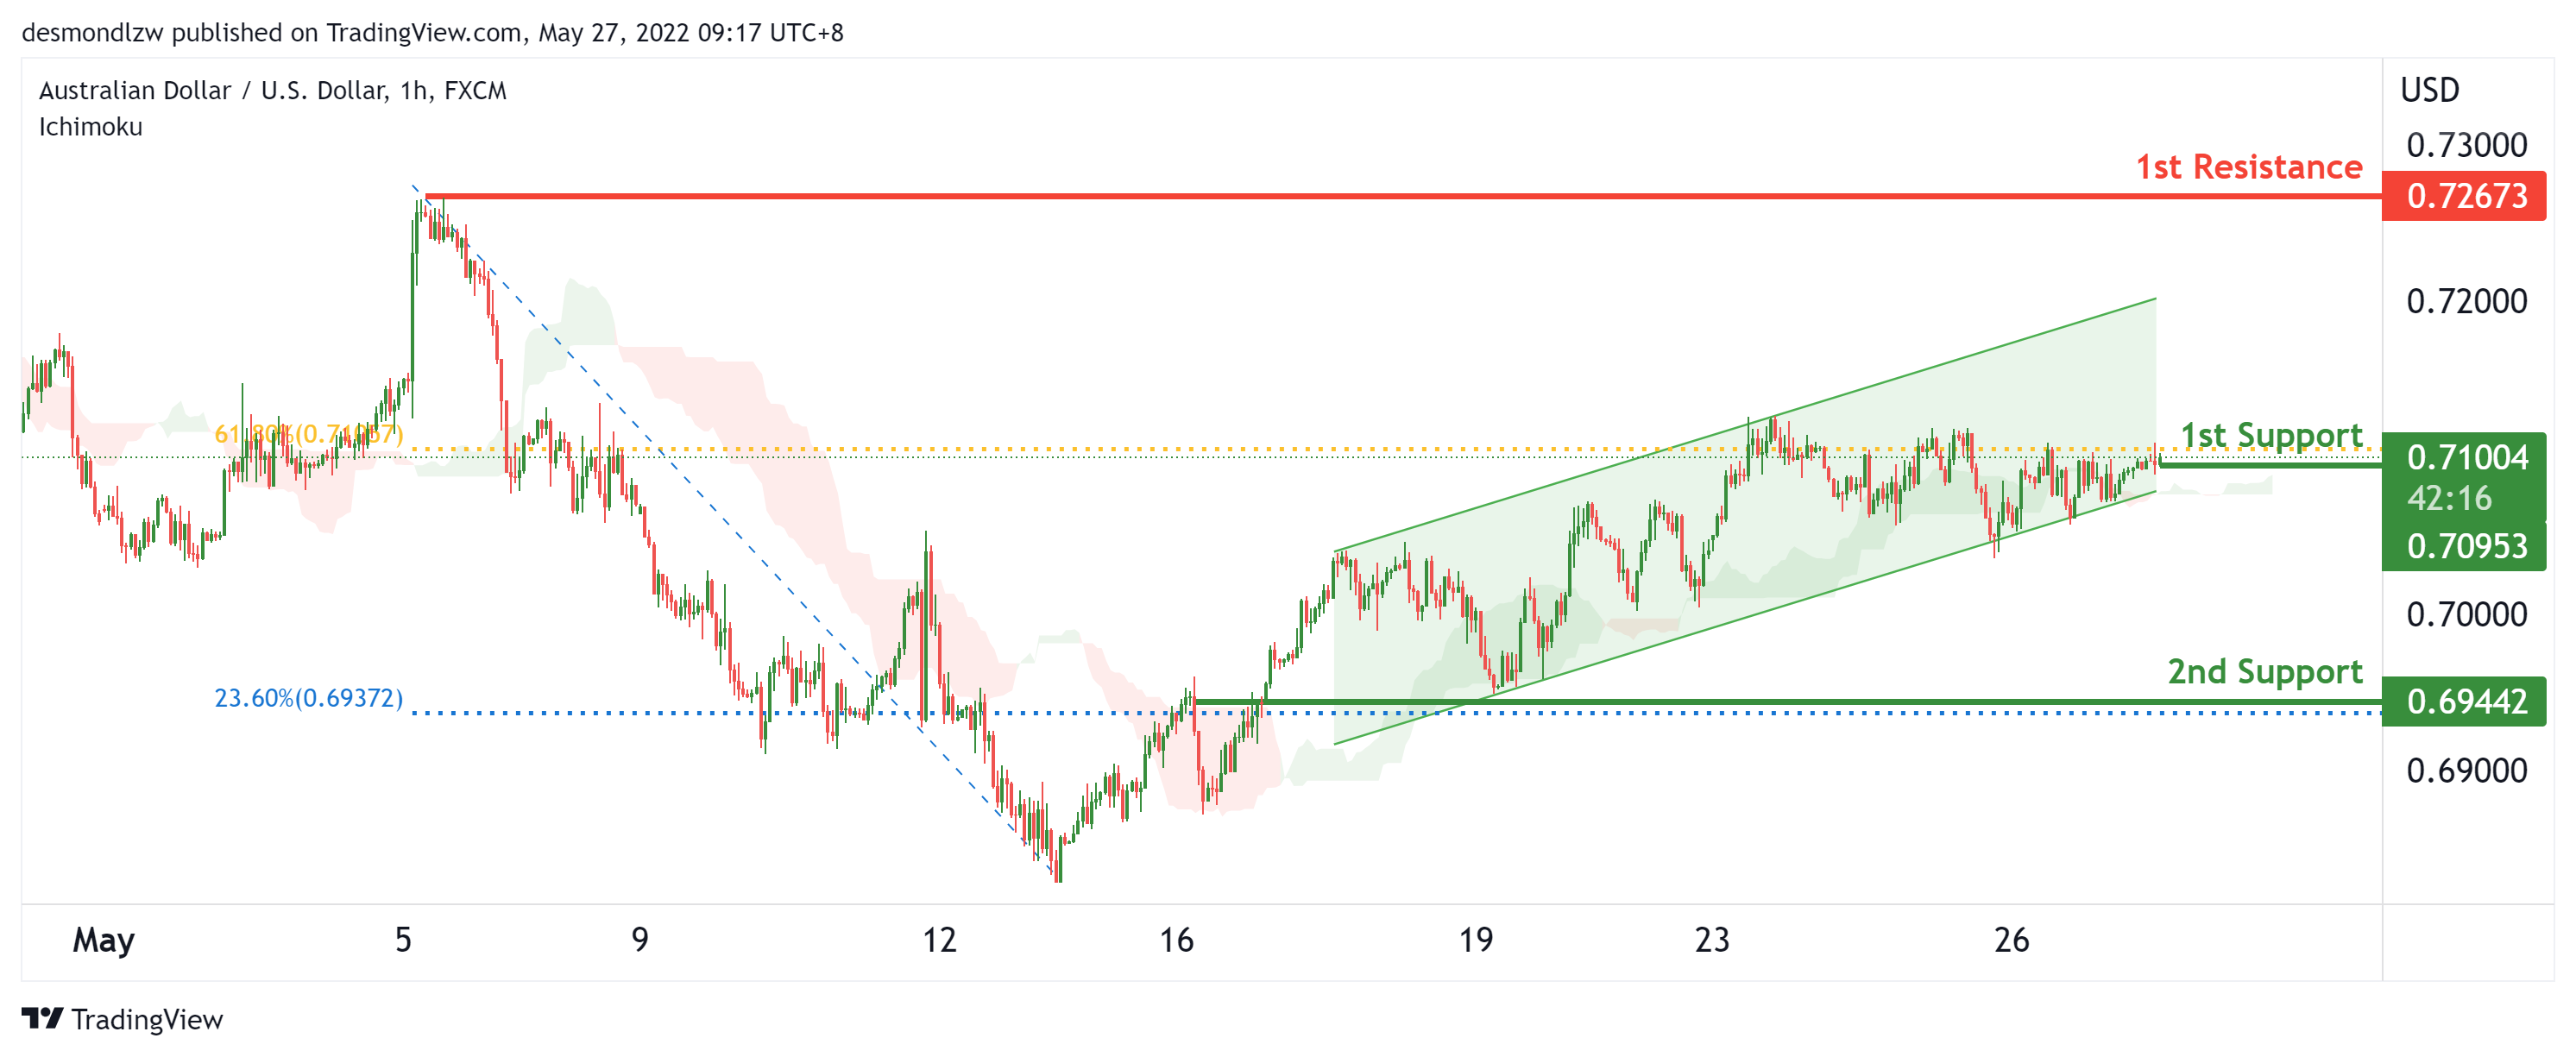
AUD/USD:
On the H1, with price moving above the ichimoku cloud and price moving within the ascending trend channel, we have a bullish bias that price will rise to our 1st resistance at 0.72673 where the swing high is from our 1st support at 0.71004 in line with the 61.8% Fibonacci retracement. Alternatively, price may break support structure and head for 2nd support at 0.69442 where the horizontal pullback support and 23.6% Fibonacci retracement is.
Areas of consideration
- H1 1st resistance at 0.72673
- H1 1st support at 0.71004
NZD/USD:
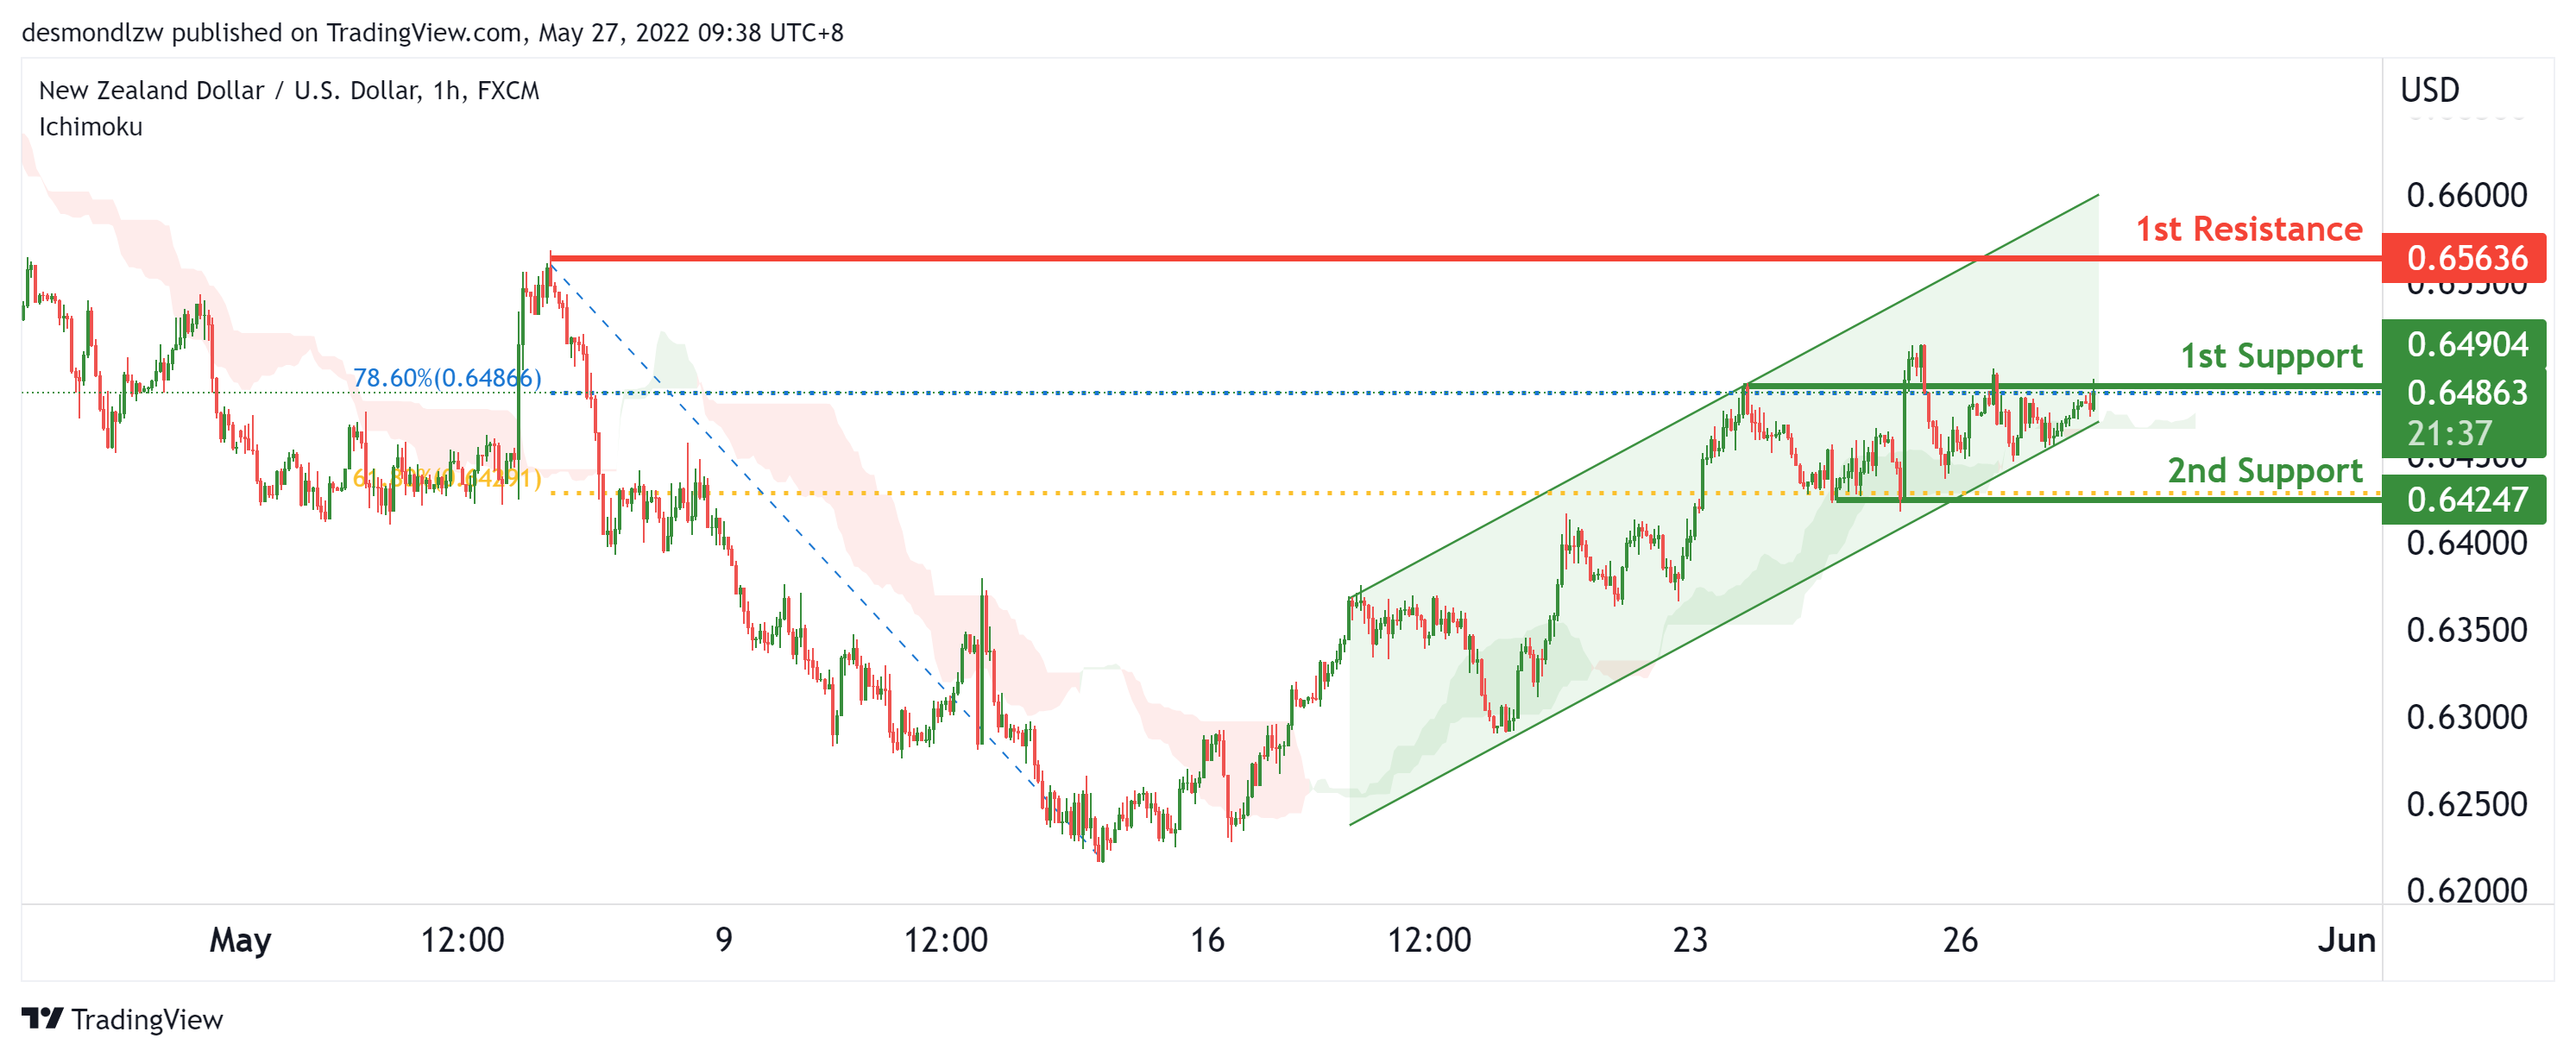
On the H1, with price moving above the ichimoku cloud, we have a bullish bias that price will rise to our 1st resistance at 0.65636 where the swing high resistance is from our 1st support at 0.64904 in line with the overlap support and 78.6% Fibonacci retracement. Alternatively, price may reverse from the support and head for 2nd support at 0.64247 in line with the 61.8% Fibonacci retracement.
Areas of consideration:
- H4 time frame, 1st support at 0.64904
- H4 time frame, 1st resistance at 0.65636
USD/CAD:
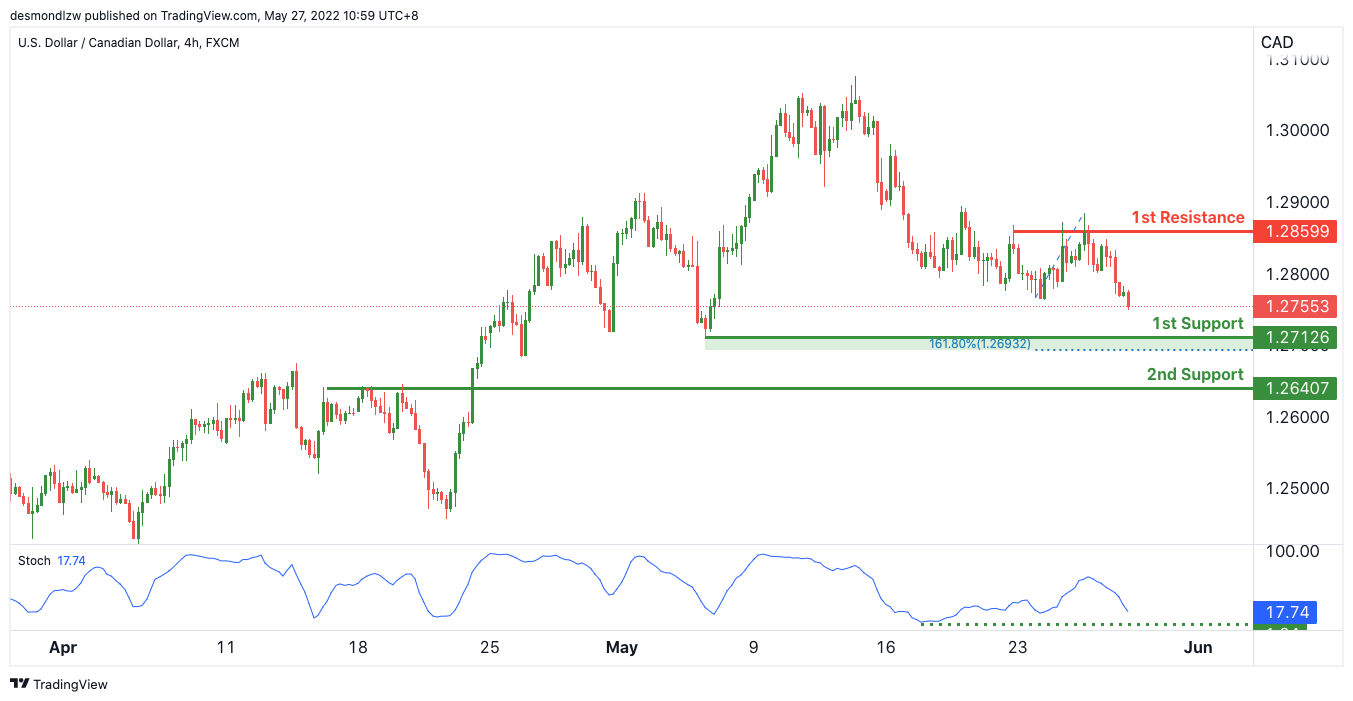
On the H4, with price expected to bounce off the stochastics, we have a bullish bias that price will rise to our 1st resistance at 1.28599 where the horizontal swing high resistance from our 1st support at 1.27126 in line with the swing low support.
Areas of consideration:
- H4 time frame, 1st resistance at 1.28559
- H4 time frame, 1st support at 1.27126
OIL:
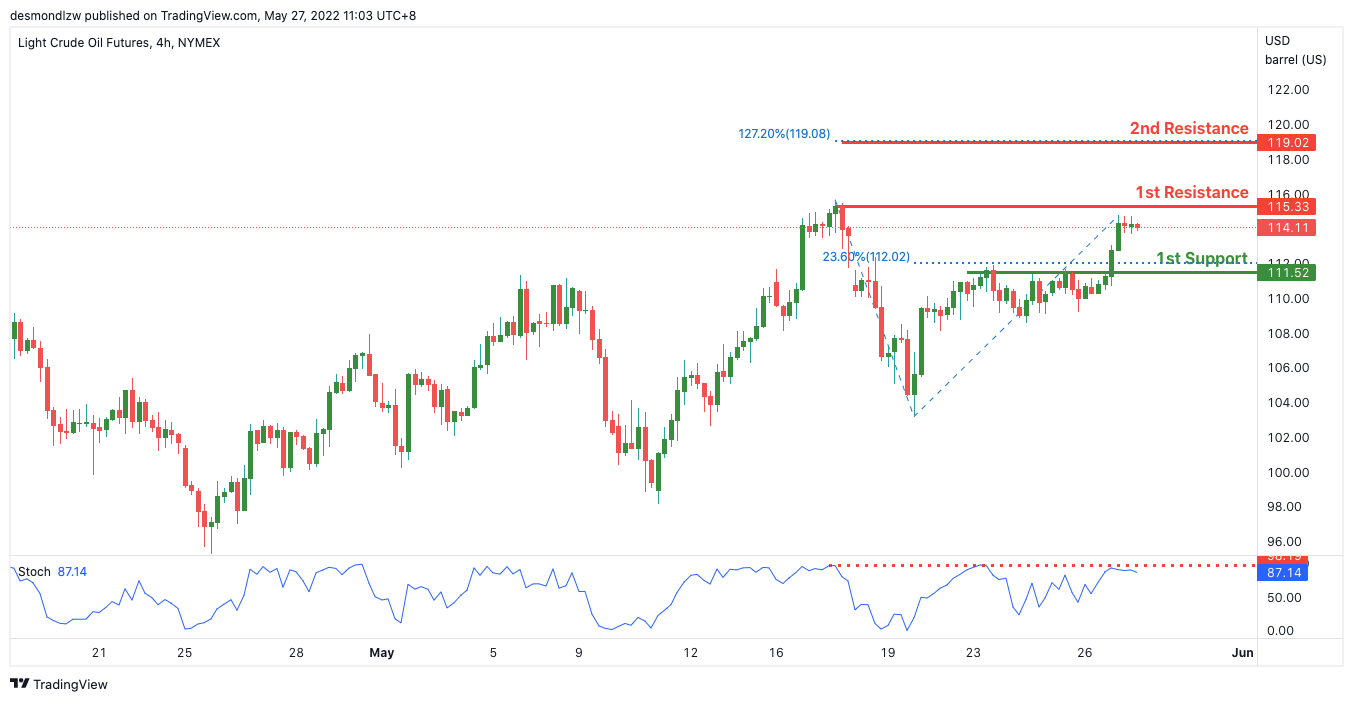
On the H4, with price expected to reverse off the stochastics indicator, we have a bearish bias that price will drop to our 1st support at 111.52 where the 23.6% Fibonacci retracement is from our 1st resistance at 111.53 in line with the swing high resistance. Alternatively, price may break 1st resistance structure and head for 2nd resistance at 109.02 where the 127.2% Fibonacci extension is.
Areas of consideration:
- H4 time frame, 1st resistance of 111.53
- H4 time frame, 1st support of 111.52
Dow Jones Industrial Average:
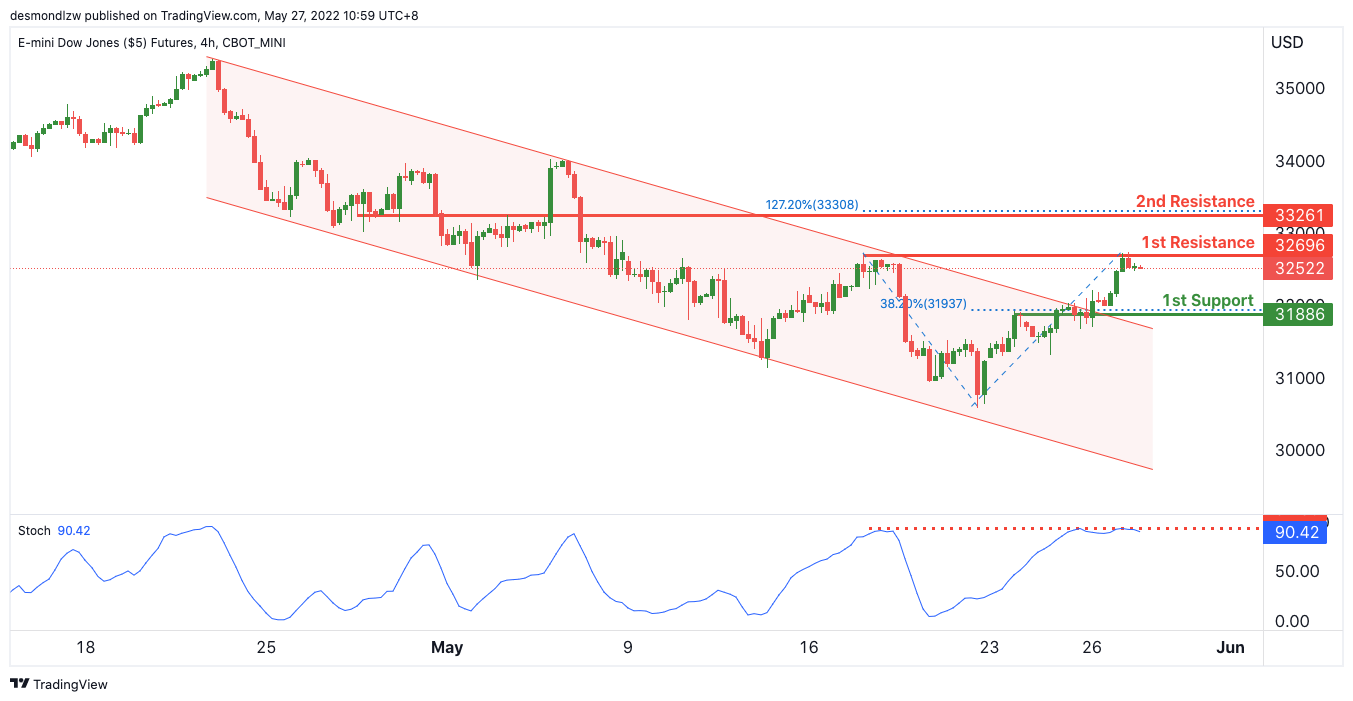
On the H4, with price expected to reverse off the stochastics indicator, we have a bearish bias that price will drop to our 1st support at 31886 where the 38.2% Fibonacci retracement is from our 1st resistance at 32696 in line with the swing high resistance. Alternatively, price may break 1st resistance structure and head for 2nd resistance where the 127.2% Fibonacci extension is.
Areas of consideration :
- H4 time frame, 1st resistance at 32696
- H4 time frame, 1st support at 31886
Cliff Notes: In Pursuit of Capacity
Key insights from the week that was.
The first of the two key releases received this week for Australia was the Q1 construction work done survey. Activity in the sector disappointed expectations in Q1, with a fall of 0.9% reported against expectations of a modest gain circa 0.5-1.0%. Disruptions related to the omicron wave of COVID-19 and poor weather, particularly in Queensland and New South Wales, are believed to be behind the miss. Note however that the Q4 2021 outcome was revised up as part of the Q1 release, from -0.4% to +0.6%; also, Victorian construction showed strength in Q1, +2.6%, the state economy rebounding strongly following last year’s delta wave.
Looking ahead, there is a sizeable pipeline of work to be completed across the economy. However, additional disruptions may delay progress. The most notable risks are the difficulties associated with sourcing necessary construction inputs and Australia’s very tight labour market. Highlighting the effect of both, construction costs rose by 2.4% in Q1 and 7.6% over the 12 months to March, the strongest gains since 2008.
Equipment investment, as estimated by the CAPEX survey, also disappointed in Q1, albeit less so than construction, with a 1.2% gain recorded (WBC forecast +2.0%). Total CAPEX (includes buildings and structures as well) fell 0.3% in Q1 across both mining and non-mining. For non-mining, the equipment spend was essentially unchanged in the 3 months to March, while buildings and structures construction was down 0.6%. Mining meanwhile saw a strong 7.7% gain for equipment, offset by a 3.3% fall in buildings and structures work.
Despite intense uncertainty over the global economic outlook, CAPEX plans for FY2021/22 were broadly unchanged in Estimate 6, implying a 14% lift in investment from FY2020/21. Pleasingly, FY2022/23 plans were revised up in Estimate 2 to now suggest investment will lift 10% in that year. However, note that these are nominal figures and so include cost increases. Over the year to March 2022, CAPEX investment costs were reported to have risen 6.6%.
Having assessed these two surveys, we have confirmed our forecast for Q1 GDP of 0.2%/2.5%yr for next Wednesday’s release. A full preview will be made available in our Weekly on Westpac IQ today. But, in short, strong support from household spending is expected to be largely offset by a sizeable subtraction from net exports. We perceive there to be downside risks to this view given the weakness seen in hours worked in the quarter.
Turning to New Zealand, the RBNZ delivered to Westpac’s and the market’s expectations at their May meeting, voting in favour of a 50bp hike in the cash rate to 2.00%. Our New Zealand economics team continue to expect another two 50bp increases in July and August, then two 25bp increases in October and November to a peak cash rate of 3.50%. The RBNZ meanwhile project a higher top of 4.00% in 2023. In short, as per the Westpac MPS Review, the RBNZ are worried high inflation will become embedded in expectations and actions, and so are looking to take on a contractionary policy stance until demand is more in line with available supply/ capacity. For full detail on the expectations of Westpac NZ economics and the RBNZ, see Westpac’s Bulletin.
Data for the US this week has been limited and secondary in significance. However, the May FOMC meeting minutes are worthy of note. On display in the discussions of FOMC members was clear belief in the strength of the US, the economy seen as “very strong” and the labour market “extremely tight”. Unsurprisingly, inflation was characterised as “very high” and the primary source of risk for the outlook.
Still, in their discussions regarding policy, the Committee referred to the importance of an expeditious move to ‘only’ a “more neutral monetary policy stance”, with an outright restrictive stance requiring an unfavourable evolution of the outlook/ risks. These comments speak to a belief that supply-driven inflation will pass if given time and assuming demand and expectations are well managed. Indeed, “many participants” subsequently noted that the current “removal of policy accommodation would leave the Committee well positioned later this year to assess the effects of policy firming and the extent to which economic developments warranted policy adjustments” – i.e. by the end of the year, the FOMC may have scope to, at least, pause rate hikes.
Westpac remains of the view that the peak fed funds rate will be seen at year end at 2.625%, below the market’s 2023 peak expectation. The above views fit with this expectation and highlight clearly that gauging policy tightening in the US is not so much about the timing of each fed funds rate hike, but rather the cumulative impact on term interest rates. Notably, the 2,5 and 10-year Treasury yields, which act as base rates for private borrowing rates across the economy, are all currently in the top half of the FOMC’s neutral range of 2.0-3.0%, flagged after the May meeting. This highlights the extent to which policy has already tightened, well ahead of peak fed funds.
Finally on China, Premier Li Keqiang made clear this week both the need to and intent to stimulate the economy with no delay. This week 33 new easing measures were announced across the economy to aid households, reduce business costs and encourage hiring. This follows last week’s decision to cut the 5-year loan prime rate, a benchmark for mortgage rates. Clearly, with the COVID-19 situation in Shanghai improving and steady in Beijing, there is a need to accelerate growth and make up for lost time. Such concerted action can still see authorities achieve their 5.5% annual growth target, assuming further lockdowns are not seen and global developments also do not reduce support for China’s economy. Sentiment amongst households will take considerable time to repair and rebound and so, for the time being, momentum will continue to be driven by the public sector and, to a lesser extent, private business investment.
Eco Data 5/27/22
[php_everywhere instance="1"]
NZD/USD: Sending Mixed Signals
NZD/USD has formed what may be construed as bearish flag formation. But after Wednesday’s more hawkish than expected RNBNZ, traders should be prepared for a reversal as much as they are primed for any continuation in the recent downtrend. Also, keep in mind that the Kiwi has found support from the recent paring back in Fed interest rate hike expectations, which may not prove temporary.
Wednesday’s high of 0.65144, was in striking distance of the prior 5 May swing high of 0.65686. Should the latter be breached, that could act as a signal to buyers that the downward trend in NZD/USD may about to be reversed. Likewise, price breezed past the 50% and 61.8% Fibonacci retracement level between the prior swing high and the 12 May swing low of 0.62166. In other words, there is enough reason for bears to be cautious at current levels.
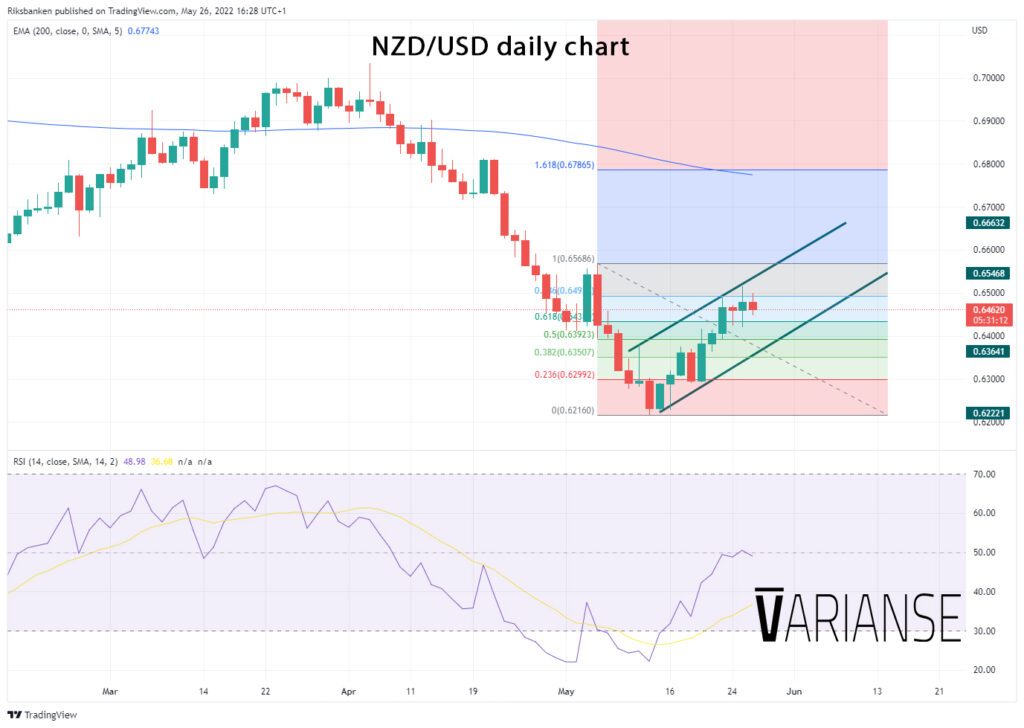
That said, with price well below its 200-day exponential moving average and given the prevailing uncertainly in financial markets more broadly, bulls may be less apt to push the currency pair higher. Similarly, single Japanese candlesticks in recent days haven’t told much of a story in terms of momentum in either direction. A daily RSI sitting near the 50 mark provide and equally ambiguous signal.
For traders with strong bearish convictions about NZD/USD at these levels, the conservative approach may be to wait for a breach of the lower diagonal support of the flag formation and subsequent successful retest before deciding on sizing and entry of positions. The Kiwi’s sensitivity to global growth and risk appetite, two prevailing market themes at the moment, leave the Kiwi prone to high volatility.
AUD Drifting Ahead of Retail Sales
The Australian dollar started the week with gains of close to one percent, but has been mostly drifting since then. AUD/USD is trading quietly, just below the 0.71 line.
It hasn’t been a very good week on the Australian release front, raising concerns that the economy may be slowing down. Manufacturing and Services PMIs both slowed in May, while Construction Work Done and Private New Capital Expenditure both recorded declines in the first quarter. The week winds up with April Retail Sales on Friday, which is projected to slow to 0.9%, after a 1.6% in March. Australia releases GDP next week, and an underperforming release would likely dampen sentiment towards the Australian dollar.
The new Labour government is rolling up its sleeves after its election victory and getting to work. Both Labour and the defeated Liberal party made campaign promises to review RBA operations, including how it targets inflation. The new Treasurer, Jim Chalmers, says he will announce his findings shortly. Chalmers said on Wednesday that he had inherited “very tricky” economic conditions, including rising inflation and interest rates, and a massive trillion-dollar debt.
FOMC signals more 50-bps hikes
The FOMC minutes didn’t contain any surprises, which actually soothed nervous markets. Investors have become increasingly concerned that the US economy might tip into recession. Recent data, such as housing, has been weak, while at the same time that the Federal Reserve has embarked on an aggressive rate-hike cycle aimed at slowing the economy and containing inflation.
With inflation still not showing signs of peaking, there have been calls from some Fed officials to deliver a super-super-size 75 bps hike. To the relief of the markets, the minutes appeared to put to rest such a drastic move, as the Fed signalled that it will hike by 50 bps in June and July, followed by a pause in September. This would allow the Fed to monitor the effects of the June and July hikes on the economy and on inflation levels.
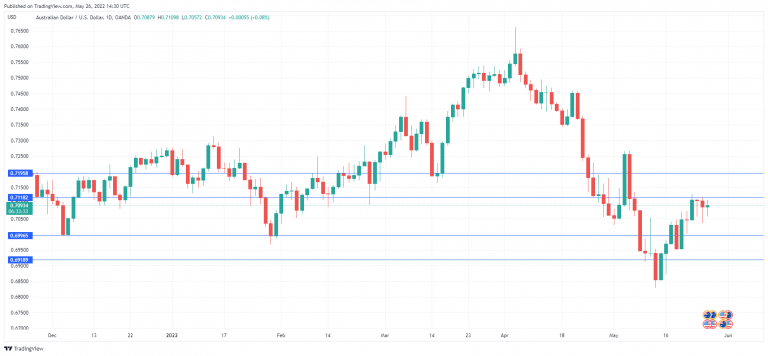
AUD/USD Technical
- 0.7118 is a weak resistance line. Above, there is resistance at 0.7196
- There is support at 0.6996 and 0.6918