Sample Category Title
GBP/JPY Daily Outlook
Daily Pivots: (S1) 158.92; (P) 159.61; (R1) 160.82; More...
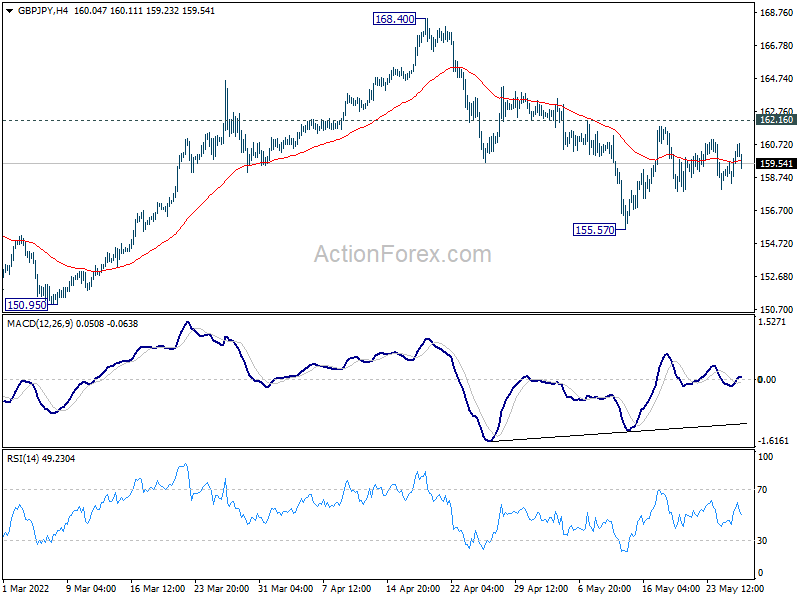
Intraday bias in GBP/JPY remains neutral at this point. On the downside, break of 155.57 will extend the correction towards 150.96 key structural support. Nevertheless, on the upside, firm break of 162.16 will indicate that the correction has completed, and bring retest of 168.40 high next.
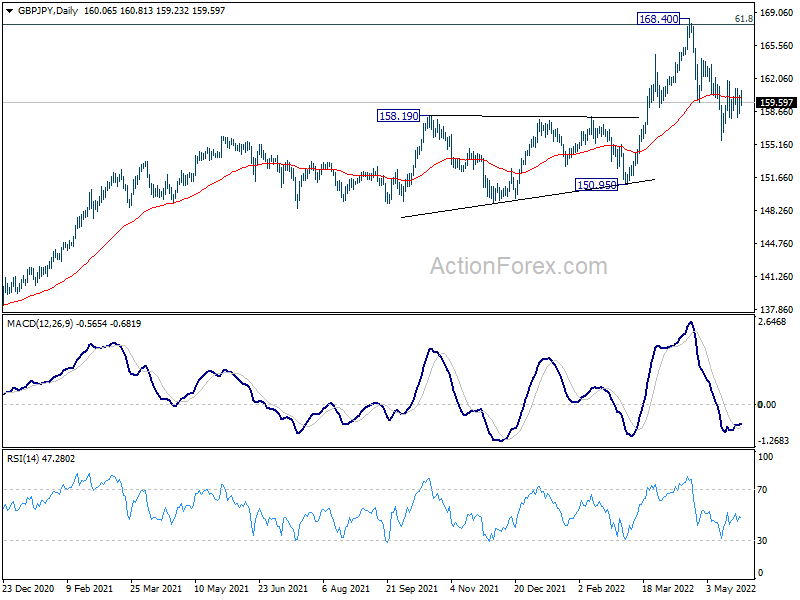
In the bigger picture, up trend from 123.94 (2020 low) is still in progress. Sustained break of 61.8% retracement of 195.86 (2015 high) to 122.75 (2016 low) at 167.93 will be a long term bullish signal, and could pave the way back to 195.86 high. This will now remain the favored case as long as 150.95 support holds, even in case of deep pull back. However, firm break of 150.95 will indicate rejection by 167.93, and bearish trend reversal.
EUR/JPY Daily Outlook
Daily Pivots: (S1) 135.20; (P) 135.72; (R1) 136.45; More....
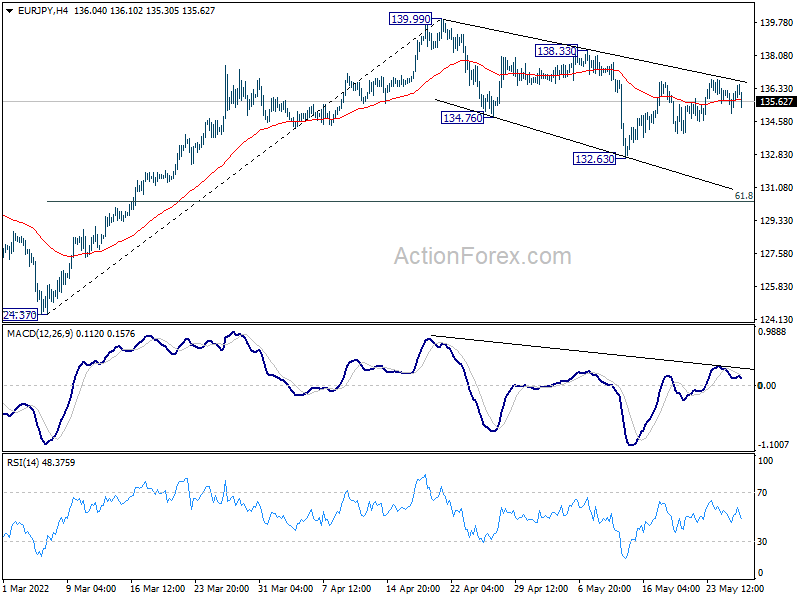
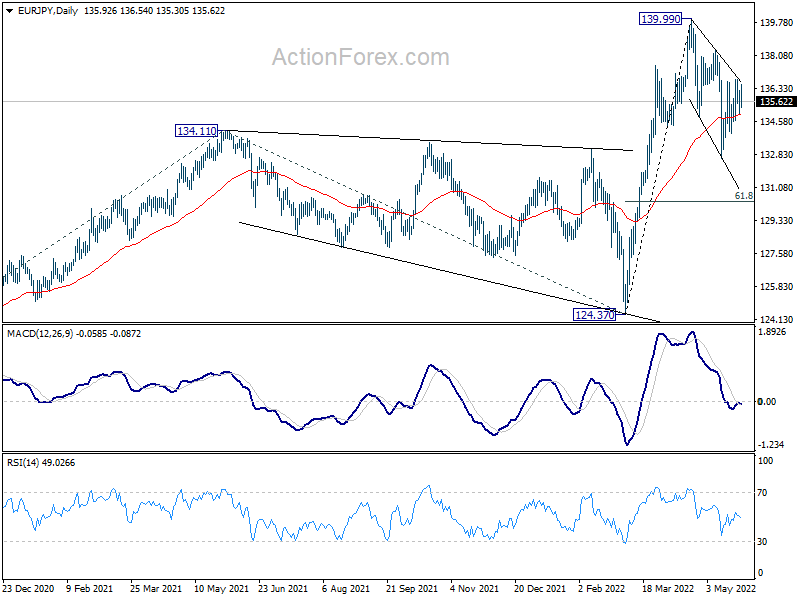
Intraday bias in EUR/JPY remains neutral and corrective pattern from 139.99 could still extend lower. On the downside, break of 132.63 will resume the fall and target 61.8% retracement of 124.37 to 139.99 at 130.33. On the upside, break of 138.33 will indicate that the correction has completed, and bring retest of 139.99 high next.
In the bigger picture, up trend from 114.42 (2020 low) is in progress. Such rise is seen as the third leg of the pattern from 109.30 (2016 low). Next target will be 100% projection of 114.42 to 134.11 from 124.37 at 144.06. In any case, outlook will now remain bullish as long as 124.37 support holds, in case of deep pull back.
EUR/AUD Daily Outlook
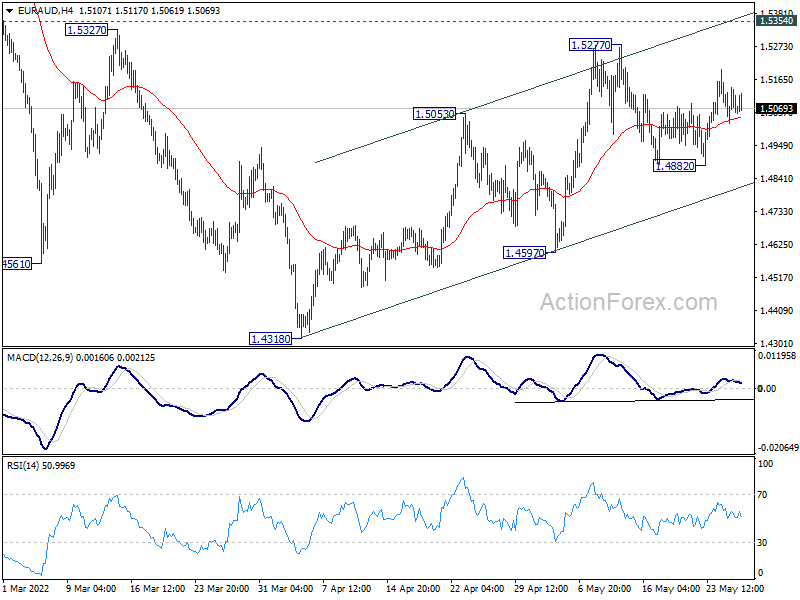
Daily Pivots: (S1) 1.5015; (P) 1.5078; (R1) 1.5133; More...
Intraday bias in EUR/AUD stays neutral at this point. On the downside, break of 1.4882 support will reaffirm that case that corrective rebound from 1.4318 has completed at 1.5277, ahead of 1.5354 resistance. Intraday bias will be back on the downside for 1.4597 support first. Break there will bring retest of 1.4318 low. For now, risk will stay on the downside as long as 1.5277 resistance holds.
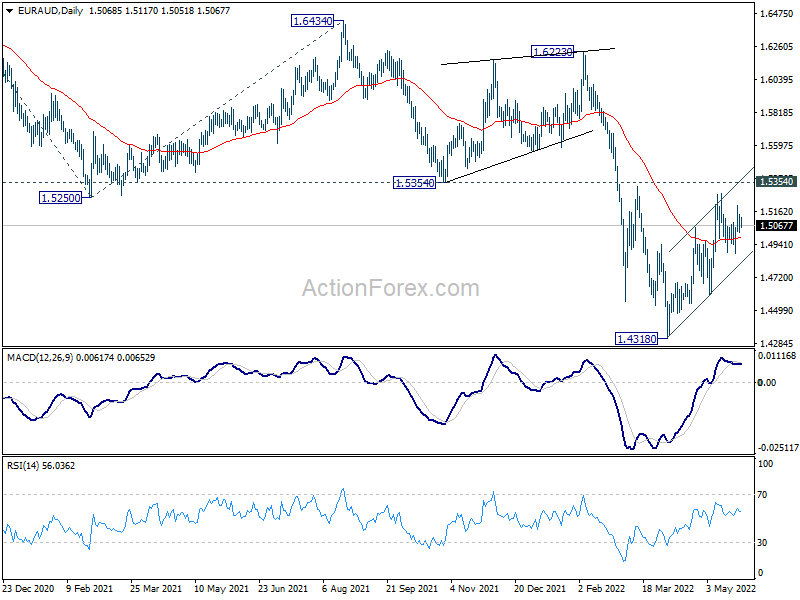
In the bigger picture, as long as 1.5354 support turned resistance holds, larger down trend form 1.9799 (2020 high) is still expected to continue. On resumption, next target is 61.8% projection of 1.9799 to 1.5250 from 1.6434 at 1.3623, which is close to 1.3624 long term support (2017 low). However, firm break of 1.5354 will indicate medium term bottoming and bring stronger rally back to 1.6434 key resistance.
EUR/CHF Daily Outlook
Daily Pivots: (S1) 1.0238; (P) 1.0278; (R1) 1.0318; More....
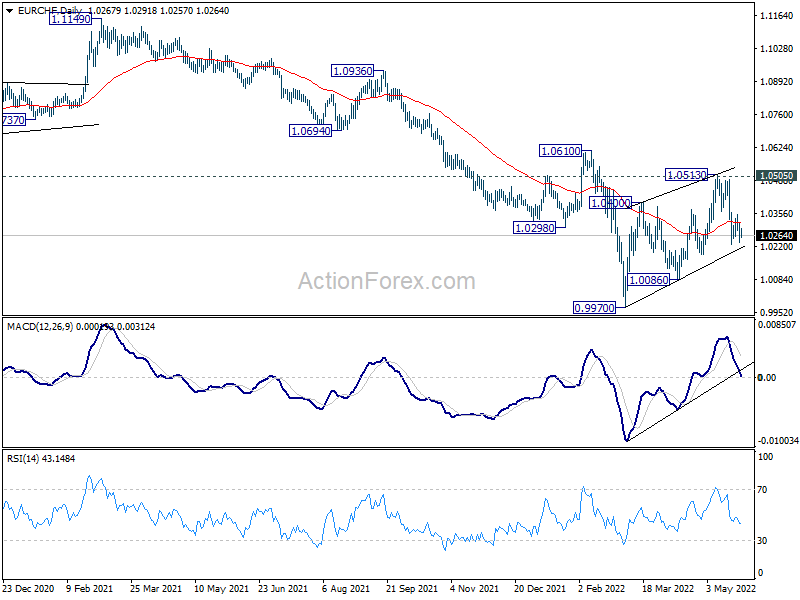
Intraday bias in EUR/CHF remains neutral for the moment. Corrective rebound from 0.9970 should have completed with three waves up to 1.0513, after rejection by 1.0505 key resistance. Below 1.0228 will target 1.0086 support. Firm break there will bring retest of 0.9970 low. However, break of 1.0359 will dampen this bearish view and bring stronger recovery back towards 1.0513 resistance.
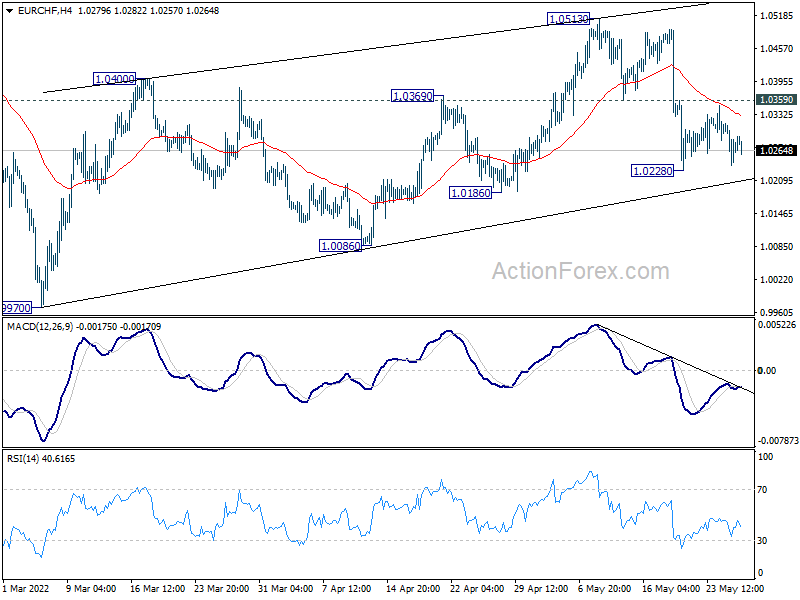
In the bigger picture, as long as 1.0505 support turned resistance (2020 low) holds, long term down trend from 1.2004 (2018 high) is expected to continue. Next target is 100% projection of 1.2004 to 1.0505 to 1.1149 at 0.9650. However, firm break of 1.0505 will suggest medium term bottoming, and bring stronger rebound towards 1.1149 structural resistance.
Daily Technical Analysis
EUR/USD
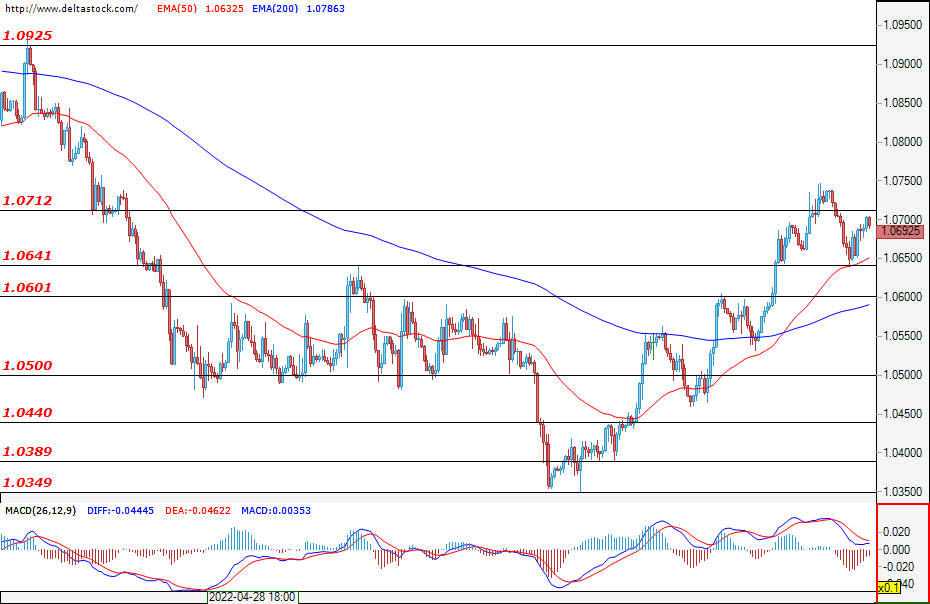
Today’s session started rather calmly as the common European currency continued to trade against the dollar in the range between 1.0641 and 1.0712. However, the bulls gained momentum and managed to score an increase of about 30 pips. Their next goal would be to breach the close resistance at 1.0712. However, if the bears manage to dwindle the bulls’s inertia, then the first support they would have to deal with would be the level of 1.0650. The next crucial support for investors is expected to be the level of 1.0600. Higher volatility can be expected at around 12:30 GMT, when the U.S. GDP and jobless claims data will both be published.
USD/JPY
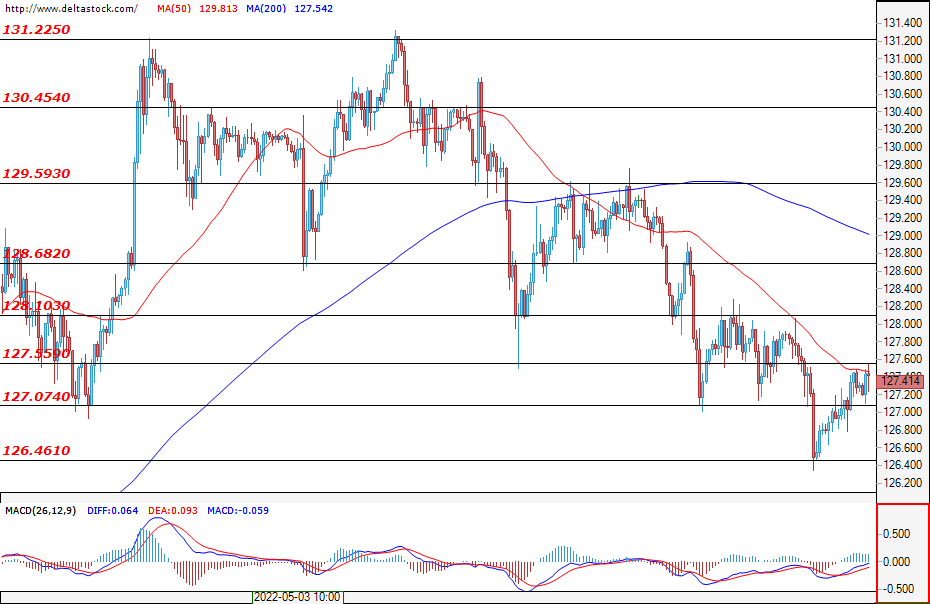
Today, the Ninja managed to rally with about half a figure. The key area for the bulls that was eventually overcome was the resistance at 127.00. At the time of writing the analysis, the bulls are about to breach the next hurdle at 127.50 and will likely boldly attack the level at 128.00 as well. In order for the sell-off to gain more steam, however, the bears would first need to breach the support at 127.00.
GBP/USD
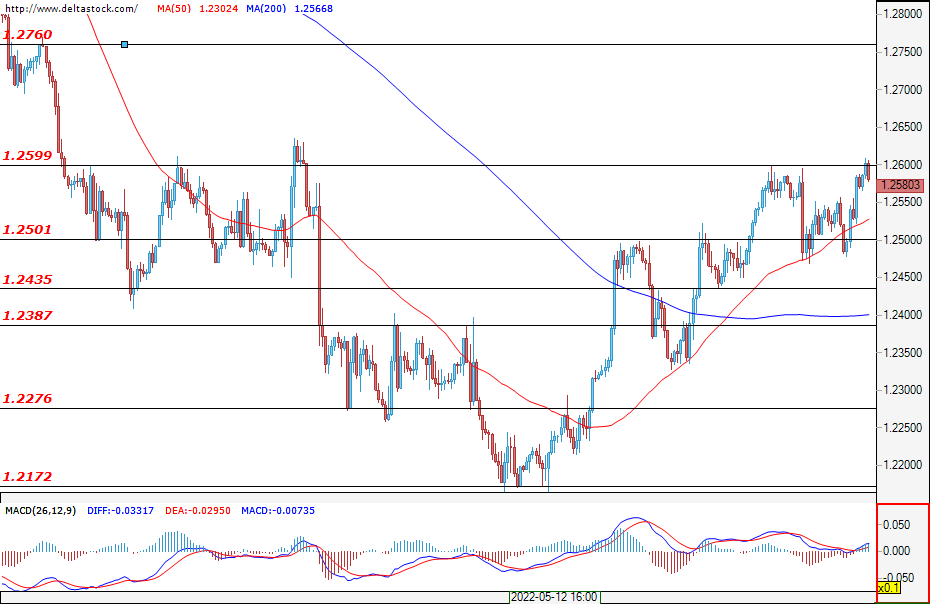
For the past several days, the bulls have been successful in making the Cable work in their favour. At the time of writing, traders are trying to breach their close resistance at 1.2600, while their next key resistance is sitting at 1.2760. To put an end to their upward momentum, the bears would first have to deal with the two important supports at 1.2500 and at 1.2430.
EUGERMANY40
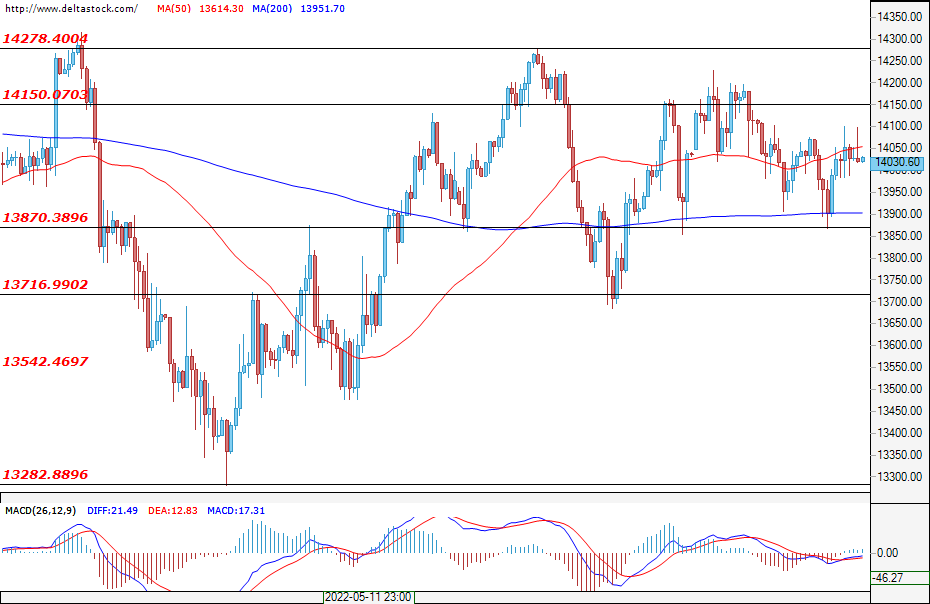
The German index continues to trade between the support at 13870 and the resistance at 14150, and for the past several days, neither the bears nor the bulls have been able to tip the scales in their favour. No news from the macroeconomic calendar is expected to affect the index until the very end of the weekly session, so it is very likely that its consolidation will continue. If, despite that, the bulls somehow manage to breach the resistance at 14150, then the next level that they would have to overcome would be 14280.
US30
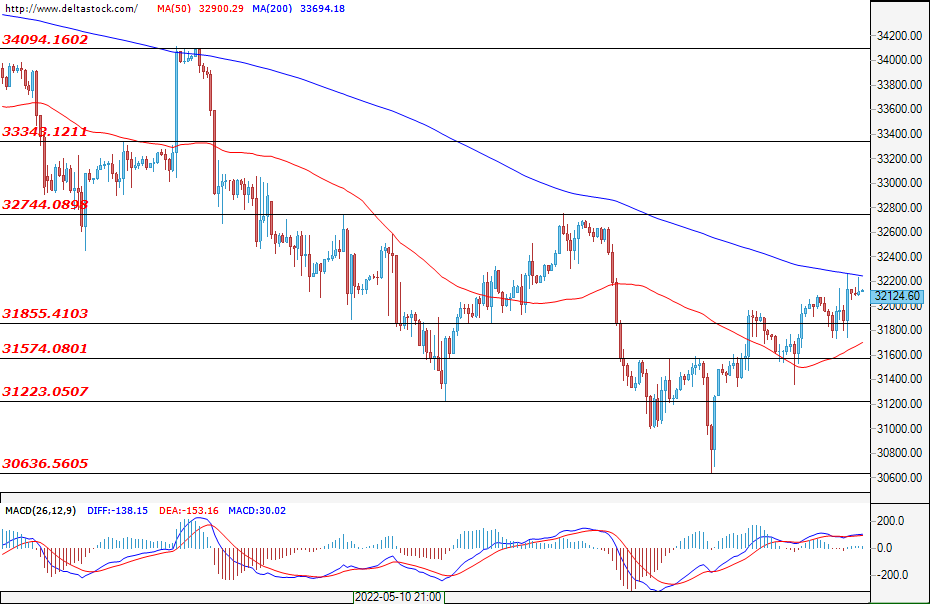
The situation with the U.S. blue chips is similar to that of the German index with the exception that the bulls seem a bit stronger, footing. The levels, within which the U.S. index is currently ranging, are the support at 31855 and the resistance at 32745, respectively. The main difference, however, is that by the end of the trading session, we have a lot of upcoming news that could have a strong impact on the index. The U.S. gross domestic product report (12:30 GMT), the announcement of the Initial Jobless Claims data (12:30 GMT), and the Pending Home Sales data (14:00 GMT) are just some of the expected macroeconomic news for tomorrow, which should have a significant influence over the market, especially given the fact that the GDP figure will be largely indicative of whether or not the world's biggest economy is headed towards a recession.
EURGBP Stands Near 0.8500; Appears Somewhat Neutral in Short-Term
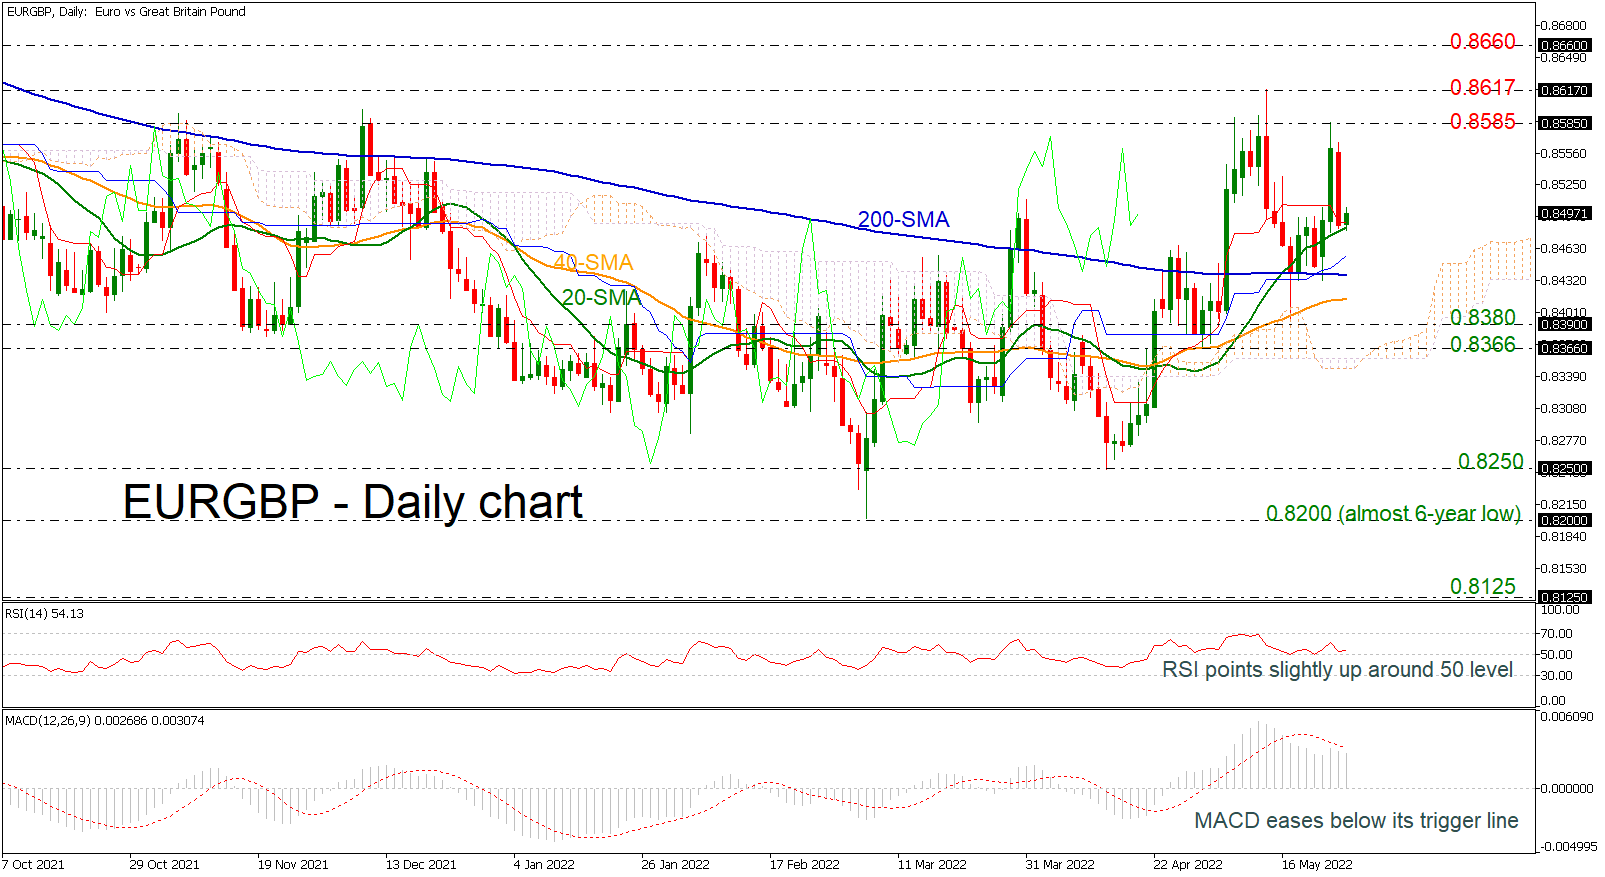
EURGBP posted strong losses on Wednesday, erasing the previous gains, and returning above the 20-day simple moving average (SMA). The bias in the short-term is appearing neutral as the price failed several times to make a daily close above 0.8585. The RSI is sloping slightly upwards in the positive region; however, the MACD is losing momentum below its trigger and zero lines.
Should the price retreat further, the 200-day SMA at 0.8437, which the bears were unable to break over the last three weeks, could provide immediate support. Moving lower, the focus will shift to the 40-day SMA at 0.8414, while lower still the 0.8380 would increase speculation that the medium-term bullish phase has ended, and a downtrend is in progress.
In the alternative scenario, traders would be eagerly looking for a break above 0.8585 to increase buying orders. If that’s the case, the rally could last until 0.8617 ahead of the 0.8660 bullish spike, taken from the peak on July 2021.
All in all, EURGBP is moving sideways in the short-term, while in the medium-term outlook, the price is showing some positive signs.
USD/CAD Daily Outlook
Daily Pivots: (S1) 1.2786; (P) 1.2835; (R1) 1.2868; More...
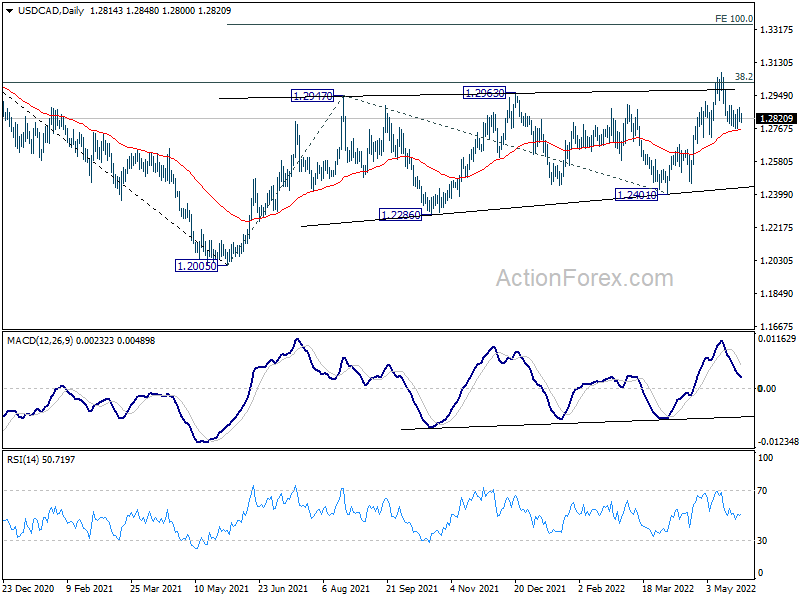
Intraday bias in USD/CAD remains neutral and outlook is unchanged. Further rise is mildly in favor with 1.2712 support intact. On the upside, break of 1.3075 will resume the rise from 1.2401. Sustained trading above 1.3022 fibonacci level will carry larger bullish implications. Next target will be 100% projection of 1.2005 to 1.2947 from 1.2401 at 1.3343. On the downside, however, break of 1.2712 support will indicate rejection by 1.3022 key fibonacci resistance, and bring deeper decline back to 1.2401 support.
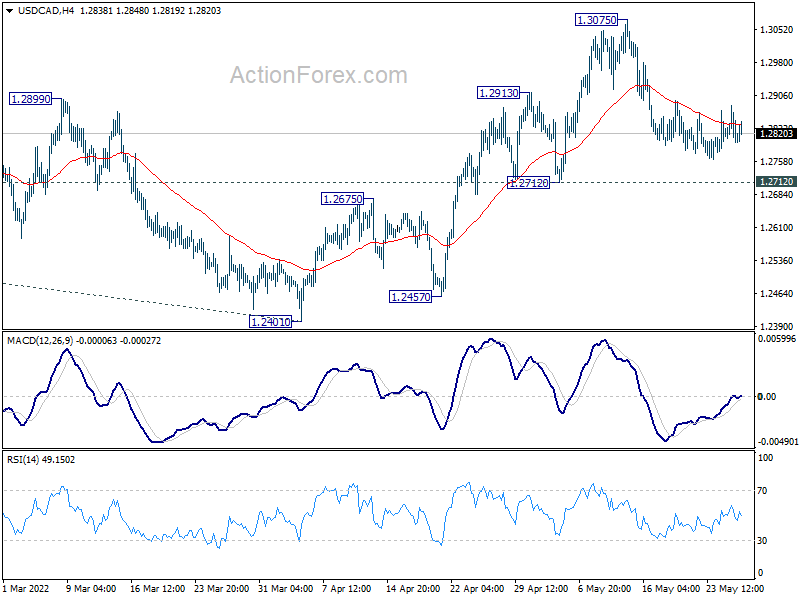
In the bigger picture, focus stays on 38.2% retracement of 1.4667 (2020 high) to 1.2005 (2021 low) at 1.3022. Sustained break there should confirm that the down trend from 1.4667 has completed after defending 1.2061 long term cluster support. Further rise would then be seen towards 61.8% retracement at 1.3650. However, rejection by 1.3022 will maintain medium term bearishness. Break of 1.2005 will resume the down trend from 1.4667 and that carries larger bearish implications too.
AUD/USD Daily Report
Daily Pivots: (S1) 0.7043; (P) 0.7081; (R1) 0.7126; More...
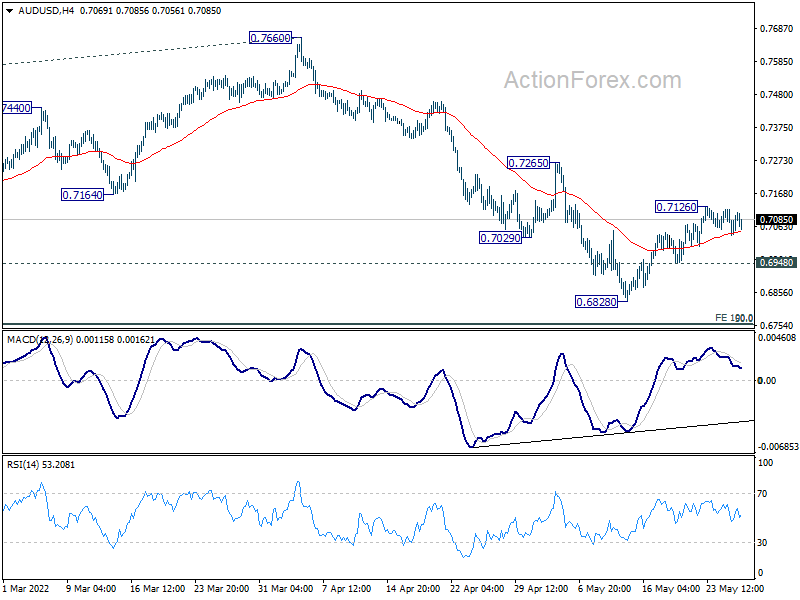
Intraday bias in AUD/USD is turned neutral first. On the upside, above 0.7126 will extend the rebound from 0.6828 to 55 day EMA (now at 0.7175). Break there will target 0.7265 resistance next. On the downside, though, break of 0.6948 will resume larger fall from 0.8006 through 0.6828 low, and target 0.6756/60 medium term fibonacci level next.
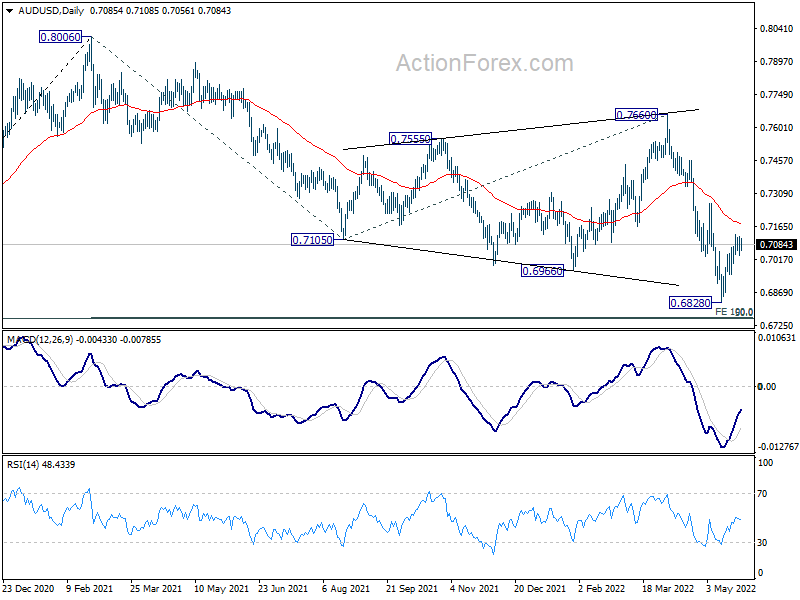
In the bigger picture, price actions from 0.8006 are seen as a corrective pattern to rise from 0.5506 (2020 low). Deeper fall could be seen to 50% retracement of 0.5506 to 0.8006 at 0.6756. This coincides with 100% projection of 0.8006 to 0.7105 from 0.7660 at 0.6760. Strong support is expected from 0.6756/60 cluster to contain downside to complete the correction. However, sustained break of 0.6756/60 would argue that AUD/USD is indeed already in a medium term down trend.
USD/JPY Daily Outlook
Daily Pivots: (S1) 126.13; (P) 127.10; (R1) 127.85; More...
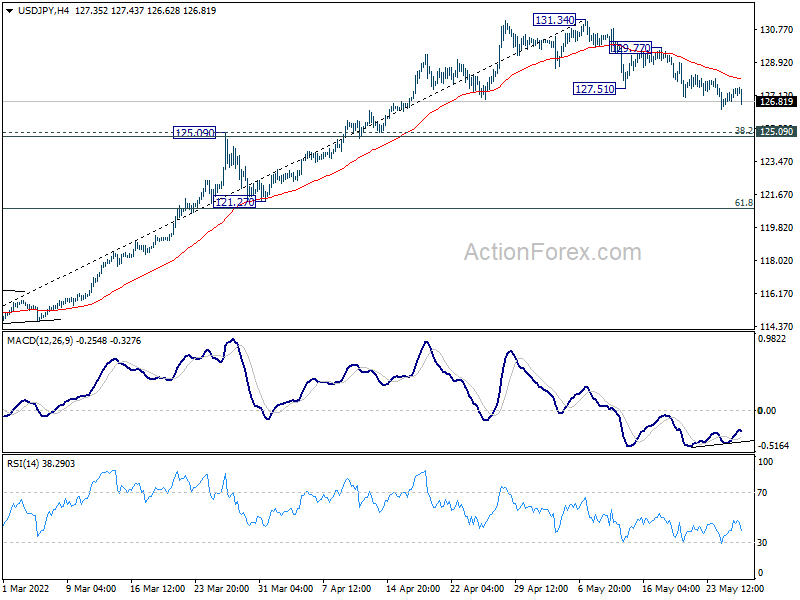
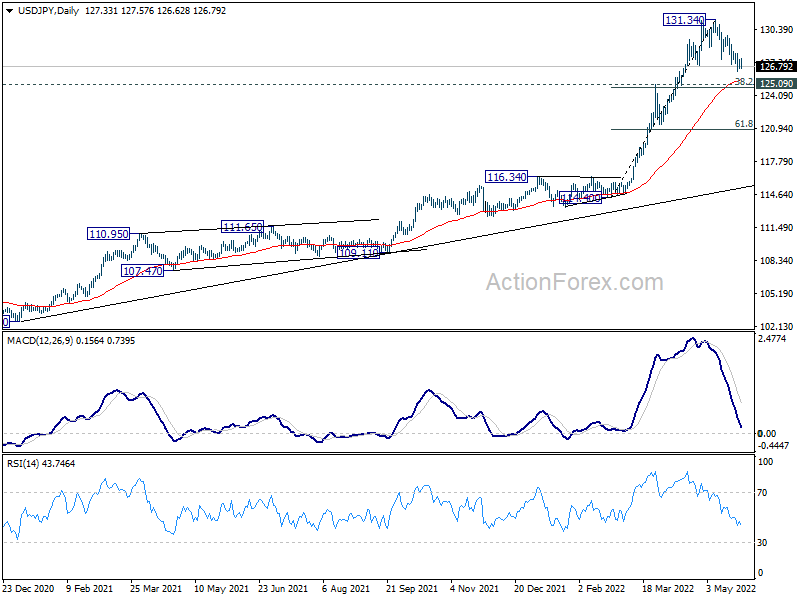
USD/JPY's correction from 131.34 could still extend lower. But downside should be contained by 125.09 cluster support (38.2% retracement of 114.40 to 131.34 at 124.86) to bring rebound. On the upside, break of 129.77 minor resistance will suggest that the correction is finished and bring retest of 131.34.
In the bigger picture, current rally is seen as part of the long term up trend form 75.56 (2011 low). Sustained trading above 61.8% projection of 75.56 (2011 low) to 125.85 (2015 high) from 98.97 at 130.04 will pave the way to 100% projection at 149.26, which is close to 147.68 (1998 high). For now, this will remain the favored case as long as 121.27 support holds.
USD/CHF Daily Outlook
Daily Pivots: (S1) 0.9599; (P) 0.9621; (R1) 0.9645; More...
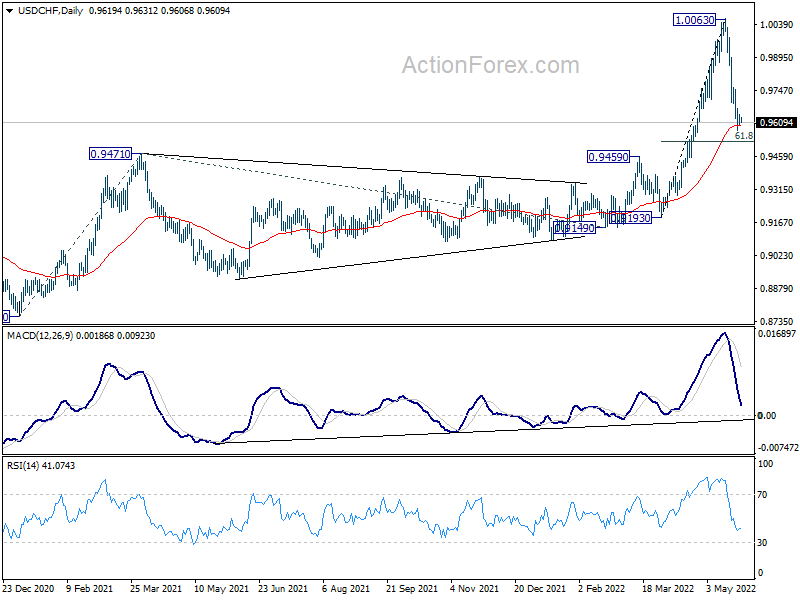
No change in USD/CHF's outlook as fall from 1.0063 could extend lower. But downside should be contained by 61.8% retracement of 0.9193 to 1.0063 at 0.9525 to bring rebound. On the upside, above 0.9763 minor resistance will turn bias back to the upside for recovery. However, sustained break of 0.9525 will bring deeper decline to 0.9459 support.
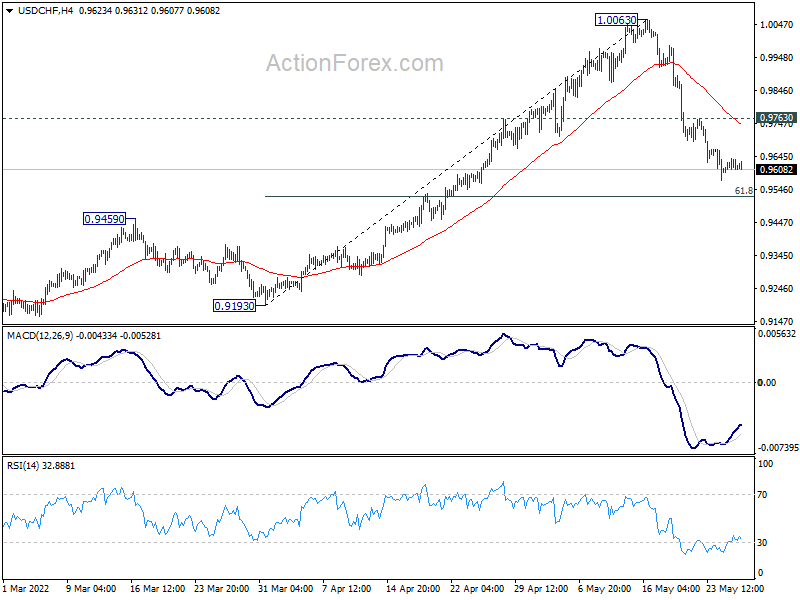
In the bigger picture, down trend from 1.0342 (2016 high) should have completed with three waves down to 0.8756 (2021 low) already. Rise from 0.8756 is likely a medium term up trend of its own. Next target is 161.8% projection of 0.8756 to 0.9471 from 0.9149 at 1.0306, which is close to 1.0342 (2016 high). This will remain the favored case as long as 0.9459 resistance turned support holds.