Sample Category Title
GBP/USD Mid-Day Outlook
Daily Pivots: (S1) 1.2472; (P) 1.2535; (R1) 1.2599; More..
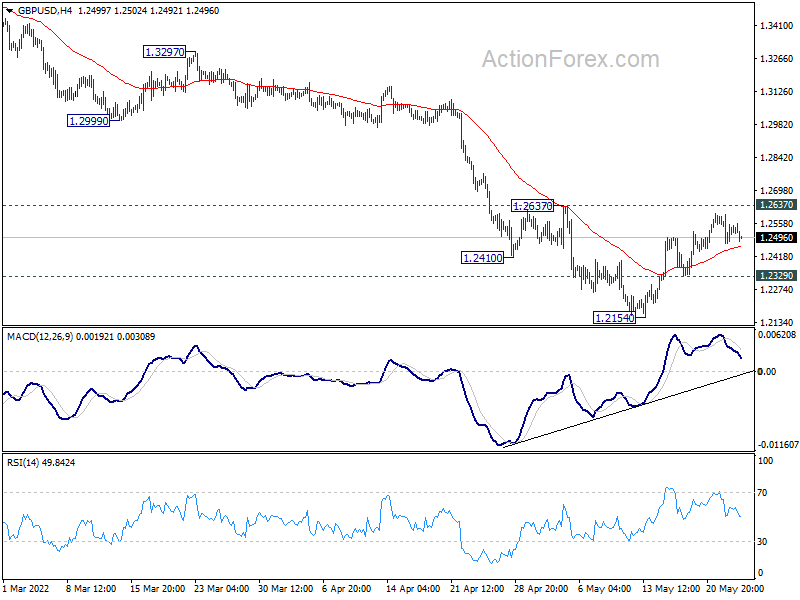
Intraday bias in GBP/USD stays neutral and outlook is unchanged. On the upside, firm break of 1.2637 resistance will bring stronger rebound to 55 day EMA (now at 1.2765). On the downside, below 1.2329 minor support will retain near term bearishness and bring retest of 1.2154 first. Break there will resume larger down trend from 1.4248.
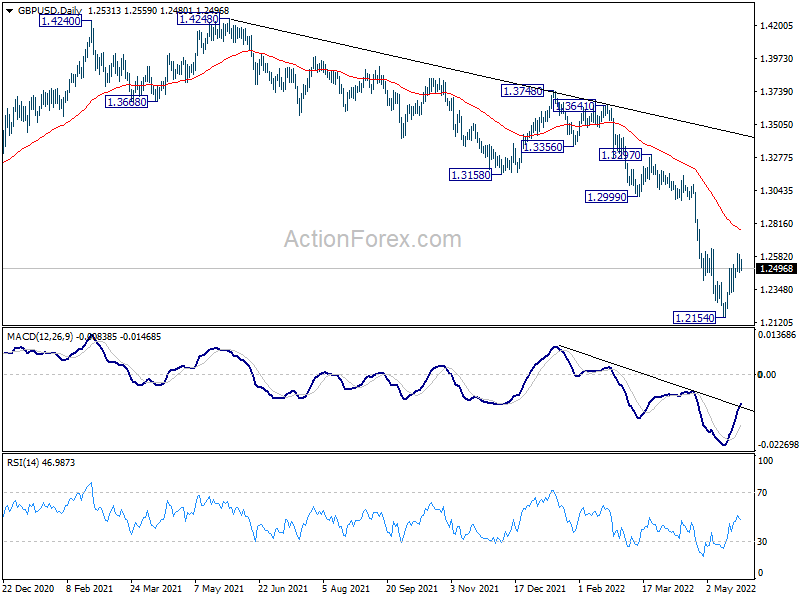
In the bigger picture, based on current momentum, fall from 1.4248 (2018 high) at least at the same degree as the rise from 1.1409 (2020 low). That is, fall from 1.4248 could be a leg inside the pattern from 1.1409, or resuming the longer term down trend. In either case, deeper decline is expected as long as 1.2999 support turned resistance holds. Next target is 1.1409 low.
EUR/USD Mid-Day Outlook
Daily Pivots: (S1) 1.0682; (P) 1.0715 (R1) 1.0770; More...
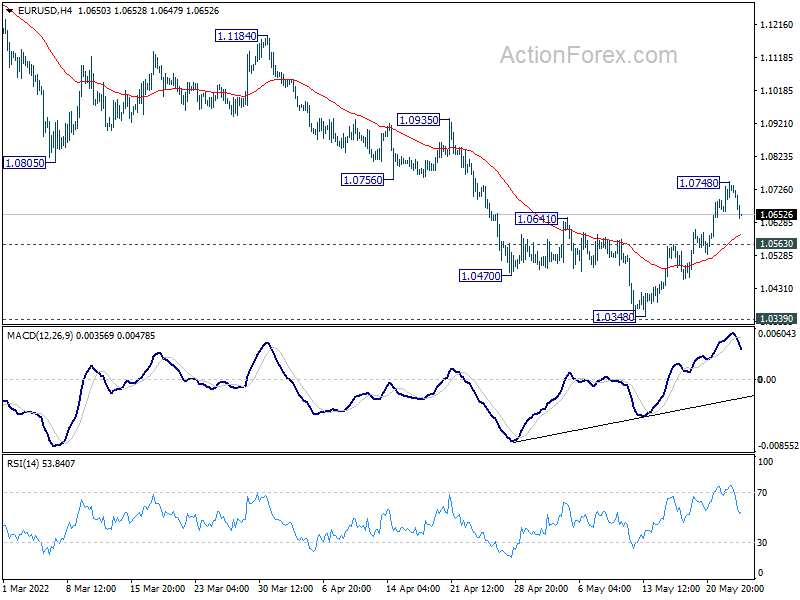
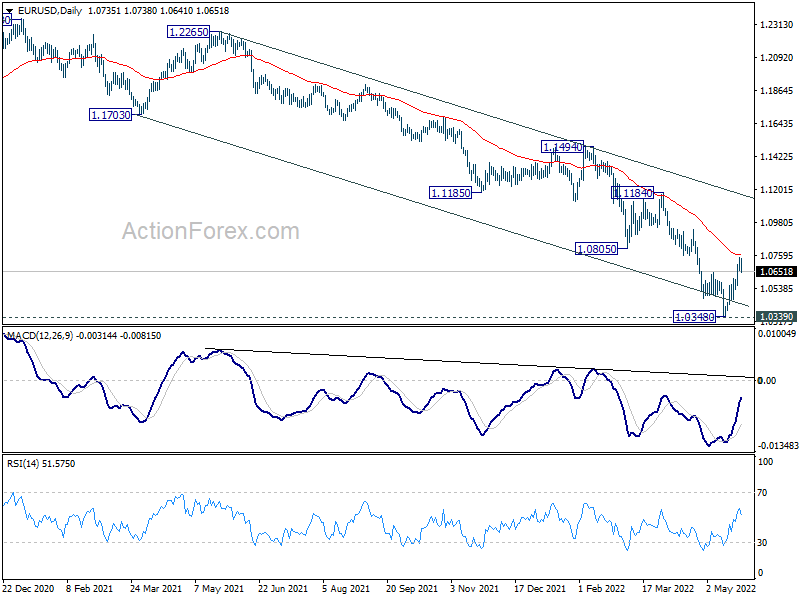
Intraday bias in EUR/USD is turned neutral first with today's retreat. Another rise could be seen with 1.0563 minor support intact. Above 1.0748 will resume the rebound from 1.0348. Firm break of 55 day EMA (now at 1.0760) will target 1.0935 resistance next. However, below 1.0563 minor support will turn intraday bias back to the downside for retesting 1.0348 low instead.
In the bigger picture, focus stays on 1.0339 long term support (2017 low). Decisive break there will resume whole down trend from 1.6039 (2008 high). Next target is 61.8% projection of 1.3993 to 1.0339 from 1.2348 at 1.0090. However, firm break of 1.0805 support turned resistance will delay this bearish case and bring medium term corrective rebound first.
Dollar and Yen Recovering, Markets Stay Indecisive
Overall, the moves in the forex markets are still indecisive. Dollar and Yen are striking back today and rise broadly. Swiss Franc follows as the third strongest, suggesting a risk-off undertone. Nevertheless, other markets are still relatively steady. New Zealand Dollar's post-RBNZ rally faded rather quickly. But for now, Aussie is the weakest one, followed by Euro and then Canadian. Sterling and Kiwi are just mixed.
Focuses will turn to FOMC minutes. From recent comments, Fed official displayed a consensus on the plan of 50bps hike per meeting, at least for the next few ones. FOMC minutes should reflect the discussions and affirm this message too. Meanwhile what next beyond August, as well as the end point for the year would remain data dependent.
Technically, it's still early to conclude that Dollar has already completed its near term correction. But while still remote, some levels could be put under radar. The levels include 1.0563 minor support in EUR/USD, 1.2329 support in GBP/USD, 0.6948 support in AUD/USD and 0.9763 minor resistance in USD/CHF. Dollar should have a sustainable rally if these levels are all violated.
In Europe, at the time of writing, FTSE is up 0.33%. DAX is up 0.06%. CAC is up 0.06%. Germany 10-year yield dropped -0.033 to 0.934. Earlier in Asia, Nikkei dropped -0.26%. Hong Kong HSI rose 0.29%. China Shanghai SSE rose 1.19%. Singapore Strait Times dropped -0.48%. Japan 10-year JGB yield dropped -0.0202 to 0.212.
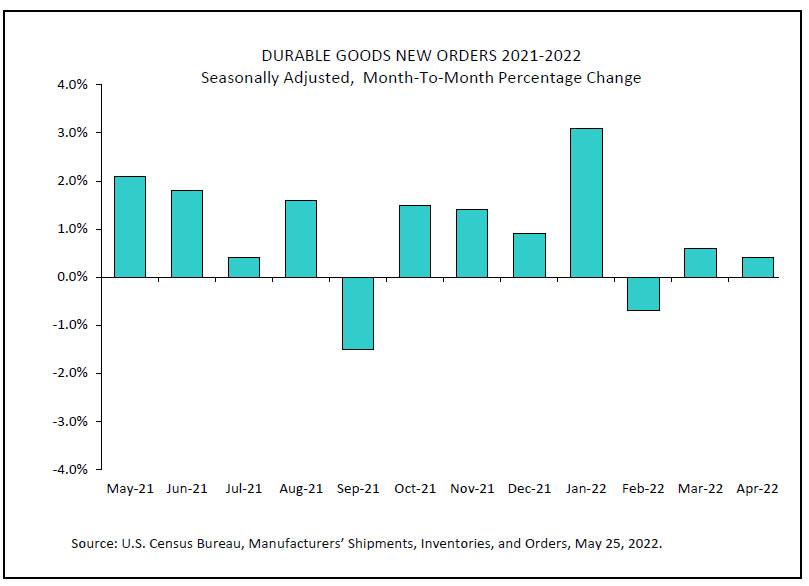
US durable goods orders rose 0.4% in Apr, ex-transport orders up 0.3%
US durable goods orders rose 0.4% mom to USD 265.3B in April, below expectation of 0.6% mom. Ex-transport orders rose 0.3% mom, below expectation of 0.6% mom. Ex-defense orders rose 0.3% mom. Transportation equipment, rose 0.6% mom to USD 86.7B.
ECB Panetta: Policy normalization needs to be clearly defined
ECB Executive Board member Fabio Panetta said in a speech, "the very shocks that have led to a surge in inflation (in Eurozone) are also depressing output". Hence, "the inflation path is starting from a much higher point but the medium-term inflation outlook is characterised by high uncertainty." Policy normalization needs to be "clearly defined".
Panetta explained that normalization does not mean moving to a "neutral" policy stance. it shouldn't be assessed against "unobservable reference points" such as neutral rate. And, it "does not imply adjusting unconventional instruments more rapidly than conventional ones".
Normalization is "a process of gradually reducing that stimulus in a way that firmly anchors the inflation path at 2% over the medium term", he said.
Germany Gfk consumer confidence rose to -26, war and inflation still weighing
Germany Gfk consumer confidence for June rose slightly from -2.66 to -26.0, worse than expectation of -25.6. In May, economic expectations rose from -16.4 to -9.3. Income expectations rose from -31.3 to -23.7. Propensity to buy dropped from -10.6 to -11.1.
"Although this means that the consumer climate has improved slightly, consumer sentiment is still at an all-time low," explains Rolf Bürkl, GfK consumer expert. "Despite further easing of pandemic-related restrictions, the war in Ukraine and especially high inflation are weighing heavily on consumer sentiment."
RBNZ hikes by 50bps, rate projected to peak at 3.9%
RBNZ raised the Official Cash Rate by 50bps to 2.00% as widely expected. The central bank now projects OCR to peak at 3.9% in Q2 of 2023, before moving down slightly starting from Q3 2024.
In the statement, RBNZ said: "The Committee viewed the projected path of the OCR as consistent with achieving its primary inflation and employment objectives without causing unnecessary instability in output, interest rates and the exchange rate. Once aggregate supply and demand are more in balance, the OCR can then return to a lower, more neutral, level."
Also in the new forecasts, GDP would grow 5.4% in 2022, then slow to 3.2% in 2023, 1.3% in 2024, and 1.2% in 2025. CPI would average 6.9% in 2022, then slow to 4.4% in 2023, 2.5% in 2024, and 2.0% in 2025. Unemployment rate is projected to be at 3.2% in 2022, then gradually climb to 3.8% in 2023, 4.4% in 2024, and 4.7% in 2025.
Japan government concerned of re-spread of coronavirus in China and Ukraine war
In May's Monthly Economic Report, Japan's government maintained that the economy "shows movement of picking up". Private consumption, business investment and industrial production have "shown movement of picking up". Exports were still "almost flat".
Employment assessment was upgrade slightly to "shows movement of picking up" rather than just in "some components. Consumer prices "have been rising recently", with "moderately" dropped.
The government also warned that "full attention should be given to the downside risks due to supply-side constraints, rising raw material prices and fluctuations in the financial and capital markets while there are concerns regarding the effects of the re-spread of the Novel Coronavirus in China and lengthening the state of affairs of Ukraine".
EUR/USD Mid-Day Outlook
Daily Pivots: (S1) 1.0682; (P) 1.0715 (R1) 1.0770; More...
Intraday bias in EUR/USD is turned neutral first with today's retreat. Another rise could be seen with 1.0563 minor support intact. Above 1.0748 will resume the rebound from 1.0348. Firm break of 55 day EMA (now at 1.0760) will target 1.0935 resistance next. However, below 1.0563 minor support will turn intraday bias back to the downside for retesting 1.0348 low instead.
In the bigger picture, focus stays on 1.0339 long term support (2017 low). Decisive break there will resume whole down trend from 1.6039 (2008 high). Next target is 61.8% projection of 1.3993 to 1.0339 from 1.2348 at 1.0090. However, firm break of 1.0805 support turned resistance will delay this bearish case and bring medium term corrective rebound first.
Economic Indicators Update
| GMT | Ccy | Events | Actual | Forecast | Previous | Revised |
|---|---|---|---|---|---|---|
| 01:30 | AUD | Construction Work Done Q1 | -0.90% | 1.00% | -0.40% | 0.60% |
| 02:00 | NZD | RBNZ Interest Rate Decision | 2.00% | 2.00% | 1.50% | |
| 06:00 | EUR | Germany Gfk Consumer Confidence Jun | -26 | -25.6 | -26.5 | -26.6 |
| 06:00 | EUR | Germany GDP Q/Q Q1 F | 0.20% | 0.20% | 0.20% | |
| 08:00 | CHF | Credit Suisse Economic Expectations May | -52.6 | -51.6 | ||
| 12:30 | USD | Durable Goods Orders Apr | 0.40% | 0.60% | 1.10% | |
| 12:30 | USD | Durable Goods Orders ex Transport Apr | 0.30% | 0.60% | 1.40% | |
| 14:30 | USD | Crude Oil Inventories | -2.2M | -3.4M | ||
| 18:00 | USD | FOMC Minutes |
US durable goods orders rose 0.4% in Apr, ex-transport orders up 0.3%
US durable goods orders rose 0.4% mom to USD 265.3B in April, below expectation of 0.6% mom. Ex-transport orders rose 0.3% mom, below expectation of 0.6% mom. Ex-defense orders rose 0.3% mom. Transportation equipment, rose 0.6% mom to USD 86.7B.
NZ Dollar Jumpy after RBNZ Decision
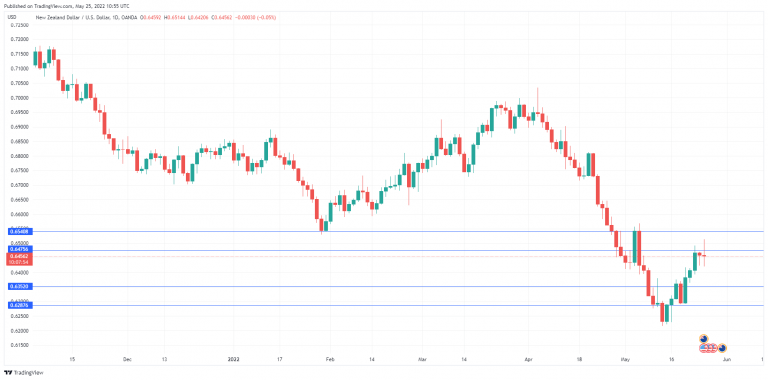
The New Zealand dollar is almost unchanged on Wednesday. NZD/USD posted strong gains in the Asian session but has surrendered most of those gains.
RBNZ shows hawkish teeth
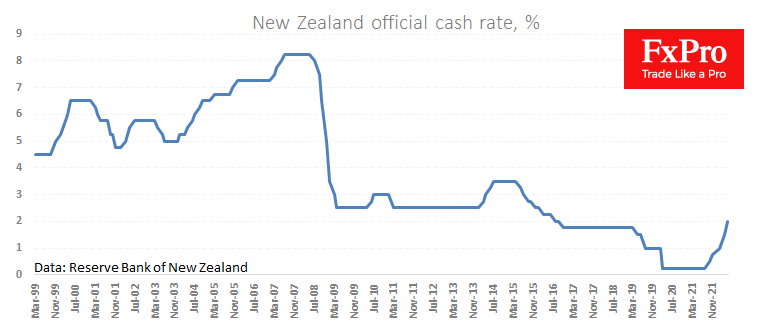
The Reserve Bank of New Zealand delivered on expectations, with a 0.50% rate hike which brings the cash rate to 2.0%, its highest level since 2016. The New Zealand dollar dipped ahead of the decision but rallied by over one percent after the rate increase. However, the upswing proved to be brief, as NZD/USD has given up most of those gains.
The rate hike of 0.50% was widely expected, but the markets weren’t sure what to expect from the rate statement. In the end, the statement was quite hawkish, with the RBNZ forecasting that the cash rate will have to increase to 3.4% by the end of 2022 and peak at 3.9% in mid-2023. Prior to today’s statement, the RBNZ had projected that the cash rate would remain below 3% until mid-2023 and peak at 3.4% in 2024. In the revised forecast, the RBNZ is giving notice that the cash rate peak will be higher than expected and the pace of tightening will also be faster than previously anticipated.
In follow-up remarks, Governor Orr acknowledged the possibility of a recession but said that the Bank had to curb the growth in demand in order to rein in inflation and keep inflation expectations in check. The RBNZ has forecast that inflation will peak at 7% in Q2, after a gain of 6.9% in the first quarter. Orr has come out swinging, but it will be a tricky task to aggressively raise rates and slow growth without causing the economy to stall.
NZD/USD Technical
- NZD/USD is testing resistance at 0.6475. Above, there is resistance at 0.6540
- There is support at 0.6352 and 0.6287
Be Ready for Bitcoin to End Consolidation with a Drop
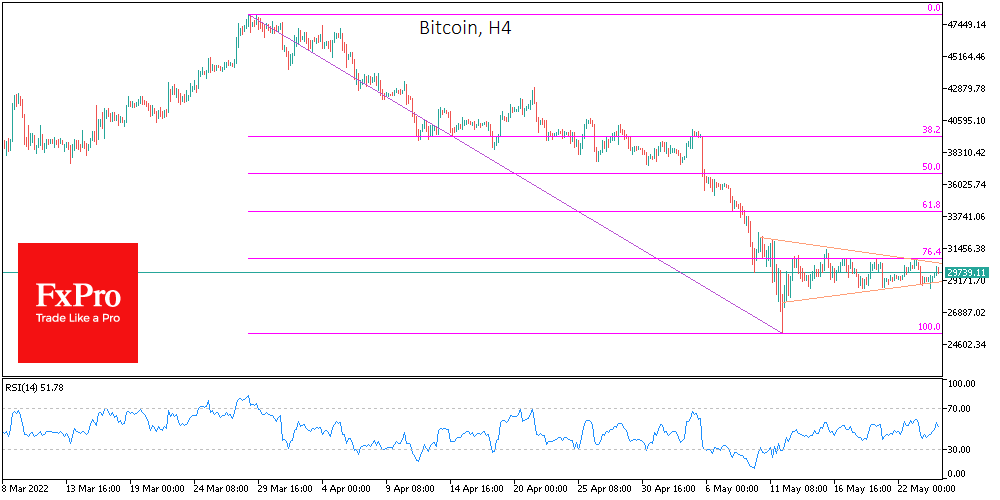
Bitcoin’s fluctuations continue to shrink, meaning the spring is being compressed further. The lower bound of the trading range has moved to $29K, from where the BTCUSD has received support since the start of active trading in New York. The upper bound of the formed triangle has moved to $30.5K against current prices at $30.0K, reflecting a 1.8% gain over the past 24 hours.
Ethereum has added 0.3% in the past 24 hours, with other altcoins in the top 10 from a 2.9% decline (Avalanche) to a 1.0% rise (BNB), but all faring worse than the crypto flagship.
Total coin capitalisation, according to CoinMarketCap, rose 1.1% to $1.28 trillion, with the Bitcoin Dominance Index up 0.4% to 44.7%. The Cryptocurrency Fear and Greed Index was down 1 point to 11 by Wednesday and remains in “extreme fear”.
The bitcoin price is in consolidation mode, equally dangerous for both bulls and bears. Both gain liquidity over time and get used to the current prices.
On the market cycle side, the chances are higher than the current consolidation will culminate in a breakdown of the lower boundary and liquidation of stop orders, reinforcing the initial downside momentum.
Behind the pessimistic outlook is a tightening of monetary policy with slowing economic growth, which puts retail investors in the mode of withdrawing capital from cryptocurrency in favour of consumption. It does not help that the expectations of getting rich fast through cryptocurrencies are not paying off, as bitcoin is worth as much now as it was in early 2021.
Investing in the industry is becoming more professional, moving beyond naïve attempts to buy and hold. According to CoinShares, investors are withdrawing money from bitcoin and investing in blockchains that support smart contracts, such as Cardano and Polkadot. Net capital outflows from crypto funds last week amounted to $141m.
The ECB warned that the high correlation between cryptocurrency and stock markets is usually seen in times of dire economic conditions and will no longer allow the diversification of investment portfolios with digital assets.
Hawkish RBNZ Has Strengthened the NZD. Is there More to Come?
More and more developed central banks are coming out with the pace of policy tightening in the USA. This morning the Reserve Bank of New Zealand raised its rate by 50 points to 2.0%, repeating its move in April. Analysts expected the decision, but NZDUSD strengthened by 1.4% to levels above 0.6500 hours after the decision.
Buyers were attracted by comments from the RBNZ on its willingness to continue to tighten monetary conditions. In today’s commentary, policymakers point out that raising the rate sooner and faster reduces the risk that inflation becomes sustainable. In its very hawkish comments, the RBNZ hints at a willingness to slow economic demand, i.e., slow growth.
Since the beginning of last week, the NZDUSD has shown substantial gains after touching levels near 0.6200. Technical analysis points to a relatively bullish outlook for the pair. The RSI index has reversed to growth on the weekly timeframes after touching oversold levels. On the daily charts, the bullish divergence of the RSI and the price chart also indicates the potential for further growth.
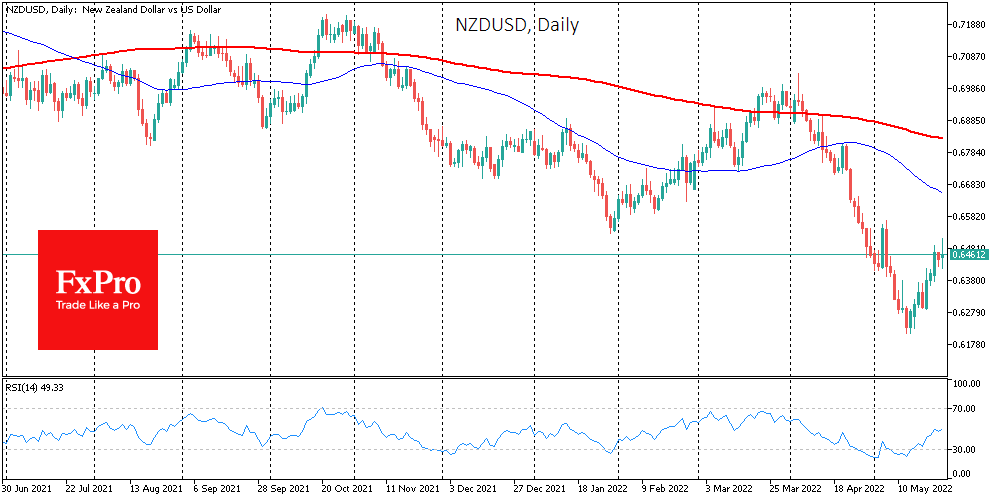
The NZDUSD has corrected 23.6% from the February 2021 peak to the early May 2022 bottom, potentially paving the way for a stronger recovery towards 0.6700 due to the latest bounce. However, with the RBNZ’s resolve and the country’s favourable export conditions, we could well see the beginning of an extended kiwi trend which could return to 0.7200 in the next 12 months.
The RBNZ example looks like one of the first indications of a broader trend, where other global central banks will adopt the Fed’s speed. Possibly they can surpass it, as they have done so many times in history, which would form a retreat of the dollar after almost a year of gains.
USDJPY’s Retracement Opposed by Soaring 50-day SMA
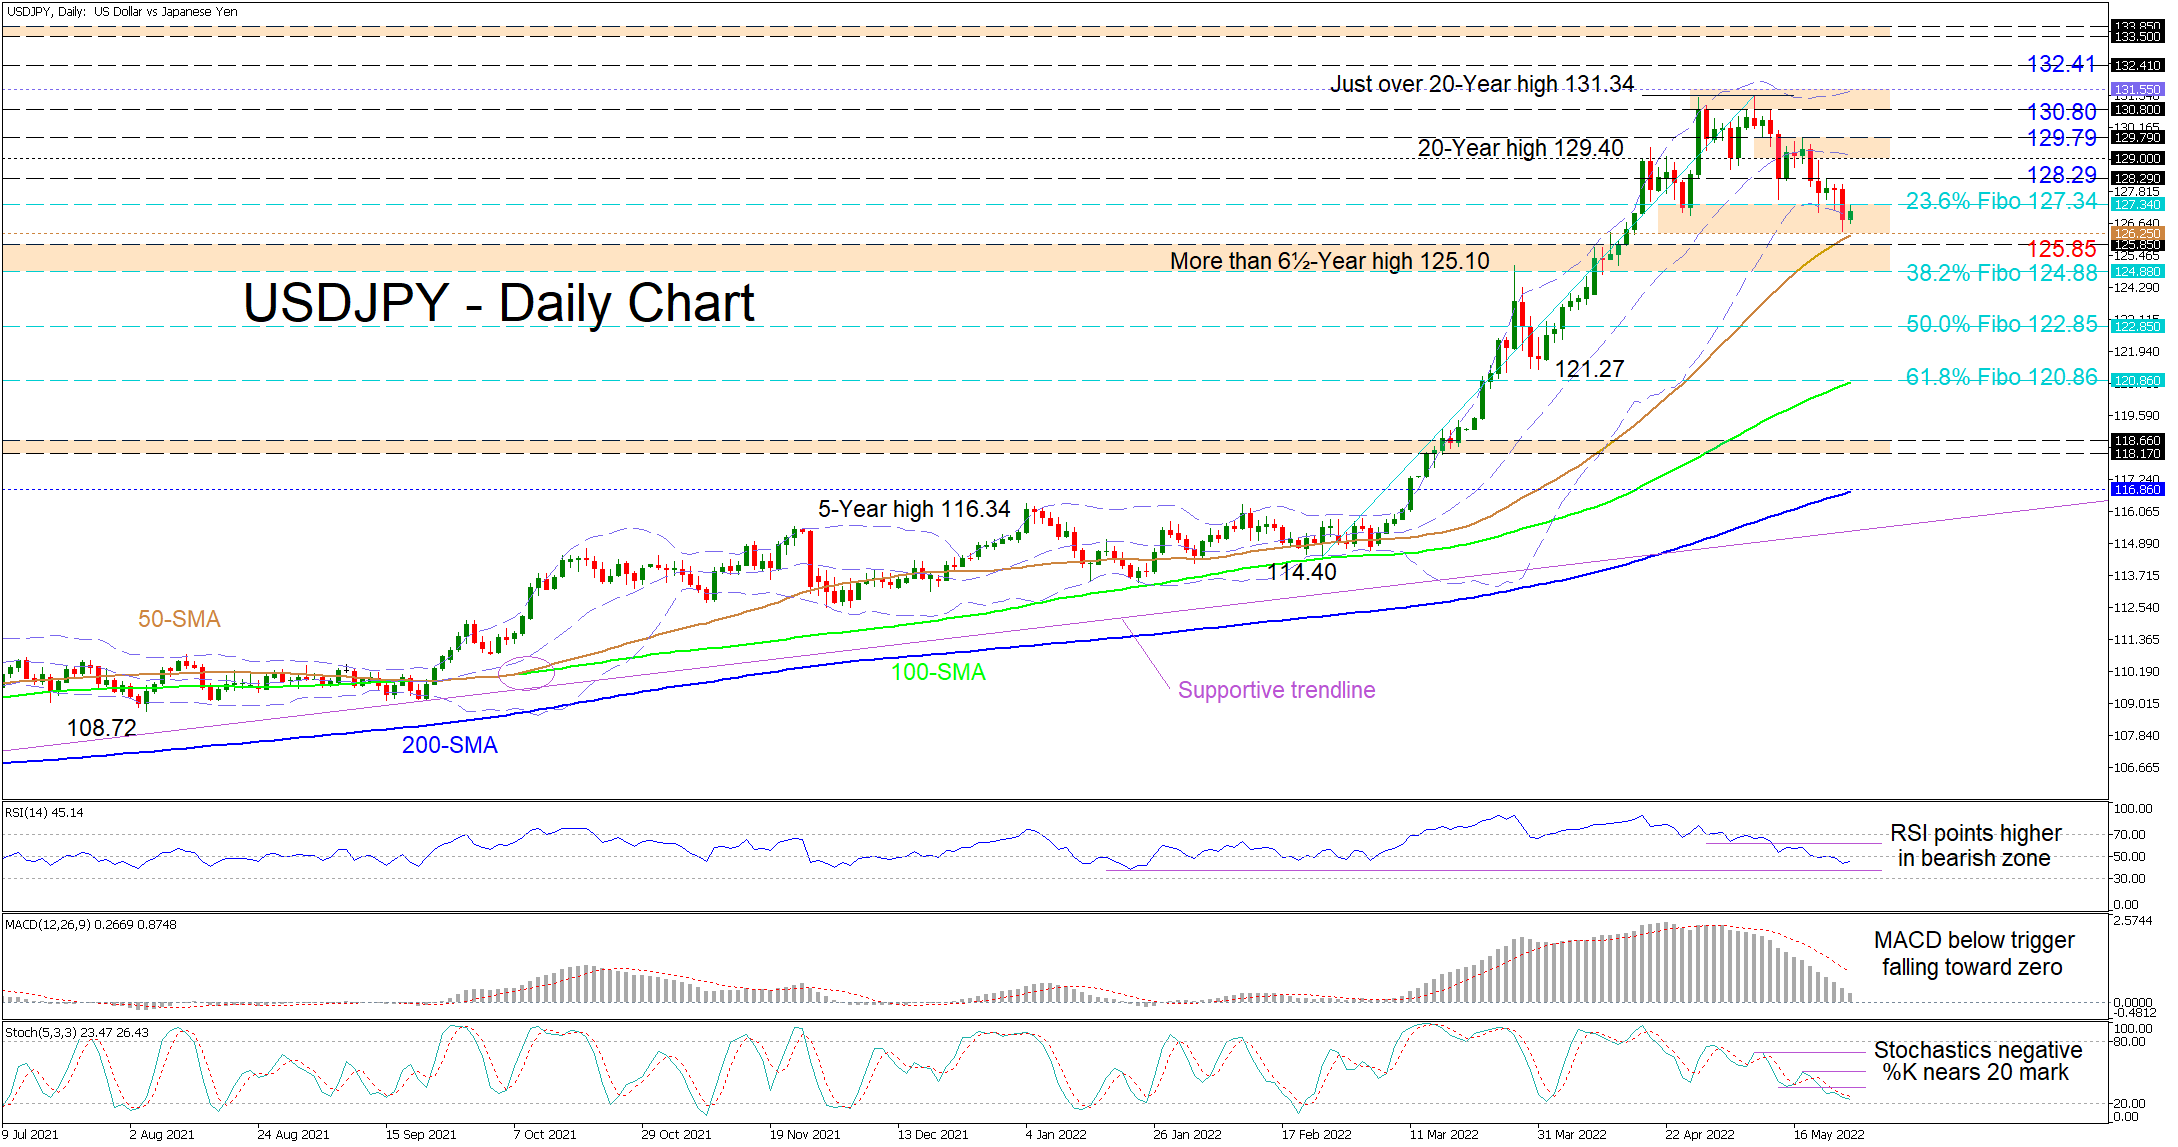
USDJPY is trading around the lower Bollinger band residing within a support zone which is linking the 127.34 barrier with the rising 50-day simple moving average (SMA) at 126.25, the former being the 23.6% Fibonacci retracement of the uptrend from 114.40 until a high that oversteps the 20-year mark at 131.34. The hiking SMAs are sponsoring the positive structure despite the price fading past the 23.6% Fibonacci level.
As things stand, the short-term oscillators are demonstrating mixed messages in directional momentum. The MACD is still sliding beneath its red trigger line and is nearing the zero threshold, indicating that positive momentum is dwindling. Furthermore, the %K and %D lines of the negatively charged stochastic oscillator are a stretch away from the 20 oversold barrier. Meanwhile, the RSI is improving in the bearish region, implying buyers are fighting back.
If the 126.25-127.34 upside defence, involving the 50-day SMA and the 23.6% Fibo impede further retracements in the pair and buyers manage to prop the price back above the 23.6% Fibo of 127.34, resistance could commence around the nearby 128.29 high. If buying pressures increase, the next resistance obstacle may present itself between the 129.00 handle and the 129.79 border, a fortified area that encapsulates the mid-Bollinger band. Should additional bullish legs unfold, the region from the 130.80 level until the upper Bollinger band at 131.55 - that includes more than 20-year highs - could make it difficult for the pair to pilot to new heights and test the 132.41 mid-April 2002 deterrent.
Otherwise, if sellers resurface and overwhelm the ascending 50-day SMA at 126.25, an adjacent support boundary from the 125.85 mark until the 38.2% Fibo of 124.88 may counter the bears’ efforts to deepen a downside correction in the pair. If this durable border which incorporates the June 2015 peaks fails to dismiss negative tendencies in the pair, the 50.0% Fibo of 122.85 may promptly draw traders’ attention. If the pair sustains a heavy tone, the spotlight could then shift towards the March 31 trough of 121.27 and the 100-day SMA’s location presently at the 61.8% Fibo of 120.86.
Summarizing, USDJPY’s bullish structure is under the microscope as the price weighs on the 50-day SMA at 126.25 and the 124.88-125.85 support just beneath. The pair’s bullish bias should remain intact if the price holds above the 124.88-125.85 barrier. Meanwhile, a price dive extending below the 124.88 side of the support may reinforce dampening prospects in the pair encouraging a deeper retracement to develop.
Elliott Wave Analysis: EUR/USD Has Room for Higher Prices
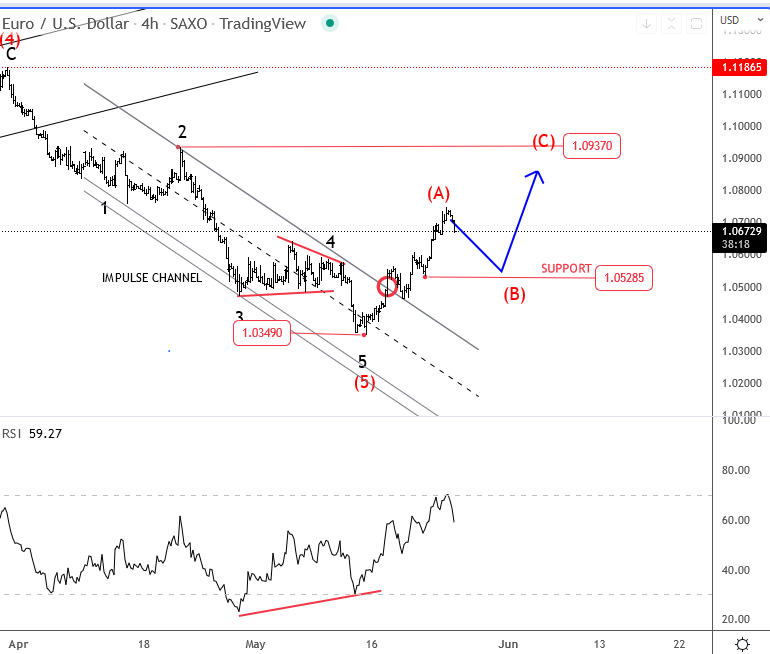
The USD is moving lower across the board as gap between FED and other CB is narrowing. We see more and more ECB members and speculation for a potential 50bp hike which is the main reason for stronger euro these days. There was also RBNZ that lifted rates as expected and was ready for more, so USD is mostly trading south. At the same time stocks also found some support as US yields come down so this is another reason for USD pullback. From an Elliott wave perspective we see EURUSD turning higher, breaking the channel resistance line so it appears that the fifth wave is finished as we talked about in our past updates. Recovery is quite strong so ideally, that's wave (A) first leg of a higher degree recovery which can see even move up to 1.08/1.09, but after wave (B) set-back which can see a pullback in the very near-term.
Big picture
Looking for final wave C of a big complex correction from 2008 highs. The market may try to build a base near 1.0 level later this year.
US Dollar Index Crawls Back ahead of Fed Minutes
US stocks erased some of the gains made on Monday as investors continue worrying about corporate earnings. Social media shares like Snap and Pinterest crashed by more than 20% after Snap warned about trends in the ad business. Advertising companies like Trade Desk, Digital Turnbine, and Omnicon declined sharply. Similarly, Abercrombie & Fitch declined sharply as investors worried about its weak earnings. The next key corporate earnings to watch today will be Nvidia, Snowflake, and Box will publish their results later today.
The US dollar rose slightly after the hawkish statement by Jerome Powell. Like he did last week, the Fed chair warned that the bank will continue hiking interest rates in the coming months. It also rose even after the relatively weak new home sales numbers. The numbers showed that new home sales declined by 16.6% in April. They dropped from 709k to 591k, which was lower than the median estimate of 750k. This trend happened as mortgage rates kept rising. Further data showed that the country’s manufacturing PMI declined from 59.2 to 57.2. The next key mover will be the minutes by the Federal Reserve.
The New Zealand dollar rose slightly on Wednesday morning after the latest interest rate decision by the country’s central bank. It decided to hike interest rates by 0.50% to 2% in its bid to fight inflation. It also signaled that it would continue hiking interest rates in the coming months. This view is in line with what other central banks like the Fed and the Bank of England are doing. The next key economic numbers to watch will be the German and Mexico GDP data. Also, the US will publish the latest core durable goods orders and crude oil inventories.
EURUSD
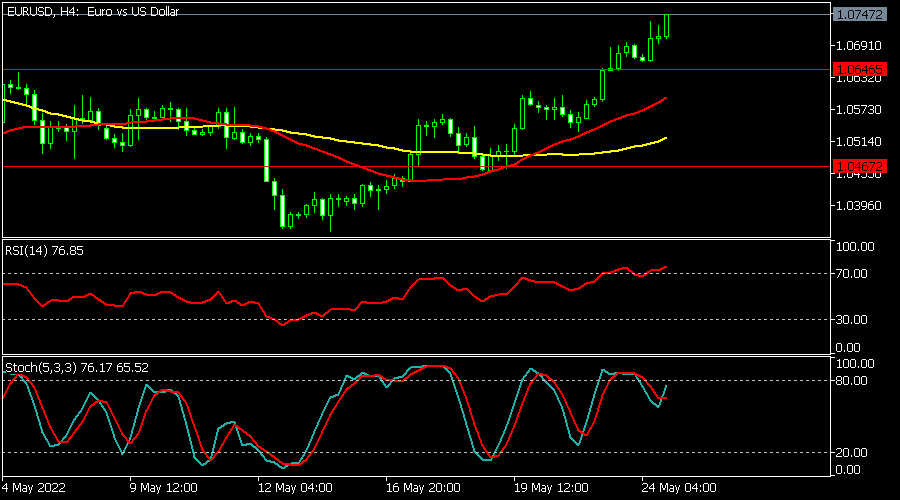
The EURUSD pair has been in a strong bullish trend in the past few days. The pair managed to move above the important resistance at 1.0646, which was the highest level on May 5th. It is being supported by the 25-day and 50-day moving averages. At the same time, the Relative Strength Index (RSI) and the Stochastic Oscillator have kept rising. Therefore, the pair will likely keep rising as bulls target the key resistance level at 1.0800.
EURCHF
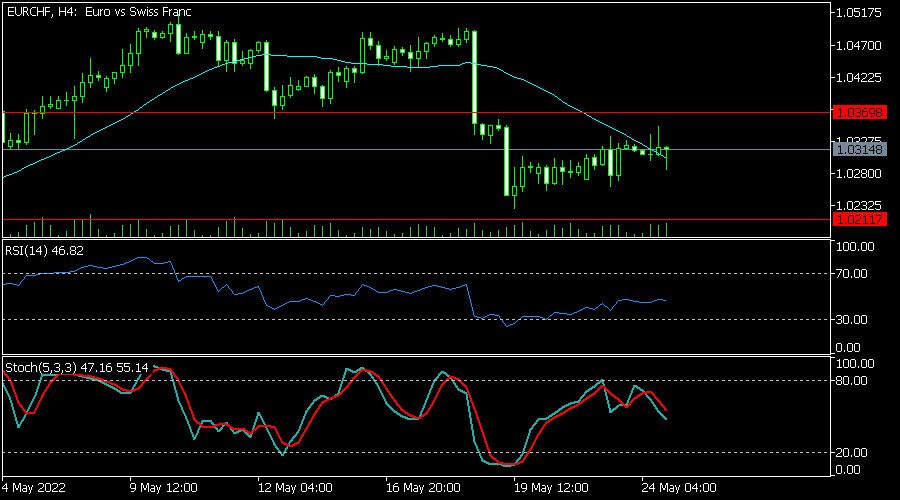
The EURCHF pair has been moving up gradually in the past few days. It is trading at 1.0311, which is slightly above the key support level at 1.0250. A closer look shows that the pair has formed a bearish flag pattern, which is usually a bearish signal. The Relative Strength Index has moved slightly below the neutral point at 50 while the Stochastic Oscillator has moved downwards. The pair will likely have a bearish breakout soon.
NAS100
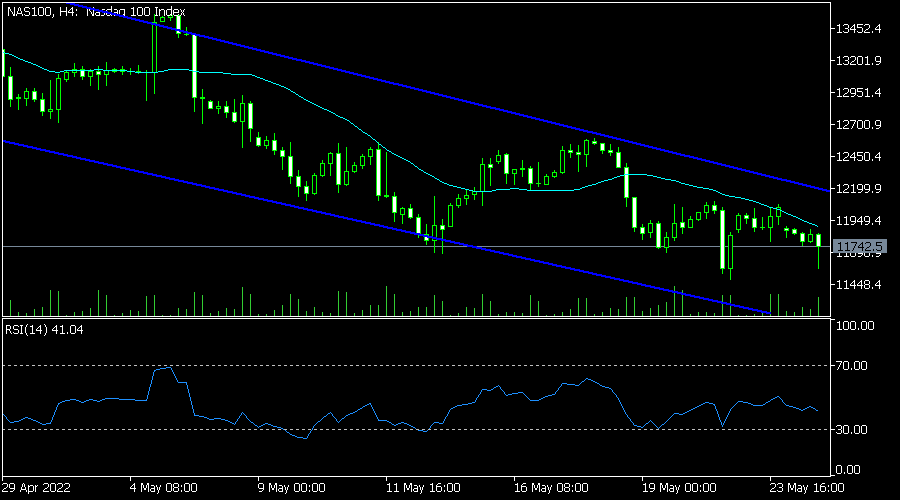
The Nasdaq 100 index came under intense pressure as investors focused on the weak guidance by Snap. The index is trading at $11,750, which is slightly above the year-to-date low. On the four-hour chart, the index is between the descending channel shown in blue. The Relative Strength Index has moved to the neutral level at 50. The index will likely keep falling as bears target the key support level at $11,200.