

Sample Category Title
EURUSD Buyers Target 1.06 Handle
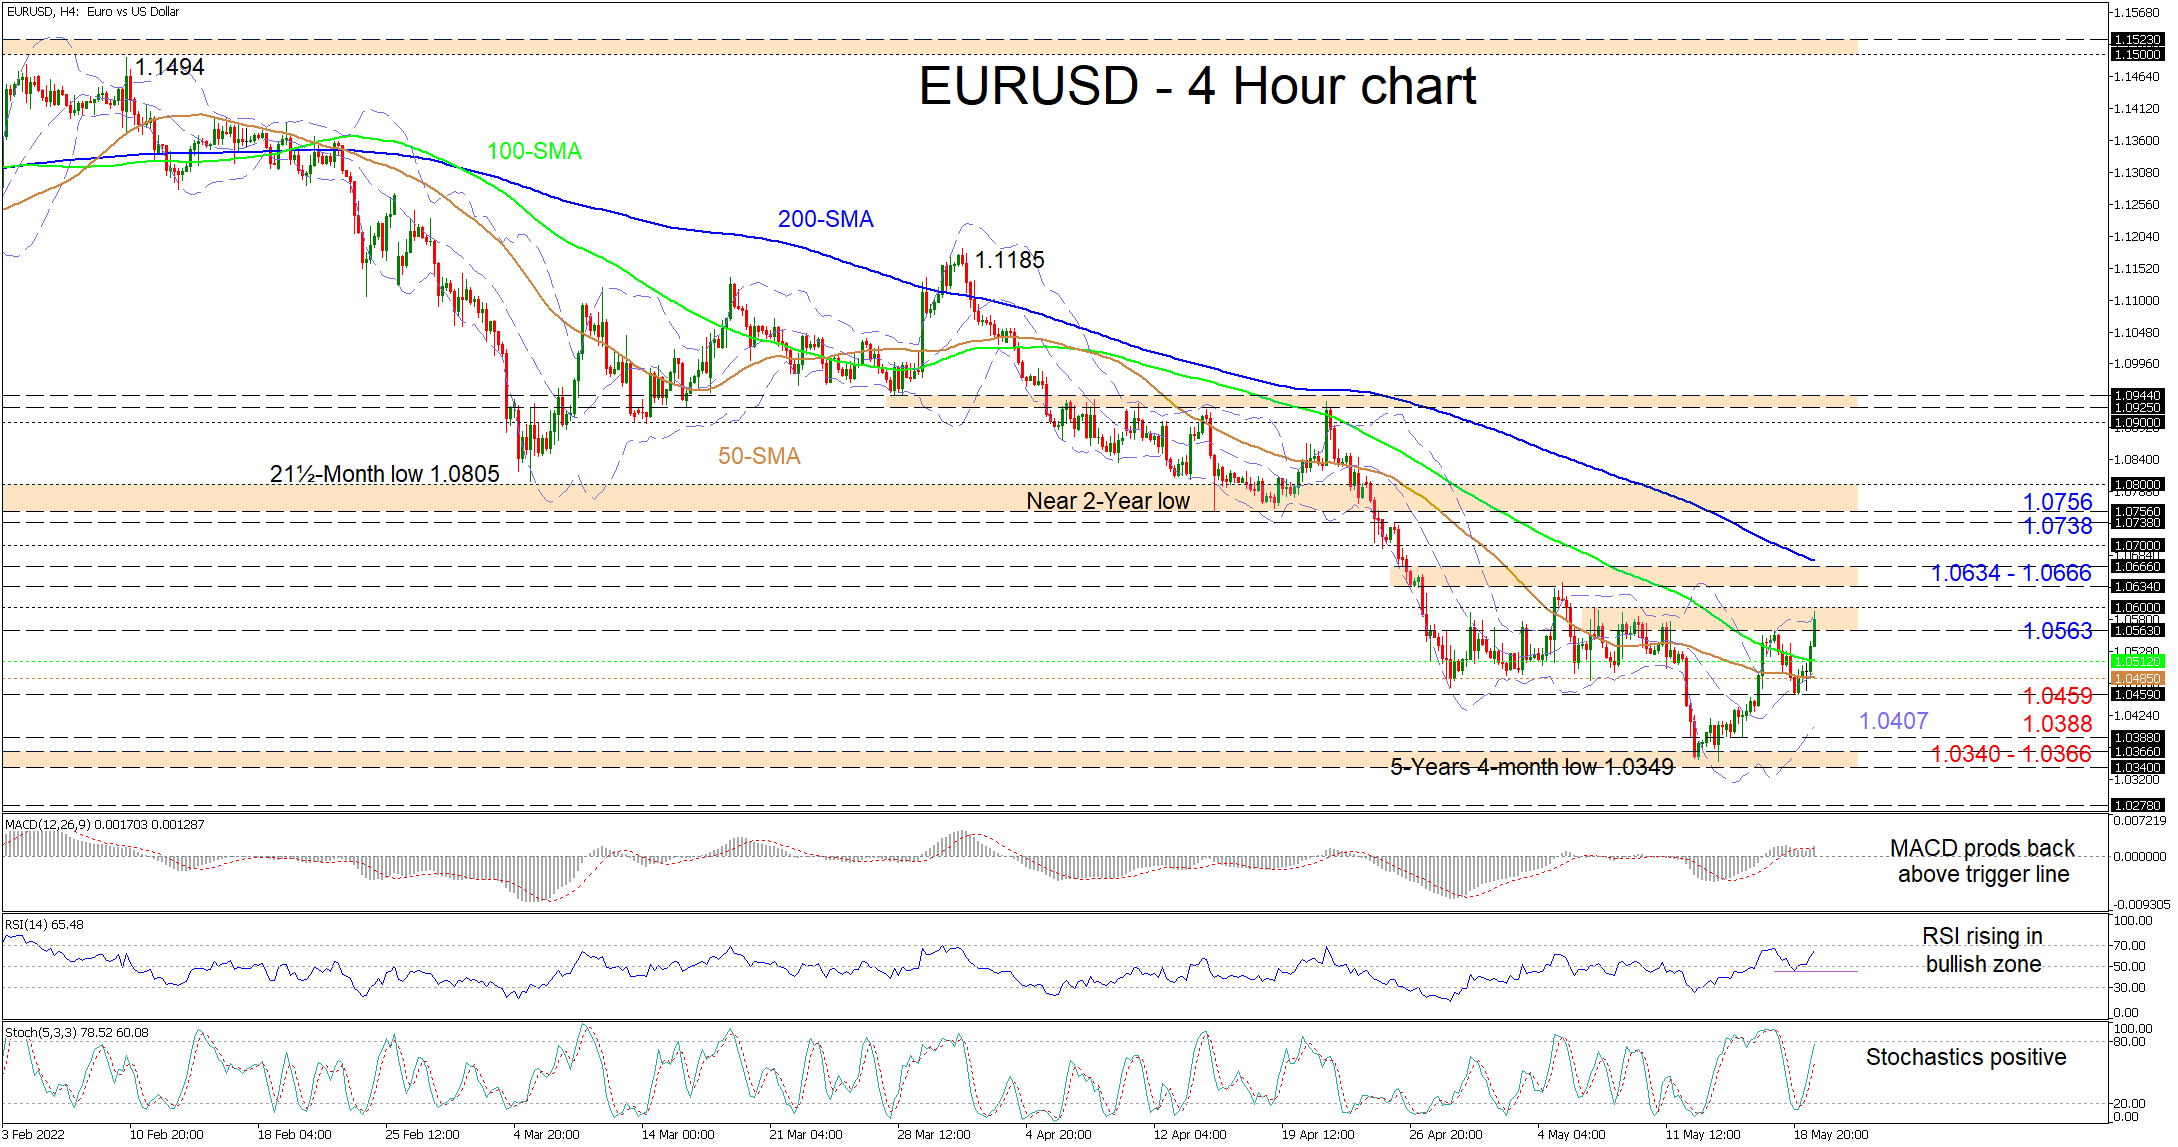
EURUSD’s fresh positive traction is struggling to surpass the upper Bollinger band residing within the 1.0563-1.0600 resistance region. Despite the pair’s newfound buoyancy extending beyond the sliding 50- and 100-period simple moving averages (SMAs), all the SMAs are promoting the bearish bearing.
The short-term oscillators have yet to reflect any clear weakness in the driving positive forces in the pair. The MACD, slightly north of the zero threshold, has lifted back above its red trigger line, while the improving RSI is heading for the 70 overbought barrier. Furthermore, the positively charged stochastic oscillator is implying that positive price action remains robust.
For the positive scenario to develop further, the bulls would need to initially climb beyond the 1.0563-1.0600 barricade, reinforced by multiple highs and the upper Bollinger band. Not much higher, the 1.0634-1.0666 obstacle and the approaching 200-period SMA overhead may try to test buyers’ efforts to overrun the 1.0700 and pilot for the 1.0738 high and the adjacent 1.0756-1.0800 resistance section that extends back to the May 2020 region of lows.
If buying pressures fade back below yesterday’s high of 1.0563, a support zone could transpire from the 100-period SMA at 1.0512 until the 50-period SMA at 1.0485. If selling interest intensifies and sinks the price past the 1.0459 border, the bears may then aim for the lower Bollinger band at 1.0407 and the 1.0388 low. Remaining heavy, the pair may revisit the 1.0340-1.0366 multi-year support region, moulded by troughs back in January 2017.
Summarizing, EURUSD downside risks continue to linger with the broader outlook advertising a sturdy bearish trend. Yet, buyers are pushing back and a climb in the price above the 1.0634-1.0666 barricade could reinforce a growing positive vibe in the pair.
Gold – Back in Favour?
Or just a blip?
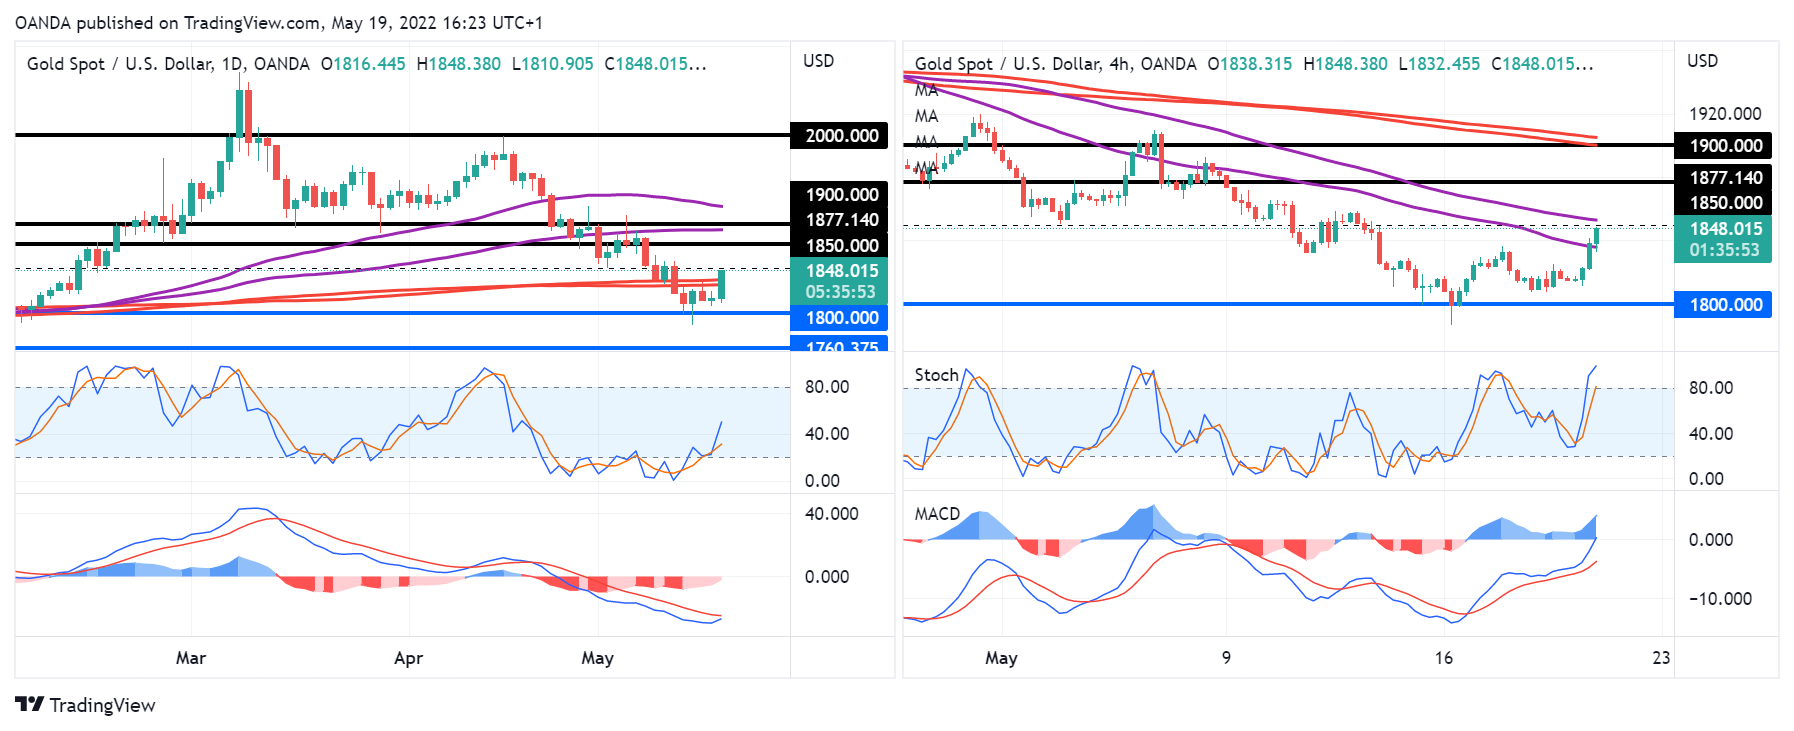
Gold has very much fallen out of favour over the last month as it fell 10% on the back of coming within a whisker of $2,000. But has something changed?
We’ve seen plenty of risk aversion in the markets over the last 24 hours, with stock markets falling heavily, and rather than being particularly supportive for the dollar, it’s gold that has performed well which hasn’t really been the case in recent weeks.
Perhaps that’s because higher inflation and therefore interest rate expectations have been behind all of the gloom in the markets, which is typically bullish for the dollar.
Whereas the last 24 hours seem to have seen a shift. Rather than interest rates, it’s economic fears that are driving the negativity in the markets. Higher inflation is squeezing margins which means higher prices. And the Fed has gone from anticipating a soft landing, to softish and now just a safe one. That shouldn’t fill anyone with confidence.
And maybe that’s why we’re seeing investors move back towards gold. Of course, we’ve seen plenty of big sentiment swings in the markets, especially this year, so that could change. But it’s possible that gold may be back in favour.
The first test of this comes around $1,850 which has been support and resistance in the past and coincides with the upper end of the 55/89-period SMA on the 4-hour chart.
This is followed by $1,875-1,900, a break of which would be a strong signal. A break back below $1,800 on the other hand would suggest quite the opposite unless accompanied by very positive economic news which seems unlikely at this point.
Fed George: We are good at 50 basis points right now
Kansas City Fed President Esther George told CNBC today that the real test on Fed's tightening is inflation data. "Where I am focused on when 'enough is enough' is looking at our inflation target. Right now inflation is too high and we will have to make a series of rate adjustments," she said.
Also, "we are good at 50 basis points right now and I would have to see something very different to say we need to go further than that," George said.
Sunset Market Commentary
Markets
With some good will, one could label this morning’s decline on Asian equity markets (mostly 1-2%) as ‘relatively modest’ given the WS sell-off. However, European trading soon made clear that this was no harbinger of dip-buyers stepping in. No buy-on-dips, even no sell-on-upticks, but simply further (stoploss) liquidation of cyclical, growth sensitive assets. European equities are losing about 2% (EuroStoxx50). US indices again decline between 0.5/1.5%. Even as the sell-off is caused by market fears that aggressive CB tightening risks undermining already weakening growth, core US and German government bond perfectly play their safe haven role. US yields are easing 8/6 bpn (2/30-y) to 9 bps (5 & 10-y). Eco data aren’t the main driver for markets currently. Still, an unexpected decline in the Philly Fed Business outlook (2.6 from 17.6) didn’t help to dismiss growth worries, even as orders and shipments in the survey remain at solid levels. US weekly jobless claims rose to a higher than expected 218K. The German yield curve bull flattens with yields tumbling between 4 bps (2-y) and 10 bps (10 & 30-y). The decline in EMU swap yields, especially at the short end of the curve, is less outspoken (-6 bp for 10-y, but only -1 bp for the 2-year). Investors clearly understand that the ECB being behind the curve is part of the problem rather than a solution to current economic complex. The accounts of the ECB April policy meeting showed quite a degree of discord on interpreting the rise in inflation and in some measures of inflation expectations. In this respect the accounts said that ‘Some members viewed it as important to act without undue delay in order to demonstrate the Governing Council’s determination to achieve price stability in the medium term. Such action was deemed necessary to prevent the temporary bout of higher inflation from becoming entrenched and to prevent inflation expectations from rising further from the Governing Council’s target’. However, a majority held to the approach of gradualism, flexibility and optionality. The June staff (inflation) forecasts are seen as a good anchor to reformulate forward guidance on the timing of the rate-lift-off post APP. To summarize, the accounts showed a high degree of division, but gave few new insights on the ECB rate hike path. A rate lift-off in July still looks the most probable scenario.
On FX the dollar failed to play its save haven role. The DXY index declined from 103.80 to currently 103.15. This was partially due to a further decline in USD/JPY (127.35). Remarkably, also the euro is gaining against the greenback with EUR/USD rising to the 1.055 area from 1.1046 this morning. An explanation isn’t that evident. Are FX markets discounting the risk of lower than expected US growth? The Swiss franc gained both against the dollar and the euro (EUR/CHF 1.0265). Sterling today weathered the risk-off storm rather well with cable returning to the 1.246 area against a weak dollar and EUR/GBP little changed near 0.8470 ahead of tomorrow’s key UK retail sales data.
News Headlines
Indonesian president Widodo announced that the export ban on palm oil, in place since April 28, will be lifted from May 23. That export ban was one of the first examples of food protectionism since the Russian invasion in Ukraine started. A more recent example is the Indian wheat export ban. The decision came after considering improvements in local supply and prices and after checking with the 17 million FTE industry. Palm oil prices dropped more than 6% after the announcement to 6500 Malaysia Ringgit per metric ton. That’s still some 25% higher than at the start of the year though and compares with less than 3000 MYR/MT ahead of the pandemic.
The South-African Reserve Bank accelerated its tightening cycle with a 50 bps rate hike from 4.25% to 4.75% in a 4-1 vote. The dissenter wanted another 25 bps move, like the SARB’s previous other three steps in this tightening cycle. The SARB slightly downgraded this year’s growth forecast from 2% to 1.7% while keeping the predictions for 2023 and 2024 unchanged at 1.9%. Headline inflation was upwardly revised to 5.9%-5%-4.7% over the 2022-2024 period. Under these assumptions, the SARB rate should be lifted to 5.3% by the end of this year, peaking at 6.75% in 2024. That’s a slightly steeper path than previously envisioned. The ZAR profits with USD/ZAR dropping from16.03 to 15.78.
Intensified Rotation in the US Labor Market
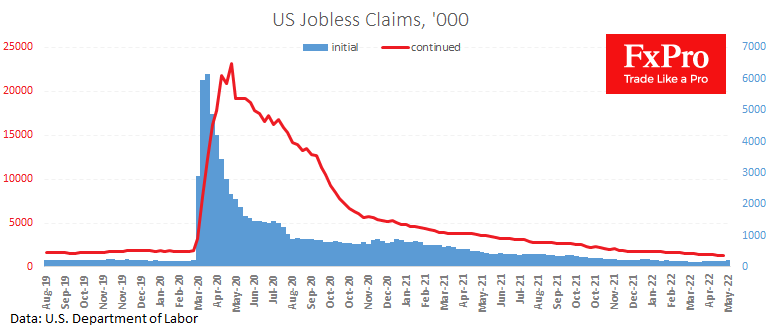
The US labour market is becoming increasingly tight, but at the same time, the rate of job alternation is increasing steadily.
The latest weekly data shows that the number of new jobless claims is dropping further to 1.317M, a new low since 1969 when the US population was 40% less than now.
At the same time, the number of initial claims last week stood at 218K against 197K a week earlier, continuing the upward trend of the previous two months.
Since the recurrence rates are methodically declining and the latest employment report noted an increase in employment, it is logical to assume that the rise in initial claims is due to people being more active and finding work quickly.
One of the secondary effects of the current labour market situation might be a continued high rate of wage growth. This is a good signal of economic activity. Still, it should also increase the vigilance of the hawks at the US Federal Reserve, setting them up to tighten the monetary policy nuts tighter and faster.
EUR/USD Mid-Day Outlook
Daily Pivots: (S1) 1.0425; (P) 1.0495 (R1) 1.0529; More...
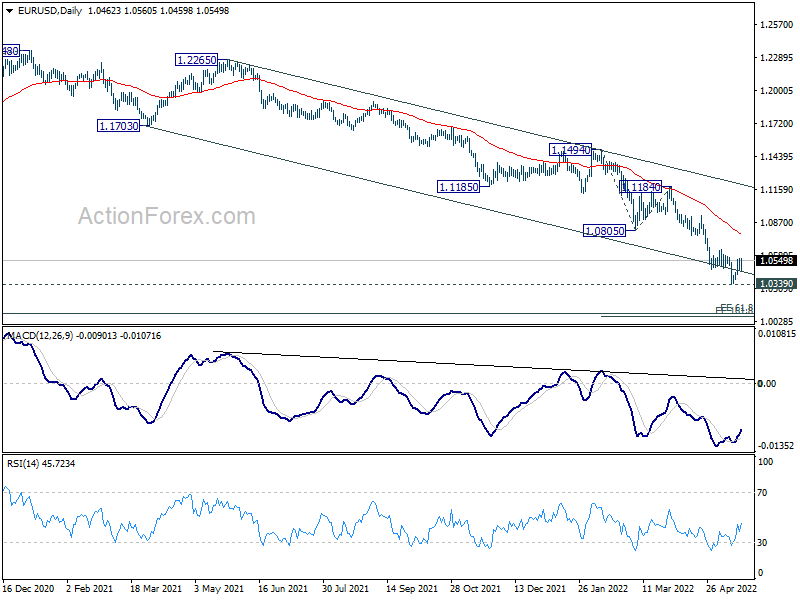
Intraday bias in EUR/USD remains neutral for the moment. Considering bullish convergence condition in 4 hour MACD, break of 1.0641 resistance will confirm short term bottoming at 1.0348, ahead of 1.0339 long term support. Intraday bias will be turned back to the upside for 1.0805 support turned resistance. On the downside, however, decisive break of 1.0339 will carry larger bearish implication and target 161.8% projection of 1.1494 to 1.0805 from 1.1184 at 1.0069.
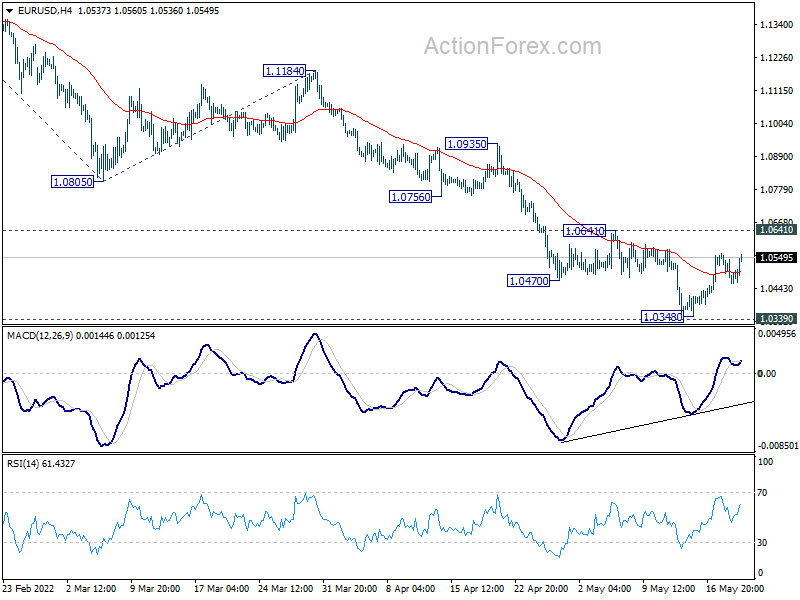
In the bigger picture, break of medium term channel support suggests downside acceleration. Current decline from 1.2348 (2021 high) is probably resuming long term down trend from 1.6039 (2008 high). Decisive break of 1.0339 will confirm this bearish case. Next target is 61.8% projection of 1.3993 to 1.0339 from 1.2348 at 1.0090. This will now remain the favored case as long as 1.0805 support turned resistance holds.
GBP/USD Mid-Day Outlook
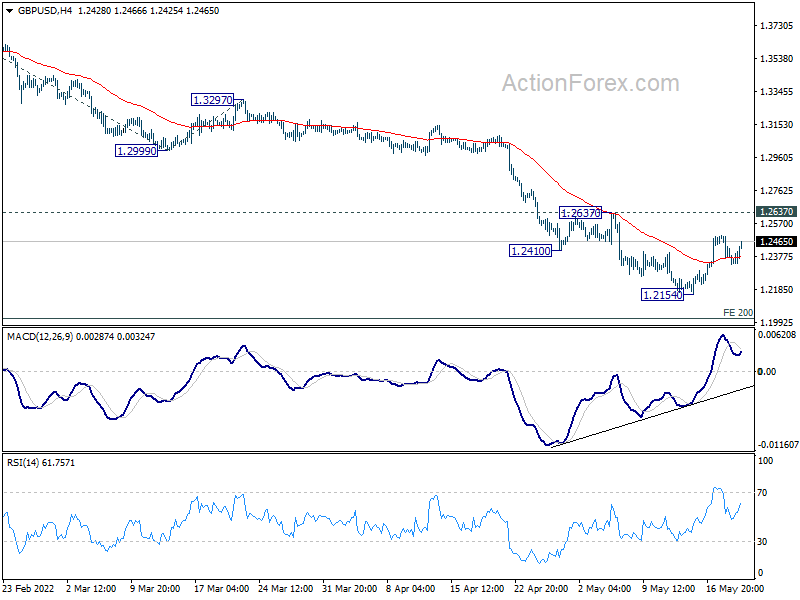
Daily Pivots: (S1) 1.2284; (P) 1.2392; (R1) 1.2455; More..
Intraday bias in GBP/USD remains neutral first. Further decline will remain in favor as long as 1.2637 resistance holds. On the downside, break of 1.2154 will resume the down trend from 1.4248 to 200% projection of 1.3641 to 1.2999 from 1.3297 at 1.2013. However, considering bullish convergence condition in 4 hour MACD, break of 1.2637 will confirm short term bottoming at 1.2154. Intraday bias will be turned back to the upside for 55 day EMA (now at 1.2796).
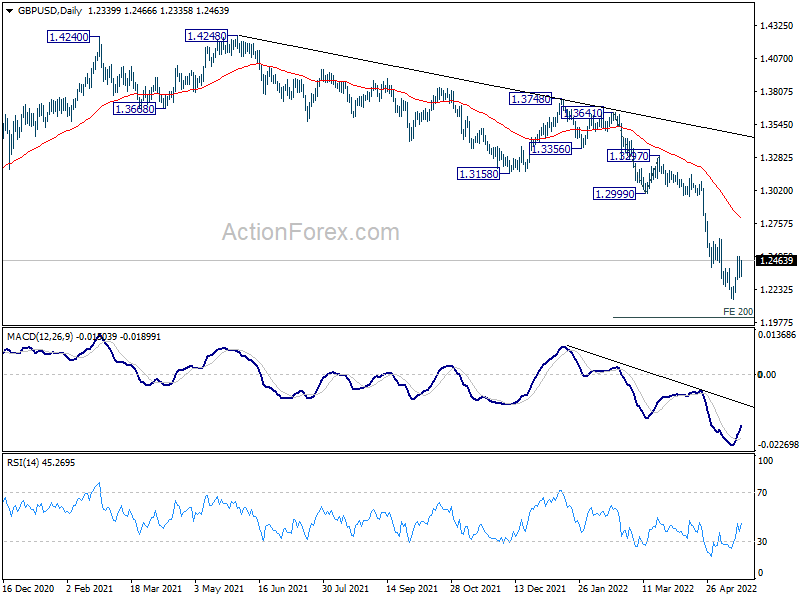
In the bigger picture, based on current momentum, fall from 1.4248 (2018 high) at least at the same degree as the rise from 1.1409 (2020 low). That is, fall from 1.4248 could be a leg inside the pattern from 1.1409, or resuming the longer term down trend. In either case, deeper decline is expected as long as 1.2999 support turned resistance holds. Next target is 1.1409 low.
USD/CHF Mid-Day Outlook
Daily Pivots: (S1) 0.9835; (P) 0.9910; (R1) 0.9959; More...
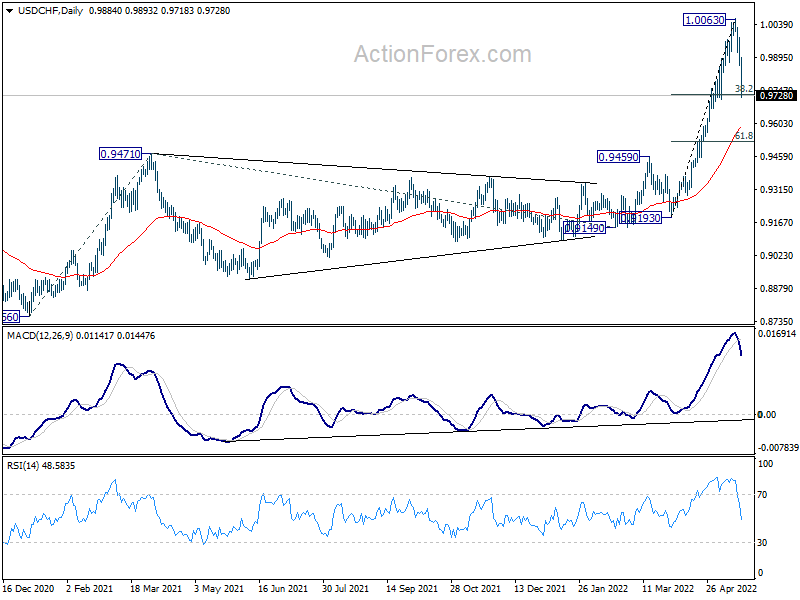
USD/CHF's pull back from 1.0063 extends lower today and there is no sign of bottoming yet. Intraday bias stays on the downside. Sustained break of 38.2% retracement of 0.9193 to 1.0063 at 0.9731 will target 55 day EMA (now at 0.9583). But downside should be contained by 61.8% retracement at 0.9525 to bring rebound. On the upside, above 0.9859 minor resistance will turn intraday bias neutral first.
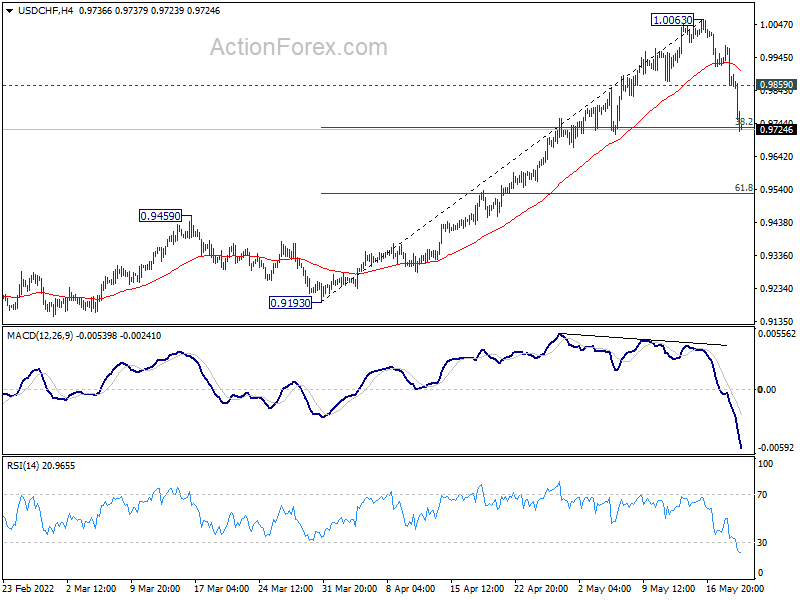
In the bigger picture, down trend from 1.0342 (2016 high) should have completed with three waves down to 0.8756 (2021 low) already. Rise from 0.8756 is likely a medium term up trend of its own. Next target is 161.8% projection of 0.8756 to 0.9471 from 0.9149 at 1.0306, which is close to 1.0342 (2016 high). This will remain the favored case as long as 0.9459 resistance turned support holds.
USD/JPY Mid-Day Outlook
Daily Pivots: (S1) 127.65; (P) 128.60; (R1) 129.18; More...
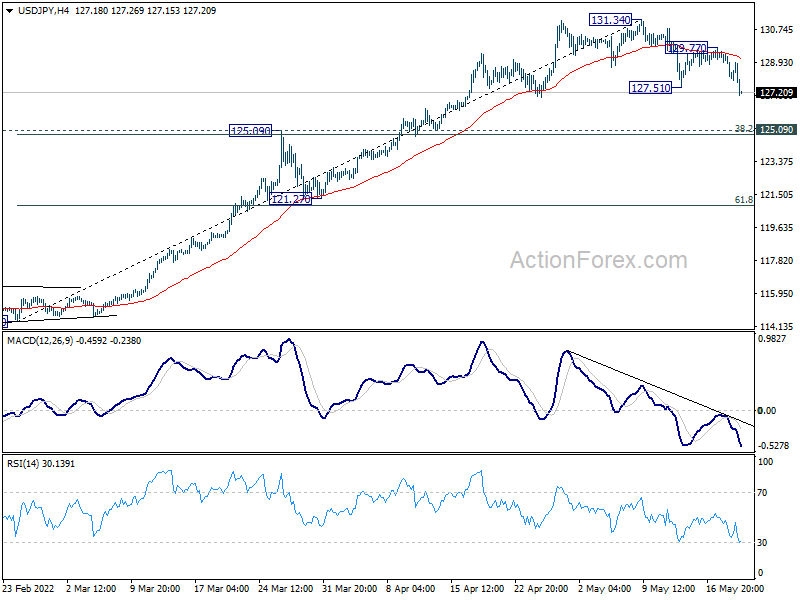
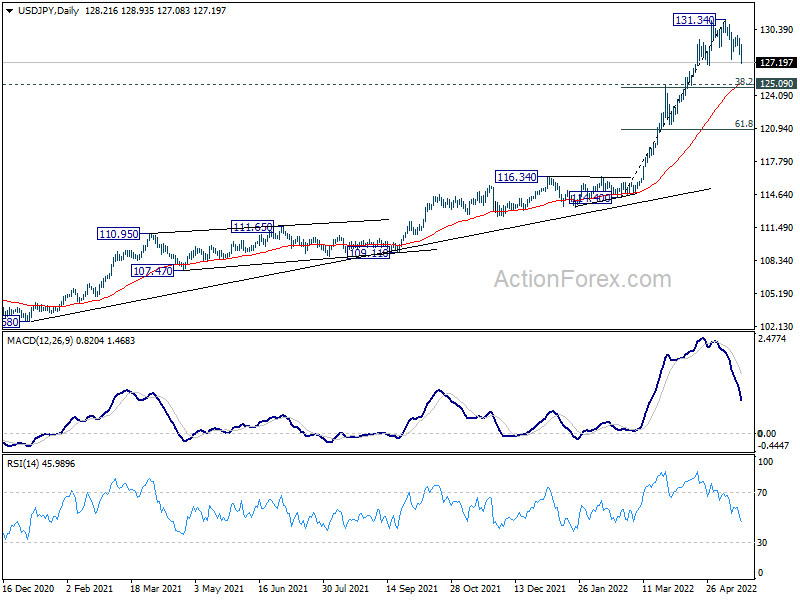
USD/JPY's correction from 131.34 resumed by breaking through 127.51 temporary low. Intraday bias is back on the downside for 125.09 cluster support (38.2% retracement of 114.40 to 131.34 at 124.86). Strong support is expected from there to contain downside to bring rebound. On the upside, break of 129.77 minor resistance will suggest that the correction is finished and bring retest of 131.34.
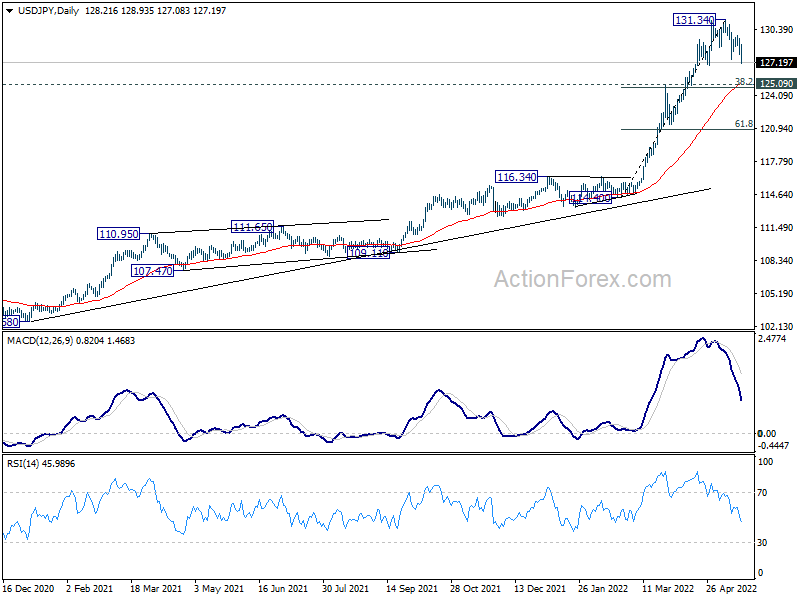
In the bigger picture, current rally is seen as part of the long term up trend form 75.56 (2011 low). Sustained trading above 61.8% projection of 75.56 (2011 low) to 125.85 (2015 high) from 98.97 at 130.04 will pave the way to 100% projection at 149.26, which is close to 147.68 (1998 high). For now, this will remain the favored case as long as 121.27 support holds.
Swiss Franc Staying as Winner, Yen Catching Up
Risk aversion is once again a clear main theme of the day, with European indexes in deep red while US futures point to extended selloff. Safe-haven flows are also pushing benchmark global yields lower, with Germany 10-year yield back at 0.9% while US 10-year yield is back below 2.8%. Swiss Franc is the overwhelming winner but Yen is also catching up. On the other hand, dollar is the worst performing one, followed by Canadian, Sterling and Euro. Aussie and Kiwi are mixed for now.
Technically, USD/JPY's correction from 131.34 resumed by breaking through 127.51 temporary low. Attention will now be on 1.0641 resistance in EUR/USD and 132.63 support in EUR/JPY. Break of the former will argue that Dollar is setting up itself for deeper broad based correction. On the other hand, Break of the latter will indicate that it's Yen's strength that is persisting.
In Europe, at the time of writing, FTSE is down -2.33%. DAX is down -1.74%. CAC is down -1.96%. Germany 10-year yield is down -0.110 at 0.918. Earlier in Asia, Nikkei dropped -1.89%. Hong Kong HSI dropped -2.54%. China Shanghai SSE rose 0.36%. Singapore Strait Times dropped -1.07%. Japan 10-year JGB yield dropped -0.0035 to 0.243.
US initial jobless claims rose to 218k, continuing claims dropped to 1.317m
US initial jobless claims rose 21k to 218k in the week ending May 14, above expectation of 202k. Four-week moving average of initial claims rose 8k to 199.5k.
Continuing claims dropped -25k to 1317k in the week ending May 7, lowest since December 27, 1969 when it was 1304k. Four-week moving average of continuing claims dropped -22.5k to 1362k, lowest since January 24, 1970 when it was 1361k.
ECB accounts: Forward guidance conditions for rate hike crucial for June meeting discussions
In the accounts of April 13-14, ECB said "members widely expressed concern over the high inflation numbers".
Against this background, "some members viewed it as important to act without undue delay in order to demonstrate the Governing Council's determination to achieve price stability in the medium term."
But other members argued that "adjusting the monetary policy stance too aggressively could prove counterproductive, as it would lower growth while inflation remained elevated because monetary policy was unable to address the immediate causes of high inflation"
All in all, "members widely shared the view that the gradual normalisation of the monetary policy stance... should be continued".
Overall, it was judged that "forward guidance conditions for an upward adjustment of the key ECB interest rates would become crucial for the policy discussion at the Governing Council's June meeting"
Japan exports rose 12.5% yoy in Apr, imports rose 28.2% yoy
Japan exports rose 12.5% yoy to JPY 8076B in April. Imports rose 28.2% yoy to JPY 8915B, a new record. Trade deficit came in at JPY 839B.
Trade with China shrank notably. China-bound shipments fell -5.9% yoy, the biggest drop since March 2020. Imports from China also fell -5.5% yoy, the most since September 2020. On the other hand, exports to the US jumped 17.8% yoy while imports rose 15.3% yoy.
In seasonally adjusted terms, exports rose 1.0% mom to JPY 7629B. Imports rose 7.9% mom to JPY 9248B. Trade deficit came in at JPY -1619B, larger than expectation of JPY -1520T.
Australia employment rose just 4k in Apr, unemployment at record 3.9%
Australia employment rose just 4k in April, missing expectation of 30k growth. Full time jobs rose 92.4k while part0time jobs dropped -88.4k.
Unemployment rate was unchanged at 3.9%, matched expectations. Participation rate dropped -0.1% to 66.3%. Monthly hours worked rose 23m hours, or 1.3% mom.
Bjorn Jarvis, head of labour statistics at the ABS, said, "3.9 per cent is the lowest the unemployment rate has been in the monthly survey. The last time the unemployment rate was lower than this was in August 1974, when the survey was quarterly."
USD/JPY Mid-Day Outlook
Daily Pivots: (S1) 127.65; (P) 128.60; (R1) 129.18; More...
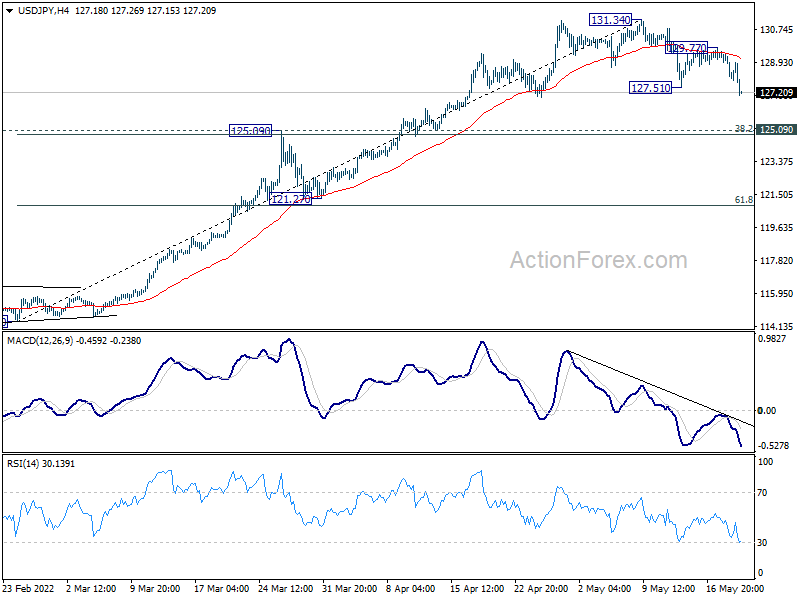
USD/JPY's correction from 131.34 resumed by breaking through 127.51 temporary low. Intraday bias is back on the downside for 125.09 cluster support (38.2% retracement of 114.40 to 131.34 at 124.86). Strong support is expected from there to contain downside to bring rebound. On the upside, break of 129.77 minor resistance will suggest that the correction is finished and bring retest of 131.34.
In the bigger picture, current rally is seen as part of the long term up trend form 75.56 (2011 low). Sustained trading above 61.8% projection of 75.56 (2011 low) to 125.85 (2015 high) from 98.97 at 130.04 will pave the way to 100% projection at 149.26, which is close to 147.68 (1998 high). For now, this will remain the favored case as long as 121.27 support holds.
Economic Indicators Update
| GMT | Ccy | Events | Actual | Forecast | Previous | Revised |
|---|---|---|---|---|---|---|
| 22:45 | NZD | PPI Input Q/Q Q1 | 3.60% | 1.00% | 1.10% | 1.20% |
| 22:45 | NZD | PPI Output Q/Q Q1 | 2.60% | 1.30% | 1.40% | 1.50% |
| 23:50 | JPY | Trade Balance (JPY) Apr | -1.62T | -1.52T | -0.90T | -1.02T |
| 23:50 | JPY | Machinery Orders M/M Mar | 7.10% | 3.70% | -9.80% | |
| 01:30 | AUD | Employment Change Apr | 4.0K | 30.0K | 17.9K | |
| 01:30 | AUD | Unemployment Rate Apr | 3.90% | 3.90% | 4.00% | 3.90% |
| 08:00 | EUR | Eurozone Current Account (EUR) Mar | -1.6B | 20.3B | 20.8B | 15.7B |
| 11:30 | EUR | Eurozone ECB Meeting Accounts | ||||
| 12:30 | CAD | New Housing Price Index M/M Apr | 0.30% | 1.00% | 1.20% | |
| 12:30 | CAD | Raw Material Price Index Apr | -2.00% | 10.30% | 11.80% | |
| 12:30 | CAD | Industrial Product Price M/M Apr | 0.80% | 3.70% | 4.00% | 3.40% |
| 12:30 | USD | Initial Jobless Claims (May 13) | 218K | 202K | 203K | 197K |
| 12:30 | USD | Philadelphia Fed Manufacturing Survey May | 2.6 | 16.2 | 17.6 | |
| 14:00 | USD | Existing Home Sales Apr | 5.63M | 5.77M | ||
| 14:30 | USD | Natural Gas Storage | 90B | 76B |