

Sample Category Title
EUR/GBP Weekly Outlook
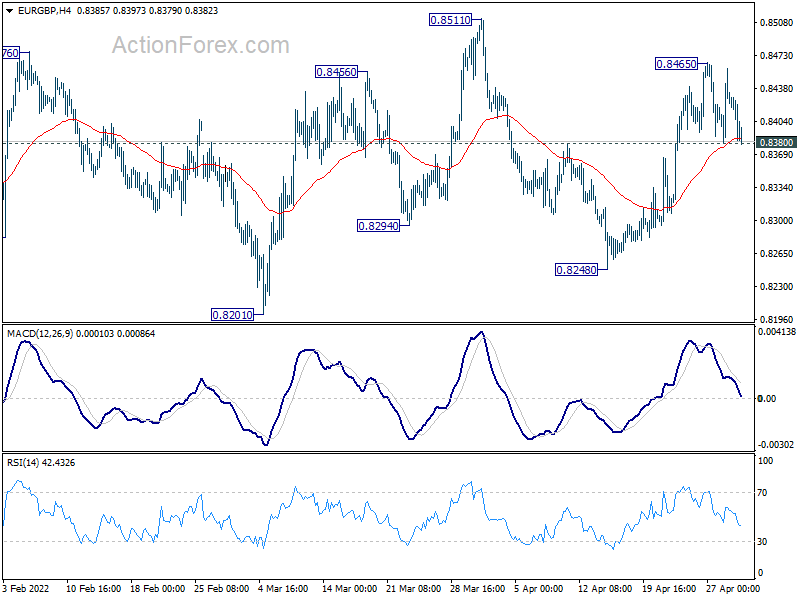
EUR/GBP retreated after hitting 0.8465 last week. Initial bias is neutral this week first. On the upside, above 0.8465 will target 0.8511 resistance. Further break of 0.8511 will reaffirm that 0.8201 is a medium term bottom, and target 0.8697 medium term fibonacci level next. However, on the downside, break of 0.8380 minor support will turn bias back to the downside for 0.8248 support instead.
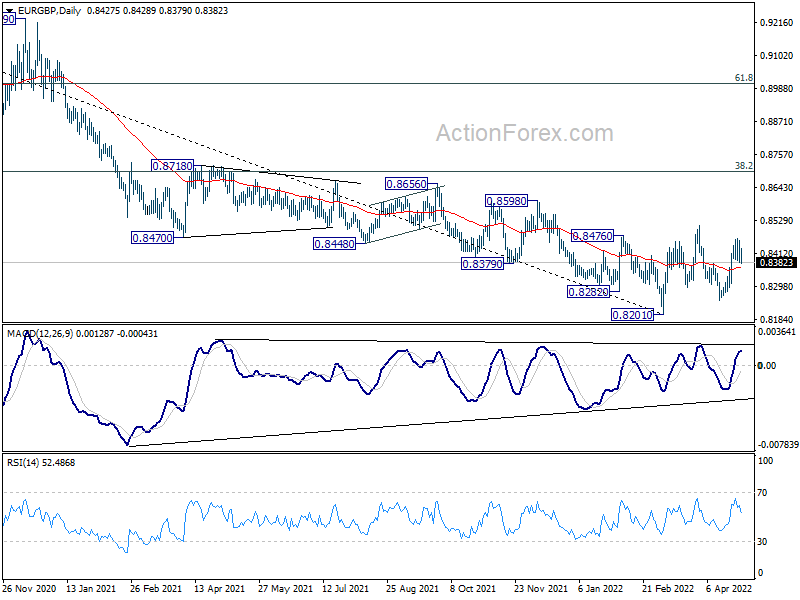
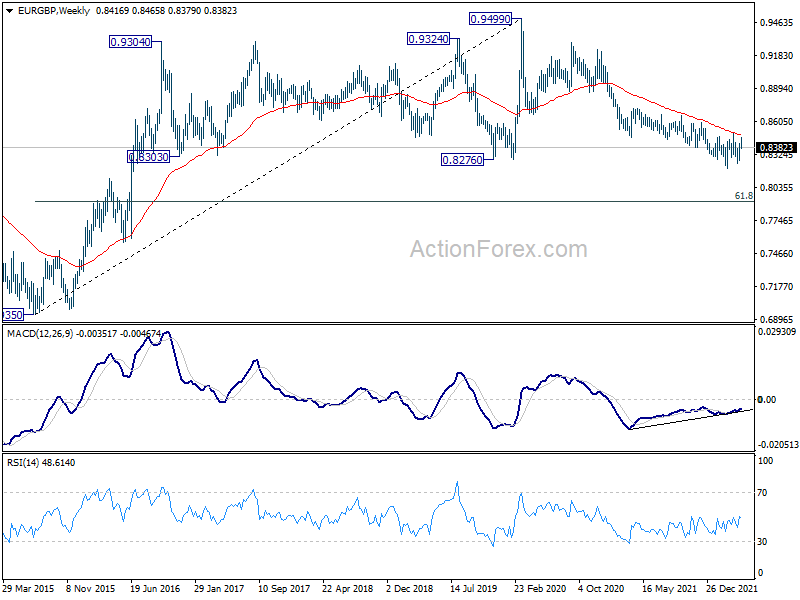
In the bigger picture, a medium term bottom could be in place at 0.8201, on bullish convergence condition in daily and weekly MACD. Rise from there could either be a correction to the down trend from 0.9499 (2020 high), or a medium term up trend itself. In either case, further rise should be seen to 38.2% retracement of 0.9499 to 0.8201 at 0.8697. Sustained break there will target 61.8% retracement at 0.9003.
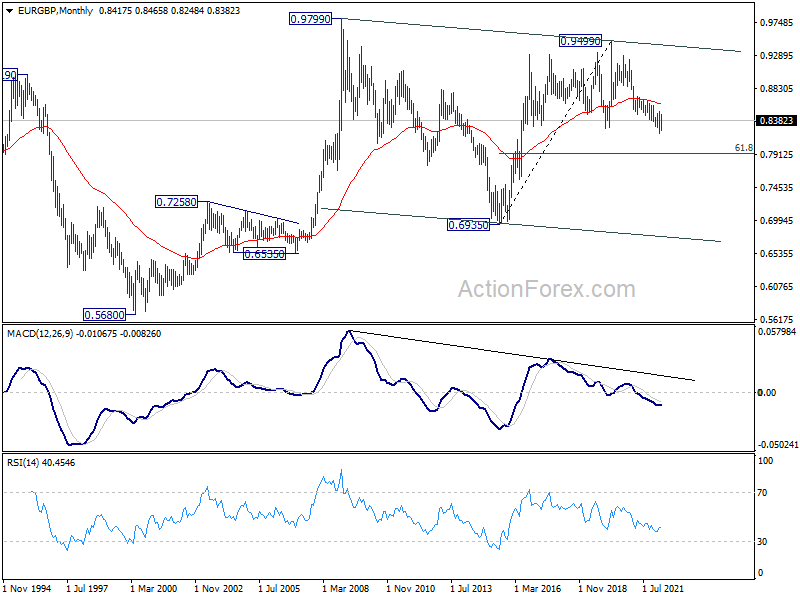
In the long term picture, current development argues that fall from 0.9499 is probably the third leg of the pattern from 0.9799 (2008 high). Sustained break of 61.8% retracement of 0.6935 to 0.9499 at 0.7917 will pave the way back to 0.6935 (2015 low) and probably below.
EUR/AUD Weekly Outlook
EUR/AUD retreated after edging higher to 1.5053 last week. But downside is contained by 1.4687 so far. Initial bias remains neutral this week first, and further rise is mildly in favor. On the upside, break of 1.5053 will resume the rebound from 1.4318 to target 61.8% retracement of 1.6223 to 1.4318 at 1.5495. However, firm break of 1.4687 will argue that the rebound has completed and bring retest of 1.4318 low.
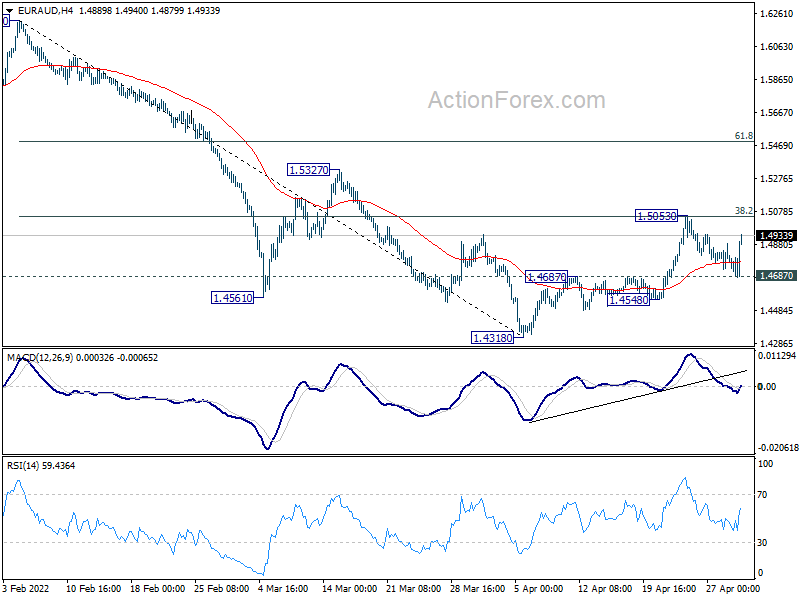
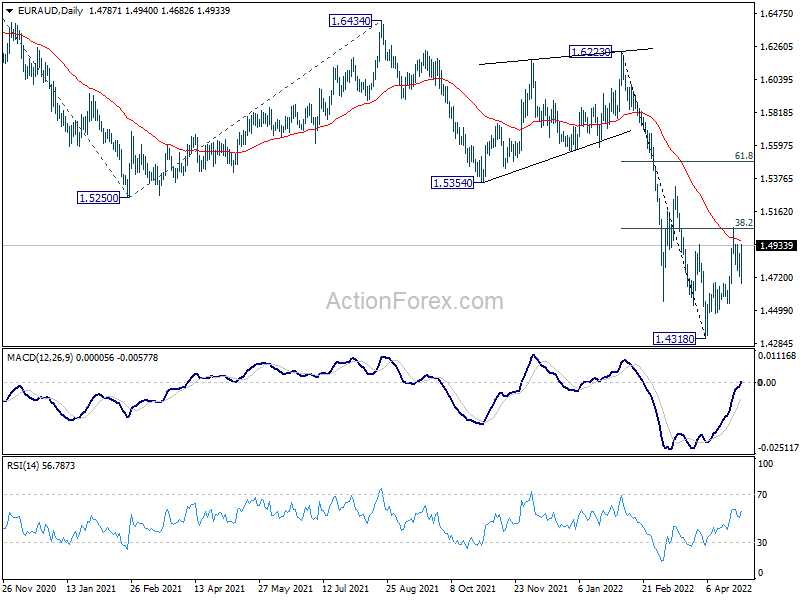
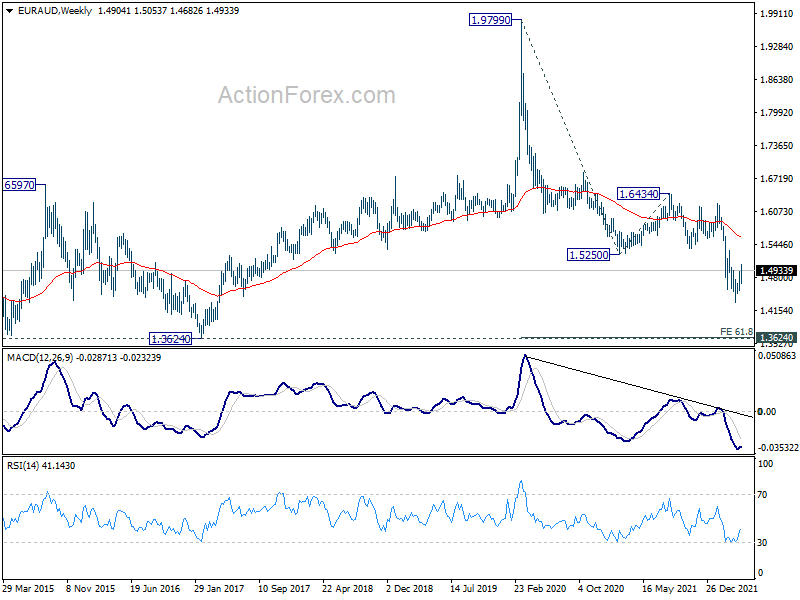
In the bigger picture, as long as 1.5354 support turned resistance holds, larger down trend form 1.9799 (2020 high) is still expected to continue. On resumption, next target is 61.8% projection of 1.9799 to 1.5250 from 1.6434 at 1.3623, which is close to 1.3624 long term support (2017 low). However, firm break of 1.5354 will indicate medium term bottoming and bring stronger rally.
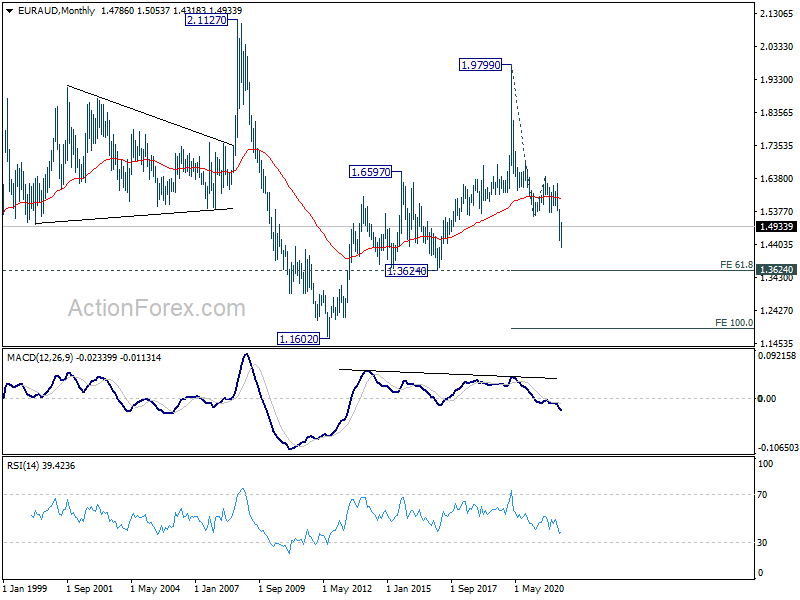
In the longer term picture, fall from 1.9799 (2020 high) is seen as the third leg of the pattern from 2.1127 (2008 high). Deeper fall should be seen to 1.3624 support. Decisive break there would pave the way back to 1.1602 (2012 low).
EUR/CHF Weekly Outlook
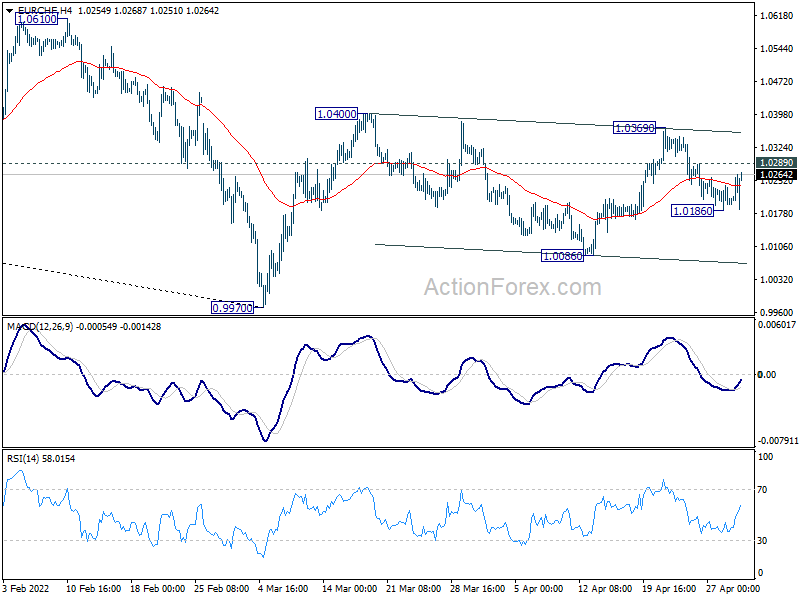
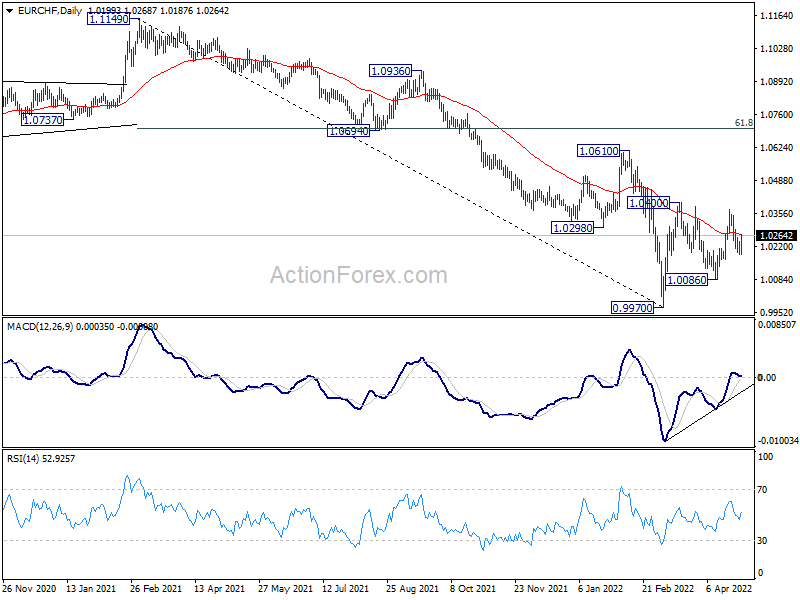
EUR/CHF extended the corrective pattern from 1.0400 with another fall last week, and dipped to 1.0186. As a temporary low was formed there, initial bias is neutral this week first. Another decline cannot be ruled out with 1.0289 minor resistance intact. Below 1.0186 will target 1.0086 support. On the upside, above 1.0289 will target 1.0369/0400 resistance zone. Firm break there will resume the rebound from 0.9970 to 1.0610 structural resistance.
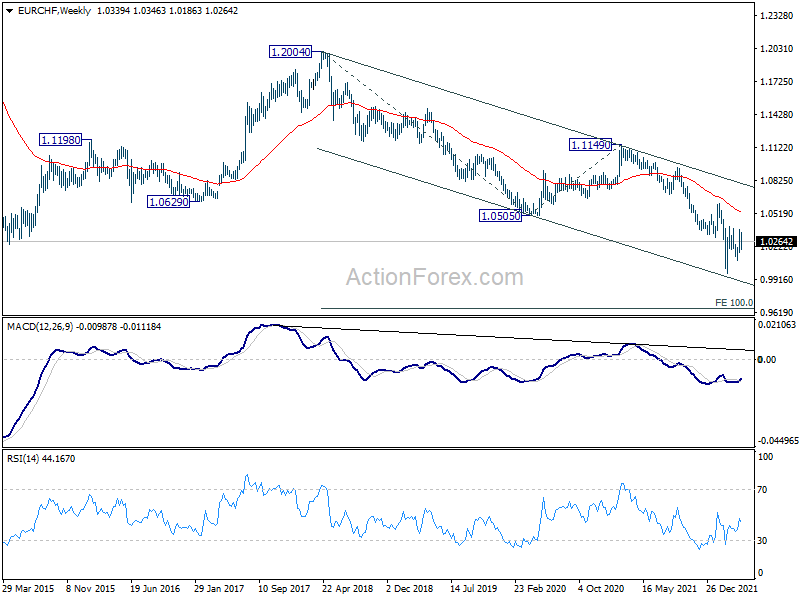
In the bigger picture, as long as 1.0505 support turned resistance (2020 low) holds, long term down trend from 1.2004 (2018 high) is expected to continue. Next target is 100% projection of 1.2004 to 1.0505 to 1.1149 at 0.9650. However, firm break of 1.0505 will suggest medium term bottoming, and bring stronger rebound towards 1.1149 structural resistance.
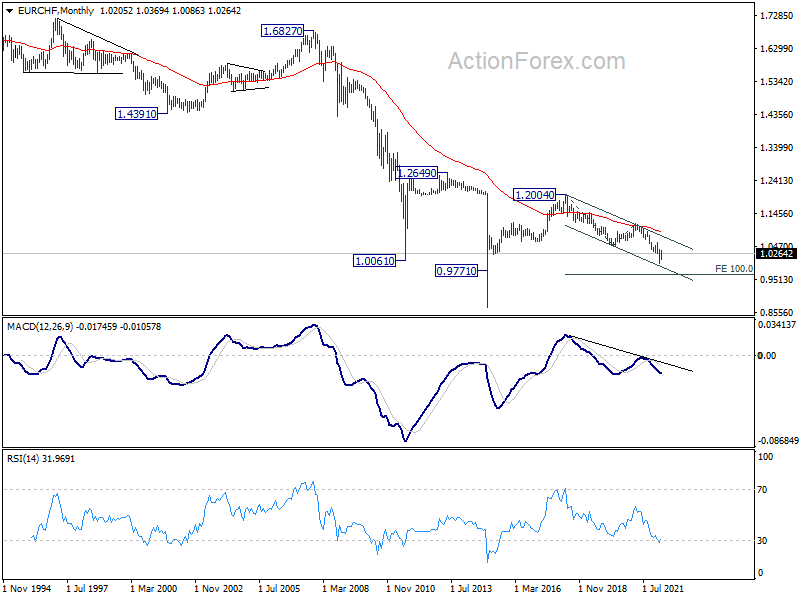
In the long term picture, capped below 55 month EMA, EUR/CHF is seen as extending the multi-decade down trend. There is no prospect of a bullish reversal until some sustained trading above the 55 month EMA (now at 1.0891).
Dollar Index Hit Two-Decade High as Focus Turns to Fed Hike
Dollar ended up as the strongest one last week, having the best week since 2015 and with Dollar index hitting a two-decade high. Though, the rally somewhat slowed towards the end of the week. It could be a result of month end flow or traders' cautiousness ahead of Fed. But in any case, there is no sign of topping yet. Yen ended as the second strongest, with help from risk-off sentiment and consolidation in treasury yields.
On the other hand, risk aversion and concerns over China hammed Aussie and Kiwi. Euro was not too far away as Russian invasion continued and more sanctions are underway. Sterling and Swiss Franc were also poor performers while Canadian Dollar was mixed.
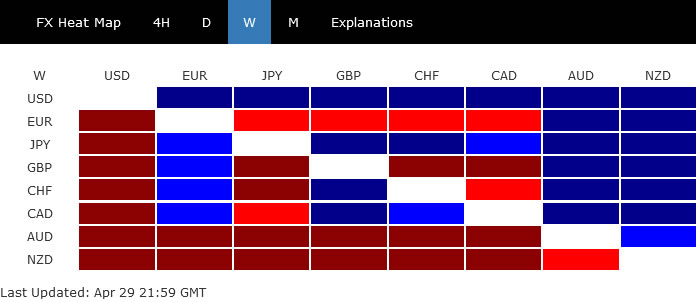
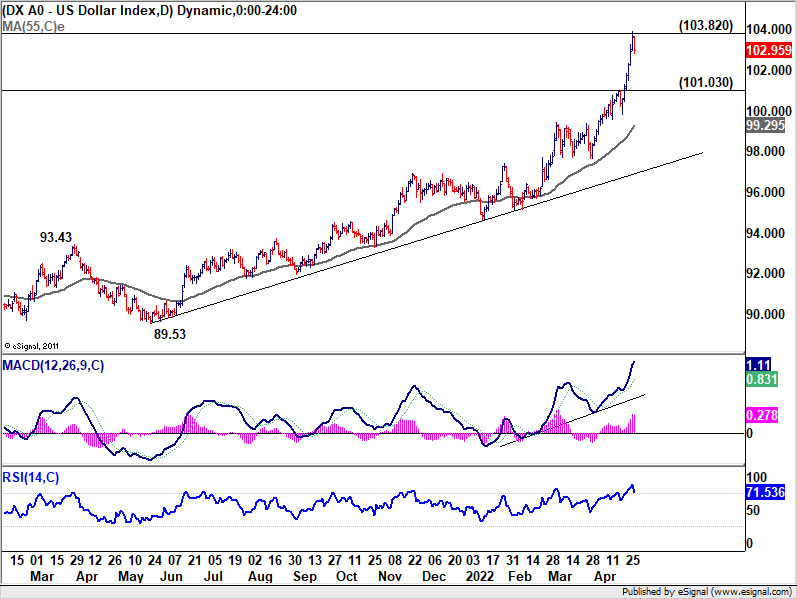
Dollar index hit the highest level since 2002, ahead of Fed hike
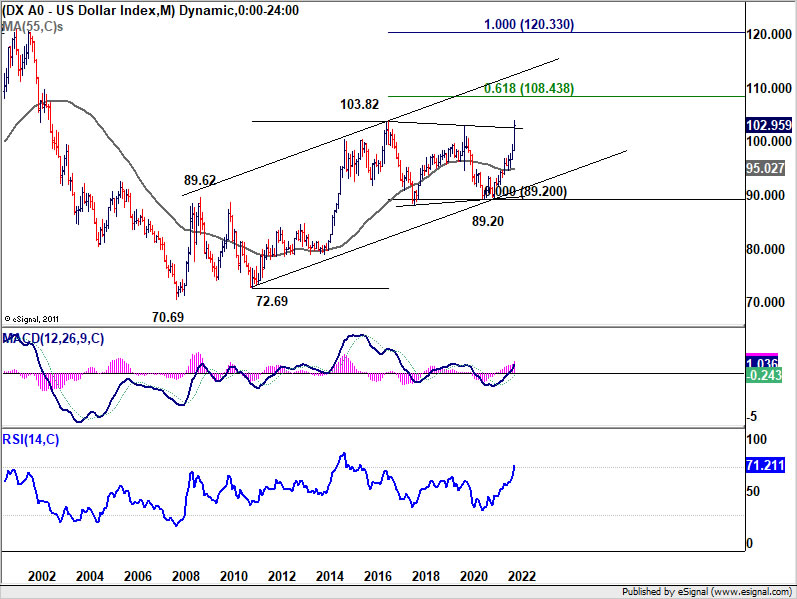
Dollar index surged to as high as 103.92 last week, hitting the highest level since 2002. But it failed to close above long term resistance at 103.82, and ended at 102.95 instead. The greenback is partly supported by expectations of aggressive rate hike by Fed., and partly by risk aversion. However, Dollar has apparently lost some momentum against Yen, and that somewhat capped the upside of DXY.
A 50bps increase in the federal funds rate on coming Wednesday, May 4, is a done deal. The question is whether Fed would deliver an even larger increase of 75bps in June, as currently priced in by the markets. Chair Jerome Powell is unlikely to be concrete in answer this question. Instead, as incoming data come through, in particular the non-farm payroll report this Friday, Fed officials would start to adjust their tune to shape the expectations for June.
Technically, near term outlook will stay bullish as long as 101.03 support holds. Sustained trading above 103.82 (2016 high) will confirm resumption of whole up trend from 70.69 (2008 low). Next target will be 61.8% projection of 72.69 to 103.82 from 89.20 at 108.43. However, break of 101.03 will indicate initial rejection by 103.82, and bring near term correction first, before staging another rally.
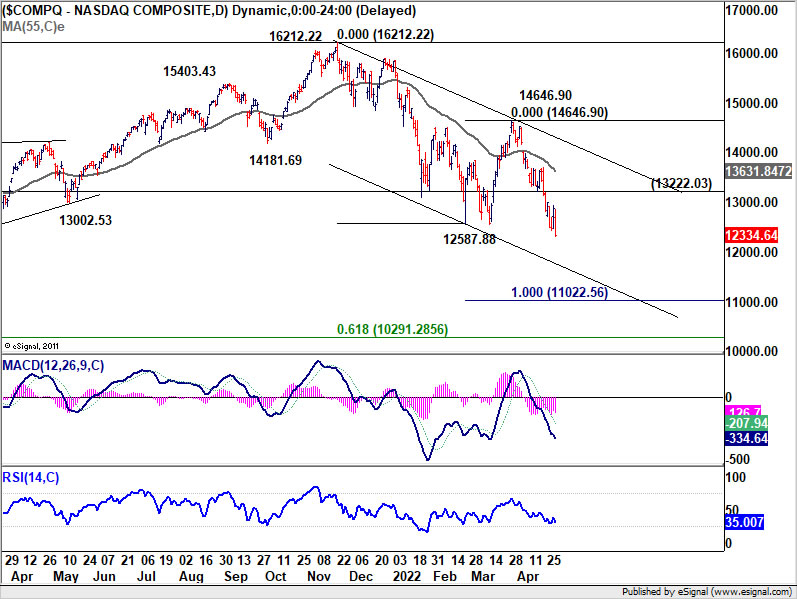
NASDAQ resumes medium term correction, SPX 500 to follow soon
Yen was initially pressured after BoJ doubled down on its commitment to defend 0.25% cap on 10-year JGB yield. The central bank also maintained a dovish bias, pledging to ease without hesitation if needed. Yet, risk aversion gave Yen a lifeline towards the end of the week. That in turn capped USD/JPY's rally and limited the greenback's momentum. Based on near term bearish outlook in both NASDAQ and S&P 500, such pattern could continue for a while.
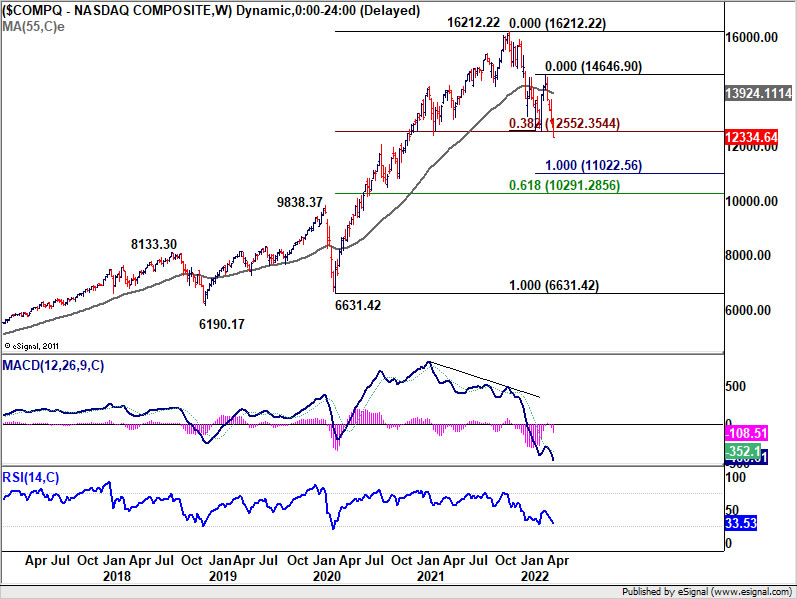
Talking about risk-off sentiment, NASDAQ dived through 12587.88 last week to resume the corrective decline from 16212.22 high, and hit a new 2022 low. Near term outlook will now remain bearish as long as 13222.03 resistance holds, for 100% projection of 100% projection of 16212.22 to 12587.88 from 14646.90 at 11022.56 next.
Nevertheless, there should be strong support around this 11022.56 level, and above 61.8% retracement of 6631.42 to 16212.22 at 10291.28 to contain downside to finish the correction.
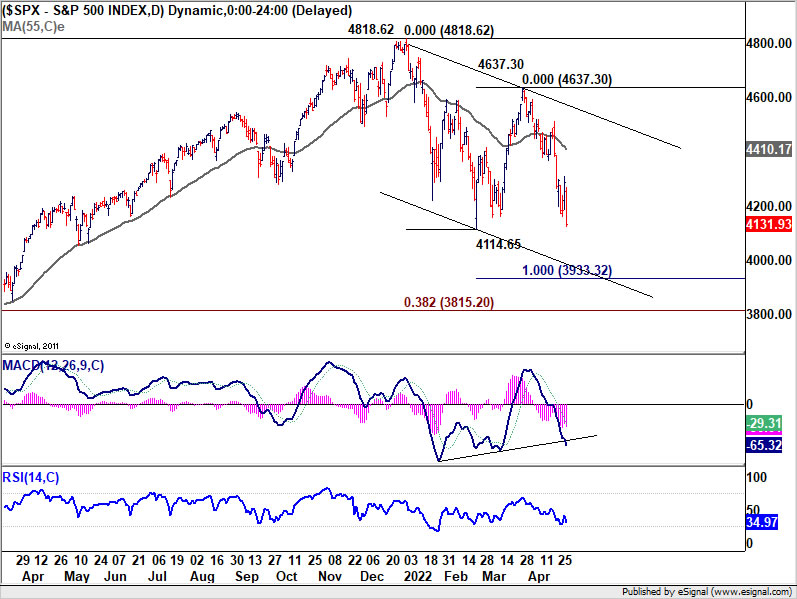
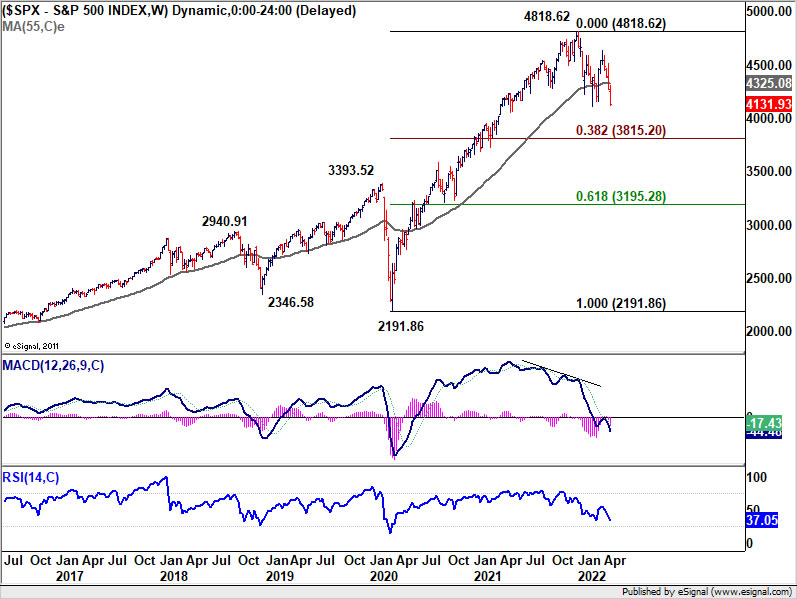
S&P 500 is still holding above corresponding support at 4114.65 for now. But it looks vulnerable. Firm break there will resume the correction from 4818.62, and target 100% projection of 4818.62 to 4114.65 from 4637.30 at 3933.32. For now, strong support is expected from 38.2% retracement of 2191.86 to 4818.62 at 3815.20 to contain downside to finish the correction.
US 10-year yield in consolidation, staying bullish for 3% and above
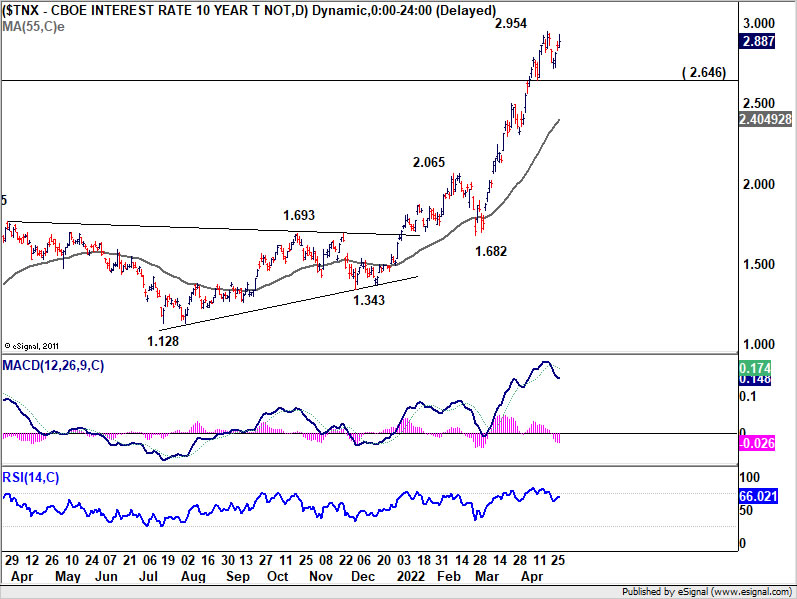
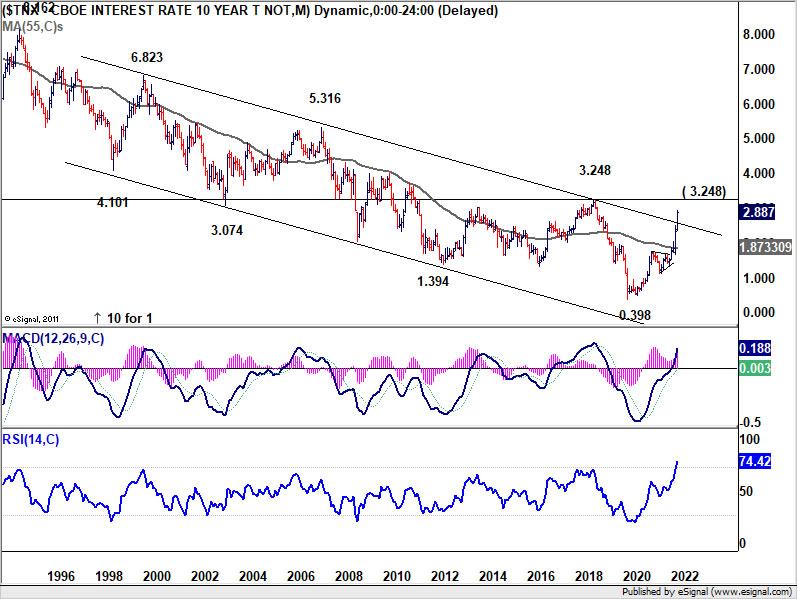
The consolidations in US treasury yield also helped stabilize Yen. 10-year yield turned into consolidation after hitting 2.954. More sideway trading could be seen for the near term, but outlook will remain bullish as long as 2.646 support holds. The key hurdle is the trend defining long term resistance at 3.248 (2018 high), which is not expected to be taken out decisively on first attempt. TNX could continue to lose upside momentum on next rise, and starts to feel heavy above 3% handle. Any extended consolidation or correction in TNX would also help Yen recover.
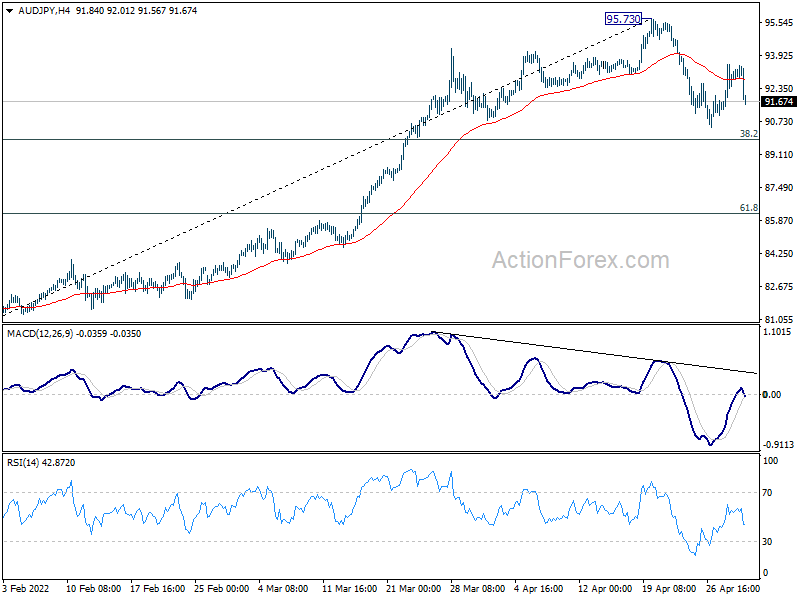
AUD/JPY extending consolidation from 95.73
Australian Dollar was under some pressure even though RBA is now expected to pull ahead the first rate hike to the coming Tuesday, and deliver another one in June. The Aussie was weighed down by overall risk sentiment, concern over China's lockdowns, and weakness in both Chinese stocks and Yuan.
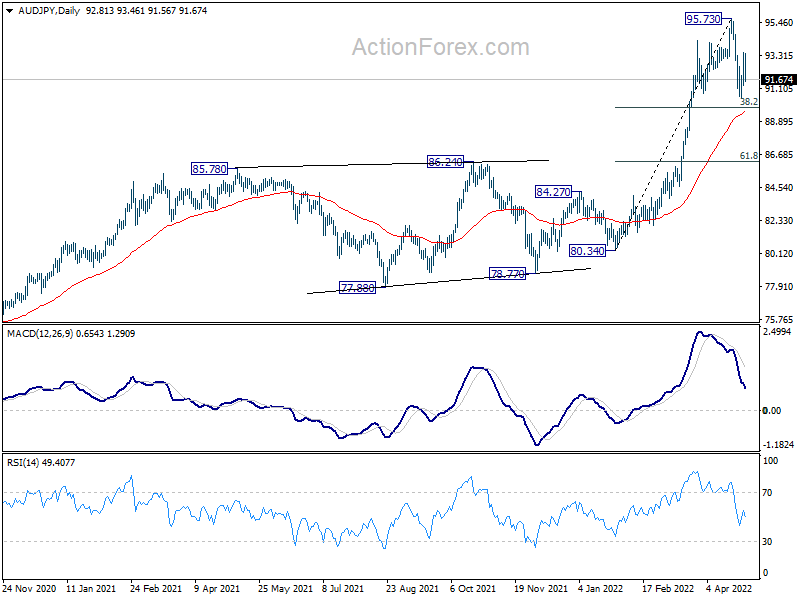
AUD/JPY extended the corrective pattern from 95.37 last week, on the above developments. Outlook isn't too bearish, nonetheless, as it's just consolidating recent rally from 80.34. Deeper fall could be seen to 38.2% retracement of 80.34 to 95.73 at 89.85. But strong support should be seen there, which is close to 55 day EMA (now at 89.51) to bring rebound. However, firm break of 89.85 would be a hint of bigger turn in overall sentiment.
EUR/USD Weekly Outlook
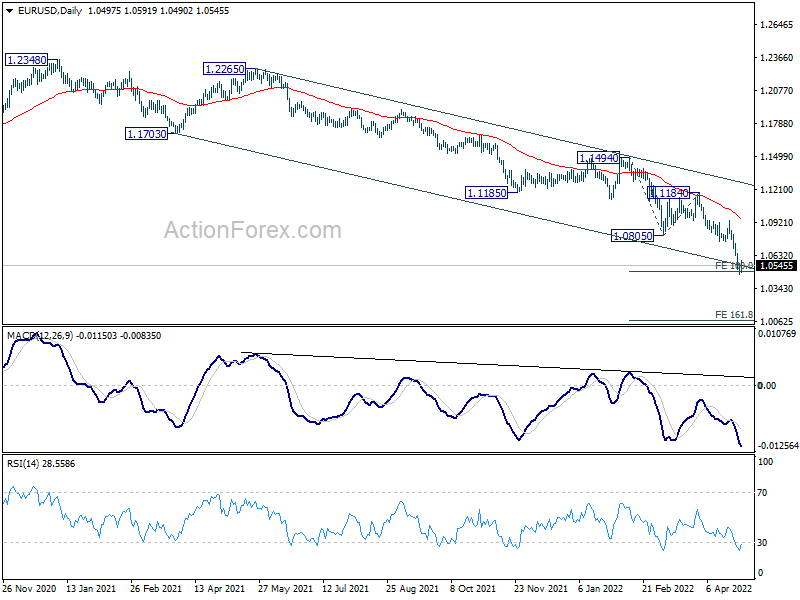
EUR/USD's down trend resumed last week and hit as low as 1.0470. As a temporary low was formed, initial bias is neutral this week for some consolidations. Upside of recovery should be limited by 1.0756 support turned resistance to bring fall resumption. Break of 1.0470 will target 161.8% projection of 1.1494 to 1.0805 from 1.1184 at 1.0069.
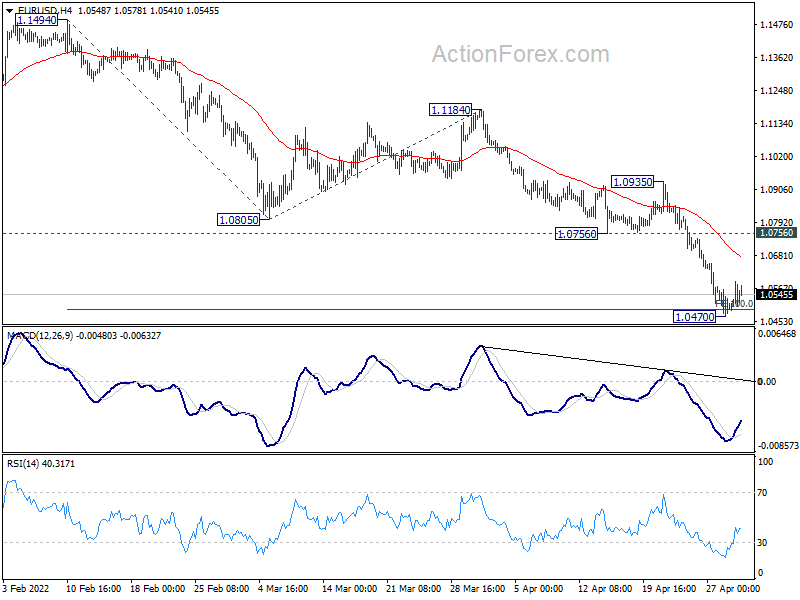
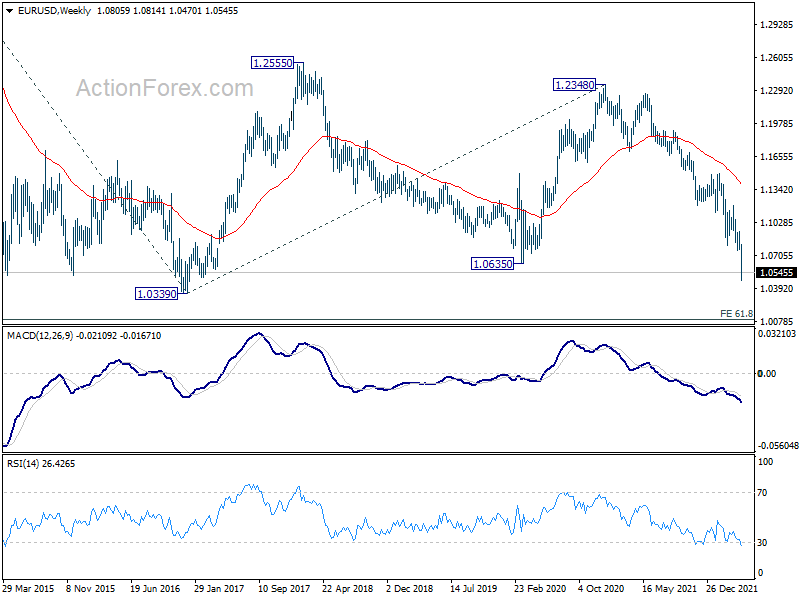
In the bigger picture, the decline from 1.2348 (2021 high) is expected to continue as long as 1.1185 support turned resistance holds. The break of 1.0635 (2020 low) now raises the chance that it's resuming long term down trend from 1.6039 (2008 high). Retest of 1.0339 (2017 low) low should be seen next. Decisive break there will confirm this bearish case.
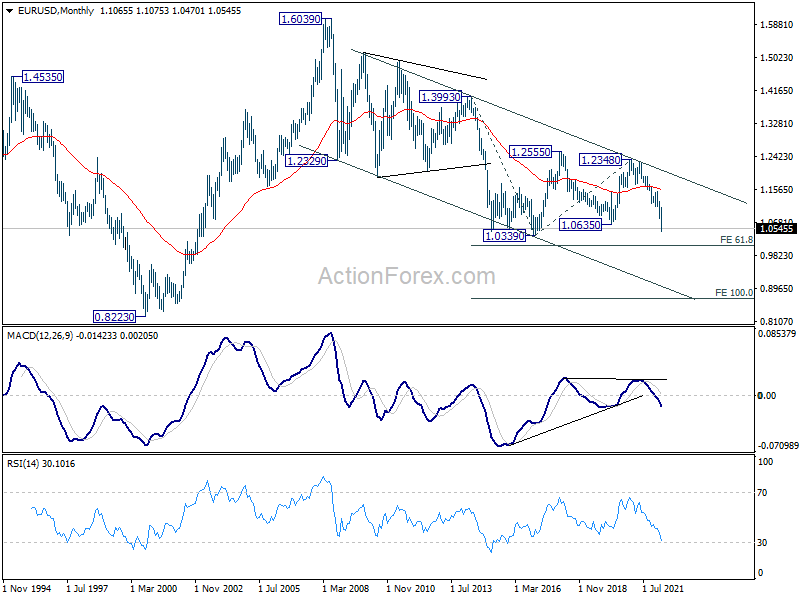
In the long term picture, current development suggests that long term down trend from 1.6039 (2008 high) is ready to resume. Break of 1.0339 will target 61.8% projection of 1.3993 to 1.0339 from 1.2348 at 1.0090. Decisive break there could bring downside acceleration towards 100% projection at 0.8694.
Summary 5/2 – 5/6
Monday, May 2, 2022
[php_everywhere instance="1"]
Tuesday, May 3, 2022
[php_everywhere instance="2"]
Wednesday, May 4, 2022
[php_everywhere instance="3"]
Thursday, May 5 2022
[php_everywhere instance="4"]
Friday, May 6, 2022
[php_everywhere instance="5"]
Emerging Risks Could Submerge Global Growth
Summary
In our April International Economic Outlook, we highlighted how China's commitment to its "Zero-COVID policy is a key theme as well as a major risk to the 2022 global economic outlook. Lockdowns, in our view, make China's official GDP target of 5.5% unreachable, and we forecast China's economy to grow 4.5% this year. However, risks around that forecast are tilted to the downside, which in turn, tilts global growth prospects to the downside as well. Given China's stature within the global economy, negative local developments tend to cause ripple effects across the emerging markets. In this report, we update our China Sensitivity Analysis and determine that most of the larger and systemically important emerging economies are sensitive to developments in China. Should China's economy decelerate more than we currently forecast and contagion risks materialize the way our framework suggests, this year could mark the slowest pace of global expansion since the aftermath of the Global Financial Crisis in 2009.
China Contagion To Be Felt Globally and Locally
In our April International Economic Outlook, we noted how COVID-related developments in China have become a key theme as well as a major risk to the 2022 global economic outlook. Chinese authorities commitment to the Zero-COVID policy will likely weigh heavily on local economic activity, and in turn, we believe could have an impact on 2022 global GDP prospects. We also highlighted in our April Economic Outlook that China's official 2022 GDP target of 5.5% is, in our view, unlikely to be reached. We believe the combination of harsh COVID lockdowns, poor sentiment toward China's financial markets, and a still deteriorating real estate sector should result in China's economy growing 4.5% this year. Assuming our forecast is accurate, excluding 2020 due to the initial impact of COVID, China's economy could grow at the slowest pace since the aftermath of the Tiananmen Square protests in 1990. The economic deceleration in China is one of the key drivers of our revised, and more pessimistic, outlook for global GDP growth. Given the economic slowdown in China, and also the collapse in Russia's economy as well as subsequent impacts from the war in Ukraine, we no longer expect the global economy to grow at an above trend rate this year. We now forecast the global economy to grow just 3% in 2022, well below the consensus forecast of 3.5%, and below the IMF's latest updated forecast of 3.6%.
In our view, China's growth prospects are still tilted toward slower growth than our 4.5% target, which could mean an even slower pace of global growth as well. The COVID outbreak has spread to Beijing, and while mass testing protocol has been implemented, citywide lockdowns have been avoided. Beijing lockdowns are still possible, and even though infections have somewhat stabilized in Shanghai, the timing around when current restrictions could be lifted is uncertain. Slower China GDP growth in isolation would likely have negative repercussions for global economic growth; however, a decelerating Chinese economy tends to result in contagion across the emerging markets, and these potential ripple effects worry us. There are many emerging market economies that are tightly connected to China via trade linkages, and could experience their own growth slowdowns via reduced demand or supply chain disruptions. In addition, a growth slowdown in China typically leads to elevated volatility in local asset prices. This financial market volatility has already started in China, but is spreading across the emerging markets. Should China's economy deteriorate further, we would expect the recent weakness across emerging market currencies and fall in local equities to pick up pace. Weak currencies could prompt central banks to extend monetary tightening cycles in an effort to defend the value of their currencies, which could dampen local growth prospects. Declining equity prices could keep consumers on the sidelines, and result in softer consumption and overall output.
Against this backdrop, we have updated our China sensitivity analysis to determine how sensitive emerging market countries are to China, and how global GDP growth could be impacted. Our table includes indicators such as exports to China as a share of GDP as well as emerging market currency and equity betas (i.e.: a statistical measure of sensitivity) to the renminbi and Shanghai composite equity index. In this update, we also include import exposure from China as a share of GDP. While always large, China's role as a major supplier and exporter has risen over the past two years. Now that new lockdowns have been imposed in Shanghai as well as port cities, prolonged and renewed supply chain disruptions could occur. As we have seen over the past two years, supply chain disruptions could have negative growth implications, especially for countries that import a sizable amount of goods from China.
April 2022: China Sensitivity Update
Our framework reveals that many of the larger and more systemically important emerging market countries are very sensitive to China. In that sense, looking at the "Overall China Sensitivity" column of the table below, our framework identifies South Korea, Singapore, Chile, South Africa and Russia as "Highly Sensitive" to China. As a reminder, a red box indicates a country is "Highly Sensitive" to each indicator, while an orange suggests "Moderately Sensitive" and a green "Little Sensitivity". In the case of the "Highly Sensitive" countries, with the exception of Russia, all of these countries are heavily dependent on Chinese demand. Exports to China make up a sizable chunk of each country's GDP, and should a more material China slowdown occur, these countries would likely see the export component of their economies soften sharply. While technically, lower imports should boost a country's overall output, with lockdowns spreading and supply chains still fragile, imports from China could be a vulnerability. Long lead times could disrupt value chains and delay the creation of end products. In that sense, reliance on imports from China for critical components could act as a drag on an economy's GDP as well. Most of the "Highly Sensitive" countries are reliant on imports from China, with South Africa and Russia being the exceptions.
Local financial markets in each "Highly Sensitive" country also respond to moves in China's asset prices if we look at the "Currency Beta" and "Equities Beta" columns. As far as how the betas work, for example, a beta of +0.66 for the Korean won means that when the Chinese renminbi moves 1%, the Korean won tends to move 0.66% in the same direction. So, if the renminbi depreciates 1%, the Korean won should weaken 0.66% on average. The same logic applies for the equities beta as well. Most of the overall "Highly Sensitive" countries have elevated betas, meaning their currencies and equity indices are likely to experience extreme volatility in the event China's currency and local equities selloff. These countries could find themselves in a position where their central banks have to tighten monetary policy aggressively to defend the value of their currencies, which should weigh on local GDP growth. On the other hand, a selloff in equities could disrupt spending patterns via sentiment if consumers get nervous about their household finances. Lower consumption would be another potential drag on GDP growth across each of these countries.
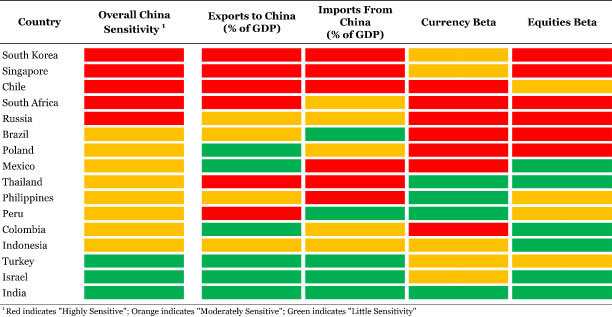
Countries our framework identifies as "Moderately Sensitive" to China are also some of the larger and economically important developing economies. Again looking at the "Overall China Sensitivity" column, countries such as Brazil, Poland and Mexico may be "Moderately Sensitive", but by no means are their economies not insignificant contributors to global growth. Further down the column, the economies of Peru, Colombia and Indonesia are also somewhat sizable in a global context. India, however, is arguably one of the most significant developing market contributors to global growth. Our framework suggests India's economy is relatively insulated from developments in China's economy and local financial markets, and may not be as affected. India has small trade linkages with China and is not reliant on Chinese demand, nor does the country source a sizable amount of imports from China. In addition, the Indian rupee and Sensex equity index are not influenced by volatility in China's local financial markets. While not as large or systemically important as India, the same dynamics exist in Israel and Turkey. Both the Israeli and Turkish economies do not have material trade linkages to China, while neither the shekel nor lira are particularly influenced by movements in the renminbi or Shanghai equity index. In that context, our framework suggests Israel and Turkey are also relatively isolated from China.
Watch Out For Global Growth of Just 2.6%
As mentioned, we believe China's growth prospects are tilted to the downside. We acknowledge President Xi's comments that authorities will do more to support growth; however, with COVID-related lockdowns still in place and possibly extending to more parts of the country, we are skeptical monetary and fiscal support will be as effective under lockdown conditions. In our view, a China growth deceleration to 4% is not out of the question. As of now, this is a downside risk scenario, not our base case forecast, but nevertheless an entirely plausible outcome. China's economy slowing to 4%, all else equal, would likely bring global GDP growth below 3% this year. However, including the potential contagion effects on other emerging market economies and financial markets, the global economy could slow even further below trend than we already forecast.
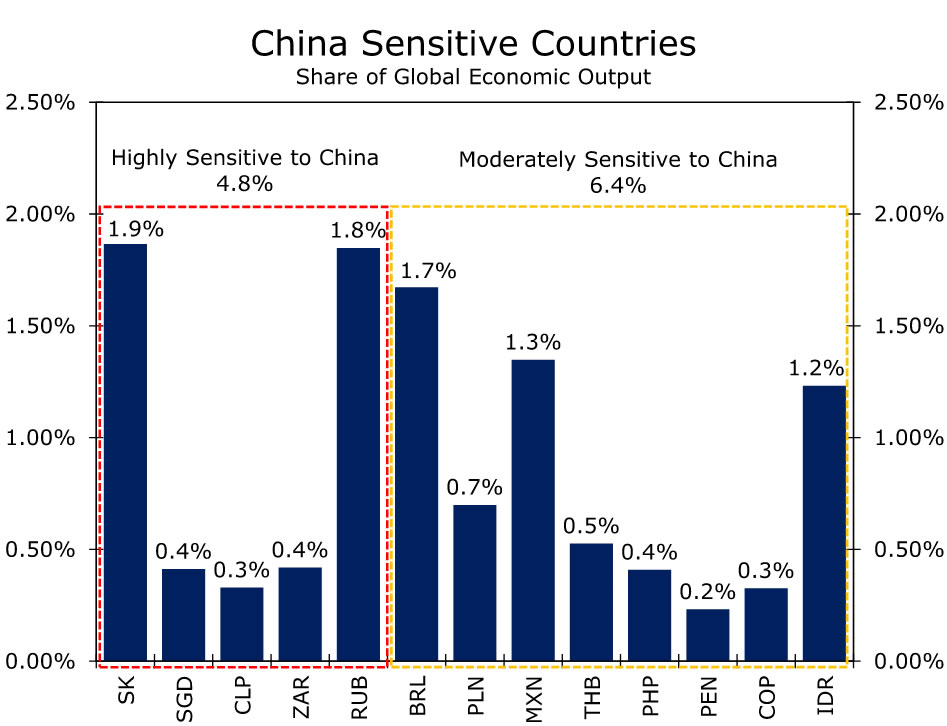
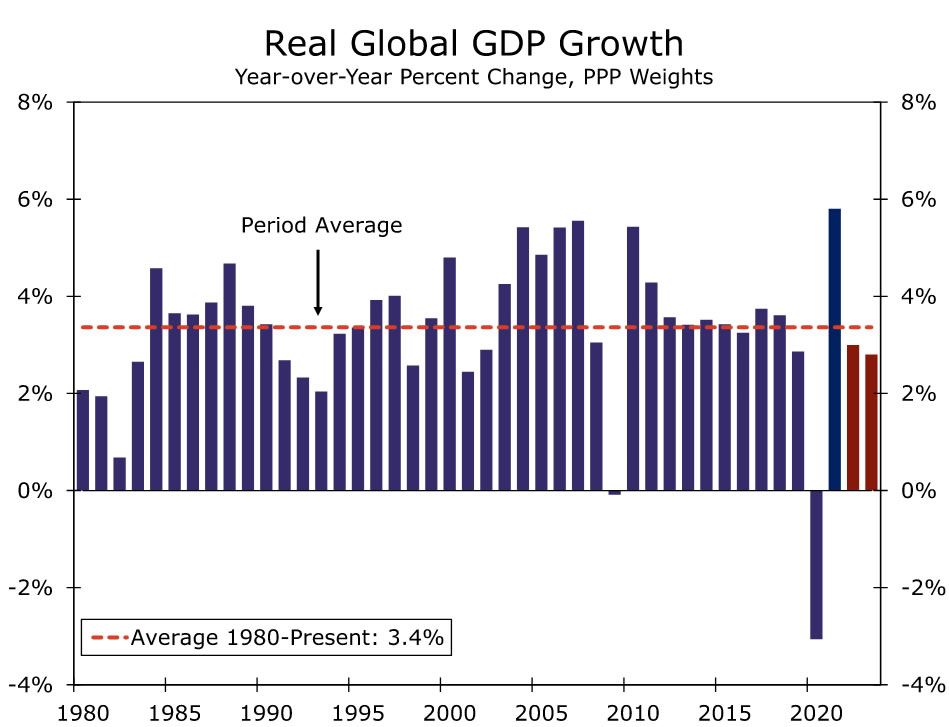
The countries our framework identifies as "Highly Vulnerable" account for almost a 5% share of global economic output, and "Moderately Vulnerable" countries account for almost 6.5% (Figure 2). Together, these countries make up a sizable percentage of global economic output, so much so that if the China ripple effects materialize the way our analysis suggests, the shock to global growth could be significant. In our view, the impact from China directly as well as its contagion on other emerging market countries could trim between 0.3% and 0.4% off global GDP growth. That could result in the global economy growing just 2.6% this year. A 2.6% global growth rate would be well below the longer-run average growth rate of 3.4% for the global economy (Figure 3). Also, aside from the COVID-induced global recession in 2020, 2.6% growth would mark the slowest pace of global expansion since the aftermath of the Global Financial Crisis in 2009.
As mentioned, this scenario represents a downside risk to our global economic outlook. Going forward, we will be closely monitoring high frequency indicators of how China's economy is responding to lockdown protocol, but also focusing on hard data to gauge how the real economy is being impacted. April PMI data will be an important indicator as these data will capture the entire lockdown to date, and will be the first significant data releases of Q2. We expect the PMIs to fall further into contraction territory, but will be focused on how deep into contraction, as well as the underlying details for clues on whether supply chains are being impacted. We will also be focused on the PBoC operations, particularly daily renminbi fixings. PBoC actions should provide insight into whether the central bank is comfortable with a weaker renminbi or whether authorities prefer to limit the extent of renminbi depreciation. For now, we believe PBoC officials will side with allowing for more renminbi depreciation and believe they are still comfortable accommodating a weaker currency to act as a shock absorber and support the economy. We also believe the PBoC will cut the Reserve Requirement Ratio (RRR) again in Q2 and possibly lower lending rates. Easier PBoC monetary policy, especially at a time when the Federal Reserve is raising interest rates, should place additional depreciation pressure on the renminbi, and believe the USD/CNY and USD/CNH exchange rates can end this year at CNY6.66 and CNH6.66 respectively.
Weekly Economic & Financial Commentary: How Much Will the Fed Tighten Next Week?
Summary
United States: GDP Head Fake Obscures Otherwise Intact Fundamentals
- In a jampacked week of economic data, Thursday's negative GDP growth print took center stage. The U.S. economy contracted at a 1.4% annualized rate in Q1-2022. The weak headline figure raises concern at first glance, but the details of the report suggest underlying demand remained intact.
- Next week: ISM Surveys (Mon & Wed), Trade Balance (Wed), Nonfarm Payrolls (Fri)
International: Bank of Japan Doubles Down on Easy Monetary Policy
- The Bank of Japan held its monetary policy stance steady at this week's announcement but, in a significant development, reinforced its pledge to cap any rise in Japanese bond yields. The central bank said it was prepared to buy government bonds in unlimited quantities to prevent a rise in yields. In other central bank activity, Sweden's central bank raised its policy rate by 25 bps and signaled multiple further rate hikes in the quarters ahead.
- Next week: China PMIs (Sat.), Brazil Selic Rate (Wed.), Bank of England Policy Rate (Thu.)
Interest Rate Watch: How Much Will the Fed Tighten Next Week?
- Despite the 1.4% annualized rate of contraction in Q1 real GDP, we look for the Federal Open Market Committee to raise its target range for the federal funds rate by 50 bps at next week's meeting. A 50 bps rate hike is completely priced into markets.
- We also look for the Committee to announce the commencement of balance sheet reduction, which would also act as a form of monetary tightening.
Topic of the Week: The Rise of Single-Family Rental Homes
- Housing affordability has been an increasing concern for potential homebuyers as scorching home price appreciation and rapidly rising mortgage rates have already pushed many buyers onto the sidelines. While homes are becoming increasingly difficult to afford for traditional homebuyers, a growing share of investor buyers have encroached on the market by purchasing and renting out single-family homes.
The Weekly Bottom Line: GDP Drop Obscures Strong Underlying Demand
U.S. Highlights
- U.S. economic growth contracted in the first three months of 2022. Real GDP fell 1.4% due largely to a sizeable increase in the trade deficit.
- The U.S. goods trade deficit widened unexpectedly by almost 18% to hit a new record in March, reflecting both higher import volumes and prices.
- Personal income and consumer spending rose on a monthly basis in March. While a key inflation measure, the core PCE deflator, eased marginally to 5.2% year/year from 5.3% in February.
Canadian Highlights
- This morning’s GDP report showed that output surged 1.1% month/month in February, beating Statistics Canada’s flash estimate of 0.8%. The preliminary estimate for March also points to a strong gain of 0.5%.
- Governor Maklem noted that “the economy has entered excess demand” territory and is starting to bump up against its capacity constraints. This is adding pressure on prices and wages, and emboldening the Bank to act swiftly.
- April’s CFIB’s Small Business Barometer reaffirmed that businesses remained upbeat about the near-term outlook, but were feeling the constraints presented by the tight labour market.
U.S. - GDP Drop Obscures Strong Underlying Demand
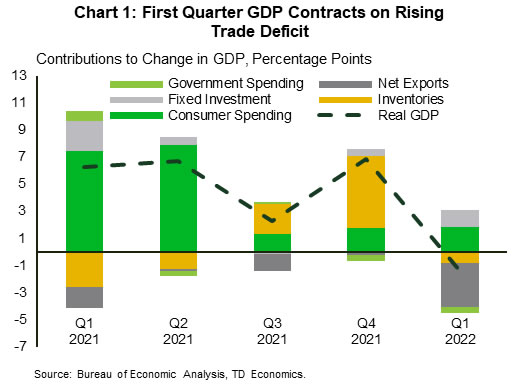
First quarter GDP was the disappointing marquee release this week, but there were plenty of silver linings. The consensus was for weak, but still positive, growth. Instead, the U.S. economy retreated by 1.4% annualized, after booming 6.9% in the fourth quarter of 2021 (see here). The unexpected retrenchment was largely due to a widening trade deficit, with slowing inventory accumulation and fading stimulus spending chipping in (Chart 1). The headline decline masked underlying strength in consumer spending and business investment, which posted solid gains of 2.7% and 9.2% respectively in the quarter.
Business investment has good momentum heading into Q2, with durable goods orders up 0.8% month-on-month (m/m) in March, after a 1.7% decline in February. The increase was driven by autos, computers and other electronics. The measure has risen in five of the last six months. The report also showed that a closely watched proxy for business investment – new orders for nondefense capital goods excluding aircraft – rose by 1% m/m, pointing to resilience in the business sector.
On the housing front, data from the S&P CoreLogic Case-Shiller Index showed that home price growth remained robust in February. Prices posted a 19.8% y/y gain, up from 19.1% in January. This was the highest growth rate since August and reflects extremely low levels of inventory relative to demand. As mortgage rates continue to climb, however, purchasing power will dim, resulting in lowered demand which should restore greater equilibrium to the market.
There are already some indications of this as sales of newly built single-family homes fell in March for the third consecutive month. New home sales were down 8.6% m/m. There was also a decline in contracts signed to purchase homes. Pending home sales headed lower for the fifth consecutive month. The metric fell 1.2% m/m in March, pushing signed contracts to the lowest level since May 2020. As prices and interest rates head higher, and a solid supply of homes under construction are completed, the current imbalance between housing supply and demand should start to close.
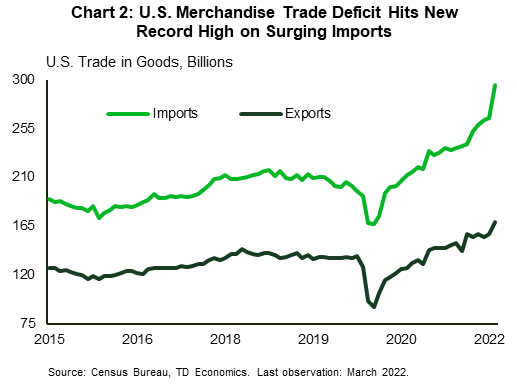
There was little sign of improvement in the trade deficit through the quarter, as the monthly deficit hit a new record in March. A surge in imports dwarfed export gains (Chart 2). The goods trade gap rose by 17.8% m/m to $125.3 billion. While strong demand from businesses and consumers lead to a surge in imports, rising prices also contributed to the sizeable increase in the deficit. Front-loading of imports due to geopolitical and supply-chain uncertainty saw sizeable increases in the import of consumer goods (13.6%) and motor vehicles (12%).
Finally, both nominal personal income and spending rose in March by 0.5% and 1.1% m/m respectively. Accounting for prices, real spending rose 0.2% on the month. The Fed’s preferred inflation gauge, the core personal consumption expenditure deflator, rose 5.2% y/y, a slight deceleration from February. Add it all up, and with inflation still elevated, and strong momentum in consumer spending and business investment, the Fed is expected to look past the headline decline in GDP, and press full steam ahead with policy normalization, with a 50 basis point hike next week.
Canada - Some Do Not Like It Hot...
This was a relatively quiet week in terms of economic data, with industry-level GDP for February the main highlight. Bank of Canada speeches were also on the docket, providing some additional colour on the Bank's view of the economy, inflation and monetary policy.
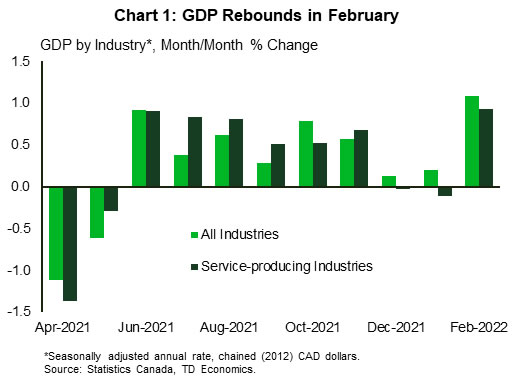
In his speeches earlier this week the Bank of Canada Governor Tiff Maklem sought to make three key points: that "the Canadian economy is strong", that "inflation is too high", and that higher interest rates are very much needed in order to stomp out the inflationary fire. Indeed, this morning's monthly GDP report echoed his words on the strength of the recovery, with economy expanding 1.1% month/month in February. This result was well-ahead of expectations, lifting the level of GDP 1.5% above its pre-pandemic level. Easing public health restrictions supported the rebound in February, particularly in the services sector. Accommodation and food services industry led the way with real GDP surging by 15.1% on the month (Chart 1).
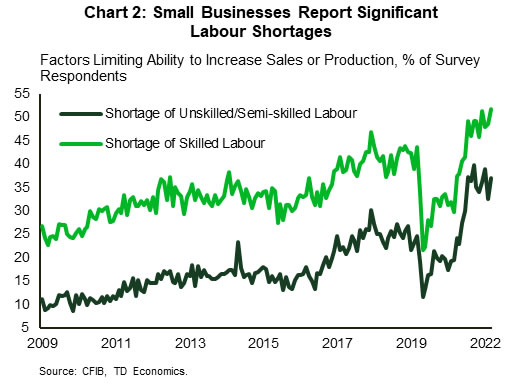
With GDP above its pre-pandemic level, and the unemployment rate falling below its pre-crisis mark, Governor Maklem noted that "the economy has entered excess demand" territory and is starting to bump up against its productive capacity constraints. The labour market is a poster child of this. Businesses are having a tough time filling vacant positions, even at higher wages. This week's CFIB's Small Business Barometer survey reaffirmed that businesses are acutely feeling those challenges. Half of survey respondents reported shortages of skilled labour were limiting their ability to ramp up production, and 37% cited a shortage of semi-skilled/unskilled labour as an impediment (Chart 2).
On inflation, the governor said that it "remains the Bank's primary focus", noting that "high inflation affects everyone". Indeed, rapidly rising prices are being felt by all Canadians, but as we note in this week's report, inflationary pressure also varies by province. Inflation has been particularly hot in most of the Atlantic Provinces, lifted by food and energy product prices (which carry a large weighting in the region). Inflation has been much slower in most of Western Canada, on the back of relatively muted recoveries in Alberta and Saskatchewan and a slower increase in transportation costs in B.C.
On average, however, the BoC estimates that 5% inflation costs the average Canadian $2000 more per year relative to 2% inflation. To bring it down and to keep expectations anchored, the BoC will not be shy to raise rates. Together with inflation, higher interest rates will be another hit to household finances. We estimate that annual debt servicing costs will increase by $2000 per household by the first quarter of 2023 as the overnight rate reaches 2.25%. Let's hope this will be enough to cool domestic demand and bring inflation down, otherwise the Bank is not afraid to raise interest rates more "forcefully".
Jobs Report to Show Tighter Labour Markets Across Canada
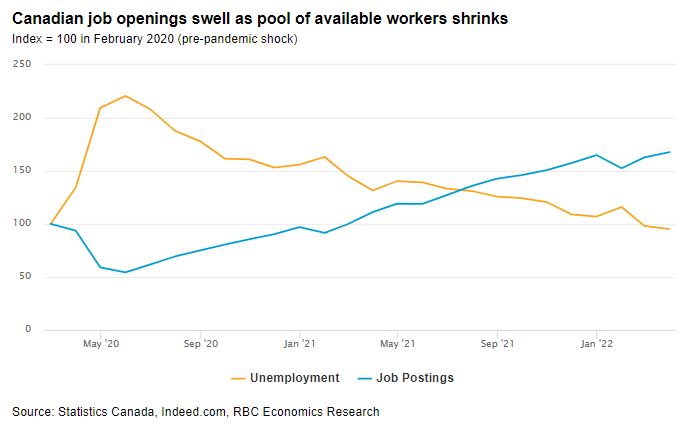
Canada’s April labour market report will top a flurry of data releases next week. We look for job growth to slow to 25,000 in April after a 409,000 surge over the last two months. Demand for workers remains exceptionally strong—job openings are running 70% above pre-pandemic levels—but the supply of available workers has shrunk dramatically. The unemployment rate hit its lowest level since at least 1976 in March at 5.3%. We expect a further pickup in employment within the hospitality sector from what are still very low levels. But as the pool of available workers dwindles, additional labour demand will have a greater impact on wage pressures than on employment counts.
Canada isn’t the only country battling a labour crunch. The U.S. unemployment rate is also very low and employment is expected to rise another 400,000 in April. A tighter squeeze in labour markets will add more fuel to the inflation fire as firms bid up wage prices to secure scarce talent. There are already clear signs that strong household and business demand is outpacing the U.S. economy’s domestic production capacity, further broadening inflation pressures. Against that backdrop, the U.S. Fed is expected to accelerate the withdrawal of monetary policy stimulus. A 50 basis point increase in the fed funds target range is expected following next week’s FOMC meeting, building on the 25 bp hike in March. We expect that to be followed by an additional 150 bp in rate hikes this year—with the risk that those hikes come sooner rather than later.
Week ahead data watch:
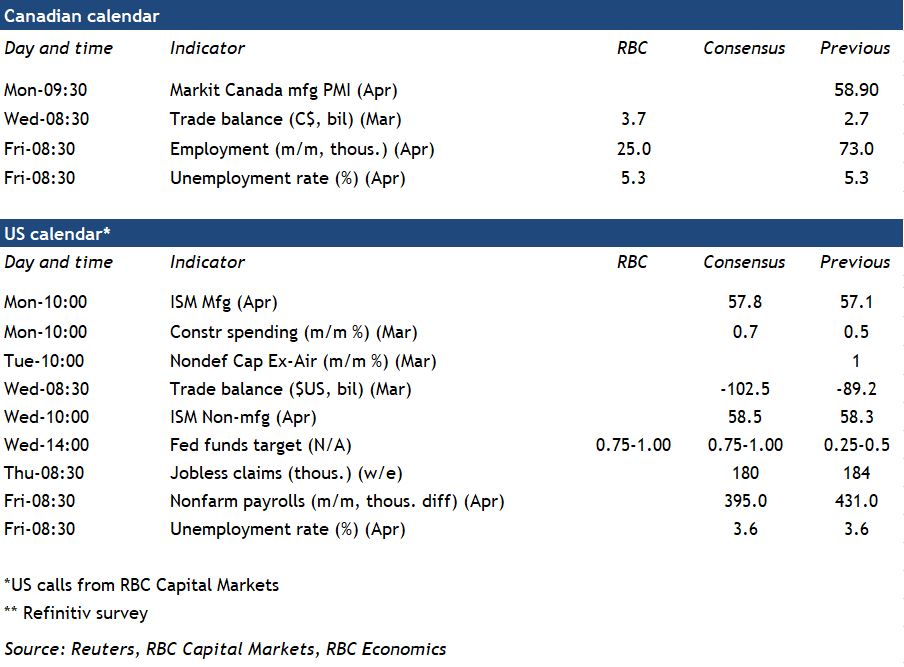
The April Canadian manufacturing PMI will be watched for signs that the Russian invasion of Ukraine and pandemic lockdowns in China are exacerbating global supply chain disruptions. Early flash estimates out of Europe and the US have held up reasonably well.
Canada’s merchandise trade balance likely improved in March, benefitting from an 18% surge in oil prices, with some offset from rising imports of consumer goods.
Week Ahead – Unfashionably Late
Time for the Fed to step up
A blockbuster week in store in financial markets and one that begins with bank holiday’s across various countries. Throw in Chinese PMI data over the weekend and it could be a lively start to trading on Monday.
The standout event next week will naturally be the Federal Reserve monetary policy decision on Wednesday when we’re likely to see the first 50 basis point rate hike in more than 20 years. But does the central bank have a surprise up its sleeve after being unfashionably late to the party?
European energy markets will be another key focus next week with the EU reportedly close to agreeing on a Russian oil embargo. At the same time, the Kremlin is taking aim at “unfriendly countries” that refuse to pay for their gas in roubles. Which country will be next to be cut off?
US
The Fed is widely expected to follow through on delivering a faster pace or rate increases and announce the start of the reduction of their $9 trillion asset portfolio. This should not be a difficult meeting for Fed officials as the Fed has committed itself into delivering a string of rate hikes to finally fight inflation. The Fed knows its credibility is at stake and they will need to commit to a couple, maybe a few half-point rate increases before scaling down tightening to 25 basis point increases.
This will be a busy week filled with many major economic data releases, quarterly earnings reports, and Ohio holds a key US senate race to replace Senator Rob Portman who is set to retire. On Monday, the ISM Manufacturing report is expected to show factory activity posted a small rebound in April and Friday’s nonfarm payroll report to show slower job growth. The April non-farm payroll headline number is expected to decrease from 431,000 in March to 390,000 and the unemployment rate is expected to remain steady at 3.6%.
EU
There’s a huge focus on the EU energy market at the moment as a result of the standoff between Brussels and Moscow over natural gas. Poland and Bulgaria have already been cut off due to their refusal to abide by rouble demands. Other countries are less keen which is damaging the unity with which the bloc has punished Russia until now. That said, they are apparently close to agreeing on an oil embargo which will cut off a key source of funding for the Kremlin. How that’s implemented will be key. But all of this means higher energy prices, weaker economies and more pressure on the ECB to hike rates.
Next week offers a lot of economic data, the vast majority of which is tier two and three including final PMIs, unemployment and retail sales. ECB President Christine Lagarde will speak on Tuesday which will be closely followed for interest rate hints. Markets are pricing in multiple hikes this year now, a far cry from what the ECB signalled at the last meeting. June is now huge.
UK
The Bank of England is expected to continue the trend of a rate hike at every meeting with another 25 basis point increase next week. It appeared to be cooling its hawkish rhetoric last time around but given the inflation indicators since, I expect it to retain a hawkish stance on Thursday. Markets are pricing in six rate hikes this year, starting next week. The monetary policy report will accompany the decision with new projections and a press conference.
Russia
The CBR cut interest rates to 14% on Friday (17% previously) and hinted at a more modest easing in future (Key Rate in 12.5-14% range). This came as it forecast growth to decline by 8-10% this year and inflation to hit 18-23% in 2022.
Next week offers the services and manufacturing PMIs which could provide further insight into the impact of the sanctions on the domestic economy. With an oil embargo potentially on the horizon and the Kremlin blocking exports of gas to countries unwilling to pay in roubles, further pain likely lies ahead.
South Africa
Inflationary pressures are continuing to build, as evidenced in the PPI data last week. That will keep the pressure on the SARB to keep raising rates. Next week looks quiet, with the whole economy PMI the only notable release.
Turkey
Analysing Turkish inflation data has become a purely academic exercise in light of the CBRT’s decision to ignore it when making its policy decisions. It’s expected to hit 68% when the April data is released (CBRT expects it to peak at 70%) on Thursday and the PPI data may be even worse, having lept nearly 115% in March. CBRT Governor claimed developments show the rate cuts were the right decision. I’m not sure those impacted by them will agree.
China
Markets are heavily distorted in Asia this week due to a plethora of holidays. China is closed from Monday until Wednesday meaning any negative developments surrounding covid zero or other geopolitics will be reflected via the offshore USD/CNH and other regional stock markets such as Australia.
We have significant risk this weekend as China releases official manufacturing and non-manufacturing PMIs and the Caixin manufacturing PMI. All have downside risks and with most of Asia, including China and Hong Kong closed on Monday, USD/CNH has significant upside risk, following on from the demolition of the onshore and offshore Yuans versus the US Dollar this week.
China releases the Caixin non-manufacturing PMI on Thursday, the only other significant data release during the week. If there has been a lot of event risk passing through markets in the first few days of the week, China stock markets could gap quite a long way, up or down when they reopen Thursday, especially if the FOMC surprises in some way in the hours before.
India
The INR and Sensex have been resilient in the past week; perhaps benefitting from investor inflows leaving China. India is on holiday on Tuesday.
India releases manufacturing PMI and balance of trade on Monday, with non-manufacturing PMI on Thursday. Markets will be looking for a negative impact from India’s nationwide power shortages which could put short-term downward pressure on the Sensex and the INR.
Australia
Australia could be a correlation trade for the tier-1 PMI releases from China over the weekend. Poor China data could see the AUD and local equities pressured with most of Asia, ex-Japan closed. Similarly, a decent showing by the China PMIs will have a positive impact.
Markets, especially currency markets, could face liquidity issues and see sharp moves if the weekend news wire is heavy as Australia and Japan will be the only two major centres open.
Most attention will be focused on Tuesday’s RBA rate decision. A 0.15% hike is fully priced by markets and the clouds from Ukraine and China are weighing heavily on AUD/USD anyway. If the RBA does not hike AUD/USD could fall sharply in the short term. If the RBA hikes and adjusts its guidance to a more hawkish, AUD/USD could potentially see a big move higher.
New Zealand
NZD trading faces liquidity issues in the coming week with the majority of Asia on holiday for most of the week. It may move sharply on Monday as a China correlation trade if China’s weekend PMI data contains surprises. Otherwise, NZD/USD continues to underperform AUD/USD badly as markets continue pricing in an economic slowdown and an RBNZ far behind the inflation curve, forcing it to hike New Zealand into a recession.
New Zealand releases employment, participation, labour costs and the RBNZ Financial Stability Report on Wednesday. All present volatility risk. The RBNZ press conference midday will be monitored for a more hawkish outlook, especially if the labour cost index accelerates higher.
Japan
Japan begins Golden Week and will be closed Tuesday through Thursday. USD/JPY has risen by over 200 points this week and may close above 130.00 this evening. With most of Asia on holiday Monday except Japan, that would be a perfect day for the MOF to conduct some subtle (or not) selling of USD/JPY into low liquidity conditions.
An unchanged BOJ has left the Yen at the mercy of the US/Japan interest rate differential and if US yields rise next week with Japan closed, USD/JPY has significant upside risks.
Singapore
Singapore is closed Monday and Tuesday. It releases the manufacturing PMI on Wednesday and retail sales on Thursday. Both have downside risks given the China slowdown and inflation eroding consumer confidence. That may force local equities lower, especially as all three heavyweight local banks reported 10% falls in Q1 profits this week.
Like the rest of Asia, the SGD remains under pressure due to a rampant US dollar. That may force the MAS into some buying of SGD to maintain its $NEER corridor with the central bank not due to adjust policy until October.
Economic Calendar
Saturday, April 30
Economic Data/Events
- China April Manufacturing PMI: 47.3 expected v 49.5 prior; Non-Manufacturing (Services): 46.0 expected v 48.4 prior; Caixin PMI data
- Berkshire Hathaway reports Q1 earnings and Warren Buffett speaks at Berkshire Hathaway’s annual meeting
Sunday, May 1
Economic Data/Events
- Milken Institute Global Conference begins
Monday, May 2
Economic Data/Events
- US construction spending, ISM manufacturing
- Eurozone Markit manufacturing PMI
- France Markit manufacturing PMI
- Germany Markit manufacturing PMI
- New Zealand CoreLogic house prices
- Australia CoreLogic house prices, inflation gauge, commodity index, PMI
- India Manufacturing PMI
- Australia Manufacturing PMI
- Japan PMI, vehicle sales, consumer confidence index
- Italy unemployment
- Coinbase CEO Armstrong speaks at Milken conference
Tuesday, May 3
Economic Data/Events
- Reserve Bank of Australia (RBA) rate decision: Expected to raise Cash Rate Target 15bps to 0.25%
- Australia consumer confidence
- Eurozone PPI, unemployment
- Germany unemployment
- Hong Kong GDP
- Japan vehicle sales
- Thailand business sentiment index, PMI
- Mexico international reserves
- New Zealand building permits
- South Korea CPI
- U.K. Markit manufacturing PMI
- U.S. factory orders, durable goods, light vehicle sales
Wednesday, May 4
Economic Data/Events
- FOMC decision: Expected to raise interest rates by a half-point and announce when they will be reducing their balance sheet
- US trade data
- Australia PMI, retail sales, home loans
- Eurozone retail sales, Markit services PMI
- Germany trade
- RBNZ releases financial stability report
- New Zealand unemployment, commodity prices
- Singapore electronic sector index
- Spain unemployment
- EIA crude oil inventory report
Thursday, May 5
Economic Data/Events
- US initial jobless claims
- BOE rate decision: expected to raise bank rate 25bps to 1.00%
- China Caixin PMI composite, services
- France industrial production
- Germany factory orders
- Australia trade, building approvals
- Thailand CPI
- India PMI composite, services
- Norway rate decision: Deposit rate expected to stay steady at 0.75%
- Poland rate decision: Expected to raise rates 75 or 100bps.
- Singapore retail sales
- OPEC+ regular meeting
Friday, May 6
Economic Data/Events:
- US April Change in nonfarm payrolls: 390K expected v 431K prior: unemployment rate: 3.6% expected v 3.6% prior
- Fed’s Waller and Bullard discuss monetary policy on a panel hosted by the Hoover Institution
- Sweden’s Riksbank releases minutes from its April 27 meeting
- BOE chief economist Pill speaks at a monetary policy report briefing
- Canada unemployment
- Germany industrial production
- Japan Tokyo CPI, monetary base
- RBA statement of monetary policy
- Australia Foreign reserves
- Singapore PMI
- Thailand forward contracts
- Spain industrial production
Sovereign Rating Updates
- Czech Republic (Fitch)
- Portugal (Fitch)
- Norway (Moody’s)