

Sample Category Title
Eurozone CPI ticked up to 7.5% yoy in Apr, core CPI rose to 3.5% yoy
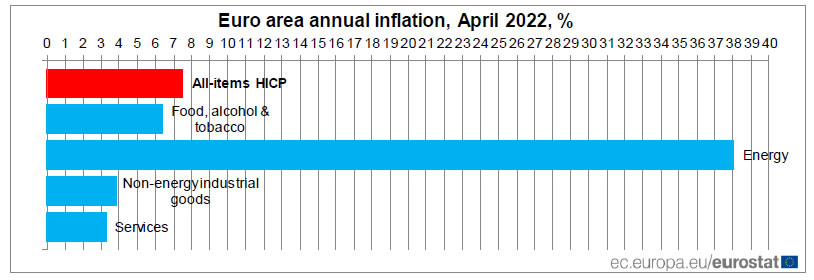
Eurozone CPI ticked up from 7.4% yoy to 7.5% yoy in April, matched expectations. CPI core rose from 2.9% yoy to 3.5% yoy, above expectation of 3.1% yoy. Looking at the main components of euro area inflation, energy is expected to have the highest annual rate in April (38.0%, compared with 44.4% in March), followed by food, alcohol & tobacco (6.4%, compared with 5.0% in March), non-energy industrial goods (3.8%, compared with 3.4% in March) and services (3.3%, compared with 2.7% in March).
Eurozone GDP grew 0.2% qoq in Q1, EU up 0.4% qoq
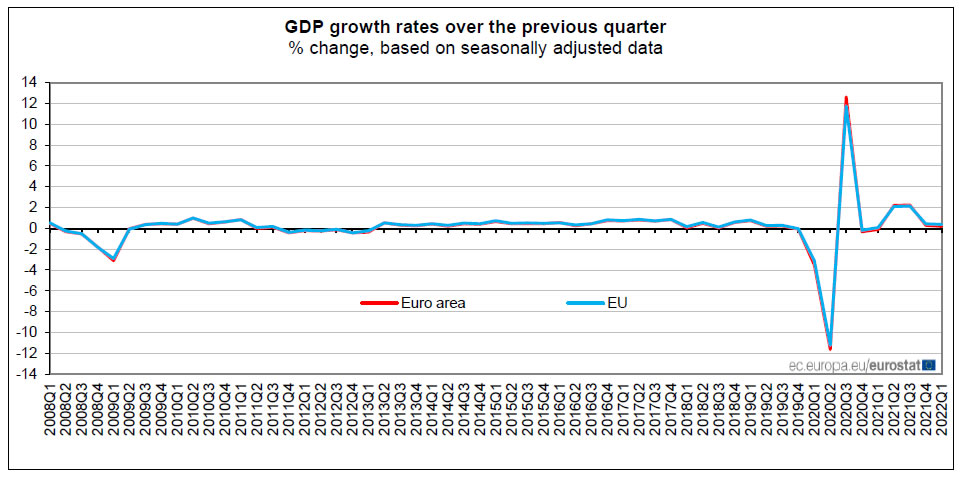
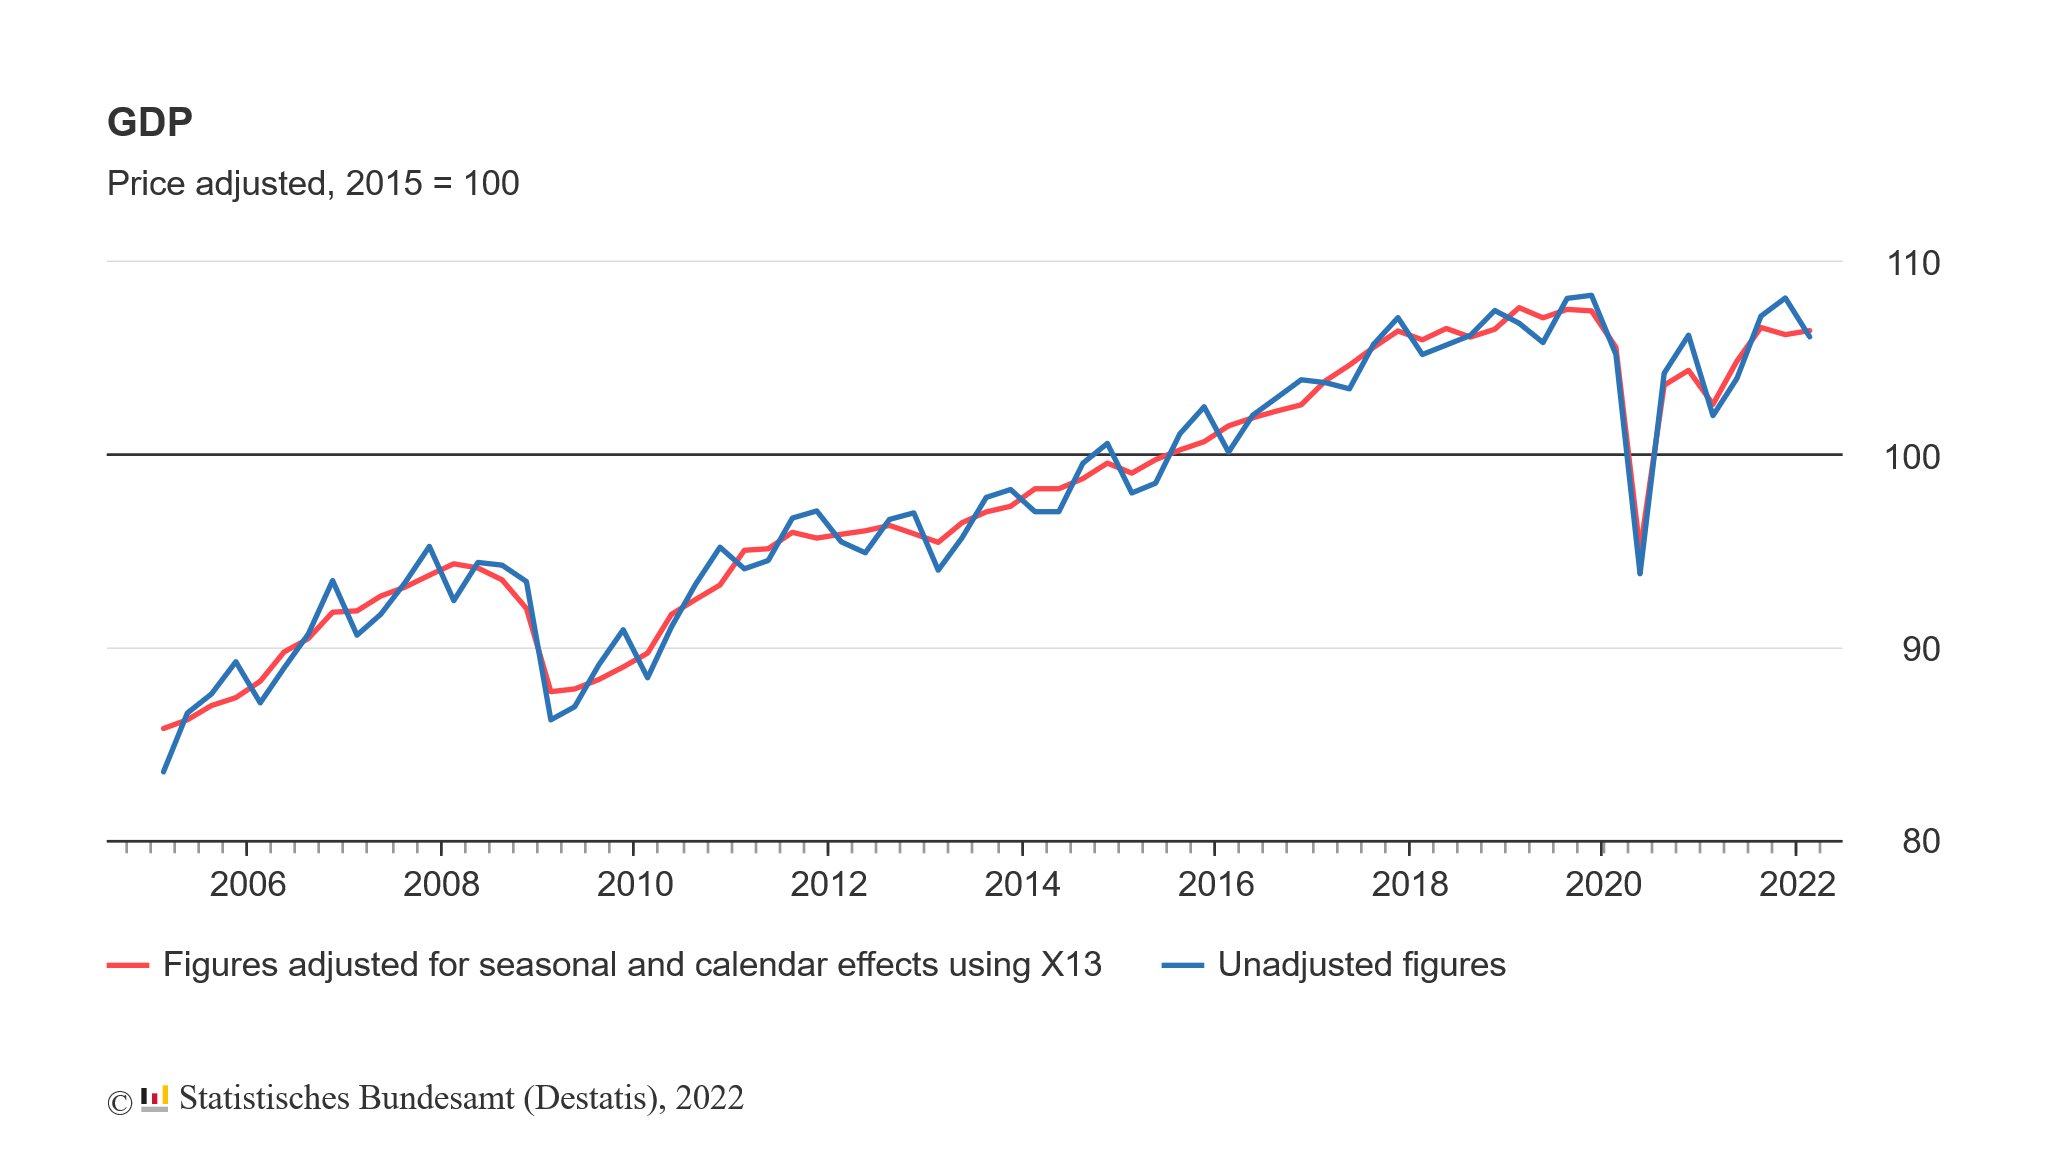
Eurozone GDP grew 0.2% qoq in Q1, slightly below expectation of 0.3% qoq. Comparing with the same quarter a year ago, Eurozone GDP grew 5.0% yoy.
EU GDP grew 0.4% qoq, 5.2% yoy. Among the Member States for which data are available for the first quarter 2022, Portugal (+2.6%) recorded the highest increase compared to the previous quarter, followed by Austria (+2.5%) and Latvia (+2.1%). Declines were recorded in Sweden (-0.4%) and in Italy (-0.2%). The year on year growth rates were positive for all countries.
US Dollar Index and Stocks Steady ahead of PCE Data
The US dollar continued its bullish rally even after the disappointing GDP numbers. According to the statistics agency, the country’s economy contracted by 1.4% in the first quarter. This decline was the worst since the pandemic started in 2020. It was attributed to ongoing supply chain disruptions and the fact that consumer prices kept rising. Another contributor was the fact that the country continued to experience a widening trade deficit. Therefore, the slowing economy will complicate the situation for the Federal Reserve, which has pledged to continue accelerating its tightening policy.
The euro continued to decline as investors waited for the preliminary consumer inflation and GDP numbers from the Eurozone. Economists expect that data by Eurostat will show that the headline CPI slowed down modestly from 2.4% to 1.8% in April. On a year-on-year basis, inflation is expected to have risen from 7.4% to 7.5%. On the other hand, excluding the volatile food and energy prices, analysts expect that inflation rose from 2.9% to 3.2%. There are concerns that an embargo of natural gas from Russia will lead to higher inflation.
There will be several important events in the economic calendar. In the United States and other European countries, the earnings season will continue. Some of the top companies that will publish their results are Colgate-Palmolive, Honeywell, LyondellBasell, CBOE, and AbbVie among others. Meanwhile, in Switzerland, the head of the Swiss National Bank will deliver a speech while the statistics agency will publish the latest retail sales data. The other key economic data will be German and Canada GDP and the American PCE numbers.
EURUSD
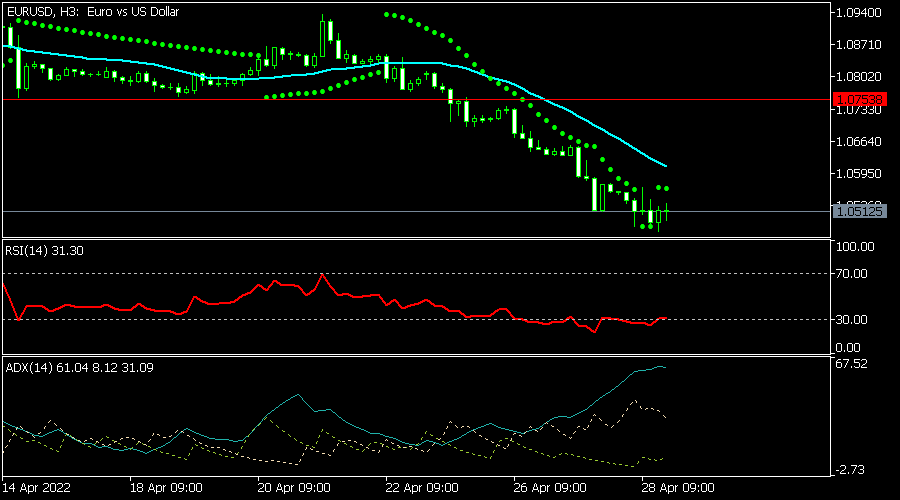
The EURUSD pair is hovering near its lowest level in more than five years even after the disappointing economic data from the United States. It is trading at 1.0510, which is below the dots of the Parabolic SAR and the 25-day moving average. The Relative Strength Index has moved below the oversold level while the Average Directional Index is rising. The pair will likely start to rise considering that this is the last day of the month.
AUDUSD
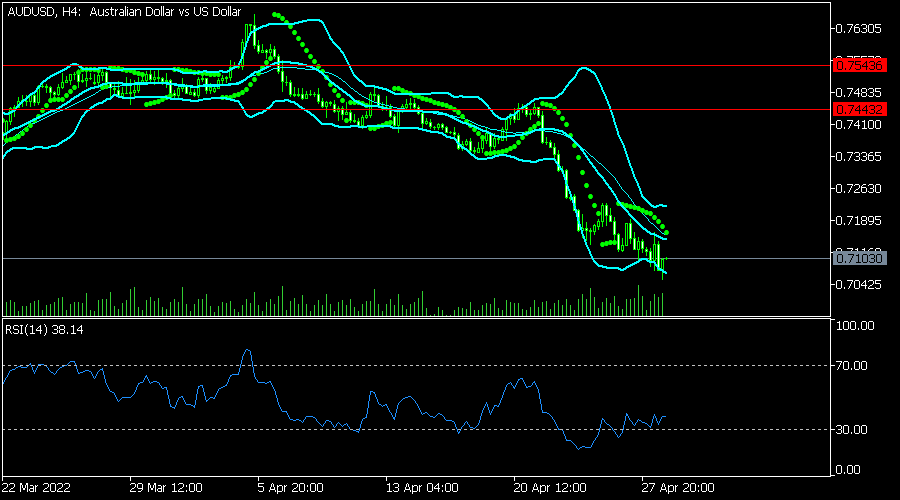
The AUDUSD pair continued its downward trend even after Australia published strong inflation data. It is trading at 0.7100, which is close to the lowest level since February. The pair has moved between the lower and middle lines of the Bollinger Bands while the RSI has risen above the oversold level. It is also slightly below the dots of the Parabolic SAR. Therefore, the pair will likely keep falling as bears target the key support at 0.7000.
NZDUSD
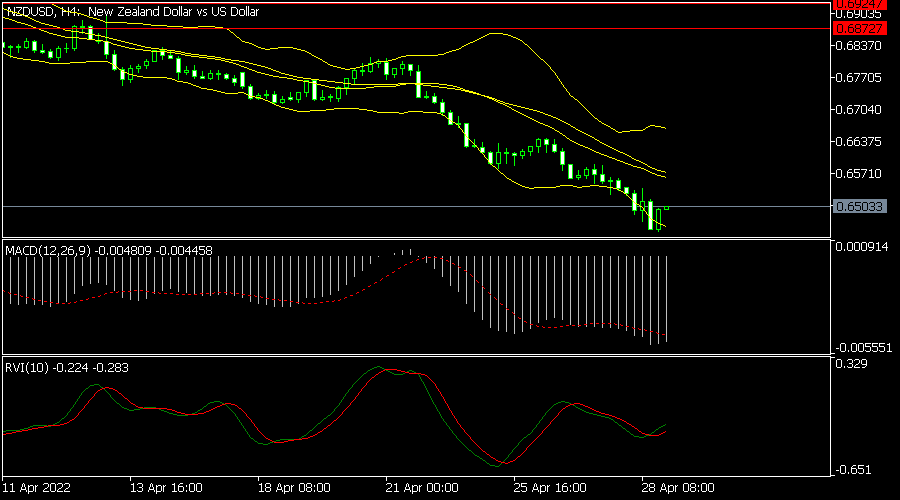
The NZDUSD pair continued the downward trend as the strength of the US dollar continued. The pair is slightly above the lower side of the Bollinger Bands and the 25-day moving average. At the same time, the MACD has moved below the neutral level while the Relative Vigor Index (RVI) is moving sideways. Therefore, the pair will likely crawl back as investors target the middle line of the Bands.
Japanese Yen Stabilizes Around 130
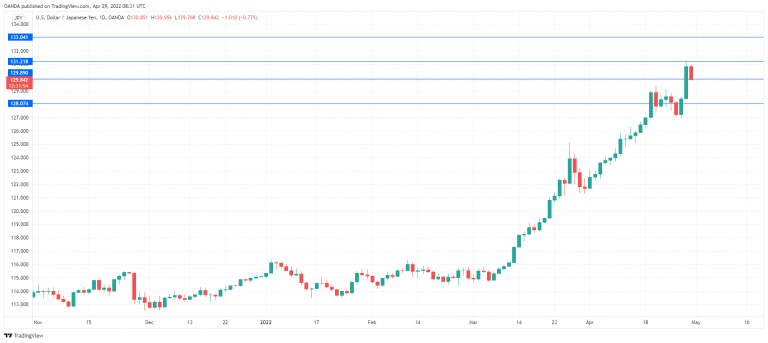
Another week has meant more losses for the Japanese yen, as USD/JPY punched above the symbolic 130 line for the first time in 20 years. How badly is the yen doing? The currency last posted a winning week in February, and USD/JPY has soared 6.86% in the month of April. Not a good report card.
The yen’s downswing has been sharper than expected, as USD/JPY has broken through resistance at 130 much more quickly than expected. The rapid movement in the exchange rate has drawn the usual jawboning from the BoJ and Japan’s Ministry of Finance (MOF), but aside from strong rhetoric, it’s unlikely that we’ll see any intervention with the aim of propping up the battered yen. On Thursday, while the MoF said that the yen’s descent was “extremely worrying”, BoJ Governor Kuroda reiterated that a weak yen was good for Japan’s economy.
BoJ focused on yield curve control
The BoJ doesn’t want to see the yen continue to plummet, but its focus is on stimulating the economy, not on the exchange rate. We’ve seen the BoJ show its determination to protect its yield curve control, as the Bank continues to offer to make unlimited purchases of 10-year JGPs in order to cap yields at 0.25%. The BoJ will continue its ultra-accommodative policy, even though this will put it out of sync with the Federal Reserve and other major central banks, which are tightening policy in order to combat soaring inflation. If the price for this policy is a falling yen, so be it, in the minds of BoJ policymakers.
If there is a “line in the sand” when it comes to the yen’s value, any intervention is likely to come from the MoF rather than the BoJ. After decades of deflation, Japan is finally experiencing some inflation, but at much lower levels than in the US and elsewhere. Until inflationary pressures increase, the BoJ will have a free hand to pursue its ultra-loose policy, and that could spell more trouble for the yen.
USD/JPY Technical
- USD/JPY has broken below support at 129.89. Next, there is support at 1.2807
- There is resistance at 1.3122 and 1.3304
Oil Report: OPEC Plus Meeting Coming Up
After several weeks of moving in a sideways range, WTI continues to trade nearby $100 per barrel. Traders have a lot of information to digest at the moment, as geopolitical tensions, post pandemic issues and supply demand constrains continue to drive the market. In this outlook we aim to highlight the most important subjects relating to the Oil market and their potential of creating volatility. We will also provide a WTI technical analysis to support traders with a complete report on both technical and fundamental information.
During the past days, weekly US Oil market data created volatility for WTI once again reminding market participants that the releases should not be taken lightly. On Tuesday the 26th of April the American Petroleum Institute inventory levels indicated stocks where in a surplus of 4.78M barrels. Minutes after the release WTI’s price dropped approximately $0.50. Moreover, on the 27th of April during the important Energy Information Administration’s (EIA) Crude Oil Inventories release, a minor surplus of 0.70M barrels was indicated. Due to the fact that the market expected a notable surplus of 2M barrels, the figure did not go unnoticed and WTI rose nearby $1 upon release. The market seems to respond more forcefully to figures that do not match the forecasted ones. Thus, we would advise traders to keep an eye on the releases in the next week.
At the moment, Oil traders are constantly monitoring developments in China as after Shanghai, Beijing is now increasing COVID-19 restrictions. China, the world’s biggest oil importer has the potential to destabilize supply and demand ends and create substantial volatility within the Oil market. In the scenario of a general lockdown in Beijing we could see Oil prices tumbling. On the other hand, a partial lockdown can create some bearish tendencies for WTI but perhaps not as strong as the first scenario. Major media sites and sources are expected to cover for any updates on the specific subject thus traders are advised to be mindful of unexpected market reactions.
On a different front, Russian tensions in Ukraine continue to create uncertainty within the Oil market. The Russia-Ukraine conflict is expected to persist and no signs of ceasefire can be seen at the moment. On the one hand, Russia a distinguished and key player in the OPEC plus agreement, seems to be creating more tensions in Ukraine forcing western nations to ban its Oil trade. A report by Reuters noted, “Russia may see its oil production drop by as much as 17% in 2022”. However, with no major Oil producing nations showing interest in covering for such a loss in supply, Oil prices could receive support. This is a very delicate and complicated matter from our point of view as higher energy prices could lead to higher commodity prices and eventually strengthen inflationary pressures even more. Thus, this subject could further exacerbate worries on oil demand and at the same time send contradicting messages or forces to traders and WTI prices accordingly.
Finally, as a lot of speculation over OPEC’s next steps is reiterated among market participants, we would like to make a brief reference to the upcoming OPEC+ meeting on the 5th of May. Despite the Oil market being under immense uncertainty with the subjects detailed in the report, OPEC plus is expected to agree another 432,000 barrel per day oil output increase for June. Any change in the output figure could create notable volatility yet OPEC’s views on the major geopolitical subjects at the moment can be very interesting also for traders.
Technical Analysis
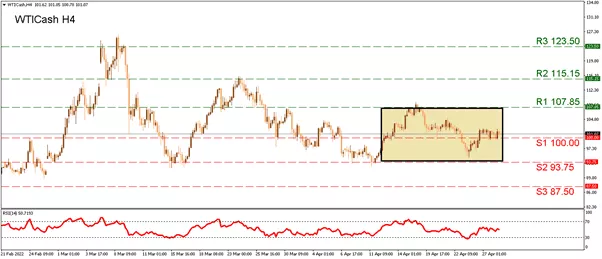
WTICash H4
With the price action revolving around the (S1) 100 support, we have evidence that this level is recognized by the market. Yet other important levels at the moment are the (R1) 107.85 resistance and the (S2) 93.75 support. This range (coloured in grey) has been used throughout April and even though the levels have been tested, they have withstood pressure. Any move above or below this range, can be evidence the current sideways trend, may be changing accordingly. If the commodity heads lower, we note the (S2) 93.75 support as the next possible stop for the bears, while the (S3) 87.50 stands as our final support line. In the scenario of a movement higher, we could see the (R2) 115.15 level being targeted by traders while the top consists of the (R3) 123.50 which remains the multiyear high level reached that was last tested on the 9th of March. The RSI indicator remains across the 50-level displaying some uncertainty among traders.
Daily Technical Analysis
EUR/USD
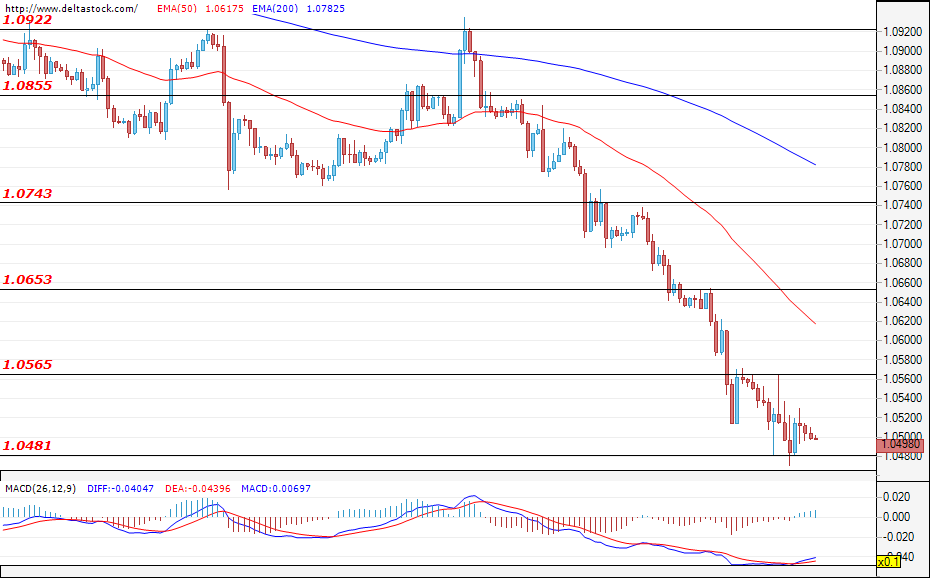
The day for the euro was defined by a range-bound movement. At the beginning of the European session, we monitored a slight gain towards 1.0565 in favour of the bulls, but the German CPI data, which came out at 12:00 GMT, erased these gains and the pair hit the daily bottom at around 1.0480. Germany's GDP data release is expected today at 07:00 GMT, and Iif the growth forecast exceeds the markets’ expectations, then we could once more see prices in the single European currency rising towards 1.0653. However, if the data fails to live up to the current expectations, then the probability of a move below the current bottom at 1.0480 will increase.
USD/JPY
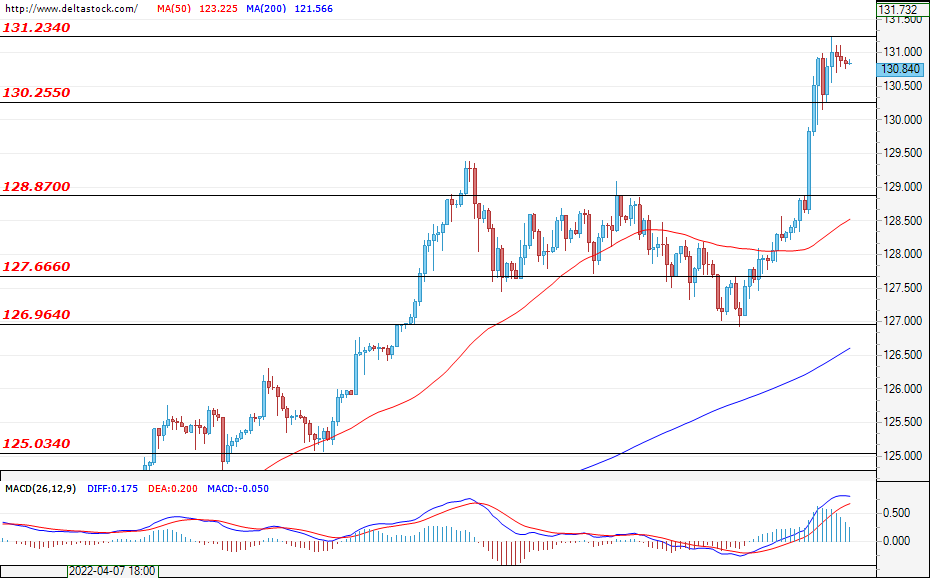
The day started with a strong movement for the dollar against the yen, resulting in a breach of the previous resistance at 130.25. Following this breach, at noon the pair slowed its growth and ended the day with a new daily and weekly high of 131.23. The bulls’ attack came after the announced unchanged policy of the BOJ yesterday, which led to a serious decline in the yen. On Friday, the Japanese celebrate the birth of Emperor Showa and it is an official non-working day, which may further weaken the yen due to the lack of Japanese banks in the market. A rise above 131.23 is more likely, with expectations of reaching 133.00, but it is possible that the momentum will slow down and the pair might enter a range between 130.25 and 131.25.
GBP/USD
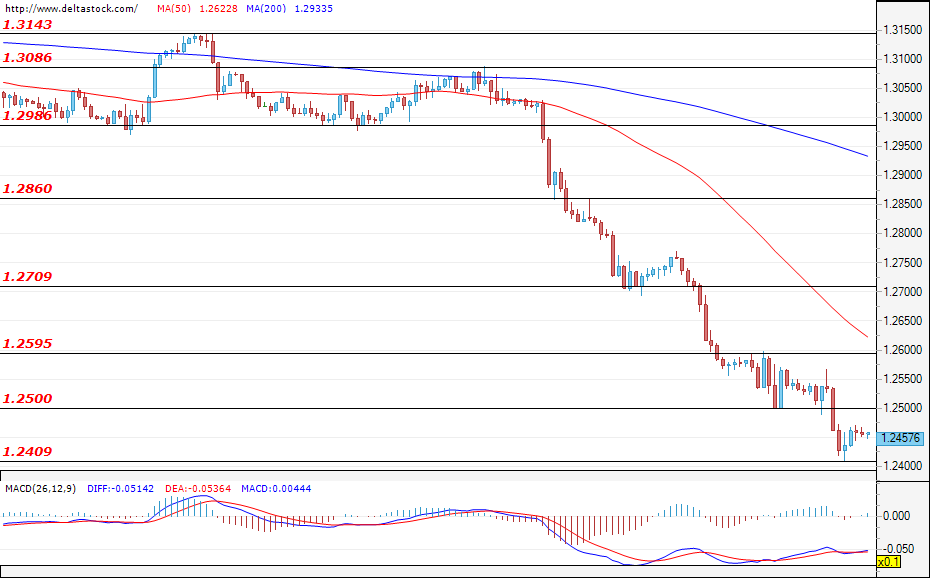
The sterling started to rise at the beginning of the session to its daily peak of 1.2570, but then turned around and continued its downward trend by hitting a new daily and weekly bottom of 1.2410 – values that we have not seen since the fall of 2020. The lack of macroeconomic data, together with the actions taken by the British government to support Ukraine, both create the perfect storm for the pound's decline. There is not data economic data scheduled for today which could fuel a move up, which means that a deepening below 1.2410 is more likely, with a possible new bottom around the weekly support of 1.2300. However, scenarios for the trend’s slowdown should not be ruled out against the background of a 600-pip weekly decline.
EUGERMAY40
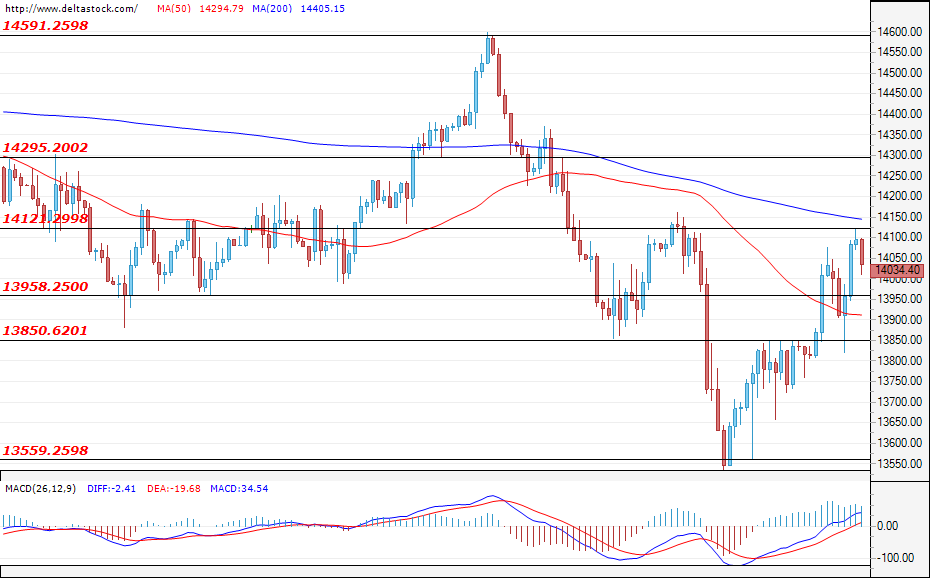
As early as the opening of the European session, the German index began with a 200-euro rise, which was rejected at noon. The session continued with a slight downward correction and a consecutive rebound towards the daily high of 14120. At the end, however, along with the decline in the U.S. stock market, the EUGERMANY40 weakened and ended at around 14040. Today the upcoming GDP data report from Germany is expected to affect the price of the index. If the data is positive, then we could see a stimulus for an increase above 14120 and for a return towards 14295, but if traders are disappointed, then the downward trend may continue and once more reach 13559.
US30
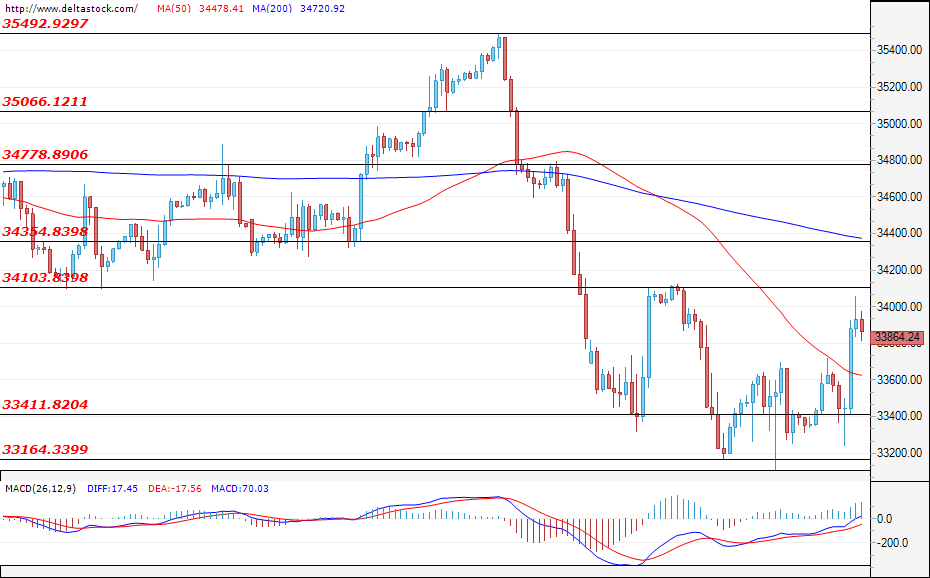
During the European session, the blue chip index managed to gain 300 points, but shortly before the US opening, the correction deepened to 33,230. With the start of Wall Street, however, growth was significant and we saw a daily peak of about 34,100.There was a small correction at the close to around 33850. On Friday, macroeconomic data about U.S. spending will be announced at 12:30 p.m. GMT and is expected to have its impact, according to the data. If the US30 resumes its upward movement, it will only happen after a convincing break and confirmation of 34100, after which it may reach 34780 again. However, the option to continue to range between 33400 and 34100 should not be ruled out.
USDCHF Stretches Winning Streak to 2-Year High; is the Rally Overdone?
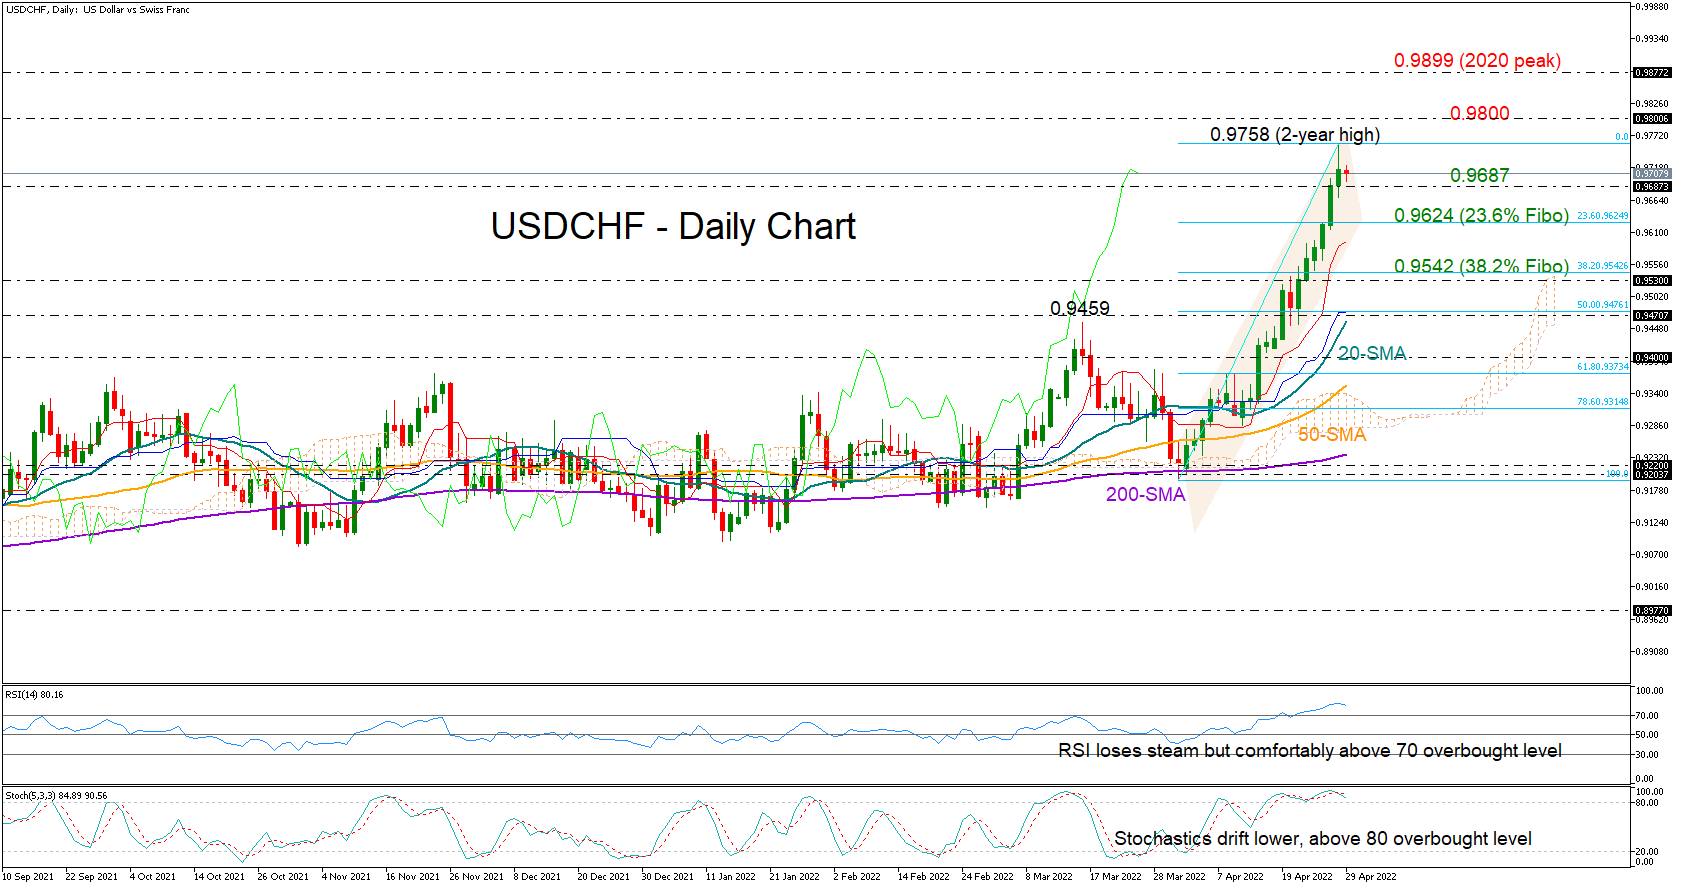
USDCHF has been in the green almost every single day since mid-April, stretching its exciting rally to a new two-year high of 0.9758 before easing a bit to 0.9700 early on Friday.
The continuous winning track is making investors wonder whether the bull run is overstretched as the RSI and the Stochastics seem to lose pace after advancing well above their 70 and 80 overbought levels, respectively. That said, both indicators are still hovering in the overbought territory and the market trend is clearly upwards and endorsed by the rising simple moving averages (SMAs). Hence, the 0.9800 psychological level will probably remain under scope for a bit longer.
Should buyers speed beyond 0.9800, the next challenge could be the 2020 peak of 0.9899. Interestingly, this overlaps with the 261.8% Fibonacci extension of the 0.9459 – 0.9194 downfall.
If the bearish scenario unfolds instead, the price may initially seek support around 0.9688. That area has been limiting both upside and downside movements over the past two days. Hence, a close lower from here could confirm another bearish correction towards 0.9623, which is also the 23.6% Fibonacci of the ongoing rally. Slightly lower, the red Tenkan-sen line at 0.9598 could prevent the test of the 38.2% Fibonacci of 0.9546. Yet, if the bears want to ruin the positive trend, they will need to sink deeper and particularly below the 50% Fibonacci and the previous high of 0.9459.
Summarizing, USDCHF maintains a strong bullish outlook in the short- and long-term picture, though a pullback is becoming increasingly likely as overbought signals flash red.
SNB Jordan: Swiss can withstand franc being stronger in nominal terms
SNB Chairman Thomas Jordan said two reasons have spoken against a rise in interest rate in reaction to inflation. "First, inflationary pressure is moderate here in Switzerland. Second, inflation is likely to return to the range compatible with price stability in the foreseeable future," he said.
SNB forecasts inflation to average 2.1% this year before declining in 2023 and 2024. "The monetary conditions are therefore appropriate at present," Jordan said. "However, should there be signs of a strengthening and spread in inflationary pressure, we will not hesitate to take the necessary measures."
On Swiss Franc exchange rate, he said, it there had been "hardly any change in the real exchange rate" over the past few quarters. "We do not react mechanically to every instance of upward pressure," he added. "If you have followed the Swiss franc closely over the past months, you will know that it has gradually appreciated and has at times even fallen below parity to the euro."
Also, SNB had "quite deliberately" allowed appreciation of the Franc. "This means that our economy can withstand the franc being stronger in nominal terms," Jordan said. "The higher prices abroad and the nominally stronger Swiss franc roughly balance one another out."
Germany GDP grew 0.2% qoq in Q1, Ukraine war weighs on short-term development
Germany GDP grew 0.2% qoq in Q1, matched expectations. On the same quarter a year earlier, GDP grew 3.7% yoy. The growth was mainly due to higher capital formation, whereas the balance of exports and imports had a downward effect on economic growth. The economic consequences of the war in Ukraine have had a growing impact on the short-term economic development since late February.
Dollar Paring Gains, Canadian Turning Stronger ahead of GDP
Dollar is paring some gains today but remains the strongest one for the week. Canadian Dollar is currently the second best. Euro is trying to recover but remains the second worst, just next to Sterling. Yen is trying to recover against Dollar too, but stays weak against European majors. Aussie and Kiwi are mixed for now but there is prospect of more recovery before the week ends.
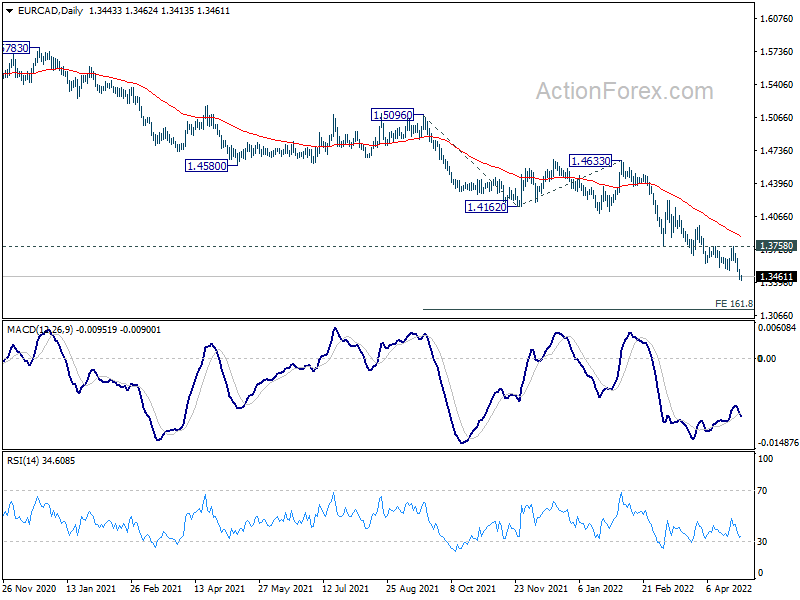
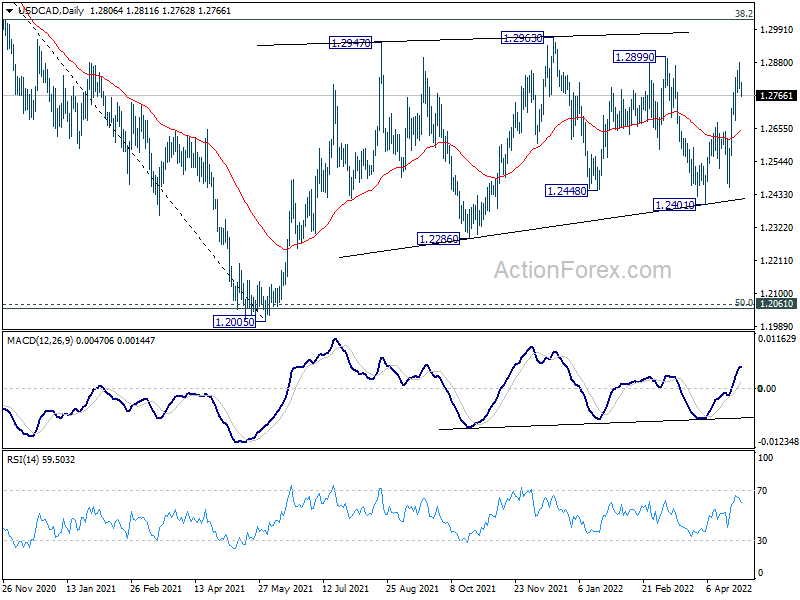
Technically, a focus today will be Canadian Dollar's reaction to GDP data. USD/CAD is retreating from 1.2879 but further rise is still in favor as long as 1.2675 support holds. However, break of 1.2675 will bring deeper fall back to 1.2401/2457 support zone, to extend medium term range trading. At the same time, EUR/CAD is probably picking up downside momentum, for next target at 161.8% projection of 1.5096 to 1.4162 from 1.4633 at 1.3122.
France GDP stagnated in Q1 with sharp decline in household consumption
France GDP stagnated with 0.0% qoq growth in Q1, below expectation of 0.3% qoq. Households' consumption expenditure sharply decreased (-1.3% after +0.6%) while gross fixed capital formation (GFCF) slightly decelerated (+0.2% after +0.3%). Finally, internal demand excluding inventory changes contributed to -0.6 points to GDP growth, after +0.5 points in the previous quarter.
Also from France, consumer spending dropped -1.3% mom in March, worse than expectation of -0.1% mom. CPI accelerated from 5.1% yoy to 5.4% yoy in April, above expectation of 5.1% yoy.
Swiss KOF economic barometer rose to 101.7, contrast between corona easing and war
Swiss KOF Economic Barometer improved from 99.7 to 101.7 in April, above expectation of 99.3. It's back above long-term average of 100 after dipping below that level in March. Outlook for the Swiss economy is therefore rather favorable in the short term.
KOF said, accommodation and food service activities and the other services sector are responsible for the rise. On the other hand, indicators for foreign demand are currently the strongest drag.
It added, "this contrast highlights the tension between Corona easing and international burdens, especially the Ukraine war."
Also from Swiss, retail sales dropped -6.6% yoy in March, below expectation of 13.3% yoy rise
Looking ahead
Eurozone GDP Q1 GDP and CPI are the main focuses in European session. Later in the day, Canada will release GDP. US will release personal income and spending, with PCE inflation. .
USD/CAD Daily Outlook
Daily Pivots: (S1) 1.2773; (P) 1.2826; (R1) 1.2862; More...
A temporary top is formed at 1.2879, ahead of 1.2899 resistance, with current retreat. Intraday bias in USD/CAD is turned neutral first. Further rise will remain mildly in favor as long as 1.2675 resistance turned support holds. Above 1.2879 should resume rise from 1.2401 towards 1.3022 fibonacci level. Decisive break there will carry larger bullish implications. However, break of 1.2675 will dampen this bullish view and bring deeper fall back to 1.2401 support instead.
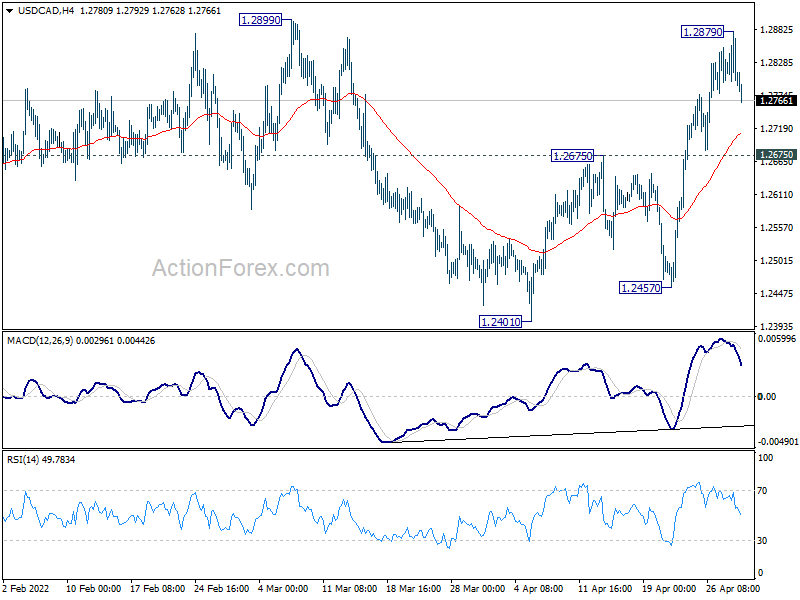
In the bigger picture, focus stays on 38.2% retracement of 1.4667 (2020 high) to 1.2005 (2021 low) at 1.3022. Sustained break there should confirm that the down trend from 1.4667 has completed after defending 1.2061 long term cluster support. Further rise would then be seen towards 61.8% retracement at 1.3650. However, rejection by 1.3022 will maintain medium term bearishness. Break of 1.2005 will resume the down trend from 1.4667 and that carries larger bearish implications too.
Economic Indicators Update
| GMT | Ccy | Events | Actual | Forecast | Previous | Revised |
|---|---|---|---|---|---|---|
| 01:30 | AUD | Private Sector Credit M/M Mar | 0.40% | 0.60% | 0.60% | |
| 01:30 | AUD | PPI Q/Q Q1 | 1.60% | 1.50% | 1.30% | |
| 01:30 | AUD | PPI Y/Y Q1 | 4.90% | 4.20% | 3.70% | |
| 05:30 | EUR | France Consumer Spending M/M Mar | -1.30% | -0.10% | 0.90% | |
| 05:30 | EUR | France GDP Q/Q Q1 P | 0.00% | 0.30% | 0.70% | 0.80% |
| 06:00 | EUR | Germany Import Price Index M/M Mar | 5.70% | 3.20% | 1.30% | |
| 06:30 | CHF | Real Retail Sales Y/Y Mar | -6.60% | 13.30% | 12.80% | 12.50% |
| 07:00 | CHF | KOF Leading Indicator Apr | 101.7 | 99.3 | 99.7 | |
| 08:00 | EUR | Germany GDP Q/Q Q1 P | 0.20% | -0.30% | ||
| 08:00 | EUR | Italy GDP Q/Q Q1 P | -0.20% | 0.60% | ||
| 08:00 | EUR | Eurozone M3 Money Supply Y/Y Mar | 6.20% | 6.30% | ||
| 09:00 | EUR | Eurozone GDP Q/Q Q1 P | 0.30% | 0.30% | ||
| 09:00 | EUR | Eurozone CPI Y/Y Apr P | 7.50% | 7.40% | ||
| 09:00 | EUR | Eurozone CPI Core Y/Y Apr P | 3.10% | 2.90% | ||
| 12:30 | CAD | GDP M/M Feb | 0.80% | 0.20% | ||
| 12:30 | USD | Personal Income M/M Mar | 0.40% | 0.50% | ||
| 12:30 | USD | Personal Spending Mar | 0.60% | 0.20% | ||
| 12:30 | USD | PCE Price Index M/M Mar | 0.60% | |||
| 12:30 | USD | PCE Price Index Y/Y Mar | 6.40% | |||
| 12:30 | USD | Core PCE Price Index M/M Mar | 0.30% | 0.40% | ||
| 12:30 | USD | Core PCE Price Index Y/Y Mar | 5.30% | 5.40% | ||
| 12:30 | USD | Employment Cost Index Q1 | 1.10% | 1.00% | ||
| 13:45 | USD | Chicago PMI Apr | 61.5 | 62.9 | ||
| 14:00 | USD | Michigan Consumer Sentiment Index Apr F | 65.7 | 65.7 |