Sample Category Title
Dollar Paring Gains, Canadian Turning Stronger ahead of GDP
Dollar is paring some gains today but remains the strongest one for the week. Canadian Dollar is currently the second best. Euro is trying to recover but remains the second worst, just next to Sterling. Yen is trying to recover against Dollar too, but stays weak against European majors. Aussie and Kiwi are mixed for now but there is prospect of more recovery before the week ends.
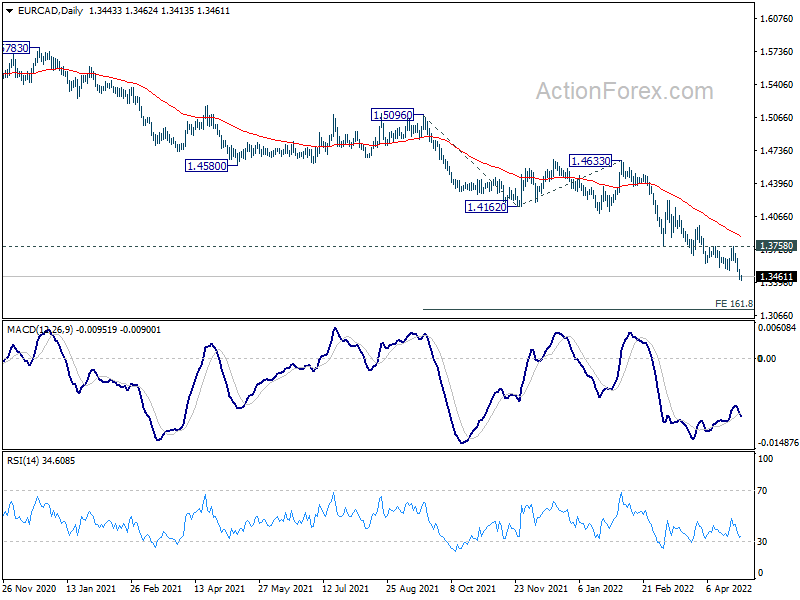
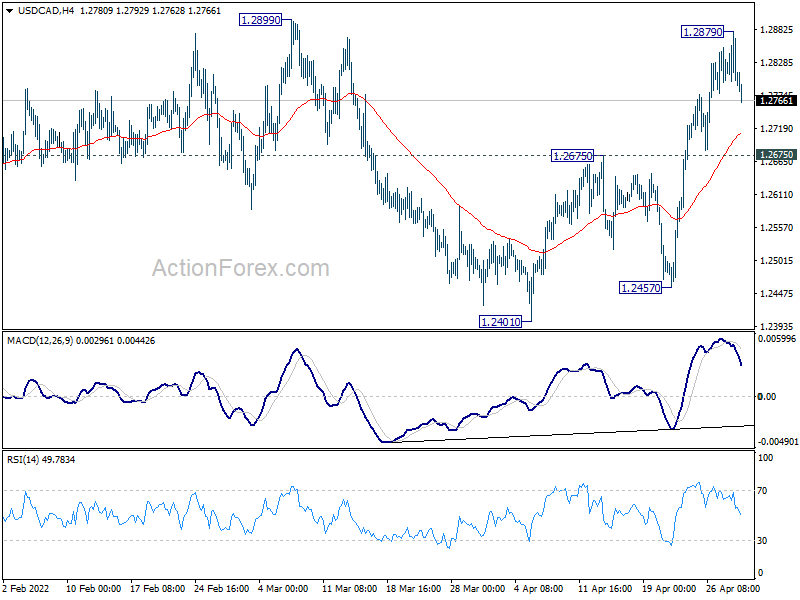
Technically, a focus today will be Canadian Dollar's reaction to GDP data. USD/CAD is retreating from 1.2879 but further rise is still in favor as long as 1.2675 support holds. However, break of 1.2675 will bring deeper fall back to 1.2401/2457 support zone, to extend medium term range trading. At the same time, EUR/CAD is probably picking up downside momentum, for next target at 161.8% projection of 1.5096 to 1.4162 from 1.4633 at 1.3122.
France GDP stagnated in Q1 with sharp decline in household consumption
France GDP stagnated with 0.0% qoq growth in Q1, below expectation of 0.3% qoq. Households' consumption expenditure sharply decreased (-1.3% after +0.6%) while gross fixed capital formation (GFCF) slightly decelerated (+0.2% after +0.3%). Finally, internal demand excluding inventory changes contributed to -0.6 points to GDP growth, after +0.5 points in the previous quarter.
Also from France, consumer spending dropped -1.3% mom in March, worse than expectation of -0.1% mom. CPI accelerated from 5.1% yoy to 5.4% yoy in April, above expectation of 5.1% yoy.
Swiss KOF economic barometer rose to 101.7, contrast between corona easing and war
Swiss KOF Economic Barometer improved from 99.7 to 101.7 in April, above expectation of 99.3. It's back above long-term average of 100 after dipping below that level in March. Outlook for the Swiss economy is therefore rather favorable in the short term.
KOF said, accommodation and food service activities and the other services sector are responsible for the rise. On the other hand, indicators for foreign demand are currently the strongest drag.
It added, "this contrast highlights the tension between Corona easing and international burdens, especially the Ukraine war."
Also from Swiss, retail sales dropped -6.6% yoy in March, below expectation of 13.3% yoy rise
Looking ahead
Eurozone GDP Q1 GDP and CPI are the main focuses in European session. Later in the day, Canada will release GDP. US will release personal income and spending, with PCE inflation. .
USD/CAD Daily Outlook
Daily Pivots: (S1) 1.2773; (P) 1.2826; (R1) 1.2862; More...
A temporary top is formed at 1.2879, ahead of 1.2899 resistance, with current retreat. Intraday bias in USD/CAD is turned neutral first. Further rise will remain mildly in favor as long as 1.2675 resistance turned support holds. Above 1.2879 should resume rise from 1.2401 towards 1.3022 fibonacci level. Decisive break there will carry larger bullish implications. However, break of 1.2675 will dampen this bullish view and bring deeper fall back to 1.2401 support instead.
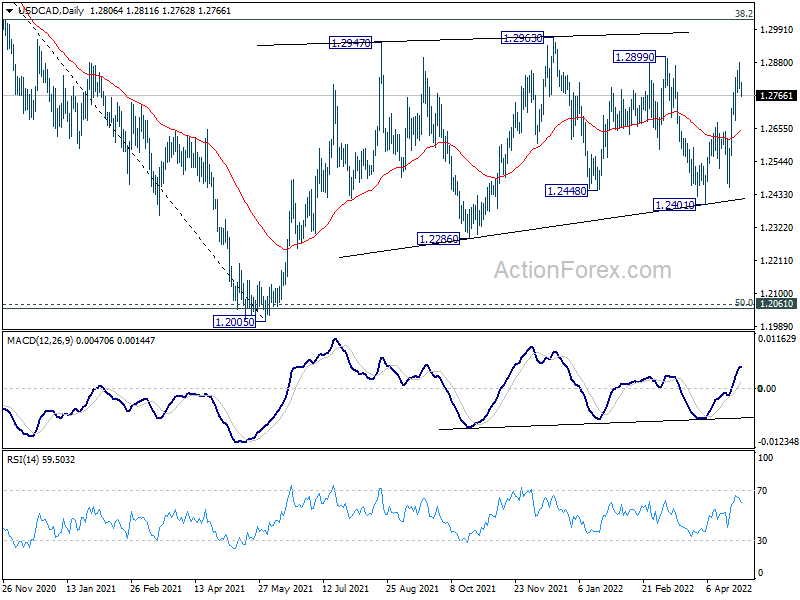
In the bigger picture, focus stays on 38.2% retracement of 1.4667 (2020 high) to 1.2005 (2021 low) at 1.3022. Sustained break there should confirm that the down trend from 1.4667 has completed after defending 1.2061 long term cluster support. Further rise would then be seen towards 61.8% retracement at 1.3650. However, rejection by 1.3022 will maintain medium term bearishness. Break of 1.2005 will resume the down trend from 1.4667 and that carries larger bearish implications too.
Economic Indicators Update
| GMT | Ccy | Events | Actual | Forecast | Previous | Revised |
|---|---|---|---|---|---|---|
| 01:30 | AUD | Private Sector Credit M/M Mar | 0.40% | 0.60% | 0.60% | |
| 01:30 | AUD | PPI Q/Q Q1 | 1.60% | 1.50% | 1.30% | |
| 01:30 | AUD | PPI Y/Y Q1 | 4.90% | 4.20% | 3.70% | |
| 05:30 | EUR | France Consumer Spending M/M Mar | -1.30% | -0.10% | 0.90% | |
| 05:30 | EUR | France GDP Q/Q Q1 P | 0.00% | 0.30% | 0.70% | 0.80% |
| 06:00 | EUR | Germany Import Price Index M/M Mar | 5.70% | 3.20% | 1.30% | |
| 06:30 | CHF | Real Retail Sales Y/Y Mar | -6.60% | 13.30% | 12.80% | 12.50% |
| 07:00 | CHF | KOF Leading Indicator Apr | 101.7 | 99.3 | 99.7 | |
| 08:00 | EUR | Germany GDP Q/Q Q1 P | 0.20% | -0.30% | ||
| 08:00 | EUR | Italy GDP Q/Q Q1 P | -0.20% | 0.60% | ||
| 08:00 | EUR | Eurozone M3 Money Supply Y/Y Mar | 6.20% | 6.30% | ||
| 09:00 | EUR | Eurozone GDP Q/Q Q1 P | 0.30% | 0.30% | ||
| 09:00 | EUR | Eurozone CPI Y/Y Apr P | 7.50% | 7.40% | ||
| 09:00 | EUR | Eurozone CPI Core Y/Y Apr P | 3.10% | 2.90% | ||
| 12:30 | CAD | GDP M/M Feb | 0.80% | 0.20% | ||
| 12:30 | USD | Personal Income M/M Mar | 0.40% | 0.50% | ||
| 12:30 | USD | Personal Spending Mar | 0.60% | 0.20% | ||
| 12:30 | USD | PCE Price Index M/M Mar | 0.60% | |||
| 12:30 | USD | PCE Price Index Y/Y Mar | 6.40% | |||
| 12:30 | USD | Core PCE Price Index M/M Mar | 0.30% | 0.40% | ||
| 12:30 | USD | Core PCE Price Index Y/Y Mar | 5.30% | 5.40% | ||
| 12:30 | USD | Employment Cost Index Q1 | 1.10% | 1.00% | ||
| 13:45 | USD | Chicago PMI Apr | 61.5 | 62.9 | ||
| 14:00 | USD | Michigan Consumer Sentiment Index Apr F | 65.7 | 65.7 |
Swiss KOF economic barometer rose to 101.7, contrast between corona easing and war
Swiss KOF Economic Barometer improved from 99.7 to 101.7 in April, above expectation of 99.3. It's back above long-term average of 100 after dipping below that level in March. Outlook for the Swiss economy is therefore rather favorable in the short term.
KOF said, accommodation and food service activities and the other services sector are responsible for the rise. On the other hand, indicators for foreign demand are currently the strongest drag.
It added, "this contrast highlights the tension between Corona easing and international burdens, especially the Ukraine war."

Also from Swiss, retail sales dropped -6.6% yoy in March, below expectation of 13.3% yoy rise.
France GDP stagnated in Q1 with sharp decline in household consumption
France GDP stagnated with 0.0% qoq growth in Q1, below expectation of 0.3% qoq. Households' consumption expenditure sharply decreased (-1.3% after +0.6%) while gross fixed capital formation (GFCF) slightly decelerated (+0.2% after +0.3%). Finally, internal demand excluding inventory changes contributed to -0.6 points to GDP growth, after +0.5 points in the previous quarter.
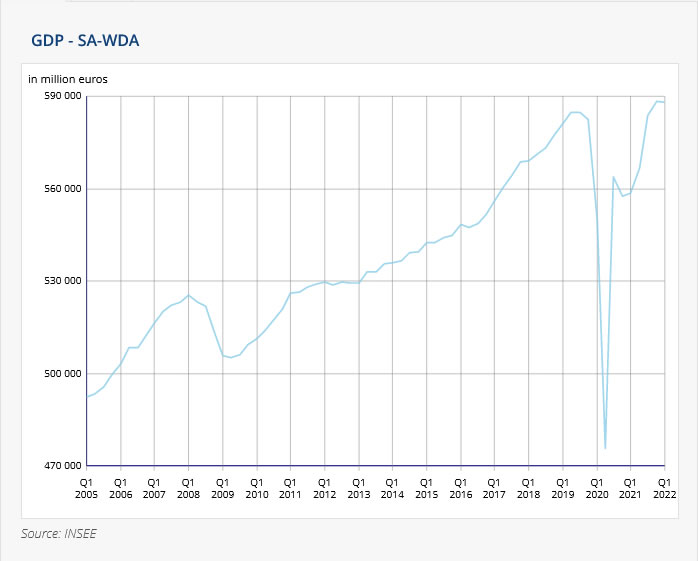
Also from France, consumer spending dropped -1.3% mom in March, worse than expectation of -0.1% mom. CPI accelerated from 5.1% yoy to 5.4% yoy in April, above expectation of 5.1% yoy.
Bitcoin: No Strength to Rise, No Desire to Fall
Bitcoin gained 2.1% on Thursday, ending the day around $39.9K, moderating Friday morning to $39.6K, cutting gains in the last 24 hours to 0.6%. Ethereum has added 1.1% in the past 24 hours. Prices of altcoins in the top 10 range from -4.4% (Terra) to +3.6% (Binance Coin).
The total capitalisation of the crypto market, according to CoinMarketCap, rose 0.25% overnight to $1.81 trillion. The Bitcoin Dominance Index added 0.1 points to 41.6%. The cryptocurrency Fear and Greed Index was down 1 point to 23 by Friday, remaining in “extreme fear”.
Bitcoin developed an upward correction on Thursday amid strengthening stock indices. However, the first cryptocurrency faces increased selloffs as it attempts to climb above 40k. The former uptrend support line is temporarily working as resistance.
At the same time, the BTCUSD is in an oversold position. The RSI index on the daily charts formed a double bottom in April against declining local price lows, which feeds timid hopes of exhausting the downward momentum and the possibility of a more reliable reversal.
Bitcoin now clearly needs global demand for risky assets and stock market support to push back the local negativity.
At the same time, the adoption and proliferation of cryptocurrencies are running their course, building a foundation for long-term optimism about the industry.
According to a survey by cryptocurrency exchange Bitstamp, 88% of institutional and 75% of retail investors believe that cryptocurrencies will become widespread before the end of the decade. Meanwhile, the confidence level in digital assets in emerging economies is markedly higher than in developed economies, where regulation is stricter.
According to El Salvador’s National Bureau of Economic Research (NBER), more than 20% of the country’s businesses accept bitcoin as a means of payment.
A big luxury real estate developer in UAE, DAMAC Properties, has announced that it is ready to accept payments in BTC and ETH.
US Congressman Patrick McHenry called for a separate regulator for the crypto industry and specific federal legislation. He criticised US regulators for their short-sightedness and lack of attention to the cryptocurrency industry.
Another recalculation of the first cryptocurrency’s mining complexity showed that the figure rose by 5.56% to 27.79 trillion hashes, setting another record. The new record complexity will make bitcoin mining more labour-intensive and less profitable and often accompanies the rise in bitcoin prices.
USDCAD Eases as it Fails to Clear the Upper Boundary of the Channel
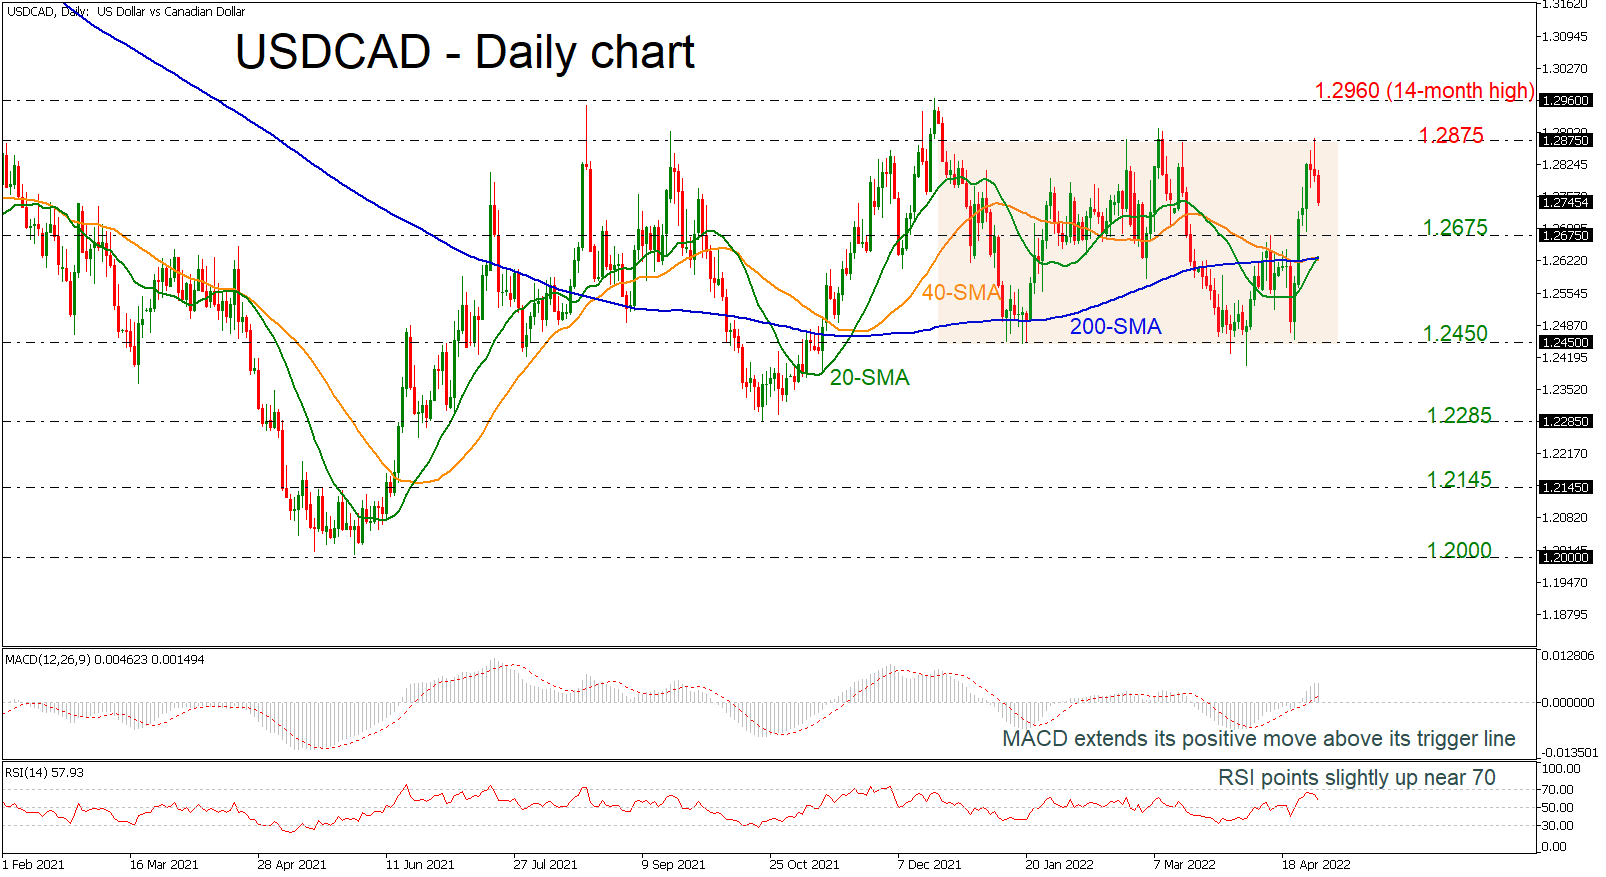
USDCAD was stubbornly fighting near the 1.2875 resistance, which is the upper boundary of the consolidation area of 1.2450-1.2875, but failed to jump above it. The area has been holding since December 2021 and only a violation of 1.2875 or below 1.2450 may change the neutral view.
The technical picture, however, suggests a bearish bias at the moment as the MACD remains positively charged above its red signal line but with weak momentum, while the RSI is currently pushing efforts for a downside reversal, as it is pointing down in the positive region. Despite the negative indications, the 20-day simple moving average (SMA) is ready to cross the 200-day SMA to the upside, suggesting more gains.
Should the upper boundary at 1.2875 crack, the price could initially test the 14-month high of 1.2960 before heading towards the 1.3175 resistance, taken from the peak in November 2020.
In the negative scenario where the pair moves lower the 1.2675 level could be the next target. Moving lower, the bears would need to drive below the SMAs at 1.2630 to access the lower boundary at 1.2450.
As regards the medium-term outlook, USDCAD is maintaining a neutral trajectory. Despite its resilience near 1.2875, the price has yet to show any clear bullish signals, climbing above the latter level to shift the outlook back to positive.
Dow Jones 30 Nears Critical Floor
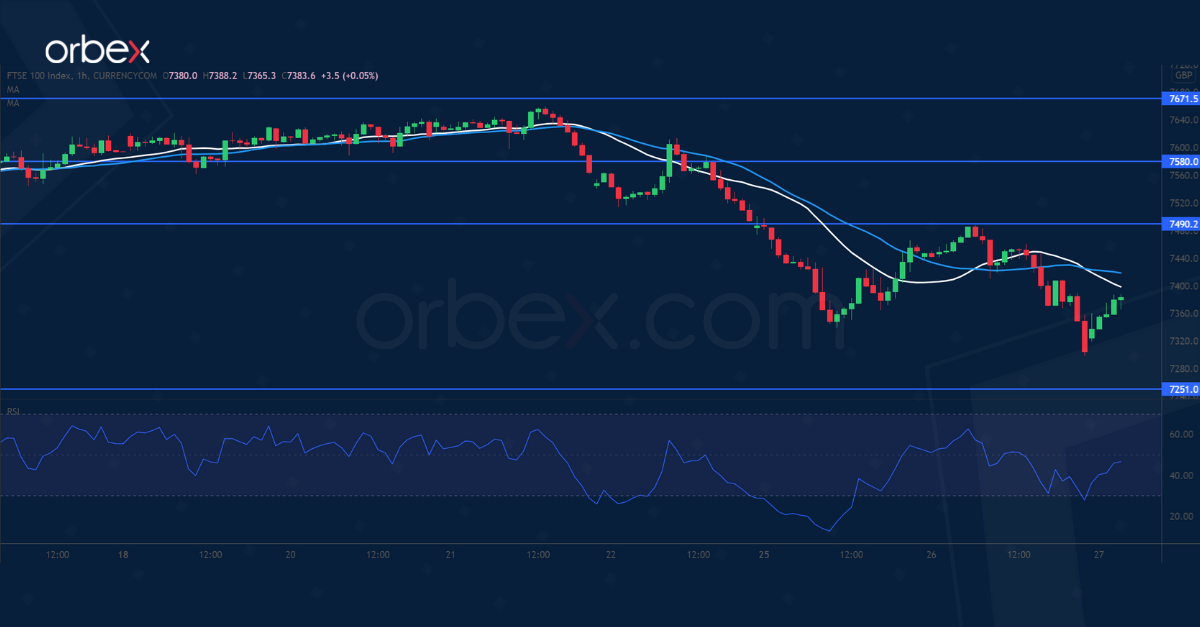
Dow Jones 30 steadies as a US GDP contraction may temper the Fed’s hawkish stance. The index has given up most gains from the March rally.
The demand zone between 32700 and 33000 is an important guardrail to keep the price afloat in the medium term. A bearish breakout could extend losses beyond 32300, leading up to a potential bear market.
A bullish RSI divergence is an encouraging sign as the sell-off could be slowing down. Nonetheless, buyers will need to push past 34150 to ease the selling pressure first.
NZD/USD Dips into Bearish Zone
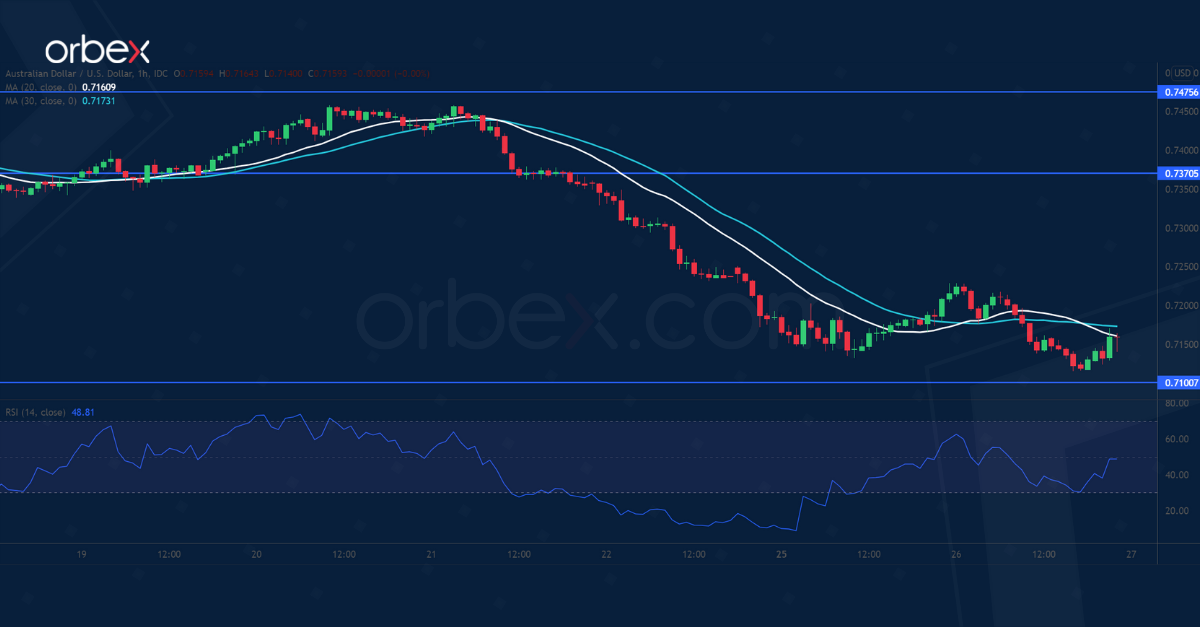
The New Zealand dollar continues southward amid a lack of demand for risk-sensitive currencies.
Sentiment turned bearish after price action failed to hold above this year’s low at 0.6530, invalidating a two-month-long recovery. The pair is heading to a 22-month low at 0.6390.
An oversold RSI may prompt short-term sellers to cover, driving up the price. However, 0.6590 is a fresh resistance, and there is a high chance of a dead cat bounce as trend followers could be waiting to sell into strength.
USD/JPY Breaks Higher
The yen nosedived after the Bank of Japan vowed to keep its interest rates ultra-low.
The dollar’s surge above the top range (129.30) of the recent consolidation forced early sellers to cover and switch sides. This breakout confirms the MA cross as an indication of a bullish acceleration.
Strong momentum suggests a combination of short-covering and fresh buying. The uptrend may resume towards 132.00 even though an overbought RSI could cause a temporary fallback. 128.30 at the base of the rally is the first support.
Technical Outlook and Review
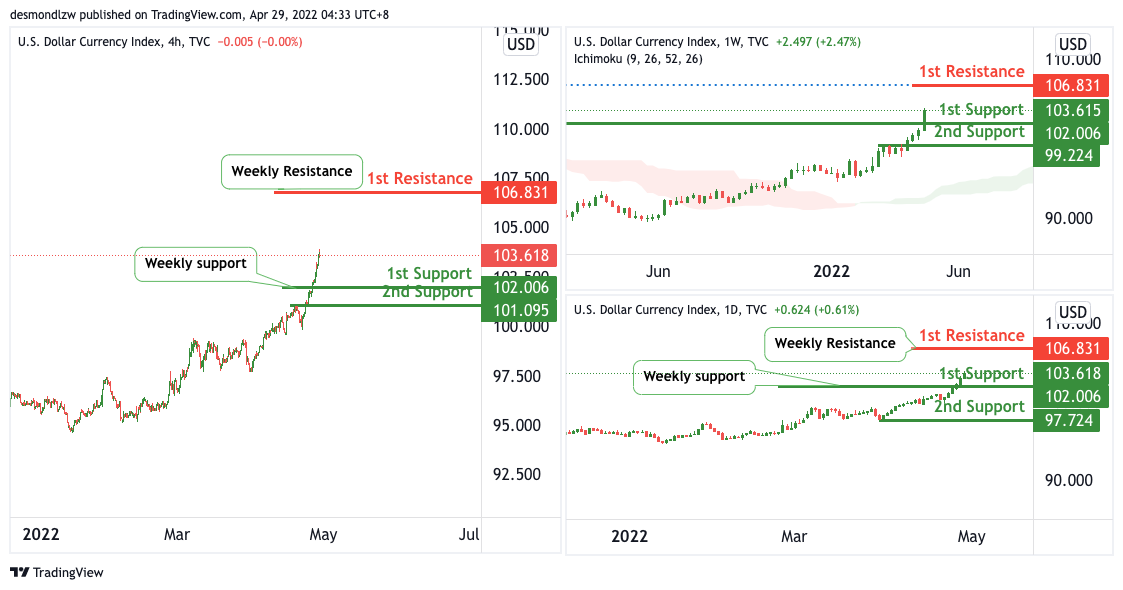
DXY:
On the Weekly, with price moving above the ichimoku cloud, we have a bullish bias that price will rise to our 1st resistance where the 127.2% Fibonacci extension is from our 1st support in line with the horizontal pullback support. Alternatively, price may break 1st support structure and head for 2nd support where the horizontal pullback support is.
On the Daily, with price moving above the ichimoku cloud, we have a bullish bias that price will rise to our 1st resistance where the weekly resistance is from our 1st support in line with the weekly support. Alternatively, price may break 1st support structure and head for 2nd support where the horizontal swing low support is.
On the H4, with price moving above the ichimoku cloud, we have a bullish bias that price will rise to our 1st resistance where the weekly resistance is from our 1st support in line with the weekly support. Alternatively, price may break 1st support structure and head for 2nd support where the horizontal swing low support is.
Areas of consideration:
- H4 time frame, 1st resistance at 106.831
- H4 time frame, 1st support at 102.006
XAU/USD (GOLD):
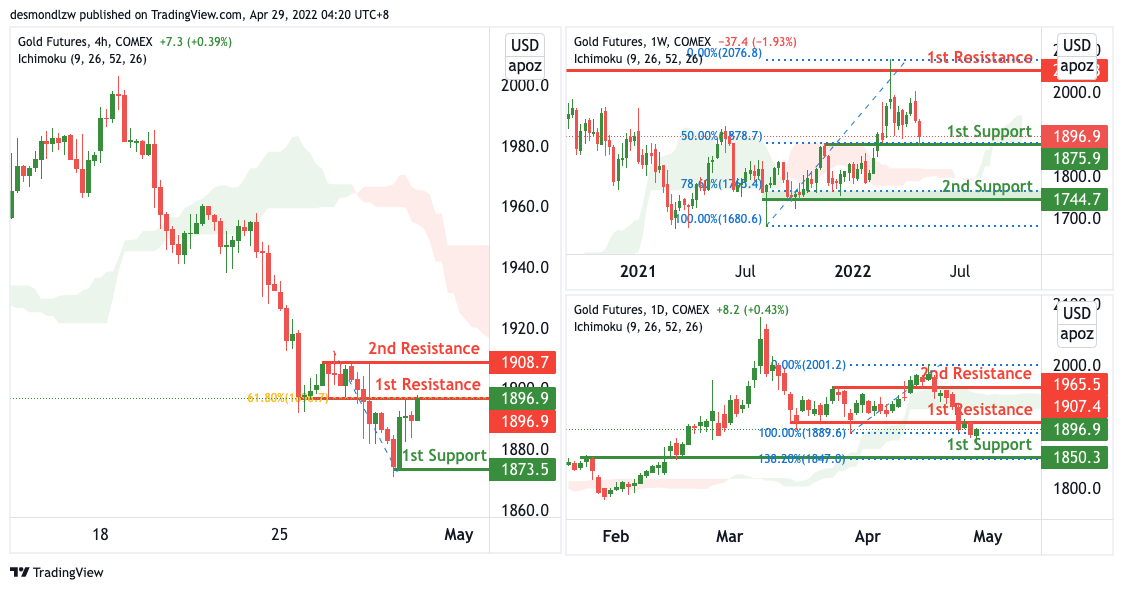
On the Weekly, with price moving above the ichimoku cloud, we have a bullish bias that price will rise to our 1st resistance where the swing high resistance is from our 1st support at 1875 in line with the horizontal pullback support and 50% Fibonacci retracement. Alternatively, price may break 1st support structure and head for 2nd support where the 78.6% Fibonacci retracement and swing low support is.
On the Daily, with price moving below the ichimoku cloud, we have a bearish bias that price will drop from our 1st resistance where the horizontal pullback resistance is to our 1st support in line with the horizontal pullback support and 138.2% Fibonacci extension is. Alternatively, price may break 1st resistance structure and head for 2nd resistance where the horizontal pullback resistance is.
On the H4, with price moving below the ichimoku cloud, we have a bearish bias that price will drop from our 1st resistance where the 61.8% Fibonacci retracement is to our 1st support in line with the horizontal swing low support. Alternatively, price may break 1st resistance structure and head for 2nd resistance where the horizontal swing high resistance is.
Areas of consideration:
- H4 time frame, 1st Resistance at 1896
- H4 time frame, 1st Support at 1873
GBP/USD:
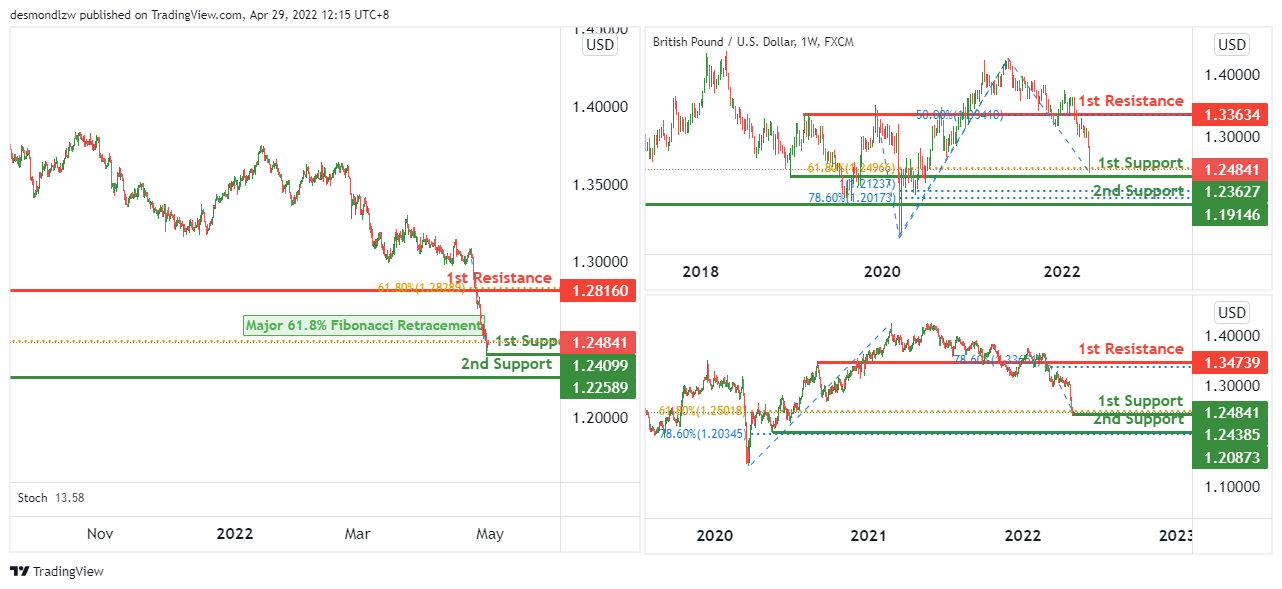
On the weekly, we expect price to potentially bounce from 1st support level of 1.23627 in line with 61.8% fibonacci retracement towards the 1st resistance level of 1.33634 in line with 50% fibonacci retracement.
On the daily, we expect price to potentially bounce from 1st support level of 1.24385 in line with 61.8% fibonacci retracement towards the 1st resistance level of 1.34739 in line with 78.6% fibonacci retracement.
On the H4, we have a bullish bias that price will bounce from 1st support level of 1.24099 which lines up with a major 61.8% fibonacci retracement towards the 1st resistance level of 1.28160 which lines up with 61.8% fibonacci retracement.
Areas of consideration:
- H4 1st resistance at 1.28160
- H4 1st support at 1.24099
- H4 2nd support at 1.22589
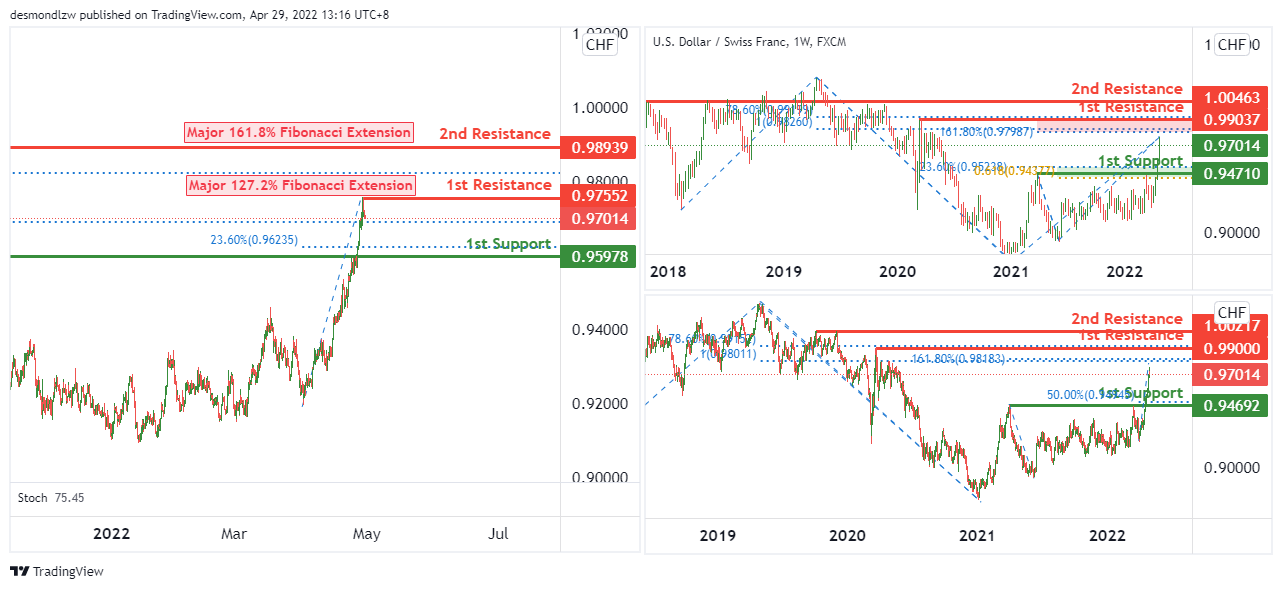
USD/CHF:
On the weekly, we expect that price will potentially reverse from 1st resistance level of 0.99037 in line with 78.6% fibonacci retracement, 161.8% fibonacci extension and100% fibonacci projection towards the 1st support level of 0.94710 in line with 23.6% fibonacci retracement and 61.8% fibonacci projection.
On the daily, we expect that price will potentially reverse from 1st resistance level of 0.99000 in line with 78.6% fibonacci retracement and 161.8% fibonacci extension towards the 1st support level of 0.94692 in line with 50% fibonacci retracement.
On the H4, we expect that price will potentially reverse from 1st resistance level of 0.97552 in line with a major 127.2% fibonacci extension towards the 1st support level of 0.95978 in line with 23.6% fibonacci retracement.
Areas of consideration
- 1st support level at 0.95978
- 1st resistance level at 0.97552
- 2nd resistance level at 0.98939
EUR/USD :
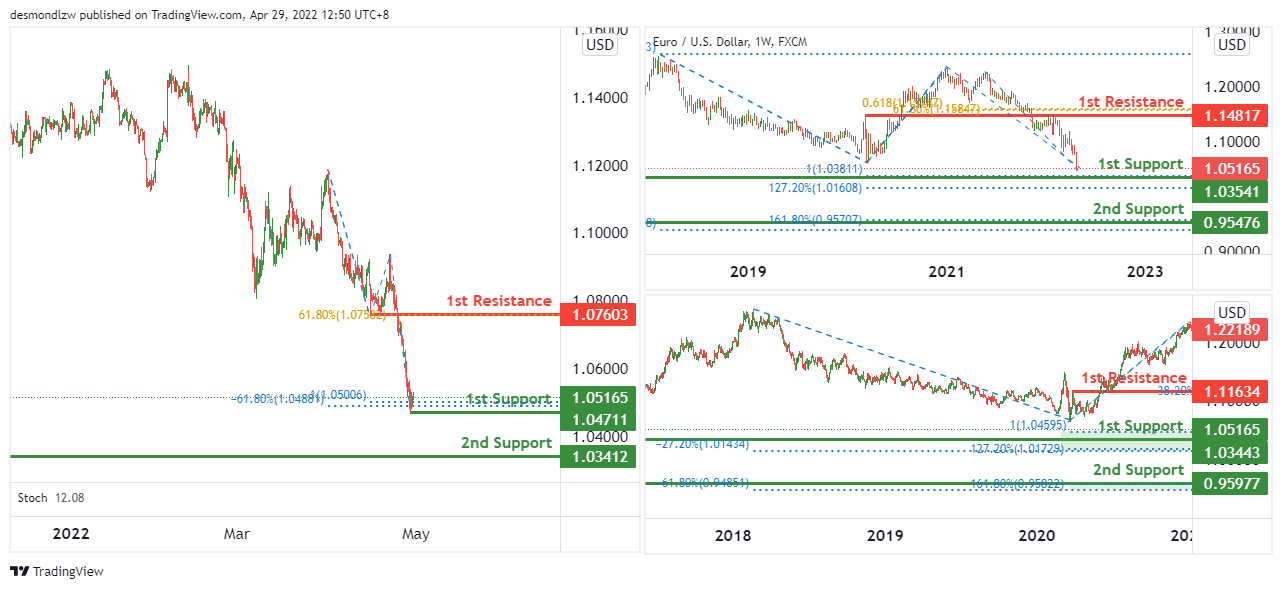
On the weekly, we expect price to potentially bounce from 1st support level of 1.03541 in line with 100% fibonacci projection and 127.2% fibonacci extension towards 1st resistance level of 1.14817 in line with 61.8% fibonacci retracement and 61.8% fibonacci projection.
On the daily, we expect price to potentially bounce from 1st support level of 1.03443 in line with 100% fibonacci projection, -27.2% fibonacci expansion and 127.2% fibonacci extension towards 1st resistance level of 1.11634 in line with 38.2% fibonacci retracement.
On the H4, price is near the pivot level. We expect price to potentially rise from 1st support level of 1.04711 in line with 100% fibonacci projection and -61.8% fibonacci expansion towards the 1st resistance level of 1.07603 in line with 61.8% fibonacci retracement.
Areas of consideration :
- H4 1st resistance at 1.07603
- H4 1st support at 1.04711
- H4 2nd support at 1.03412
USD/JPY:
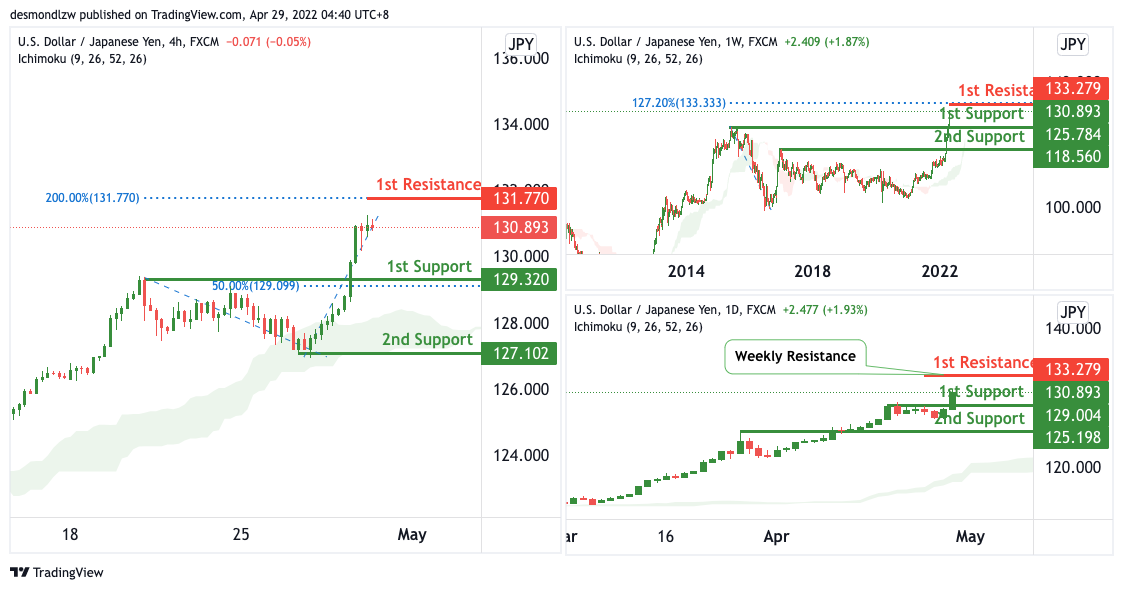
On the Weekly, with price moving above the ichimoku cloud, we have a bullish bias that price will rise to our 1st resistance where the s127.2% Fibonacci extension is from our 1st support in line with the horizontal pullback support. Alternatively, price may break 1st support structure and head for 2nd support where the horizontal pullback support is.
On the Daily, with price moving above the ichimoku cloud, we have a bullish bias that price will rise to our 1st resistance where the weekly resistance is from our 1st support in line with the horizontal pullback support. Alternatively, price may break 1st support structure and head for 2nd support where the horizontal pullback support is.
On the H4, with price moving above the ichimoku cloud, we have a bullish bias that price will rise to our 1st resistance where the 200% Fibonacci extension is from our 1st support in line with the horizontal pullback support and 50% Fibonacci retracement. Alternatively, price may break 1st support structure and head for 2nd support where the horizontal swing low support is.
Areas of consideration:
- H4 time frame, 1st resistance at 131.770
- H4 time frame, 1st support at 129.320
AUD/USD:
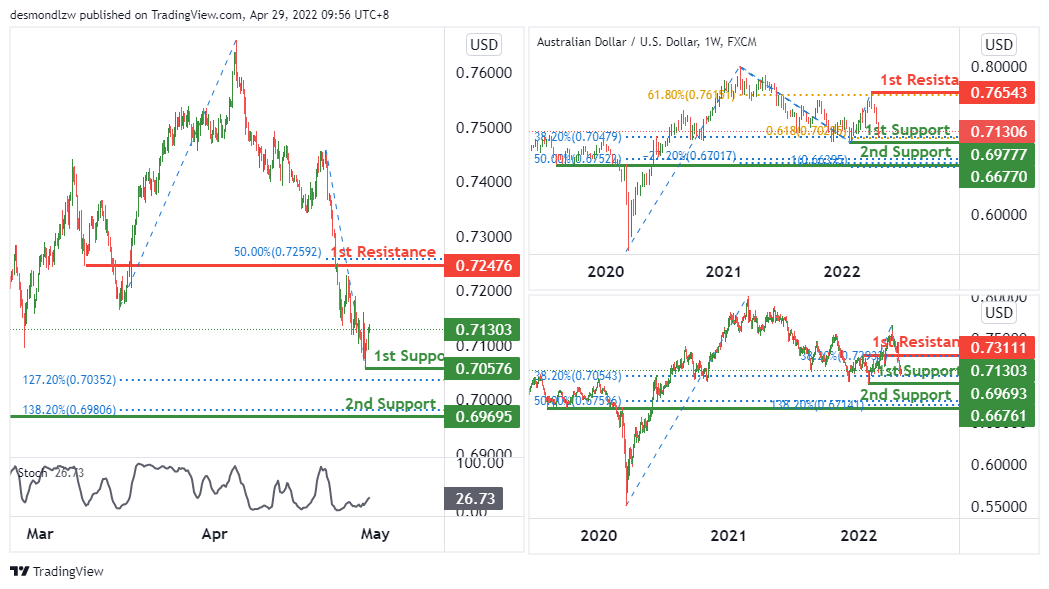
On the weekly timeframe, we see the potential of a bullish bounce from 1st support level of 0.69777 in line with 38.2% fibonacci retracement and 61.8% fibonacci projection towards the 1st resistance level of 61.8% fibonacci retracement.
On the daily timeframe, we expect to see a potential of a bullish bounce from 1st support level of 0.69693 in line with 38.2% fibonacci retracement towards the 1st resistance level of 0.73111 in line with 38.2% fibonacci retracement.
On the H4 timeframe, price is near the key support level, We see the potential of a bullish bounce from 1st support level of 0.70576 in line with 127.2% fibonacci extension towards the 1st resistance level of 0.72476 in line with 50% fibonacci retracement. Otherwise, price might break the key support level to trigger a dip towards the 2nd support of 0.69695 which is in line with 138.2% fibonacci extension.
Areas of consideration
- H4 1st resistance at 0.72476
- H4 1st support at 0.70576
- H4 2nd support at 0.69695
NZD/USD:
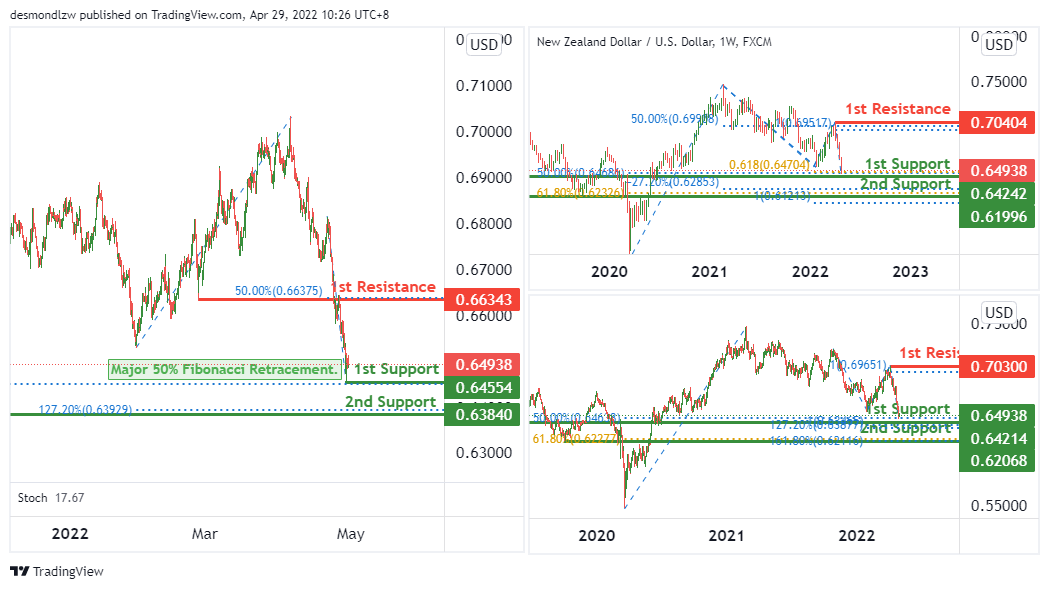
On the weekly, we see the potential for a bullish bounce from 1st support level of 0.64242 in line with 50% fibonacci retracement and 61.8% fibonacci projection towards the 1st resistance level of 0.70404 in line with 50% fibonacci retracement and 100% fibonacci projection.
On the daily, we see the potential for a bullish bounce from 1st support level of 0.64214 in line with 50% fibonacci retracement and 127.2% fibonacci extension towards the 1st resistance level of 0.70300 in line with 100% fibonacci projection.
On the H4, we see the potential of bullish bounce from 1st support level of 0.64554 in line up with a major 50% fibonacci retracement towards the 1st resistance level of 0.66343 in line with 50% fibonacci retracement.
Areas of consideration:
- H4 time frame, 1st support at 0.64554
- H4 time frame, 1st resistance at 0.66343
- H4 time frame, 2nd support at 0.63840
USD/CAD:
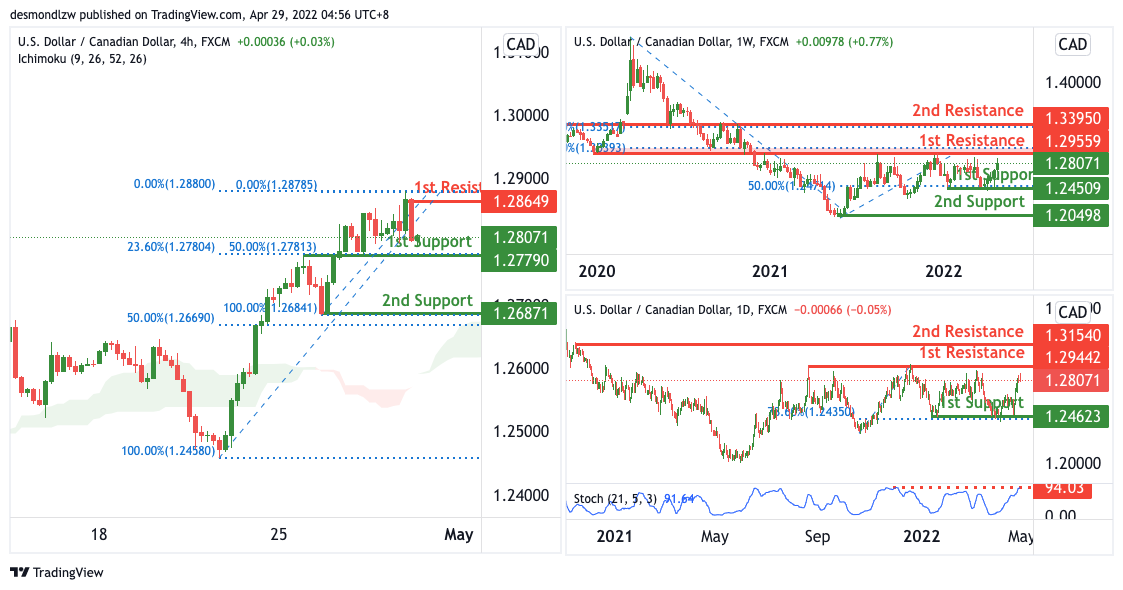
On the Weekly, with no clear indication of where price is going, we have a bias that price will continue to move within our rectangle with support at 1.24623 and resistance at 1.29559.
On the Daily, with price expected to reverse off the stochastics indicator, we have a bearish bias that price will drop from our 1st resistance where the swing high resistance is to our 1st support in line with the 78.6% Fibonacci retracement. Alternatively, price may break 1st resistance structure and head for 2nd resistance where the horizontal swing high resistance is.
On the H4, with price moving above the ichimoku cloud, we have a bullish bias that price will rise to our 1st resistance at 1.28649 where the swing high resistance is from our 1st support at 1.27790 in line with the horizontal pullback support, 23.6% and 50% Fibonacci retracement. Alternatively, price may break 1st support structure and head for 2nd support where the horizontal swing low support and 50% Fibonacci retracement is.
Areas of consideration:
- H4 time frame, 1st resistance at 1.28649
- H4 time frame, 1st support at 1.27790
OIL:
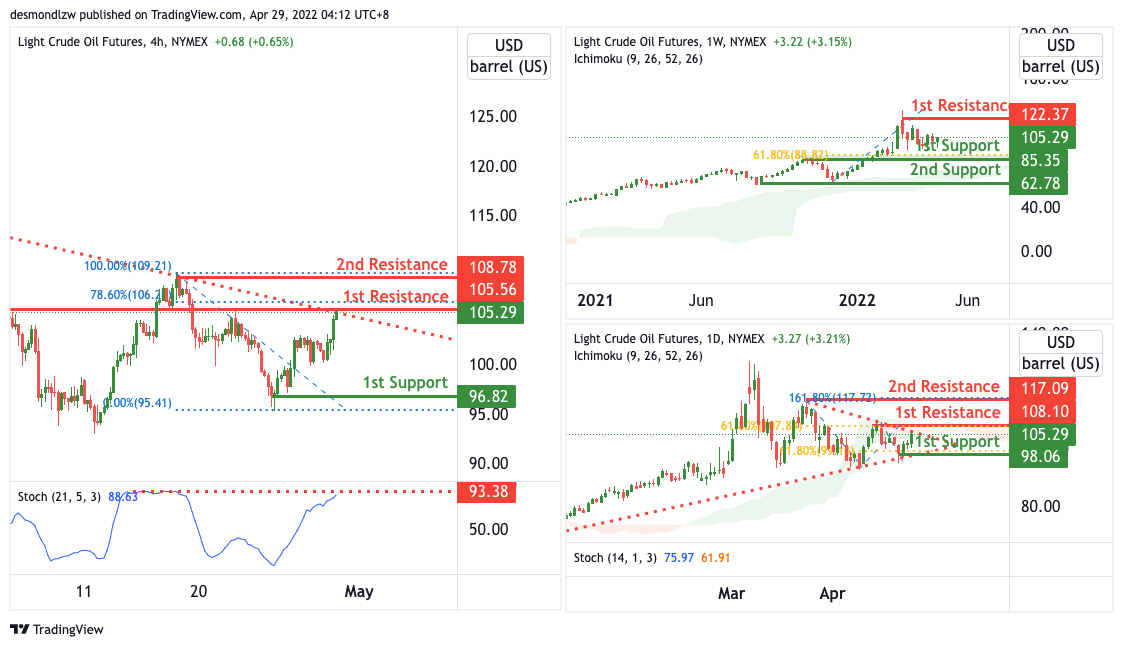
On the Weekly, with price moving above the ichimoku cloud, we have a bullish bias that price will rise to our 1st resistance where the swing high resistance is from our 1st support in line with the horizontal pullback support and 61.8% Fibonacci retracement. Alternatively, price may break 1st support structure and head for 2nd support where the horizontal swing low support is.
On the Daily, with price expected to reverse off the resistance of the ichimoku cloud and the resistance of the triangle, we have a bearish bias that price will drop from our 1st resistance at 108.10 where the swing high resistance and 61.8% Fibonacci retracement is to our 1st support at 98.06 in line with the horizontal swing low support and 61.8% Fibonacci retracement. Alternatively, price may break 1st resistance structure and head for 2nd resistance where the horizontal swing high resistance and 161.8% Fibonacci extension at 117.09.
On the H4, with price expected to reverse off the resistance of the stochastics indicator and the resistance of the descending trendline, we have a bearish bias that price will drop from our 1st resistance at 105.56 where the swing high resistance and 78.6% Fibonacci retracement is to our 1st support at 96.82 in line with the horizontal swing low support. Alternatively, price may break 1st resistance structure and head for 2nd resistance where the horizontal swing high resistance at 108.78.
Areas of consideration:
- H4 time frame, 1st resistance of 105.56
- H4 time frame, 1st support of 96.82
Dow Jones Industrial Average:
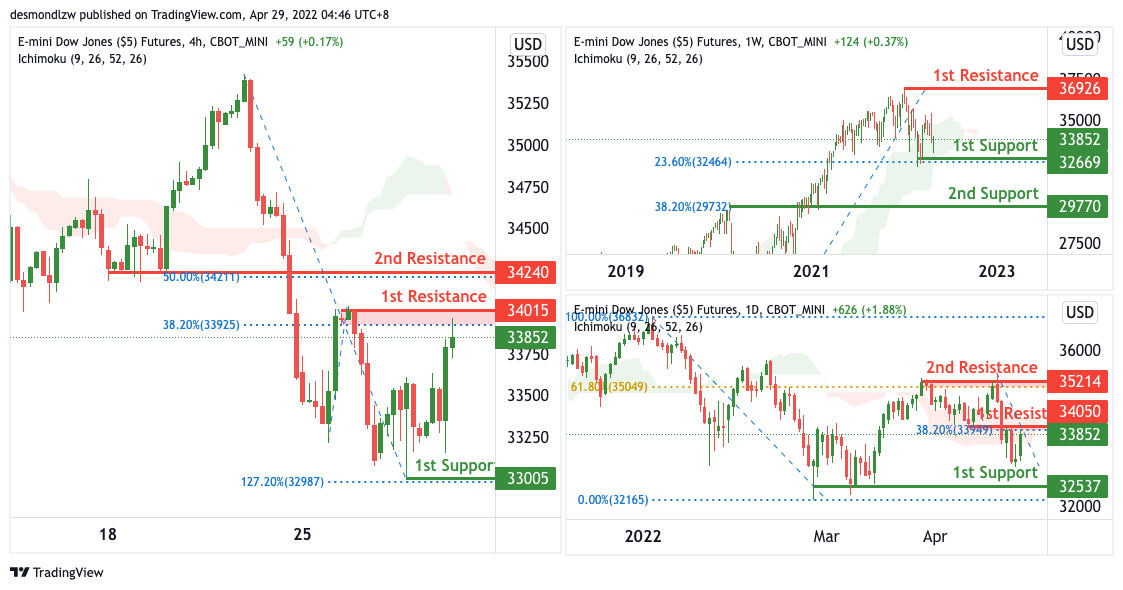
On the Weekly, with price expected to bounce off the support of the ichimoku cloud, we have a bullish bias that price will rise to our 1st resistance where the swing high resistance is from our 1st support in line with the horizontal swing low support and 23.6% Fibonacci retracement. Alternatively, price may break 1st support structure and head for 2nd support where the horizontal pullback support and 38.2% Fibonacci retracement is.
On the Daily, with price expected to reverse off the resistance of the ichimoku cloud, we have a bearish bias that price will drop from our 1st resistance where the pullback resistance and 38.2% Fibonacci retracement is to our 1st support in line with the horizontal swing low support. Alternatively, price may break 1st resistance structure and head for 2nd resistance where the horizontal swing high resistance and 61.8% Fibonacci retracement.
On the H4, with price moving below the ichimoku cloud, we have a bearish bias that price will drop from our 1st resistance at 30415 where the swing high resistance and 38.2% Fibonacci retracement is to our 1st support at 33005 in line with the horizontal swing low support. Alternatively, price may break 1st resistance structure and head for 2nd resistance where the horizontal pullback resistance and 50% Fibonacci retracement.
Areas of consideration :
- H4 time frame, 1st resistance at 30415
- H4 time frame, 1st support at 33005
EUR/USD Daily Outlook
Daily Pivots: (S1) 1.0460; (P) 1.0512 (R1) 1.0553; More...
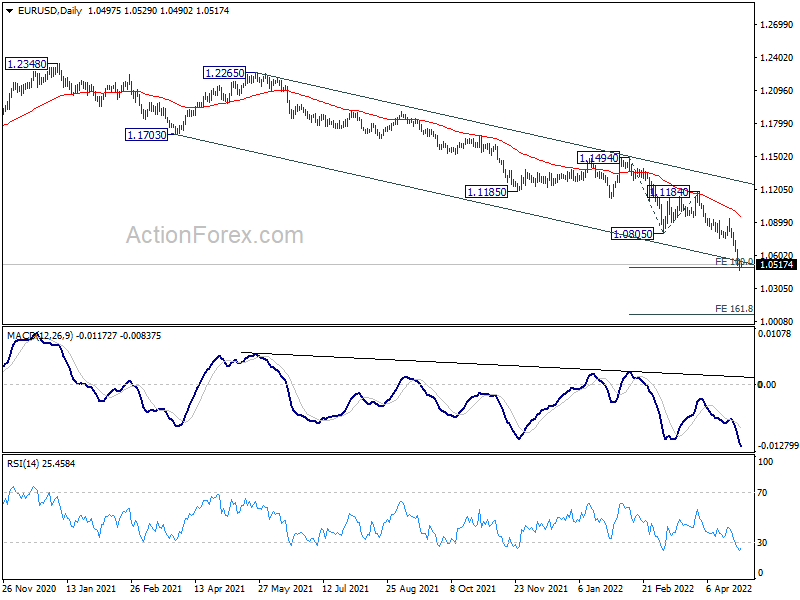
Intraday bias in EUR/USD remains mildly on the downside for the moment. Sustained break of 100% projection of 1.1494 to 1.0805 from 1.1184 at 1.0495 will pave the way to 161.8% projection at 1.0069. On the upside, above 1.0584 minor resistance will turn bias neutral and bring consolidations. But upside should be limited by 1.0756 support turned resistance to bring fall resumption.
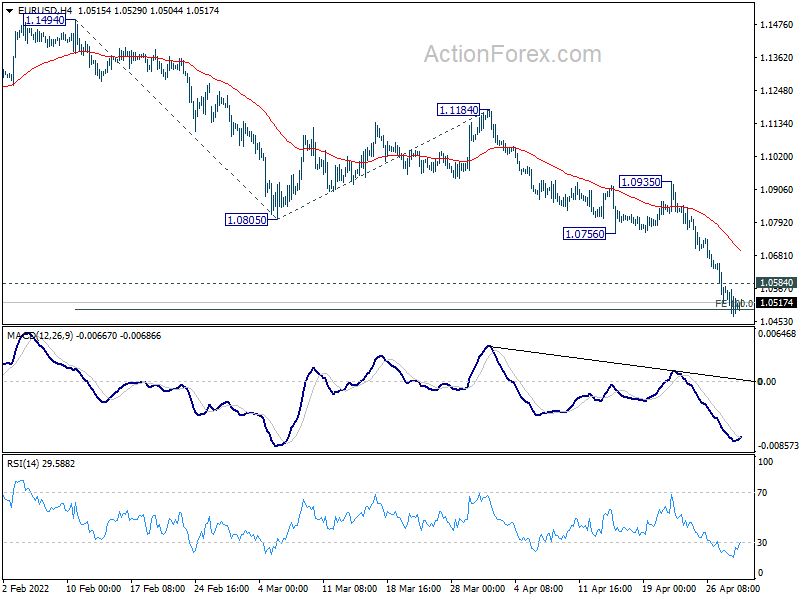
In the bigger picture, the decline from 1.2348 (2021 high) is expected to continue as long as 1.1185 support turned resistance holds. The break of 1.0635 (2020 low) now raises the chance that it's resuming long term down trend from 1.6039 (2008 high). Retest of 1.0339 (2017 low) low should be seen next. Decisive break there will confirm this bearish case.