Sample Category Title
Technical Outlook and Review
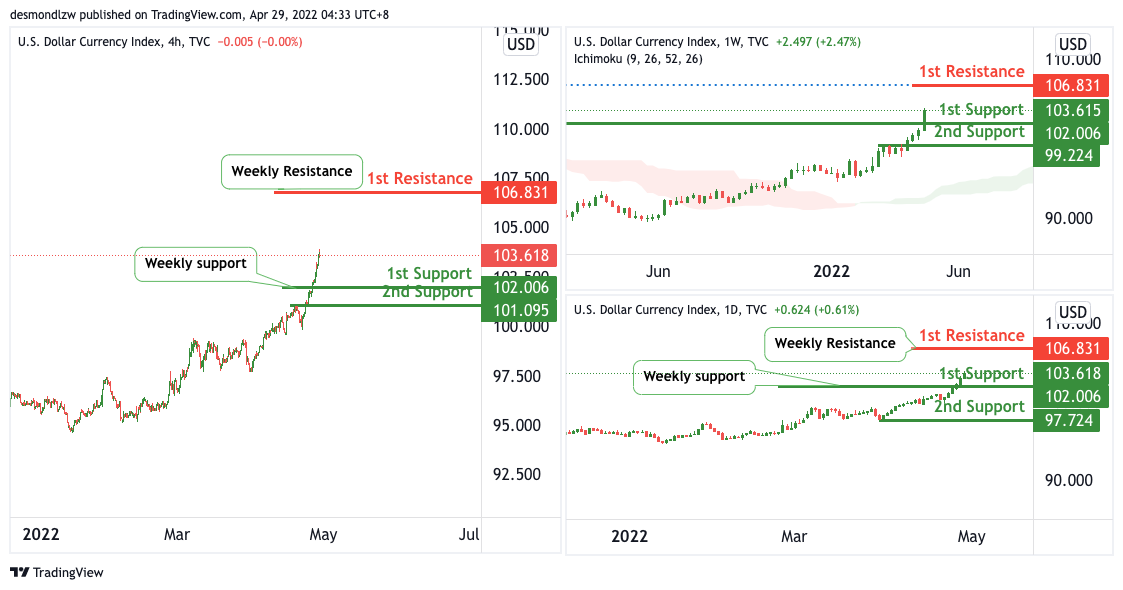
DXY:
On the Weekly, with price moving above the ichimoku cloud, we have a bullish bias that price will rise to our 1st resistance where the 127.2% Fibonacci extension is from our 1st support in line with the horizontal pullback support. Alternatively, price may break 1st support structure and head for 2nd support where the horizontal pullback support is.
On the Daily, with price moving above the ichimoku cloud, we have a bullish bias that price will rise to our 1st resistance where the weekly resistance is from our 1st support in line with the weekly support. Alternatively, price may break 1st support structure and head for 2nd support where the horizontal swing low support is.
On the H4, with price moving above the ichimoku cloud, we have a bullish bias that price will rise to our 1st resistance where the weekly resistance is from our 1st support in line with the weekly support. Alternatively, price may break 1st support structure and head for 2nd support where the horizontal swing low support is.
Areas of consideration:
- H4 time frame, 1st resistance at 106.831
- H4 time frame, 1st support at 102.006
XAU/USD (GOLD):
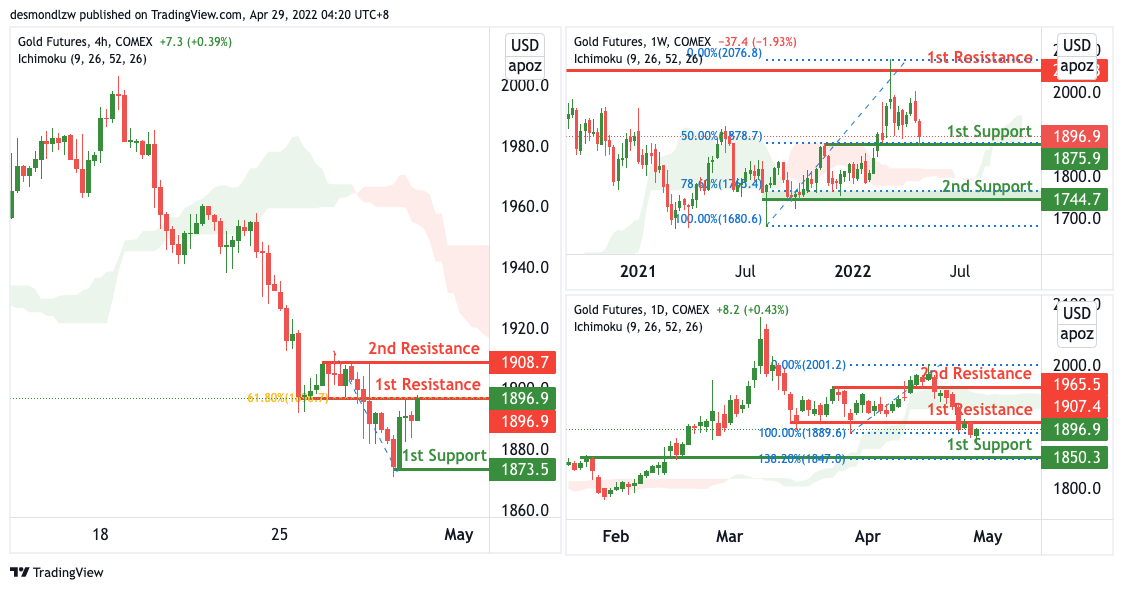
On the Weekly, with price moving above the ichimoku cloud, we have a bullish bias that price will rise to our 1st resistance where the swing high resistance is from our 1st support at 1875 in line with the horizontal pullback support and 50% Fibonacci retracement. Alternatively, price may break 1st support structure and head for 2nd support where the 78.6% Fibonacci retracement and swing low support is.
On the Daily, with price moving below the ichimoku cloud, we have a bearish bias that price will drop from our 1st resistance where the horizontal pullback resistance is to our 1st support in line with the horizontal pullback support and 138.2% Fibonacci extension is. Alternatively, price may break 1st resistance structure and head for 2nd resistance where the horizontal pullback resistance is.
On the H4, with price moving below the ichimoku cloud, we have a bearish bias that price will drop from our 1st resistance where the 61.8% Fibonacci retracement is to our 1st support in line with the horizontal swing low support. Alternatively, price may break 1st resistance structure and head for 2nd resistance where the horizontal swing high resistance is.
Areas of consideration:
- H4 time frame, 1st Resistance at 1896
- H4 time frame, 1st Support at 1873
GBP/USD:
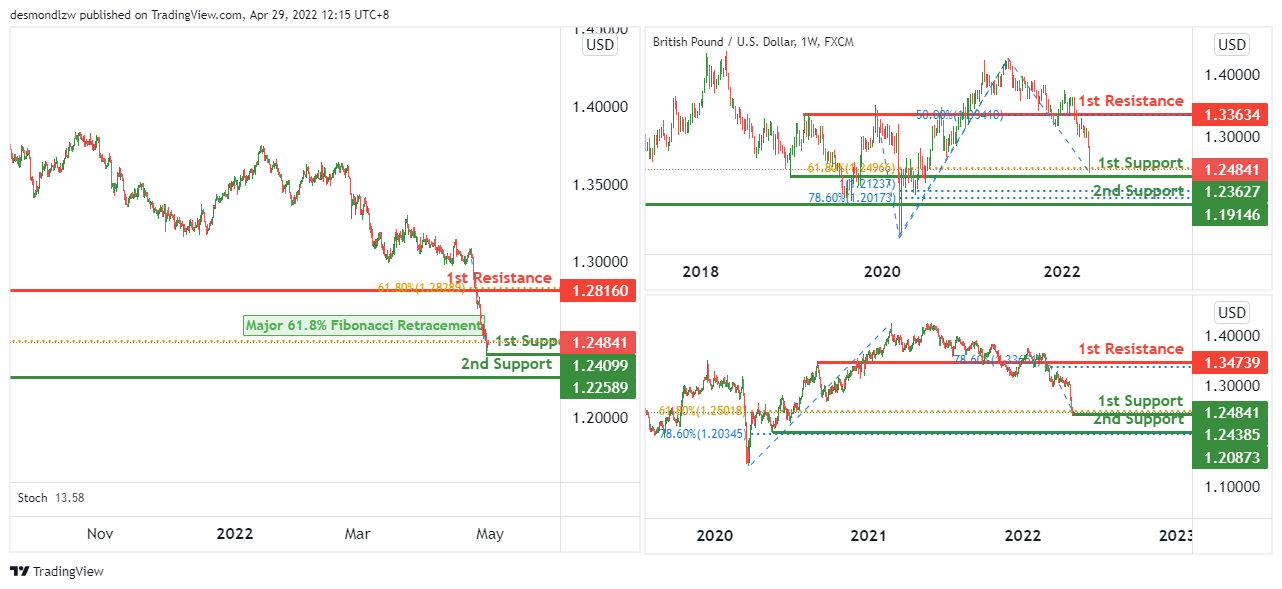
On the weekly, we expect price to potentially bounce from 1st support level of 1.23627 in line with 61.8% fibonacci retracement towards the 1st resistance level of 1.33634 in line with 50% fibonacci retracement.
On the daily, we expect price to potentially bounce from 1st support level of 1.24385 in line with 61.8% fibonacci retracement towards the 1st resistance level of 1.34739 in line with 78.6% fibonacci retracement.
On the H4, we have a bullish bias that price will bounce from 1st support level of 1.24099 which lines up with a major 61.8% fibonacci retracement towards the 1st resistance level of 1.28160 which lines up with 61.8% fibonacci retracement.
Areas of consideration:
- H4 1st resistance at 1.28160
- H4 1st support at 1.24099
- H4 2nd support at 1.22589
USD/CHF:
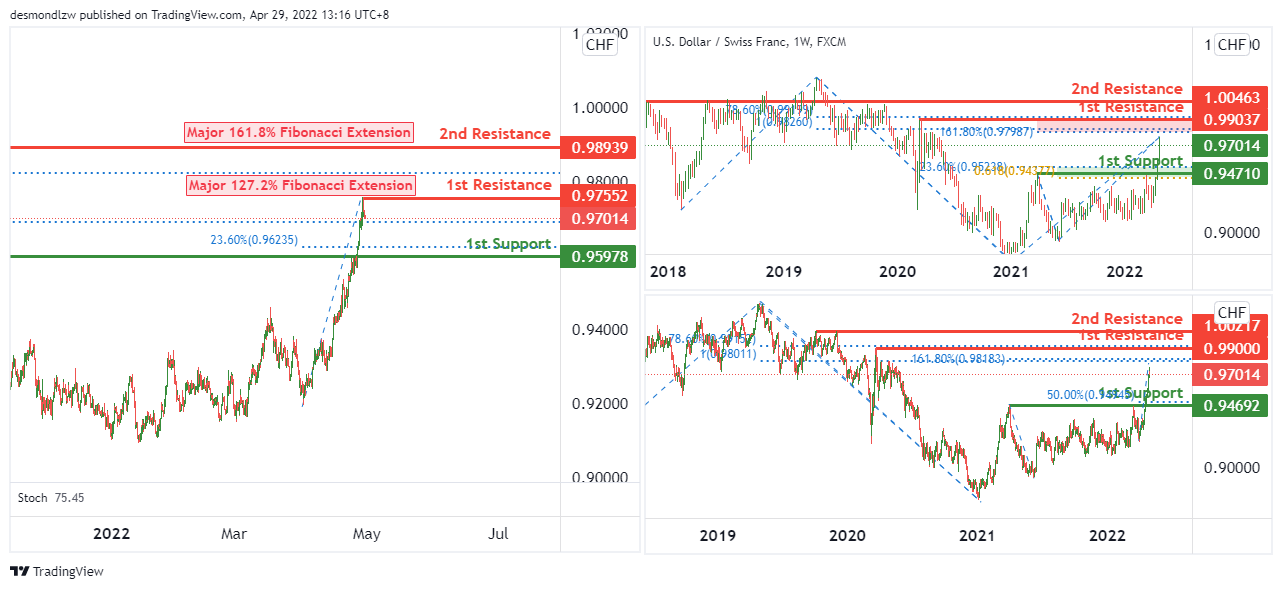
On the weekly, we expect that price will potentially reverse from 1st resistance level of 0.99037 in line with 78.6% fibonacci retracement, 161.8% fibonacci extension and100% fibonacci projection towards the 1st support level of 0.94710 in line with 23.6% fibonacci retracement and 61.8% fibonacci projection.
On the daily, we expect that price will potentially reverse from 1st resistance level of 0.99000 in line with 78.6% fibonacci retracement and 161.8% fibonacci extension towards the 1st support level of 0.94692 in line with 50% fibonacci retracement.
On the H4, we expect that price will potentially reverse from 1st resistance level of 0.97552 in line with a major 127.2% fibonacci extension towards the 1st support level of 0.95978 in line with 23.6% fibonacci retracement.
Areas of consideration
- 1st support level at 0.95978
- 1st resistance level at 0.97552
- 2nd resistance level at 0.98939
EUR/USD :
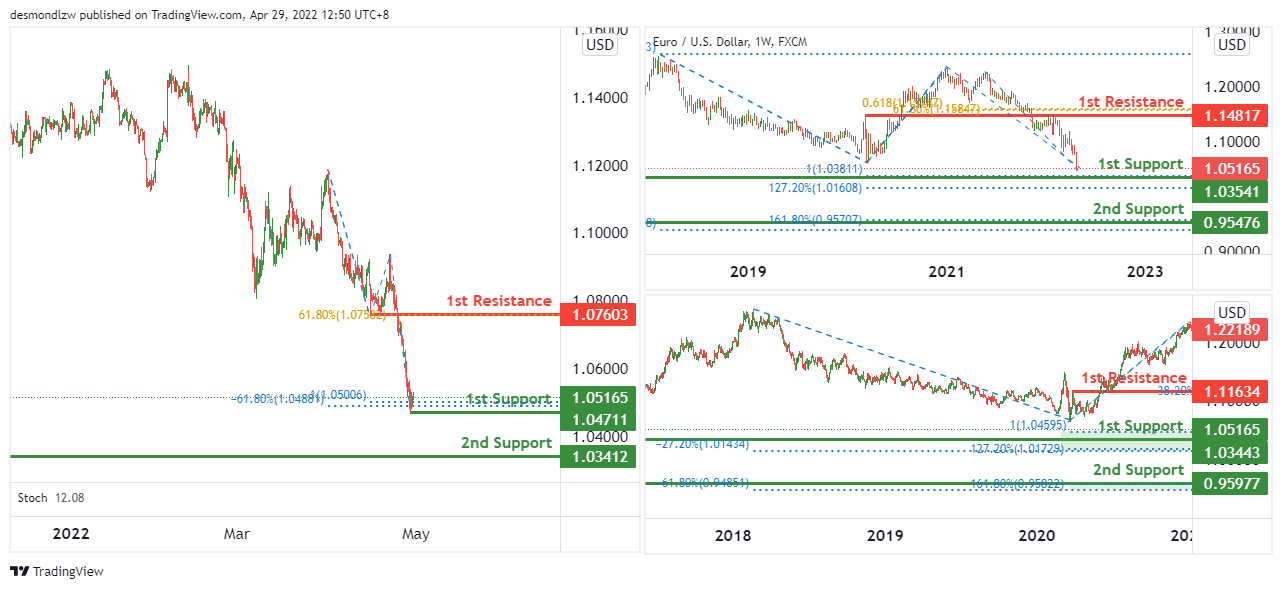
On the weekly, we expect price to potentially bounce from 1st support level of 1.03541 in line with 100% fibonacci projection and 127.2% fibonacci extension towards 1st resistance level of 1.14817 in line with 61.8% fibonacci retracement and 61.8% fibonacci projection.
On the daily, we expect price to potentially bounce from 1st support level of 1.03443 in line with 100% fibonacci projection, -27.2% fibonacci expansion and 127.2% fibonacci extension towards 1st resistance level of 1.11634 in line with 38.2% fibonacci retracement.
On the H4, price is near the pivot level. We expect price to potentially rise from 1st support level of 1.04711 in line with 100% fibonacci projection and -61.8% fibonacci expansion towards the 1st resistance level of 1.07603 in line with 61.8% fibonacci retracement.
Areas of consideration :
- H4 1st resistance at 1.07603
- H4 1st support at 1.04711
- H4 2nd support at 1.03412
USD/JPY:
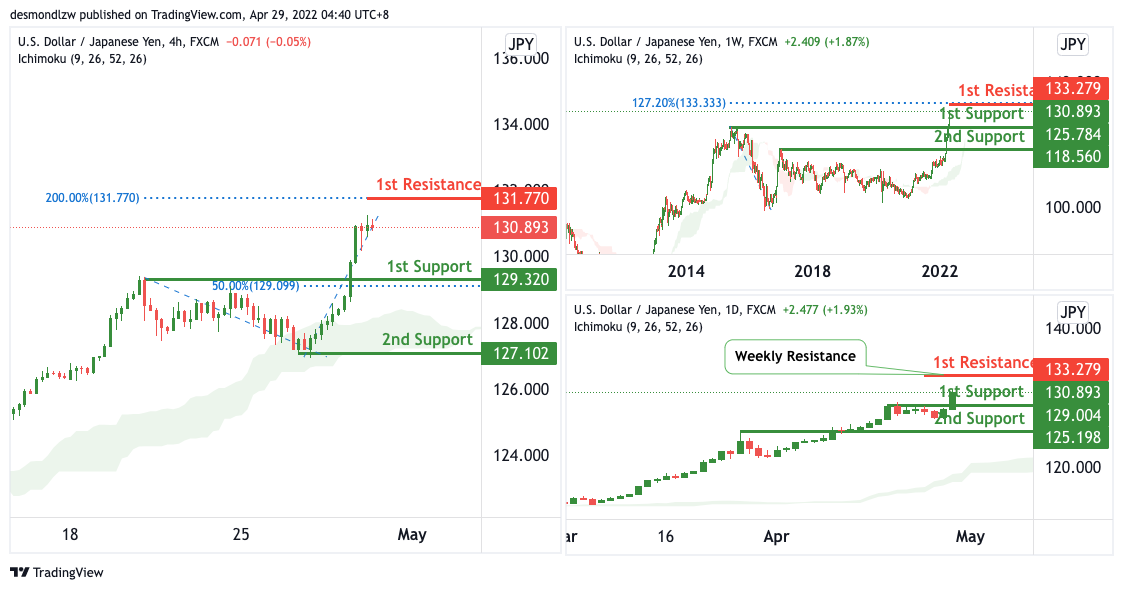
On the Weekly, with price moving above the ichimoku cloud, we have a bullish bias that price will rise to our 1st resistance where the s127.2% Fibonacci extension is from our 1st support in line with the horizontal pullback support. Alternatively, price may break 1st support structure and head for 2nd support where the horizontal pullback support is.
On the Daily, with price moving above the ichimoku cloud, we have a bullish bias that price will rise to our 1st resistance where the weekly resistance is from our 1st support in line with the horizontal pullback support. Alternatively, price may break 1st support structure and head for 2nd support where the horizontal pullback support is.
On the H4, with price moving above the ichimoku cloud, we have a bullish bias that price will rise to our 1st resistance where the 200% Fibonacci extension is from our 1st support in line with the horizontal pullback support and 50% Fibonacci retracement. Alternatively, price may break 1st support structure and head for 2nd support where the horizontal swing low support is.
Areas of consideration:
- H4 time frame, 1st resistance at 131.770
- H4 time frame, 1st support at 129.320
AUD/USD:
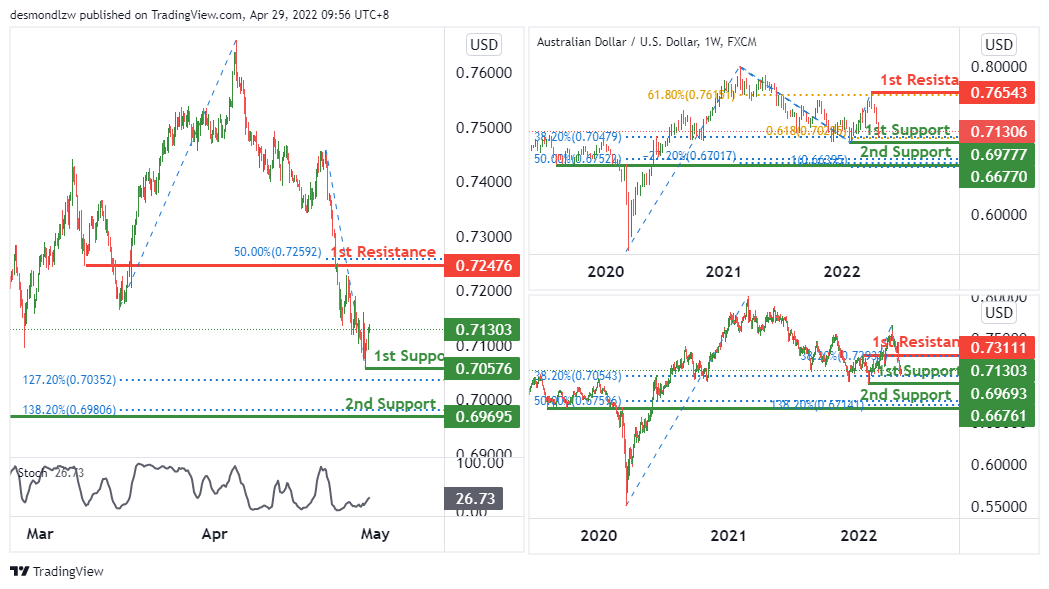
On the weekly timeframe, we see the potential of a bullish bounce from 1st support level of 0.69777 in line with 38.2% fibonacci retracement and 61.8% fibonacci projection towards the 1st resistance level of 61.8% fibonacci retracement.
On the daily timeframe, we expect to see a potential of a bullish bounce from 1st support level of 0.69693 in line with 38.2% fibonacci retracement towards the 1st resistance level of 0.73111 in line with 38.2% fibonacci retracement.
On the H4 timeframe, price is near the key support level, We see the potential of a bullish bounce from 1st support level of 0.70576 in line with 127.2% fibonacci extension towards the 1st resistance level of 0.72476 in line with 50% fibonacci retracement. Otherwise, price might break the key support level to trigger a dip towards the 2nd support of 0.69695 which is in line with 138.2% fibonacci extension.
Areas of consideration
- H4 1st resistance at 0.72476
- H4 1st support at 0.70576
- H4 2nd support at 0.69695
NZD/USD:
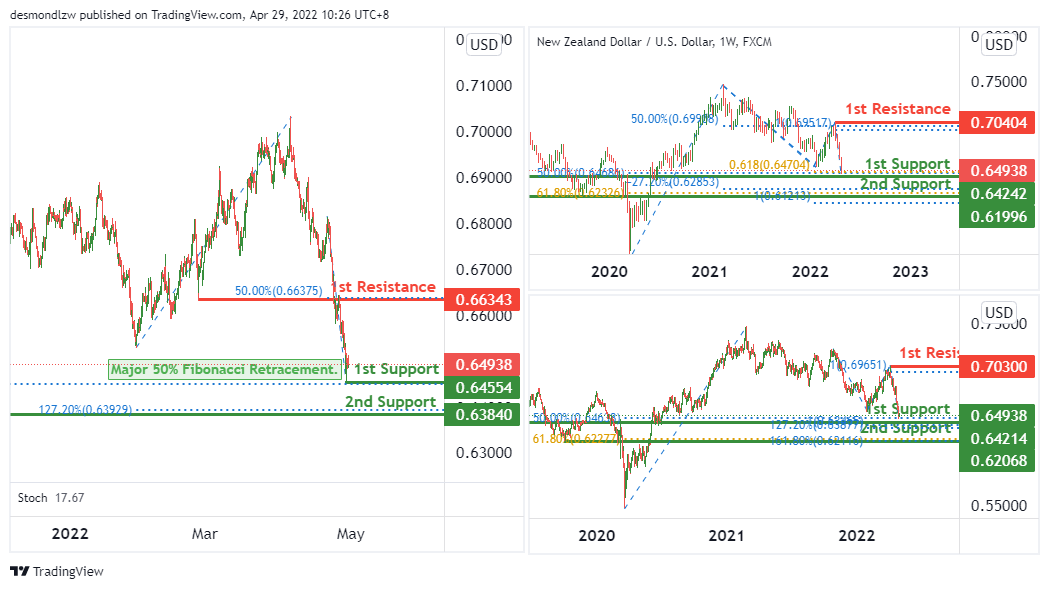
On the weekly, we see the potential for a bullish bounce from 1st support level of 0.64242 in line with 50% fibonacci retracement and 61.8% fibonacci projection towards the 1st resistance level of 0.70404 in line with 50% fibonacci retracement and 100% fibonacci projection.
On the daily, we see the potential for a bullish bounce from 1st support level of 0.64214 in line with 50% fibonacci retracement and 127.2% fibonacci extension towards the 1st resistance level of 0.70300 in line with 100% fibonacci projection.
On the H4, we see the potential of bullish bounce from 1st support level of 0.64554 in line up with a major 50% fibonacci retracement towards the 1st resistance level of 0.66343 in line with 50% fibonacci retracement.
Areas of consideration:
- H4 time frame, 1st support at 0.64554
- H4 time frame, 1st resistance at 0.66343
- H4 time frame, 2nd support at 0.63840
USD/CAD:
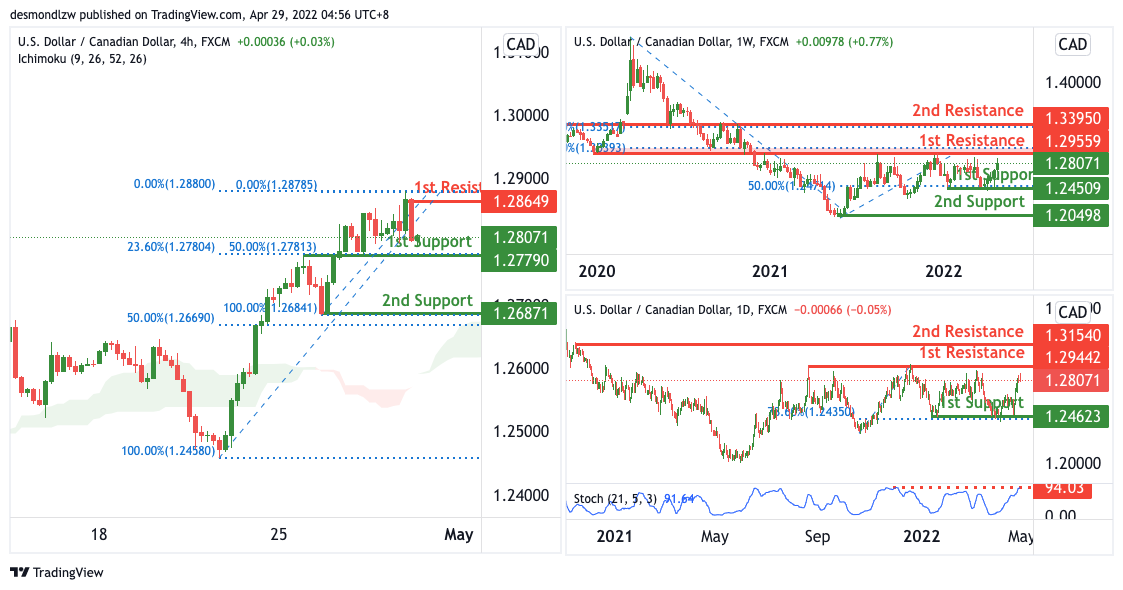
On the Weekly, with no clear indication of where price is going, we have a bias that price will continue to move within our rectangle with support at 1.24623 and resistance at 1.29559.
On the Daily, with price expected to reverse off the stochastics indicator, we have a bearish bias that price will drop from our 1st resistance where the swing high resistance is to our 1st support in line with the 78.6% Fibonacci retracement. Alternatively, price may break 1st resistance structure and head for 2nd resistance where the horizontal swing high resistance is.
On the H4, with price moving above the ichimoku cloud, we have a bullish bias that price will rise to our 1st resistance at 1.28649 where the swing high resistance is from our 1st support at 1.27790 in line with the horizontal pullback support, 23.6% and 50% Fibonacci retracement. Alternatively, price may break 1st support structure and head for 2nd support where the horizontal swing low support and 50% Fibonacci retracement is.
Areas of consideration:
- H4 time frame, 1st resistance at 1.28649
- H4 time frame, 1st support at 1.27790
OIL:
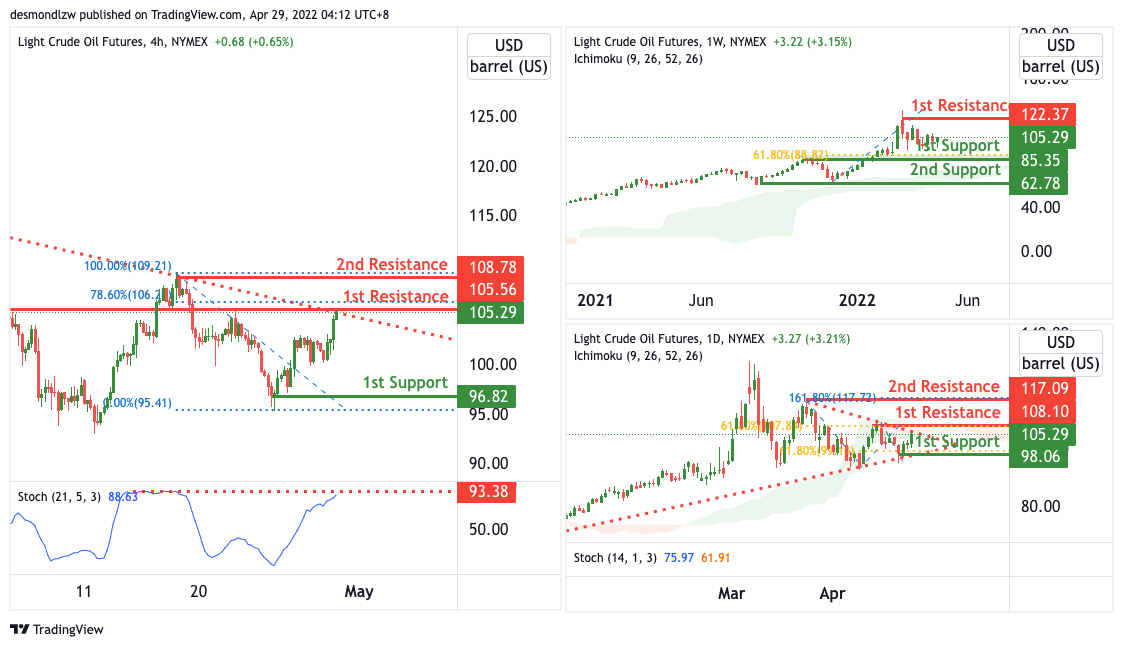
On the Weekly, with price moving above the ichimoku cloud, we have a bullish bias that price will rise to our 1st resistance where the swing high resistance is from our 1st support in line with the horizontal pullback support and 61.8% Fibonacci retracement. Alternatively, price may break 1st support structure and head for 2nd support where the horizontal swing low support is.
On the Daily, with price expected to reverse off the resistance of the ichimoku cloud and the resistance of the triangle, we have a bearish bias that price will drop from our 1st resistance at 108.10 where the swing high resistance and 61.8% Fibonacci retracement is to our 1st support at 98.06 in line with the horizontal swing low support and 61.8% Fibonacci retracement. Alternatively, price may break 1st resistance structure and head for 2nd resistance where the horizontal swing high resistance and 161.8% Fibonacci extension at 117.09.
On the H4, with price expected to reverse off the resistance of the stochastics indicator and the resistance of the descending trendline, we have a bearish bias that price will drop from our 1st resistance at 105.56 where the swing high resistance and 78.6% Fibonacci retracement is to our 1st support at 96.82 in line with the horizontal swing low support. Alternatively, price may break 1st resistance structure and head for 2nd resistance where the horizontal swing high resistance at 108.78.
Areas of consideration:
- H4 time frame, 1st resistance of 105.56
- H4 time frame, 1st support of 96.82
Dow Jones Industrial Average:
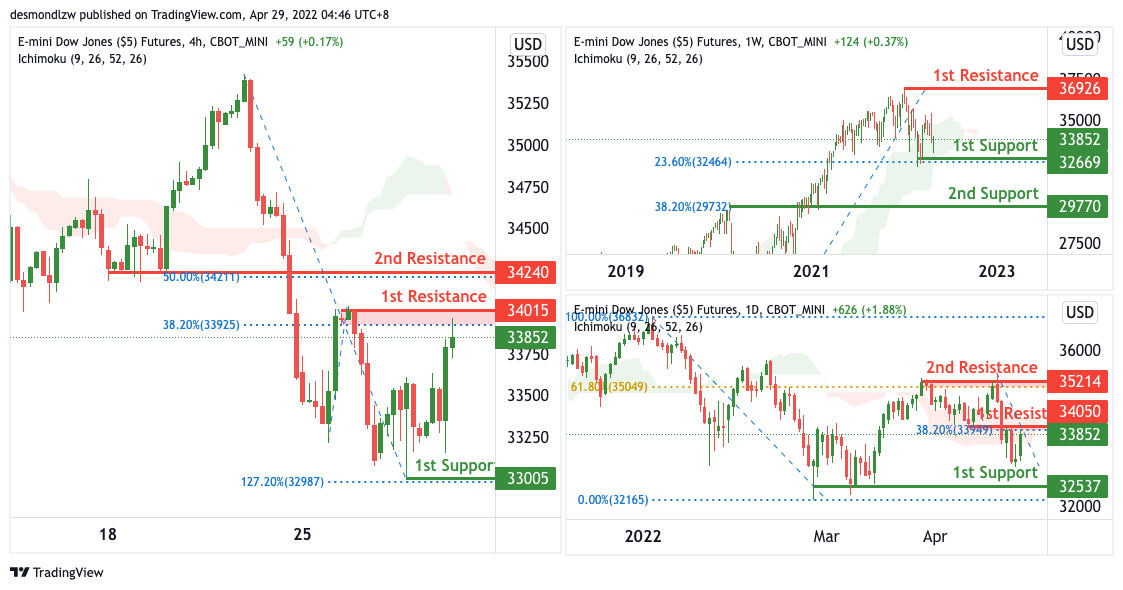
On the Weekly, with price expected to bounce off the support of the ichimoku cloud, we have a bullish bias that price will rise to our 1st resistance where the swing high resistance is from our 1st support in line with the horizontal swing low support and 23.6% Fibonacci retracement. Alternatively, price may break 1st support structure and head for 2nd support where the horizontal pullback support and 38.2% Fibonacci retracement is.
On the Daily, with price expected to reverse off the resistance of the ichimoku cloud, we have a bearish bias that price will drop from our 1st resistance where the pullback resistance and 38.2% Fibonacci retracement is to our 1st support in line with the horizontal swing low support. Alternatively, price may break 1st resistance structure and head for 2nd resistance where the horizontal swing high resistance and 61.8% Fibonacci retracement.
On the H4, with price moving below the ichimoku cloud, we have a bearish bias that price will drop from our 1st resistance at 30415 where the swing high resistance and 38.2% Fibonacci retracement is to our 1st support at 33005 in line with the horizontal swing low support. Alternatively, price may break 1st resistance structure and head for 2nd resistance where the horizontal pullback resistance and 50% Fibonacci retracement.
Areas of consideration :
- H4 time frame, 1st resistance at 30415
- H4 time frame, 1st support at 33005
EUR/USD Daily Outlook
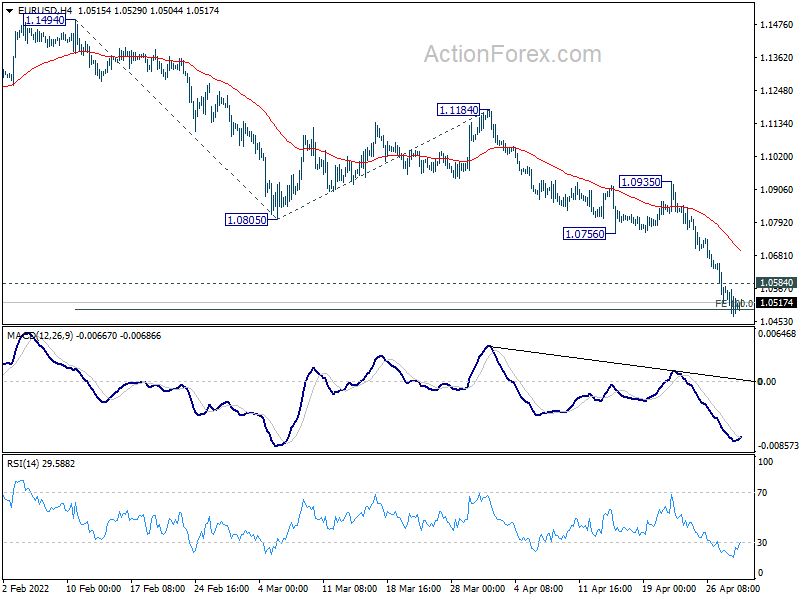
Daily Pivots: (S1) 1.0460; (P) 1.0512 (R1) 1.0553; More...
Intraday bias in EUR/USD remains mildly on the downside for the moment. Sustained break of 100% projection of 1.1494 to 1.0805 from 1.1184 at 1.0495 will pave the way to 161.8% projection at 1.0069. On the upside, above 1.0584 minor resistance will turn bias neutral and bring consolidations. But upside should be limited by 1.0756 support turned resistance to bring fall resumption.
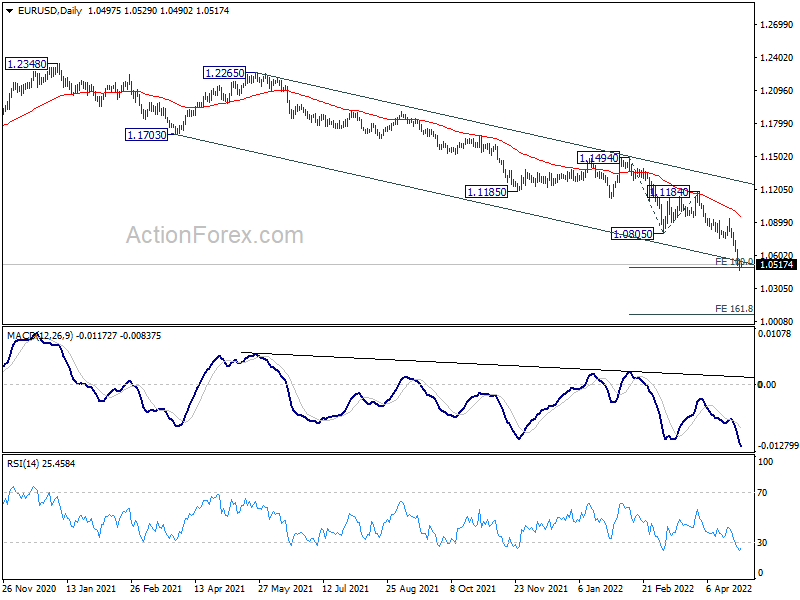
In the bigger picture, the decline from 1.2348 (2021 high) is expected to continue as long as 1.1185 support turned resistance holds. The break of 1.0635 (2020 low) now raises the chance that it's resuming long term down trend from 1.6039 (2008 high). Retest of 1.0339 (2017 low) low should be seen next. Decisive break there will confirm this bearish case.
GBP/USD Daily Outlook
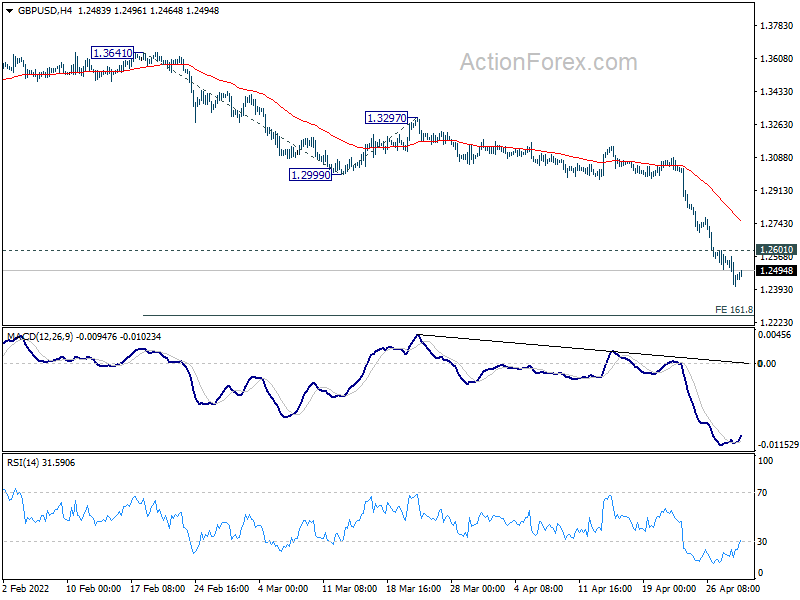
Daily Pivots: (S1) 1.2392; (P) 1.2481; (R1) 1.2549; More...
Intraday bias in GBP/USD remains on the downside with 1.2601 minor resistance intact. Current down trend should target 161.8% projection of 1.3641 to 1.2999 from 1.3297 at 1.2258. On the upside, above 1.2601 minor resistance will turn intraday bias neutral and bring consolidation first. Upside of recovery should be limited below 1.2999 support turned resistance to bring another fall.
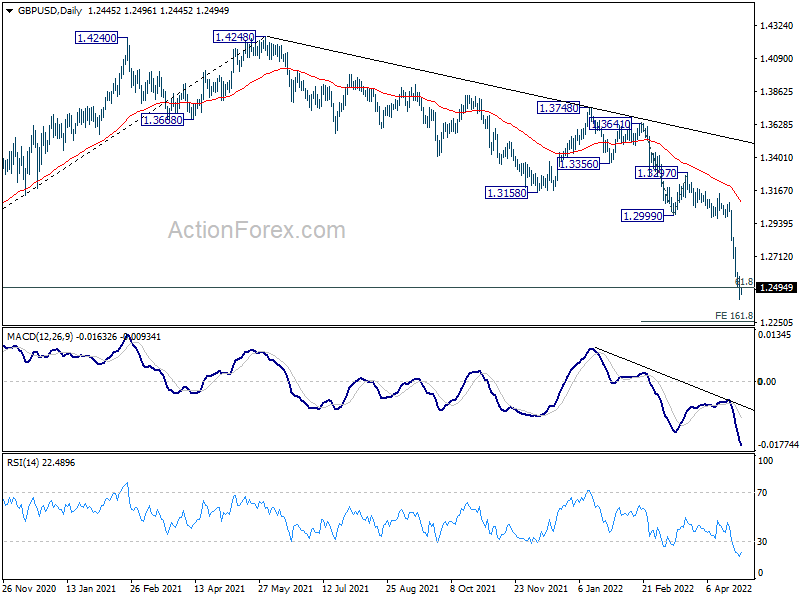
In the bigger picture, rise from 1.1409 (2020 low) has completed at 1.4248, ahead of 1.4376 long term resistance (2018 high). Based on current momentum, fall from 1.4248 is probably the start of a long term down trend. The break of 61.8% retracement of 2.1161 to 1.1409 at 1.2493 is affirming this bearish case too. For now, deeper decline would be seen as long as 1.3158 support turned resistance holds. Next target is 1.1409 low.
USD/CHF Daily Outlook
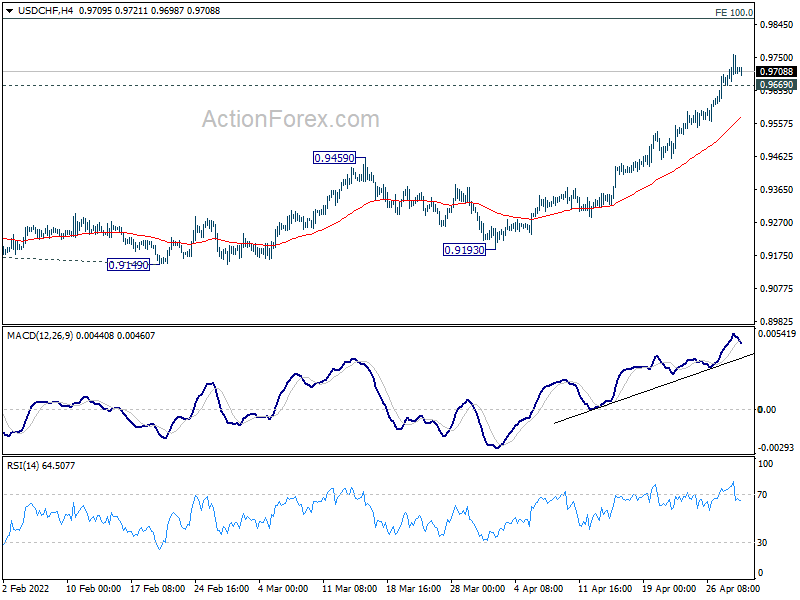
Daily Pivots: (S1) 0.9675; (P) 0.9717; (R1) 0.9761; More....
Intraday bias in USD/CHF remains on the upside for the moment. Current up trend should target next medium term projection level at 0.9864. On the downside, below 0.9669 minor support will turn intraday bias neutral and bring consolidations. But downside of retreat should be contained above 0.9459 resistance turned support to bring another rally.
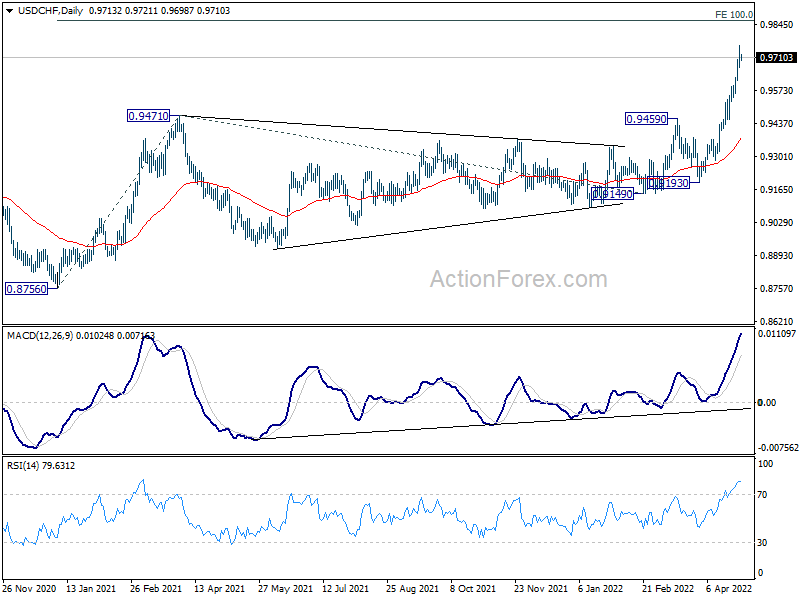
In the bigger picture, down trend from 1.0342 (2016 high) should have completed with three waves down to 0.8756 (2021 low) already. Rise from 0.8756 is likely a medium term up trend of its own. Next target is 100% projection of 0.8756 to 0.9471 from 0.9149 at 0.9864. This will now remain the favored case as long as 0.9459 resistance turned support holds.
USD/JPY Daily Outlook
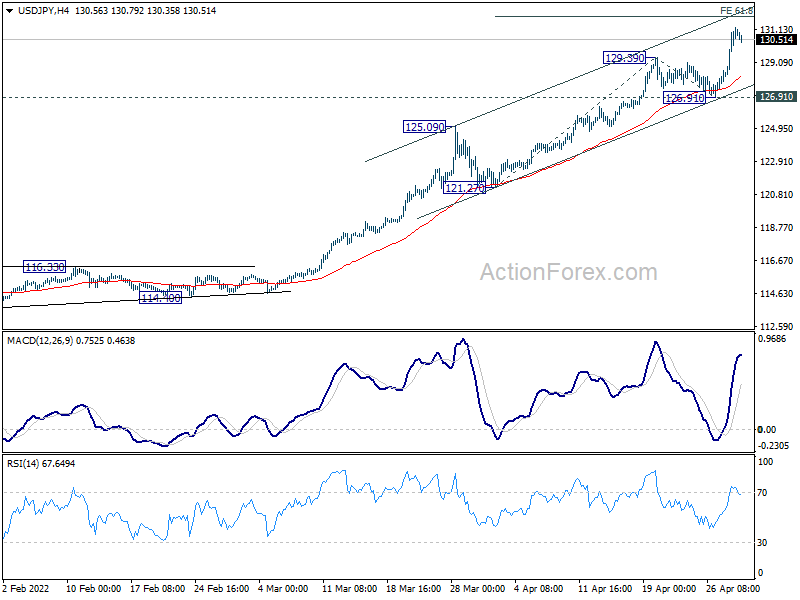
Daily Pivots: (S1) 129.04; (P) 130.14; (R1) 131.95; More...
Intraday bias in USD/JPY remains on the upside for 61.8% projection of 121.27 to 129.39 from 126.91 at 131.92. Firm break there will pave the way to 100% projection at 135.03. On the downside, break of 126.91 support is needed to indicate short term topping. Otherwise, outlook will stay bullish in case of retreat.
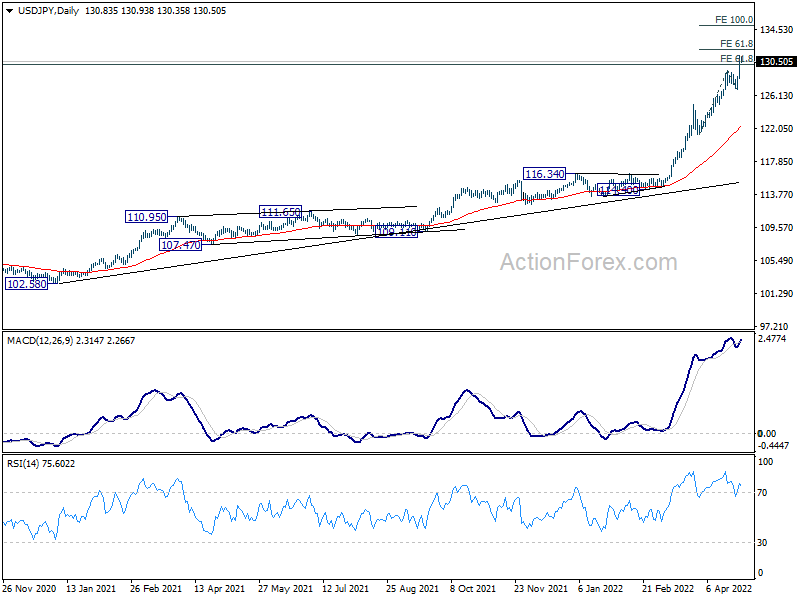
In the bigger picture, current rally is seen as part of the long term up trend form 75.56 (2011 low). Sustained trading above 61.8% projection of 75.56 (2011 low) to 125.85 (2015 high) from 98.97 at 130.04 will pave the way to 100% project at 149.26, which is close to 147.68 (1998 high). For now, this will remain the favored case as long as 121.27 support holds.
AUD/USD Daily Report
Daily Pivots: (S1) 0.7049; (P) 0.7105; (R1) 0.7156; More...
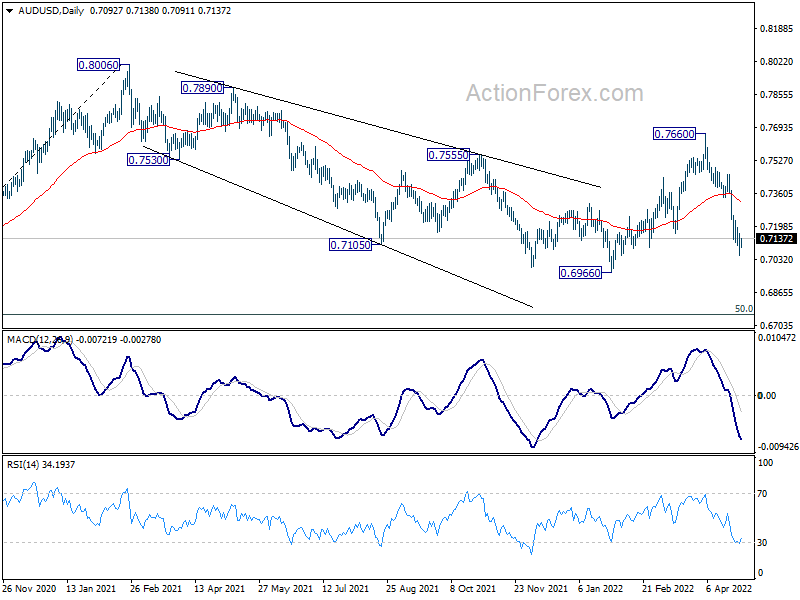
Intraday bias in AUD/USD is turned neutral again with loss of downside momentum. Still, further decline is expected as long as 0.7342 support turned resistance holds. Current development argues that larger correction from 0.8006 is in its third leg. Below 0.7054 will target a retest on 0.6966 low first.
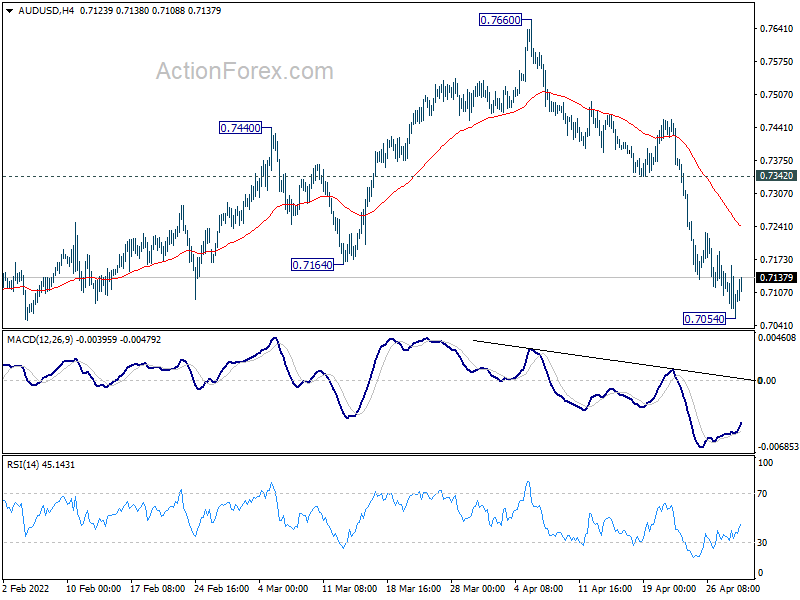
In the bigger picture, price actions from 0.8006 are seen as a corrective pattern to rise from 0.5506 (2020 low). Break of 0.7164 will suggest that such correction is still in progress, with fall from 0.7660 as the third leg. Next target will be 50% retracement of 0.5506 to 0.8006 at 0.6756. On the upside, break of 0.7660 will revive that case that the correction has already completed at 0.6966.
USD/CAD Daily Outlook
Daily Pivots: (S1) 1.2773; (P) 1.2826; (R1) 1.2862; More...
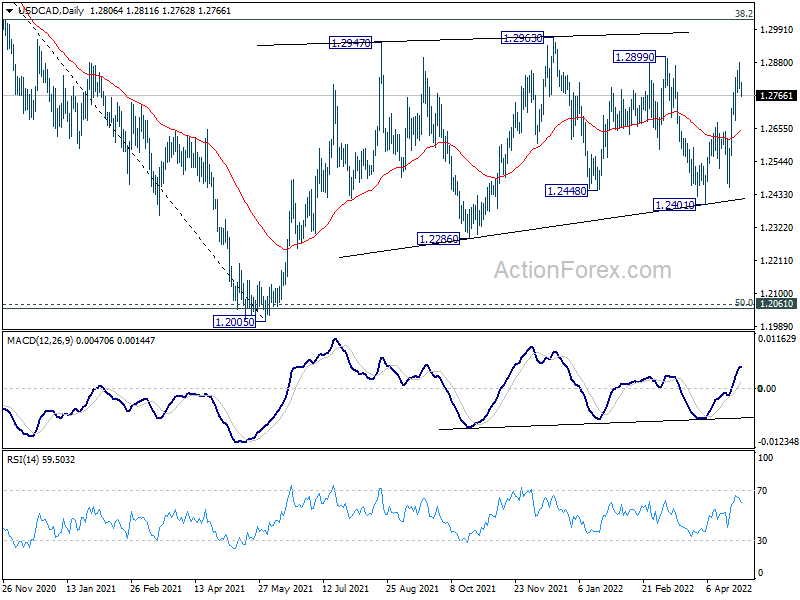
A temporary top is formed at 1.2879, ahead of 1.2899 resistance, with current retreat. Intraday bias in USD/CAD is turned neutral first. Further rise will remain mildly in favor as long as 1.2675 resistance turned support holds. Above 1.2879 should resume rise from 1.2401 towards 1.3022 fibonacci level. Decisive break there will carry larger bullish implications. However, break of 1.2675 will dampen this bullish view and bring deeper fall back to 1.2401 support instead.
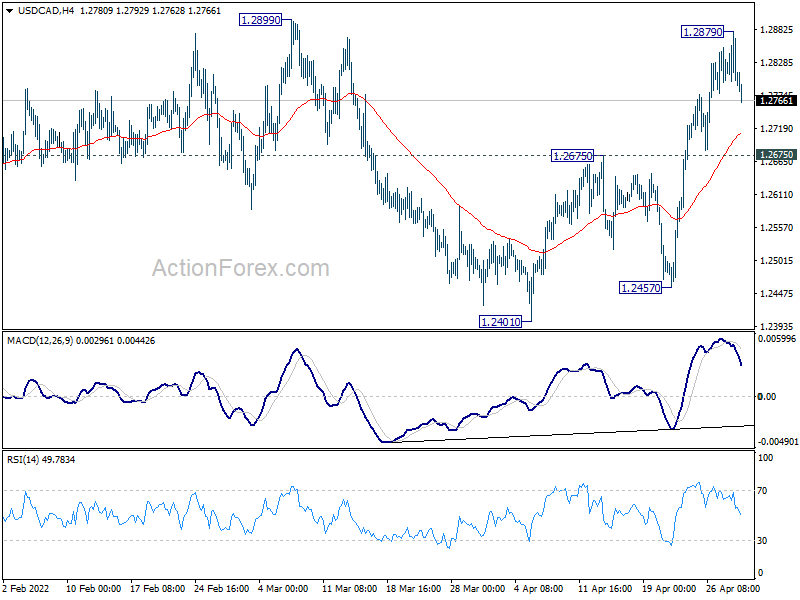
In the bigger picture, focus stays on 38.2% retracement of 1.4667 (2020 high) to 1.2005 (2021 low) at 1.3022. Sustained break there should confirm that the down trend from 1.4667 has completed after defending 1.2061 long term cluster support. Further rise would then be seen towards 61.8% retracement at 1.3650. However, rejection by 1.3022 will maintain medium term bearishness. Break of 1.2005 will resume the down trend from 1.4667 and that carries larger bearish implications too.
GBP/JPY Daily Outlook
Daily Pivots: (S1) 161.23; (P) 162.74; (R1) 164.60; More...
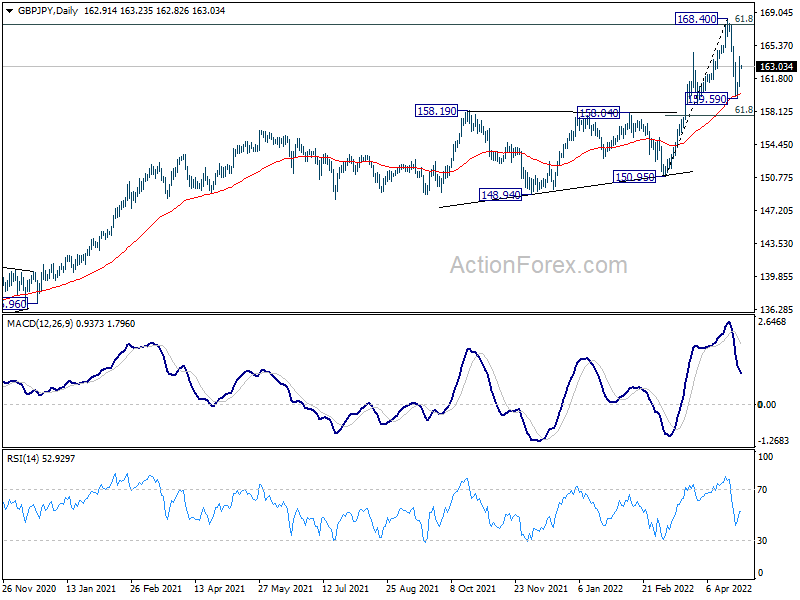
Intraday bias in GBP/JPY remains mildly on the upside for retesting 168.40 high. Firm break there will resume larger up trend. On the downside, in case of another fall, downside should be contained by 61.8% retracement of 150.95 to 168.40 at 157.61 to bring rebound.
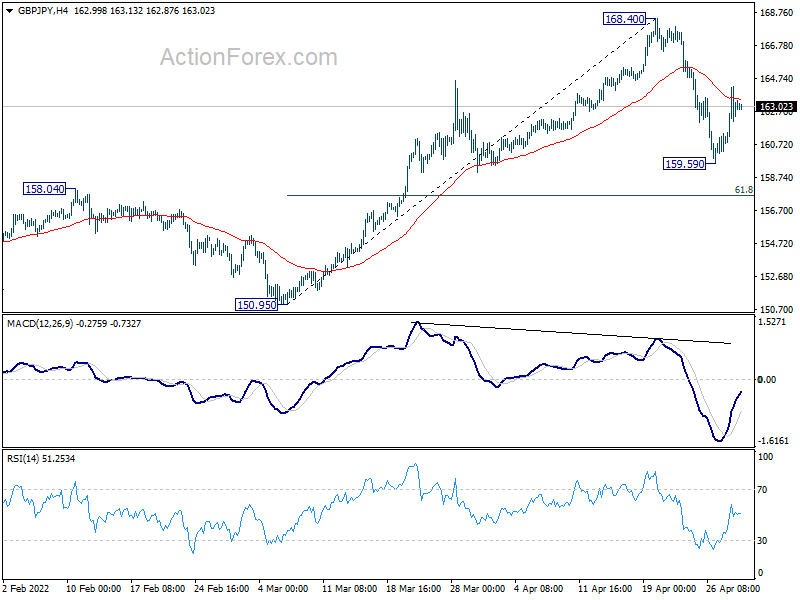
In the bigger picture, up trend from 123.94 (2020 low) is still in progress. Sustained break of 61.8% retracement of 195.86 (2015 high) to 122.75 (2016 low) at 167.93 will be a long term bullish signal, and could pave the way back to 195.86 high. This will now remain the favored case as long as 150.95 support holds, even in case of deep pull back.
EUR/JPY Daily Outlook
Daily Pivots: (S1) 135.91; (P) 136.95; (R1) 138.47; More....
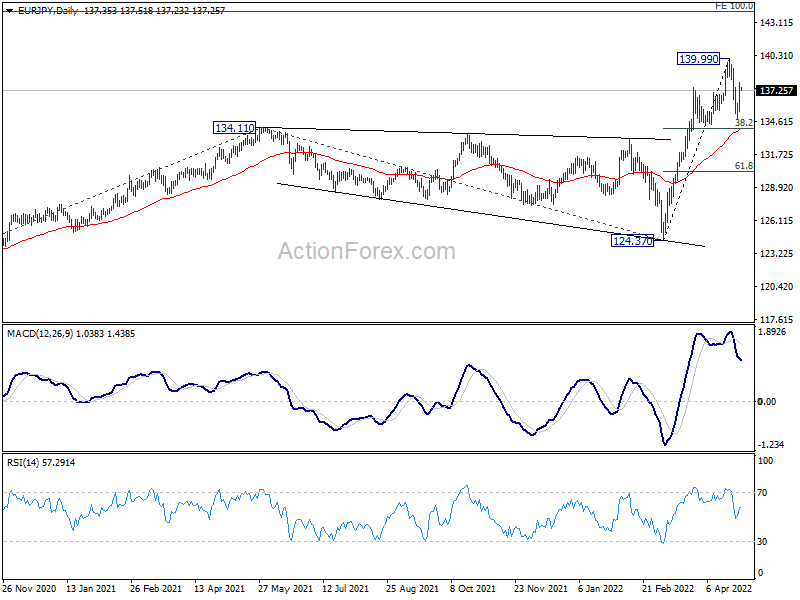
Intraday bias in EUR/JPY remains mildly on the upside for retesting 139.99 high. Firm break there will resume larger up trend for 144.06 medium term projection level. In case consolidation from 139.99 extends with another fall, downside should be contained by 38.2% retracement of 124.37 to 139.99 at 134.02 to bring rebound.
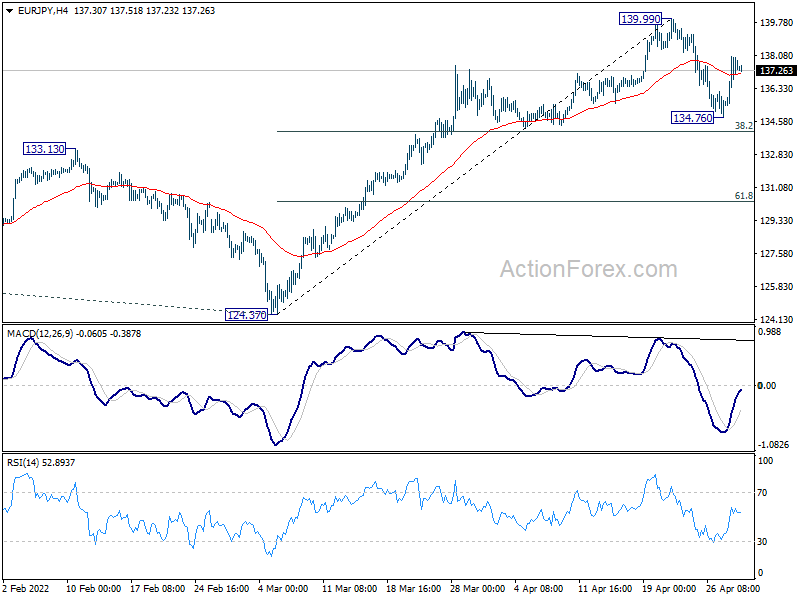
In the bigger picture, up trend from 114.42 (2020 low) is in progress. Such rise is seen as the third leg of the pattern from 109.30 (2016 low). Next target will be 100% projection of 114.42 to 134.11 from 124.37 at 144.06. In any case, outlook will now remain bullish as long as 124.37 support holds, in case of deep pull back.
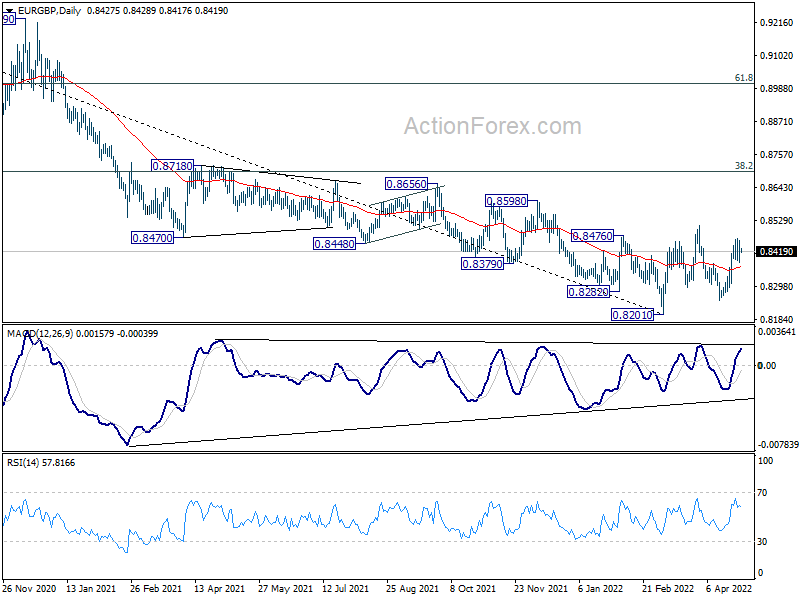
EUR/GBP Daily Outlook
Daily Pivots: (S1) 0.8385; (P) 0.8423; (R1) 0.8462; More...
Intraday bias in EUR/GBP remains neutral at this point. On the upside, above 0.8465 will target 0.8511 resistance first. Further break of 0.8511 will reaffirm that 0.8201 is a medium term bottom, and target 0.8697 medium term fibonacci level next. However, break of 0.8380 minor support will turn bias back to the downside for 0.8248 support instead.
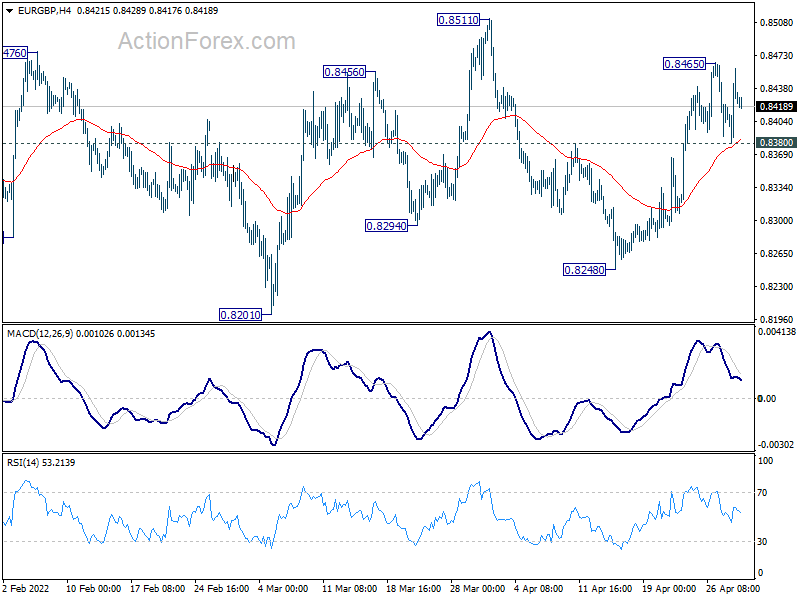
In the bigger picture, a medium term bottom could be in place at 0.8201, on bullish convergence condition in daily and weekly MACD. Rise from there could either be a correction to the down trend from 0.9499 (2020 high), or a medium term up trend itself. In either case, further rise should be seen to 38.2% retracement of 0.9499 to 0.8201 at 0.8697. Sustained break there will target 61.8% retracement at 0.9003.