Sample Category Title
USD/CAD: Ripe for a Squeeze?
USD/CAD, for all intents and purposes, has been stuck in a very big range between 11 May 2015 swing low of 1.19202 and 18 January swing high of 1.46903. Since the summer of 2020, however, price has consolidated into a right-angled ascending triangle pattern. As priced gets squeezed, the pair could be ripe for a breakout. Most recently, its worth pointing out that price on the daily chart has broken above its 21, 50, and 200-day average. Still, given the current underlying certain prevailing in financial markets, traders should be considering a price break above and below the pattern.
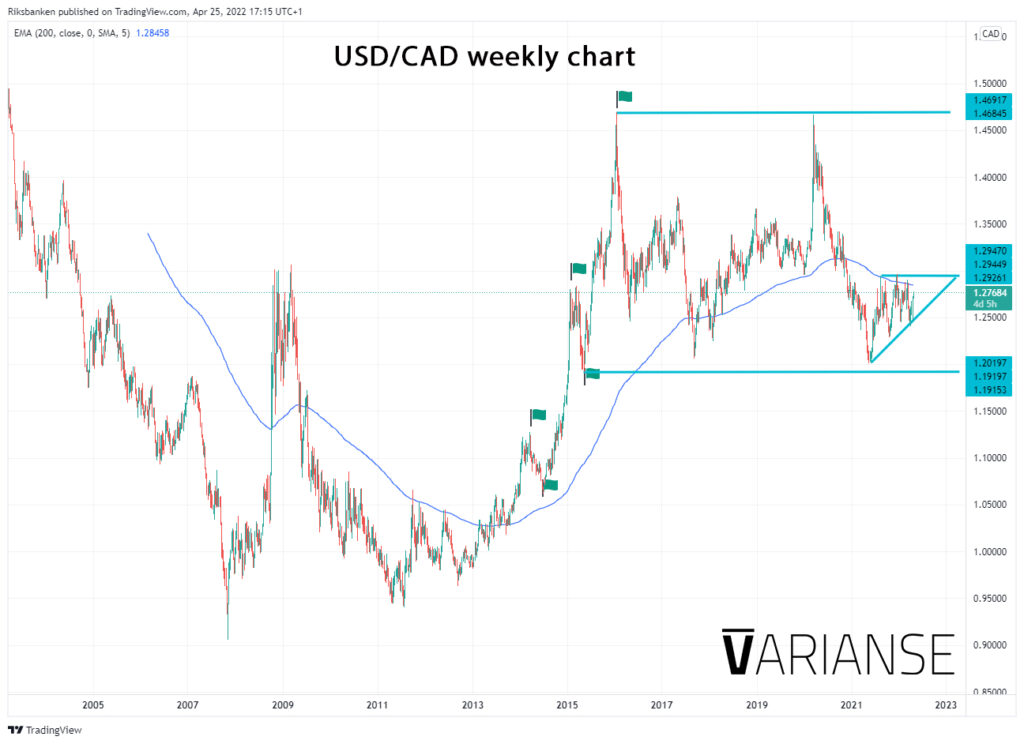
Looking to the topside, a break above the 1.29261 to 1.29470, could open the opportunity for broader gains for the pair. From that level, 1.34 region could represent the next major point of resistance before considering the possibility of a retest of the 18 January swing high of 1.46903, which resides just after a major sells zone starting at the 1.40 mark. In other words, sellers are very likely to try and wrest control of the market between the 1.40 and 1.46903. It’s also worth pointing out that price has not been above those levels since 2003.
For those with a more pessimistic outlook for USD/CAD, the 1.21 to 1.20 region is a major area of support for the currency pair. Where that region to be breached, the 1.19197 would be the next major support level. In addition, a sustained break below the 1.9197 level would mark the start of a long-term downtrend and leave the currency pair exposed to a potentially more precipitous drop to the 1.1283 level, which is the next area of obvious area of resistance turned support. Hence buyers are more likely than not to step in and heavily defend the 1.21 to 1.20 region.
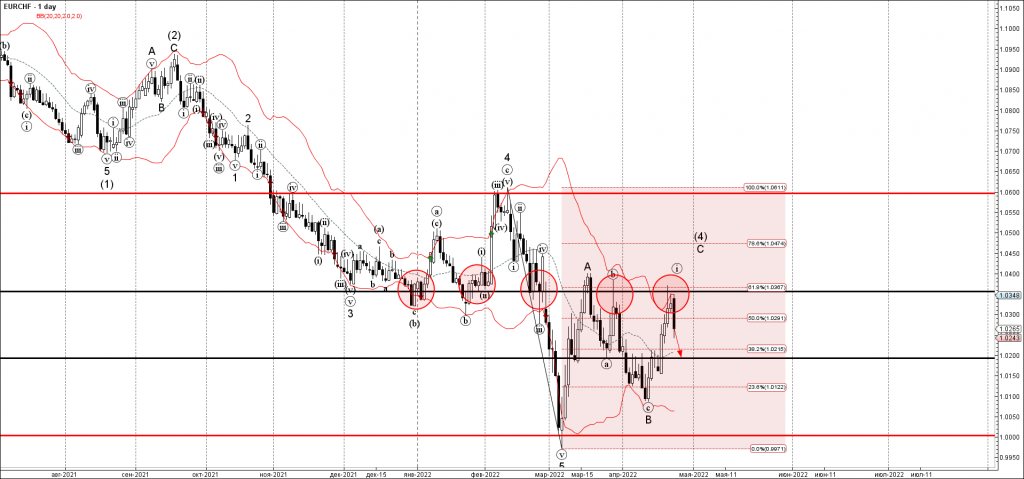
EURCHF Wave Analysis
- EURCHF reversed from resistance level 1.0356
- Likely to fall to support level 1.0200
EURCHF currency pair recently reversed down strongly from the pivotal resistance level 1.0356 (which has been reversing the price from end of December).
The downward reversal from the resistance level 1.0356 stopped the earlier impulse waves (i) and (C).
Given the clear daily downtrend – EURCHF currency pair can be expected to fall further toward the next support level 1.0200.
Dow Jones Wave Analysis
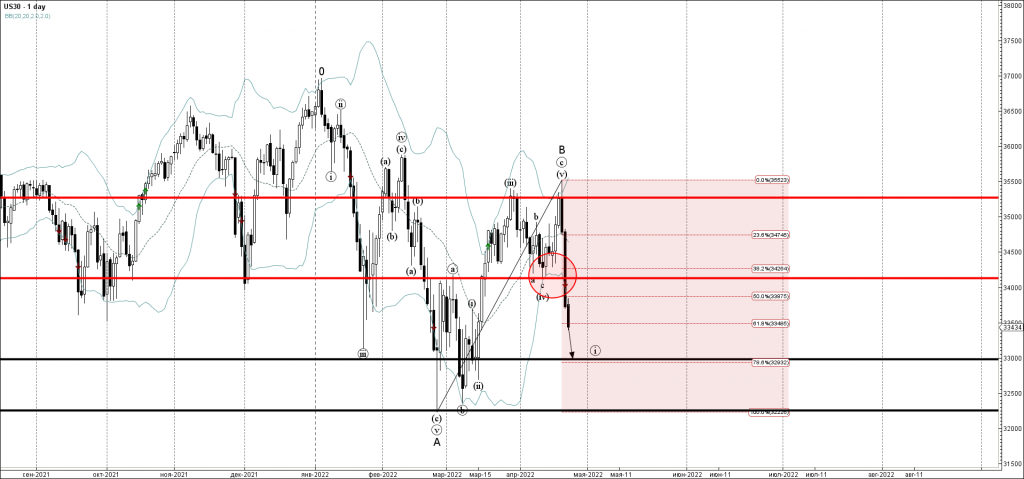
- Dow Jones broke key support level 34130.00
- Likely to fall to support level 33000.00
Dow Jones index recently broke through the key support level 34130.00 (which stopped the previous waves a and c) intersecting with the 38.2% Fibonacci correction of wave B from February.
The breakout of the support level 34130.00 accelerated the active impulse wave C.
Dow Jones index can be expected to fall further toward the next support level 33000.00 (target for the completion of the active wave (i)).
Eco Data 4/26/22
[php_everywhere instance="1"]
BoC Macklem: Strong economy, high inflation, higher interest rates needed
BoC Governor Tiff Macklem delivered three main messages to a House of Commons Committee. First, the Canadian economy is strong... Second, inflation is too high.... Third, we need higher interest rates."
"The economy needs higher rates and can handle them....," he said, "We also need higher interest rates to keep Canadians' expectations of inflation anchored on the target. We can't control or even influence the prices of most internationally traded goods. But if Canadians' expectations of inflation stay anchored on the 2% target, inflation in Canada will come back down when global inflationary pressures from higher oil prices and clogged supply chains abate."
"Canadians should expect interest rates to continue to rise toward more normal settings. By more normal we mean within the range we consider for a neutral rate of interest that neither stimulates nor weighs on the economy. We estimate this rate to be between 2% and 3%," he added.
Macron Wins, But Euro Slides
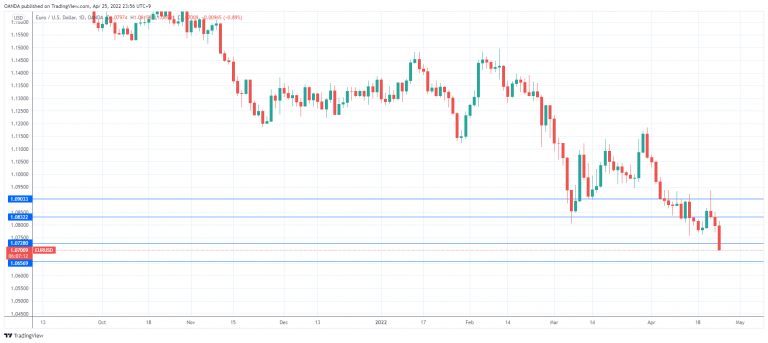
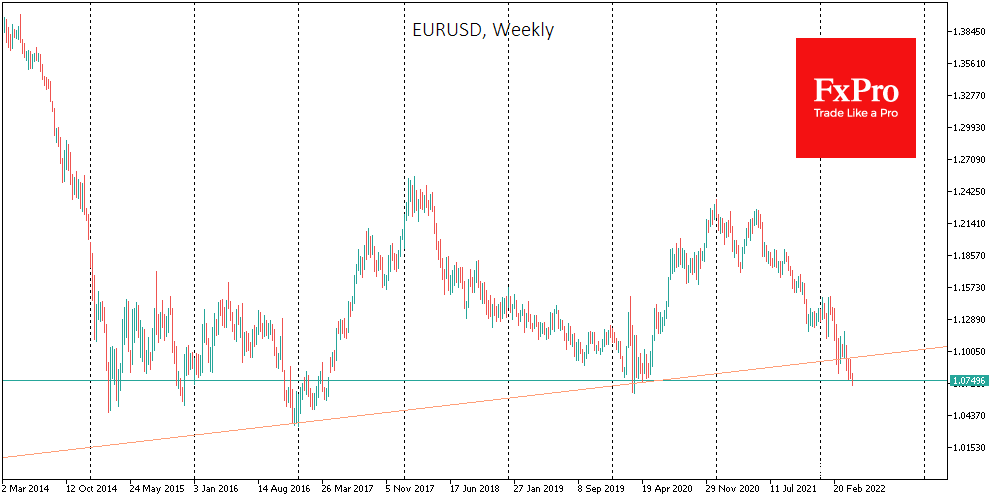
The euro has started the week with sharp losses as it struggles to stay above the 1.07 line. In the North American session, EUR/USD is trading at 1.0717, down 0.73% on the day.
Euro woes continue
On Sunday, President Emmanuel Macron won a decisive victory over Marie Le Pen of the extreme right, by a score of 58% to 42%. The markets reacted with relief rather than elation, given that Le Pen, an avowed euro-sceptic, made a very strong showing. A Macron victory was priced in last week, and the brief euro rally after the election results didn’t last.
It has been a miserable month of April for the euro, which shed over 300 points. The currency has been under pressure from the Ukraine war next door, in particular the sanctions against Russia which are having an effect on growth in Western European countries. There are growing calls in Europe to ban energy imports from Russia, which would have a massive effect on the Russian economy. However, Germany and other countries are unwilling to make such a move because of their dependence on Russian energy. Germany, for example, gets 25% of its oil and 40% of its natural gas from Russia, and abruptly cutting off these supplies would send the country into a recession. With all the uncertainty surrounding the war and sanctions, the euro is having a tough time finding its footing.
German data started the week on a positive note, although it wasn’t enough the help the bleeding euro. German Ifo Business Climate rose to 91.8, up from 90.8 and above the consensus of 88.3 points. German Business Expectations climbed to 91.8 (90.8 prior), above the forecast of 89.1.
Meanwhile, Federal Reserve hawkishness is also weighing on the euro. The Fed is in a hurry to roll out further rate hikes in order to contain inflation, and Fed Chair Powell continues to hint at a 0.50% increase in May, with possibly more such increases in the coming months. This widening of the US/Europe rate differential points to the euro continuing to lose ground.
EUR/USD Technical
- EUR/USD has broken below 1.0810, a multi-decade trendline. Below, there is support at 1.0728 and 1.0657
- There is resistance at 1.0832 and 1.0903
May Flashlight for the FOMC Blackout Period
Summary
- The FOMC raised its target range for the fed funds rate by 25 bps at its March 15-16 meeting. However, the minutes of the meeting revealed that some members would have supported a 50 bps rate hike had the conflict in Ukraine, which began only three weeks earlier, not clouded the outlook.
- We look for the FOMC to announce a 50 bps rate hike at the conclusion of its May 3-4 meeting. A parade of Fed speakers have signaled over the past few weeks that they would be comfortable hiking the funds rate by 50 bps at that meeting.
- In our view, the risk that the Committee surprises the market with a 75 bps rate hike, although not our base case call, is materially greater than a 25 bps surprise increase.
- We expect that the FOMC will hike rates by another 50 bps at its June 14-15 meeting before beginning to raise rates at a more gradual 25 bps-per-meeting pace in July.
- We also look for the FOMC to announce a plan at its May 3-4 meeting to start shrinking its balance sheet by no longer reinvesting the principal payments received from its securities holdings, up to a monthly cap.
- Specifically, we expect the initial monthly caps to be $40 billion for Treasury securities and $25 billion for mortgage-backed securities (MBS), with the caps eventually rising to $60B and $35B per month, respectively. We expect runoff will start in June and the monthly caps to be fully phased in by August.
- In our view, the first 50 bps rate hike in over 20 years and the start of balance sheet runoff shows that the Federal Reserve means business in its fight against inflation.
Tepid Start to Tightening to Shift Into a Higher Gear
Efforts by the Federal Open Market Committee (FOMC) to embark on its most aggressive tightening campaign in decades got off to a slow start at its March 15-16 meeting. Russia's invasion of Ukraine just three weeks before the meeting ushered in an added element of uncertainty to the outlook for inflation and growth. With conditions evolving so quickly, the FOMC opted for the more cautious option of a 25 bps increase in the fed funds rate instead of a 50 bps hike. The minutes of the Committee's meeting in March subsequently revealed that were it not for the near-term uncertainty caused by Russia's invasion of Ukraine, more participants would have been in agreement with St. Louis Fed President James Bullard, who was the lone dissenter at the meeting, to raise the target range for the fed funds rate by 50 bps.
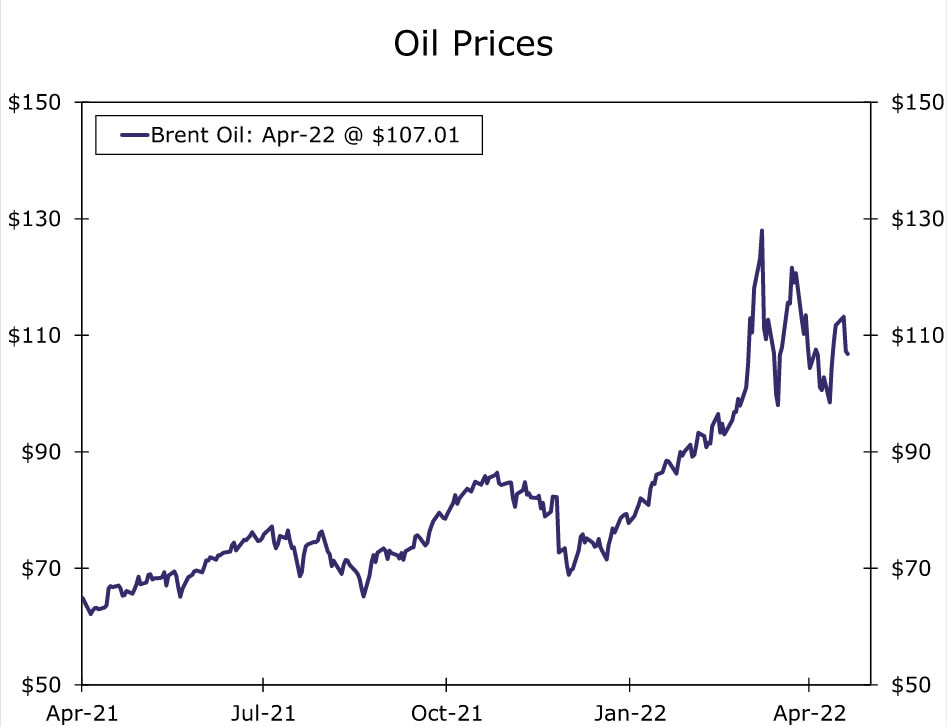
Although a resolution to the conflict in Ukraine is unlikely to come any time soon, initial adjustments from businesses, governments and markets have been made. The worst-case scenarios for energy prices have been avoided thus far. Oil prices have swung widely over the past two months, but have yet to revisit the levels of early March (Figure 1). The limited market reaction, at least thus far, should assuage fears about the severity of the near-term hit to economic growth stemming from sharply higher commodity prices, which supported the case for a more cautious liftoff in March.
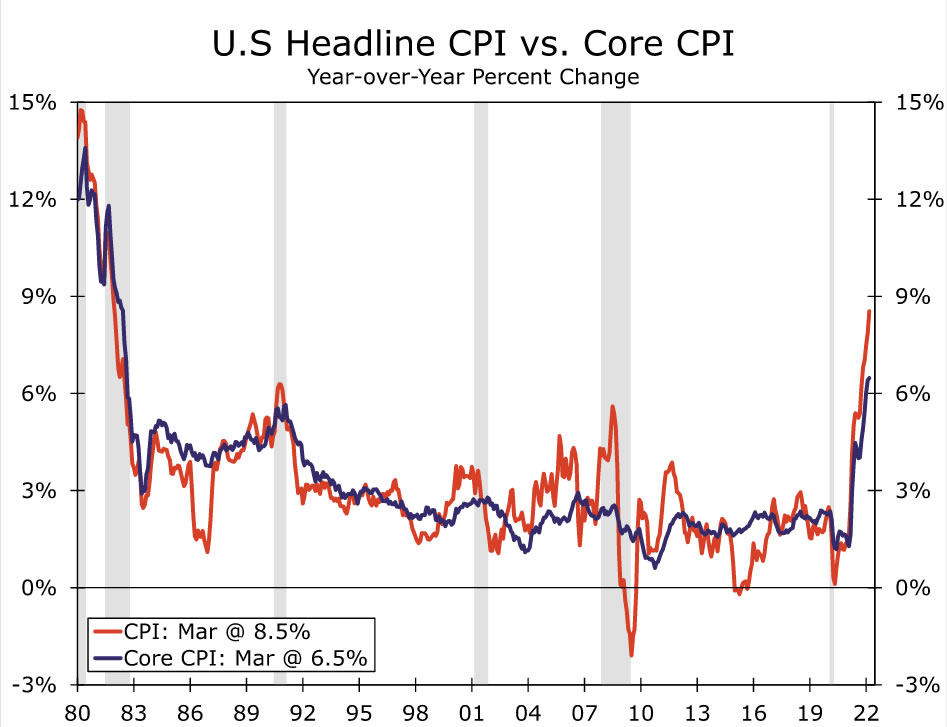
However, the inflation picture still leaves plenty of heartburn for the Committee. The Consumer Price Index in March posted its largest monthly gain since 2005, sending the year-over-year surge to a fresh 40-year high of 8.5% (Figure 2). A modicum of good news came from a softer-than-expected rise in the core index, but even excluding food and energy, prices rose at a 3.9% annualized pace—still well above the Fed's target. March may be the high watermark for this cycle, but inflation's strong momentum suggests it will not be easy to rein in. With the rate of PCE inflation currently about three-fold the central bank's target, the FOMC still has significant work to do to alleviate price pressures.
It is not only inflation data that suggest an already over-heated economy got even hotter since the last FOMC meeting in mid-March. The labor market has continued to tighten rapidly, even with some long-awaited improvement on the supply front. Job growth surpassed expectations in March after factoring in another hefty round of upward revisions. Moreover, the unemployment rate fell to 3.6%, just a tick above its pre-COVID low as well as the median estimate that the FOMC made in March of where the rate will end this year.
Making Up for Lost Time: The 50 Bps Hike Is Back
It is no wonder then that Fed officials are in a greater hurry to remove accommodation. We expect the FOMC will make up for lost time in March and raise the fed funds rate by 50 bps at its May 3-4 meeting. Over the past few weeks, a parade of Fed speakers have signaled that they would be comfortable hiking the funds rate 50 bps at a single meeting, rather than what has become the customary 25 bps. Support for a larger move runs the gamut of key leaders such as Chair Powell, Governor Brainard and FOMC Vice Chair Williams as well as doves such as Charles Evans, president of the Federal Reserve Bank of Chicago, and Mary Daly, president of the San Francisco Fed. With the minutes of the March meeting having reinforced broad willingness to move 50 bps at one or more upcoming meetings, markets are fully priced for a 50 bps hike at the May 3-4 meeting.
Could the FOMC surprise markets with something other than a 50 bps increase? We see the chance of a hawkish, 75 bps hike as low but materially greater than the chance of the Fed underwhelming with a 25 bps increase. A 25 bps rise would come out of left field, in our view, given further strength in inflation and the labor market data and the steady patter of Fed speak in recent weeks hinting at a bigger move. A 75 bps hike seems to be the greater risk to our call given that the Committee is clearly on edge about the current state of inflation and is eager to get policy to a more neutral setting. St. Louis President James Bullard, who has been out front on the increasingly hawkish mindset of the Committee, stated a 75 bps hike should not be ruled out. That said, he also noted that it is not his base case at present.
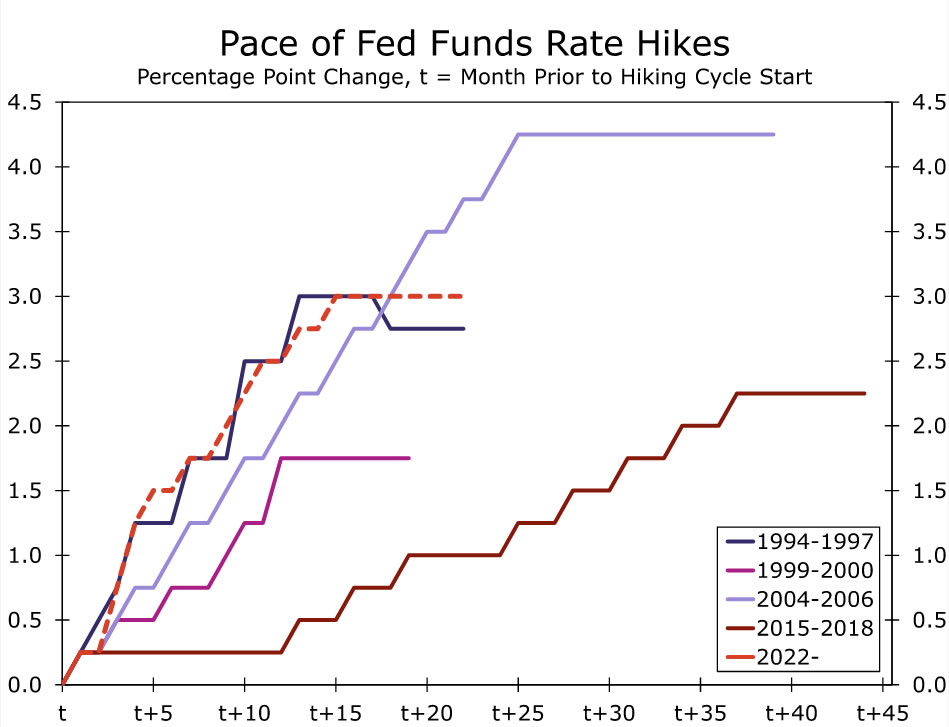
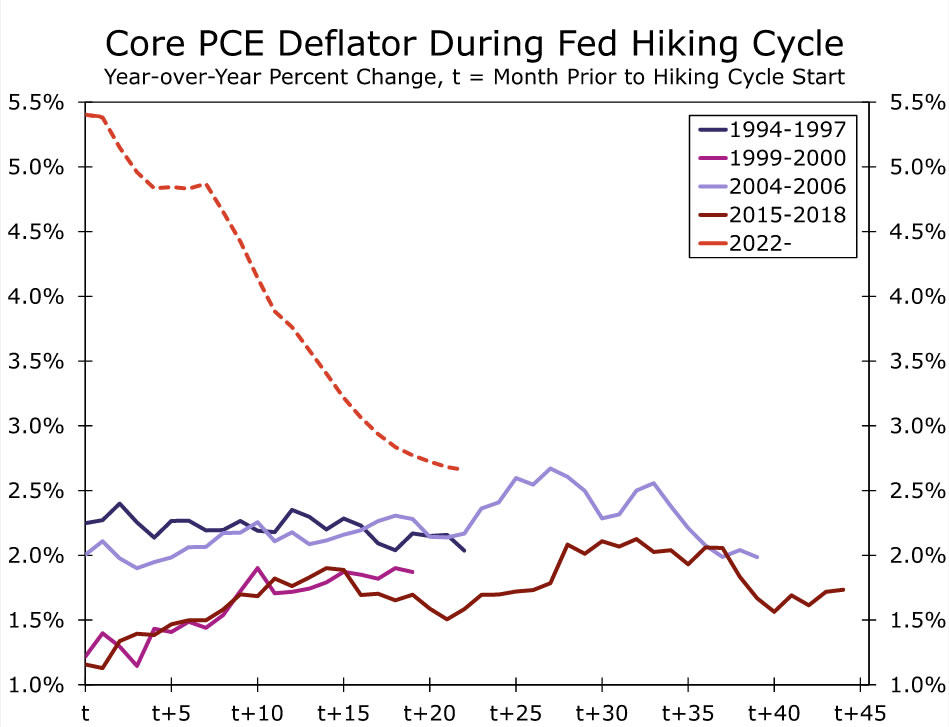
Rather than deliver a 75 bps hike at the May meeting, we expect to see the FOMC expedite tightening by following up May's 50 bps increase with another 50 bps hike at the June 14-15 meeting before beginning to raise rates at a more gradual 25 bps-per-meeting pace in July. This would put the Fed on a similarly steep path as the 1994 tightening cycle (Figure 3), although a lower natural rate of interest today is likely to make the climb ahead more potent. Yet inflation so wide of the Fed's target and the accommodative starting point of policy today leads us to believe the FOMC will opt for such a strong antidote (Figure 4).
The May meeting will not include an updated Summary of Economic Projections, so the statement that will be released at the end of the meeting and Chair Powell's press conference will take on greater importance in signaling how quickly the Committee is preparing to tighten policy, and potentially how far. If the FOMC places greater emphasis on reducing inflation in its statement, perhaps by noting low inflation is imperative to achieving the employment portion of its mandate over the longer term, we would view this as a sign the Committee continues to move in an increasingly hawkish direction.
Not Just 50: Fed Balance Sheet Runoff a Second Form of Tightening
Like the expected path of the fed funds rate, the outlook for the Federal Reserve's balance sheet has shifted significantly in recent months. In early January we laid out the case for the Federal Reserve to start reducing the size of its balance sheet beginning in October. Since then, the FOMC has pivoted even more sharply in a hawkish direction, and as a result we have steadily pulled forward our expected start date for balance sheet reductions. It now appears the time is upon us. In addition to lifting the fed funds rate, we look for the FOMC to announce a plan at its May 3-4 meeting to start shrinking its balance sheet by no longer reinvesting the principal payments received from its securities holdings, up to a monthly cap. We expect the initial monthly caps to be $40 billion for Treasury securities and $25 billion for mortgage-backed securities (MBS), with the caps eventually rising to $60B and $35B per month, respectively. More specifically, we expect runoff to start in June and for the monthly caps to be fully phased in by August.
The actual details that we expect will be announced on May 4 could obviously differ from our expectations. For example, the phase-in of the monthly caps could be a month or two longer than the three month phase-in we currently expect, or the initial caps could be a bit different from $40B/$25B. However, the terminal caps of $60B and $35B come directly from the March 15-16 FOMC minutes in which it was revealed that "participants generally agreed" that caps of this amount would likely be appropriate. Thus, deviations from the terminal caps of $60 billion and $35 billion would be a surprise.
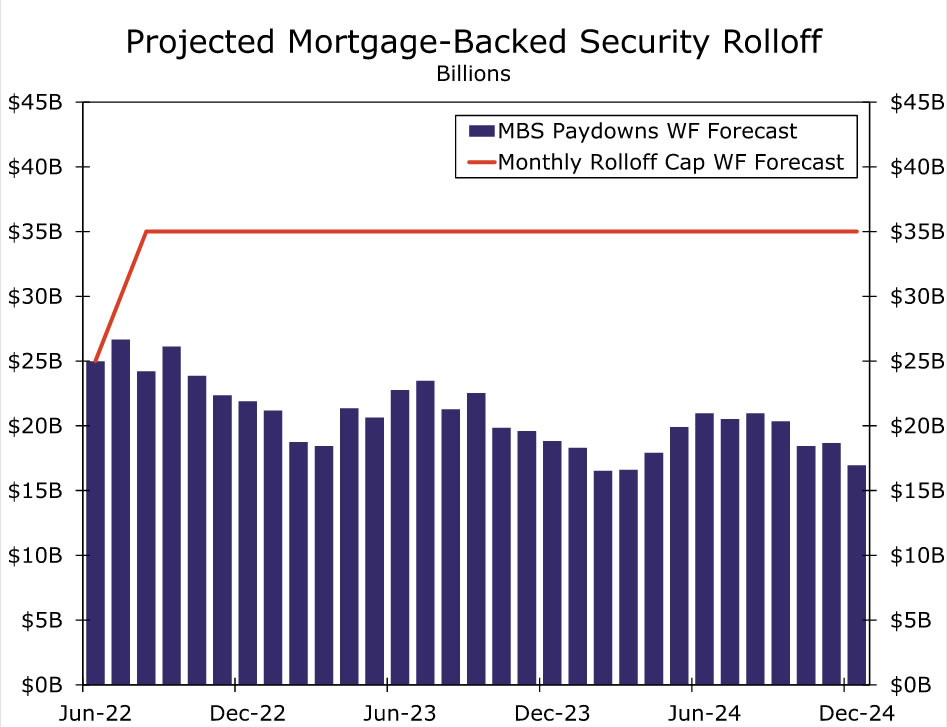
It is important to remember that these monthly caps operate as a ceiling on monthly asset redemptions and not a floor. For MBS, it does not appear the caps will be binding anytime soon. Projected MBS paydowns over the next couple of years are roughly $15B-$25B per month, well below the anticipated $35B billion cap (Figure 5). Outright MBS sales to make up the difference are possible, but the March FOMC minutes signaled that MBS sales would not be considered until balance sheet runoff was "well under way."
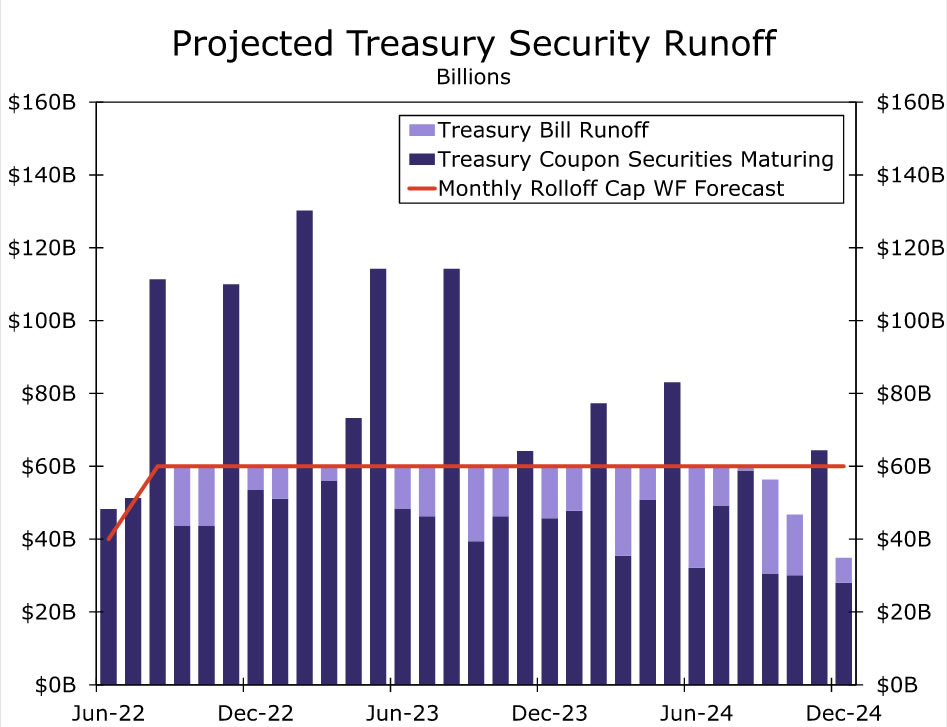
The monthly cap plays a bigger role in Treasury security redemptions. In some months, the amount of maturing Treasury notes and bonds (i.e. coupon-bearing securities) that the Federal Reserve owns exceed the cap. For example, in August about $111 billion coupon-bearing Treasury securities will mature on the Fed's balance sheet, but only $60 billion would be redeemed because of the monthly cap (Figure 6). However, in September the Federal Reserve will have only $43 billion worth of maturing coupon-bearing Treasury securities. The March FOMC minutes signaled that the Federal Reserve would redeem Treasury bills in months when Treasury coupon principal payments are below the cap. Under this approach, the redemption of Treasury bills would typically bring the total amount of Treasury redemptions up to the monthly cap. Projected T-bill redemptions are represented by the lavender bars in Figure 6. The Fed owns $326 billion of T-bills, which account for a small share of the central bank's $5.8 trillion Treasury security holdings. These T-bill holdings are unrelated to monetary policy accommodation and were accumulated between September 2019 and February 2020 to calm Treasury repo markets.
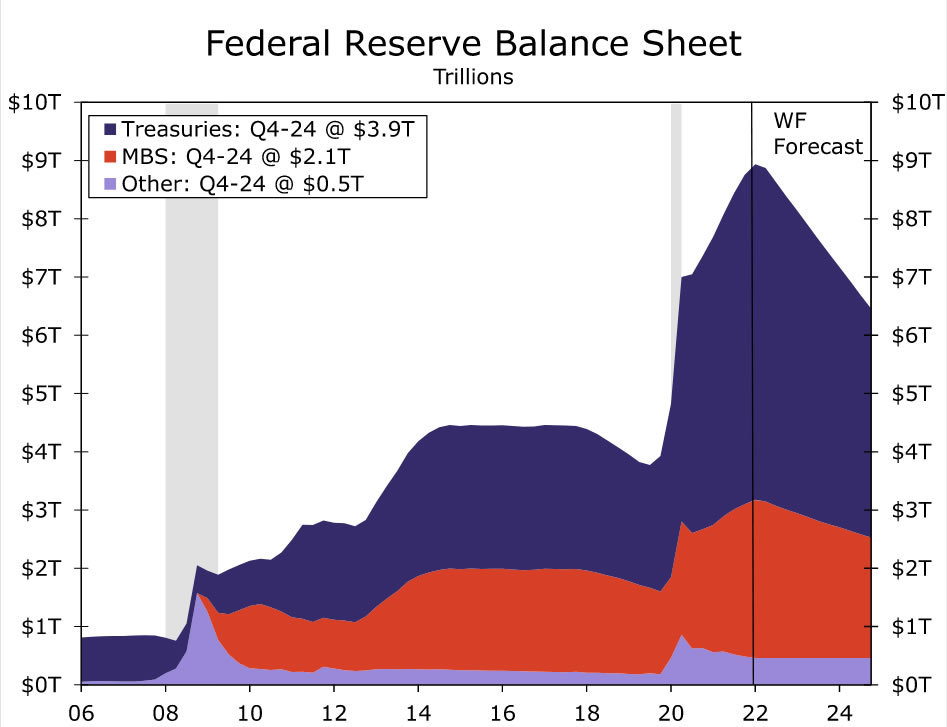
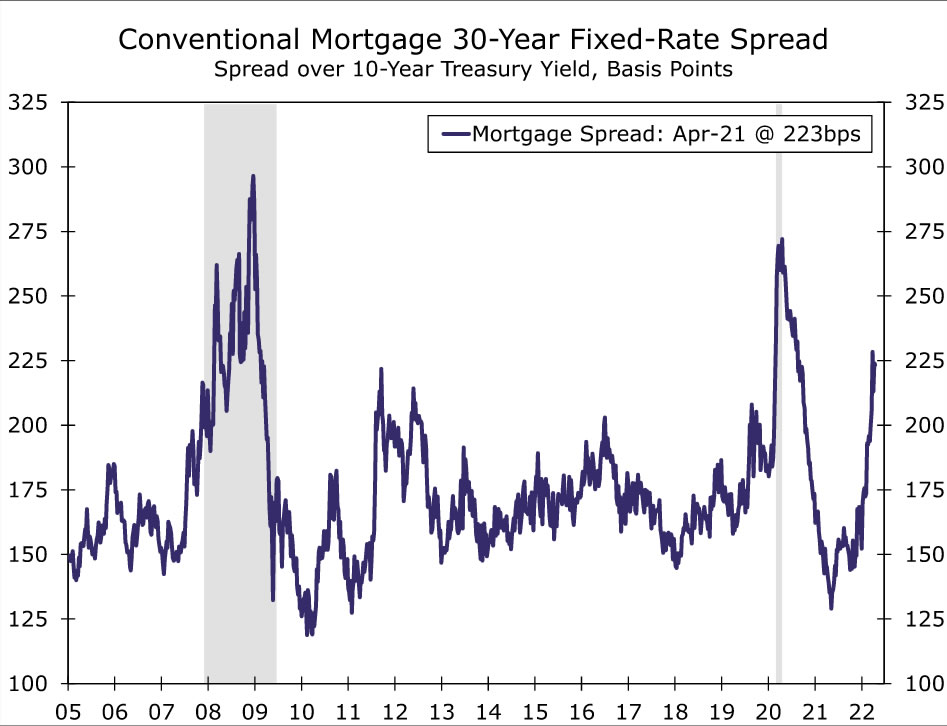
If our assumptions for the Federal Reserve's balance sheet plan are correct, and if no outright asset sales are executed over the next few years, then the central bank's balance sheet would shrink from about $9 trillion today to roughly $6.5 trillion at the end of 2024 (Figure 7). Balance sheet runoff will serve as a secondary, passive form of monetary policy tightening in addition to the primary tightening tool: increases in the target range for the federal funds rate. Financial markets have responded to this anticipated change in policy. Intermediate- and longer-term yields on Treasury securities are higher and mortgage spreads are wider in recent months (Figure 8). We suspect most of the impact on yields from balance sheet runoff already has been priced in by financial markets, as we discussed in a recent special report. That said, we doubt the impact has been fully priced, and the overall effect from balance sheet runoff is highly uncertain, a fact Chair Powell acknowledged in his most recent press conference.
Regardless of the exact magnitude, the May 3-4 FOMC meeting likely will send a clear signal from monetary policymakers. The first 50 bps rate hike in over 20 years and the start of balance sheet runoff shows that the Federal Reserve means business in its fight against inflation.
Dollar Changes Pressure Angle
The dollar continues to push back against competitors in global markets, going on the offensive against a broader front of currencies and stock indices. Geopolitics is ceding to monetary policy its role as the primary driver. And that could be bad news for risk-sensitive assets, as there is still no light at the end of this tunnel.
The dollar’s main competitors, the euro and the yen, seem to have exhausted their downside potential, and now the volatility threatens the next, broader range of currencies.
The yen has stabilised at 20-year lows at 128 after a 12% slump since the start of March and a 25% drawdown since the 2021 start.
EURUSD was one step away from 1.0700 at the start of the European session, having lost 4.4% since March and 13% from its peak in January 2021. The movement is not too sweeping but steadily lowers the euro traded back in 2003.
However, we are now seeing a marked reduction in the yen and the euro amplitude, while in contrast, it is rising in other market sectors.
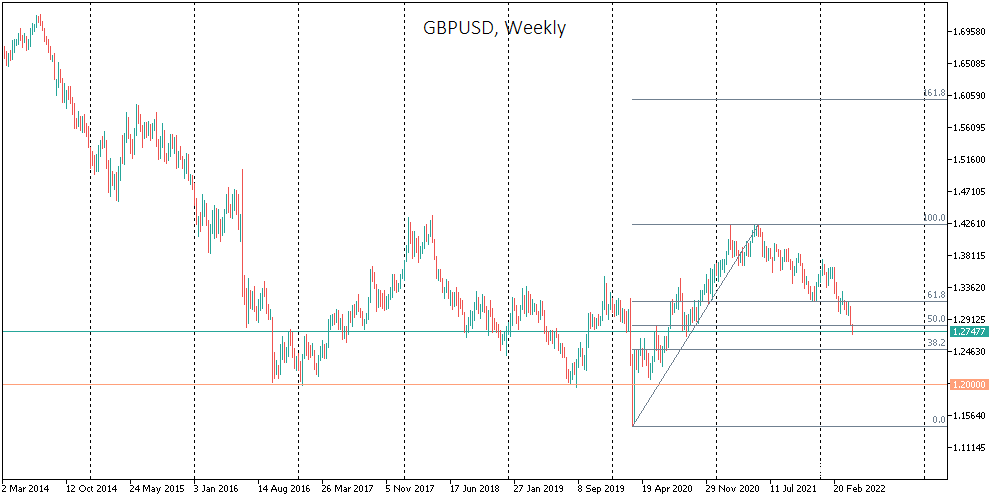
The British pound is flying into the abyss for a second day, losing 0.77% on Monday after falling 1.6% on Friday. GBPUSD has capitulated, pulling back to 1.2740, where it last was in September 2020. GBPUSD has moved into the lower half of the trading range this week from after the pandemic hit. The tactical target for the bears, in this case, could be the 1.2600 area, with the final point being 1.2000, where the GBPUSD has repeatedly found support over the past six years.
The Australian dollar has lost about 4% since Thursday. The decline for the fourth consecutive week took about 6% off its peak at the start of April, maybe just half of the potential decline towards 0.6700, a critical turning point in the last 24 years.
Gold: From Haven to Anti-Dollar
Gold lost 1.6% since the beginning of the day on Monday, testing $1900 precisely one week after an unsuccessful attempt to get above $2000.
The essential factor that puts pressure on gold is the Fed’s toughening rhetoric that triggers a broad sell-off of risky assets. Gold speculatively played its role as a haven for the war in Ukraine as it strengthened along with the US currency. Now gold is working as a commodity asset, turning into an anti-dollar with an inverse correlation to the US currency.
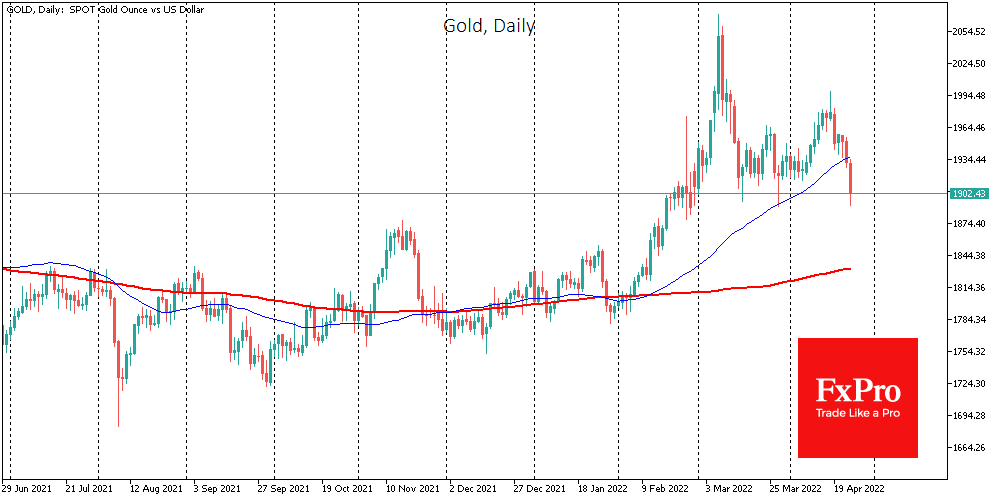
The sharp declines on Friday and Monday seem to have broken the bullish momentum that was formed at the beginning of February. Last week’s closing under the 50 SMA and the support areas of March and the first half of April did not attract new buyers. On the contrary, it looks like the bulls capitulated locally.
In just a matter of ten days before the Fed meeting, the gold might zero out the rally since the beginning of the year and go back to $1830 or get lower to $1780-1800 before we might see a new buying impulse.
Elliott Wave Analysis: USD/JPY Has Five Waves Up, Keep an Eye On Corrections
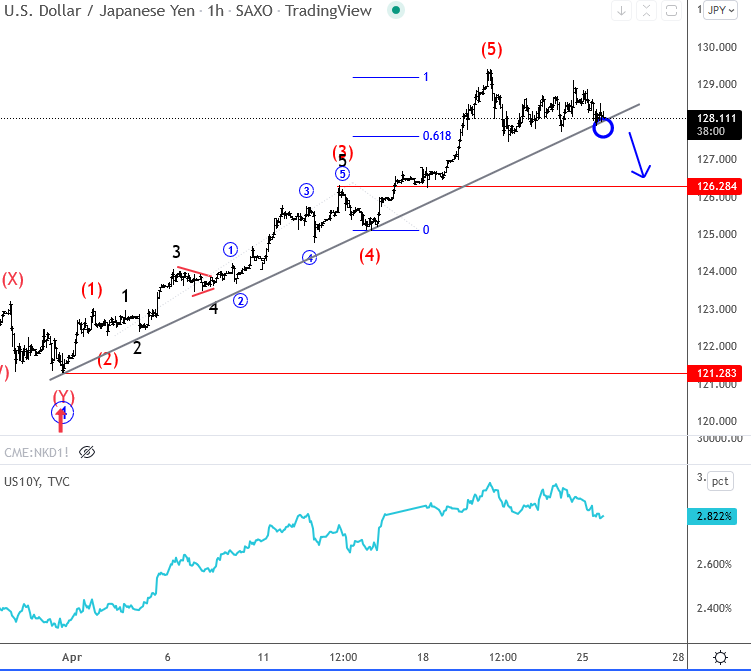
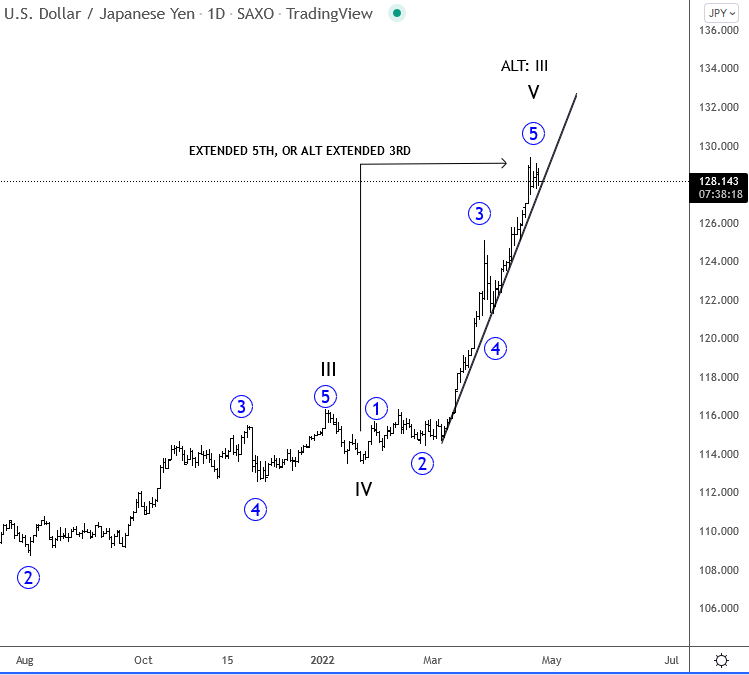
USDJPY is in uptrend, but extreme overbought condition, slow down on US yields and also some speculation regarding BoJ JPY intervention puts a strong resistance in play on USDJPY. In fact, the pair has five waves up from start of April, so there can be time for a pullback; its totally normal. Five waves up from the start of April (1h chart) may suggest that there can be some retracement coming. We should keep an eye on trendline support connected from 121.17, where a decisive breakdown will signal that bulls are done, at least temporarily. The daily count also suggests some correction in the weeks ahead as the pair can be in the late stages of an extended wave V or even wave III.