Sample Category Title
EURJPY Retreats from 140 Hurdle to Weigh on 23.6% Fibonacci
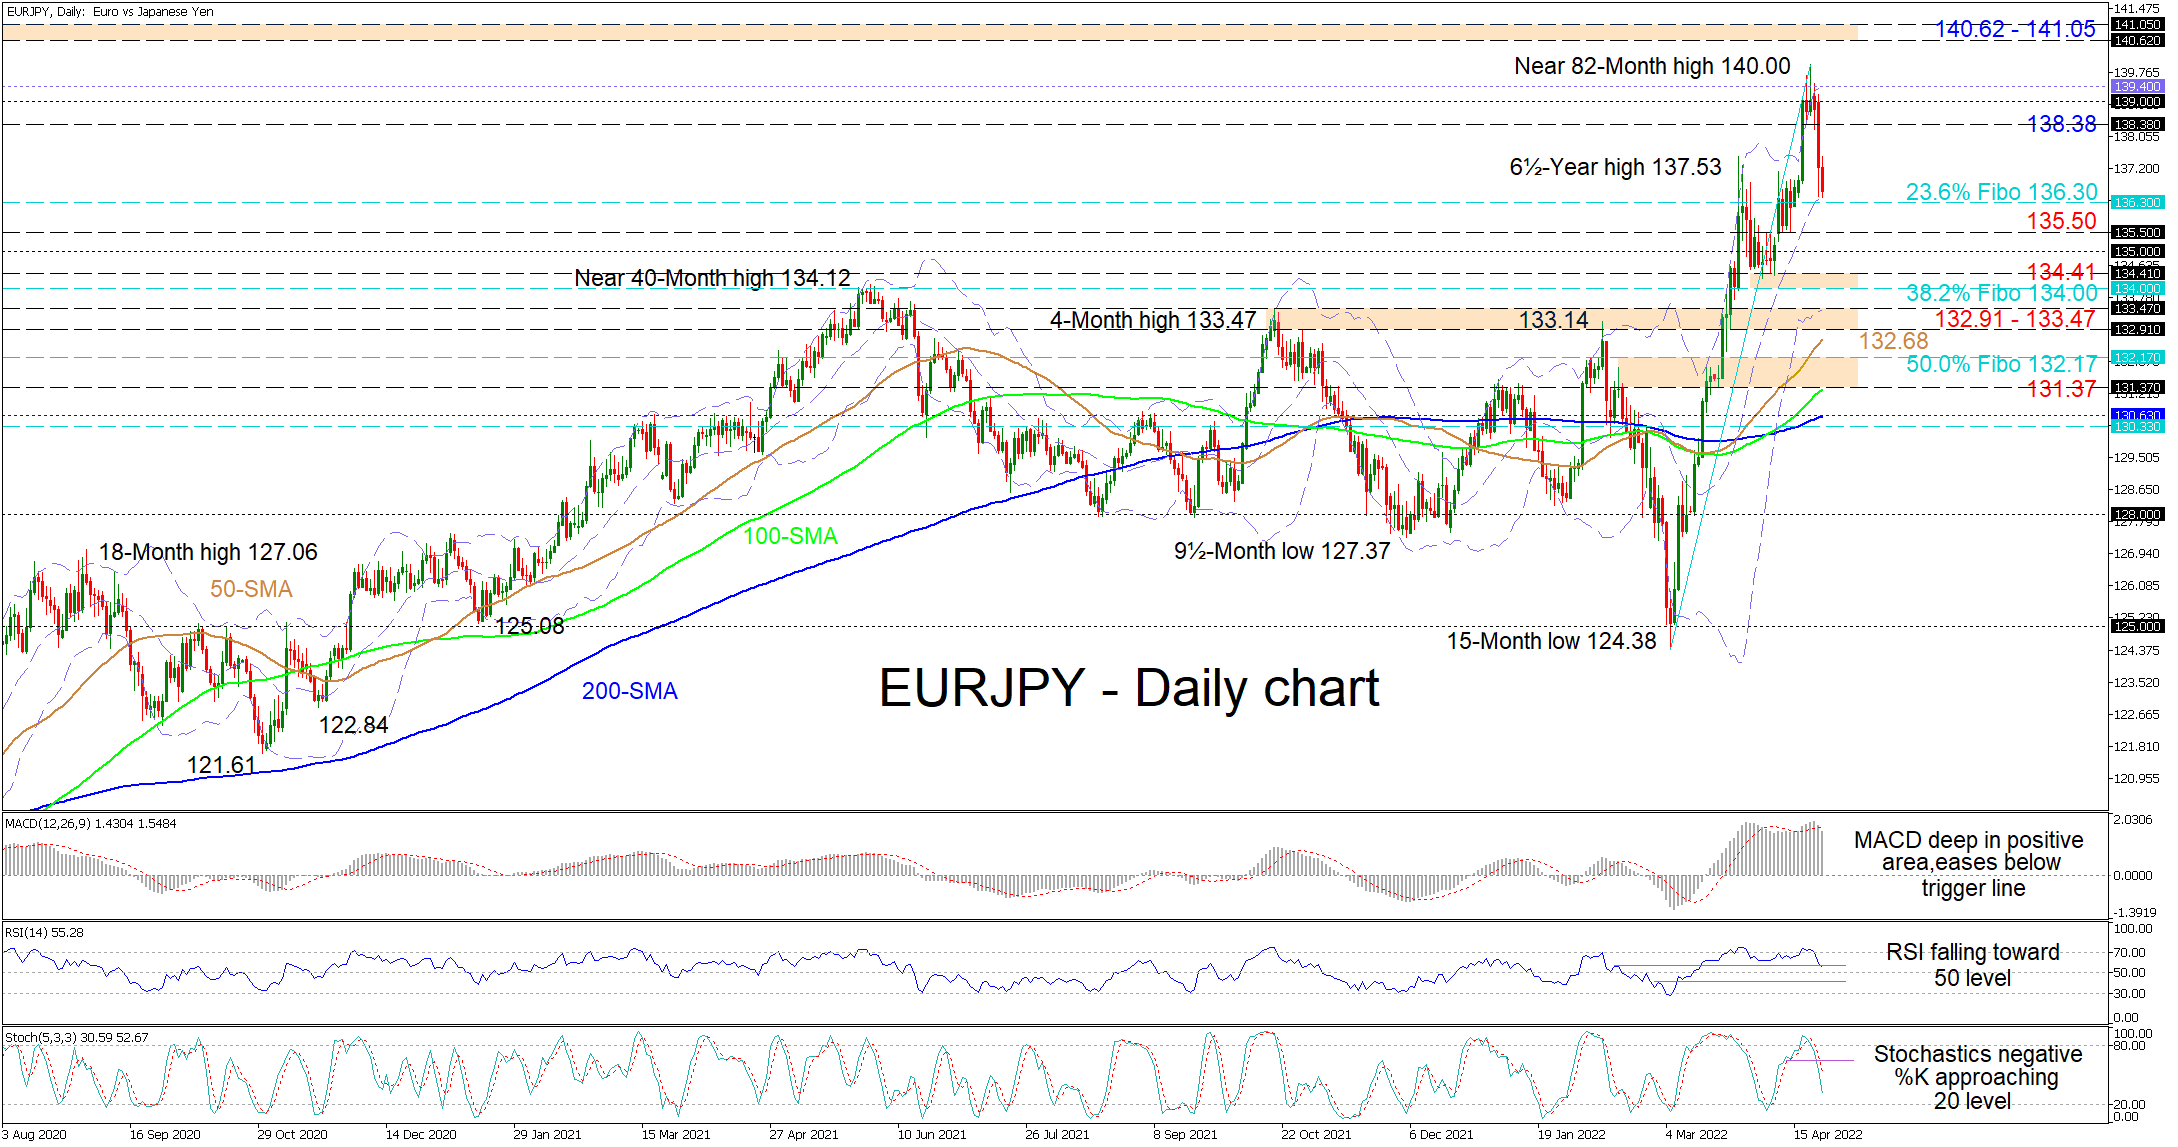
EURJPY’s fresh pullback from a multi-year high has yet to eliminate all bets that the one-and-a-half-month ascent could rejuvenate from the 136.30 barrier, which is the 23.6% Fibonacci retracement level of the rally from the 15-month low of 124.38. Further sponsorship of this bullish premise is being reflected in the climbing simple moving averages (SMAs).
Meanwhile, the short-term-oscillators are painting a picture where sellers are in the driver’s seat, mirrored by the excess in negative momentum. The MACD, far above the zero mark, has faded beneath its red trigger line, while the dipping RSI is nearing the 50 level. Moreover, the negatively charged stochastic oscillator is promoting extra bearish moves in the pair.
Currently, if sellers retain control, they will need to overwhelm the immediate downside deterrent being the mid-Bollinger band, which is in the vicinity of the 23.6% Fibo at 136.30. Should these combined supports fail to limit the depth of the pullback in the pair, the 135.50 low and the 135.00 handle could then attempt to impede the pair from weighing on the key 134.00-134.41 base, formed by the early April trough and the 38.2% Fibo. In the event the pair sustains the downward trajectory, the 132.91-133.47 support border may then draw traders’ focus.
Otherwise, if the 23.6% Fibo and the mid-Bollinger band manage to rekindle strong upward drive, the bulls could then perhaps encounter initial resistance around the 138.38 level, ahead of the 139.00 mark and the upper Bollinger band at 139.40. Should bullish impetus prevail and overrun the near 82-month peak of 140.00, the bulls may then aim for the 140.62-141.05 resistance region, linked to the June 2015 highs.
Summarizing, EURJPY is sustaining a bullish bias north of the 23.6% Fibo of 136.30 and the 135.50 low. That said, a price drop beyond the 131.37-132.17 zone could spark worries about the positive structure.
Oil’s New Attempt to Break the Uptrend
Following Gold, the uptrend formed in early December is also breaking in oil. Intraday on Monday, the WTI price lost more than 6%, recovering about half of the decline on some return of risk appetite in the last couple of hours of the New York session.
Nevertheless, as of Tuesday morning, sellers dominated the oil market. For the second time this month, the oil price is below the support line and under the 50-day moving average. At the beginning of April, the price returned to the upside.
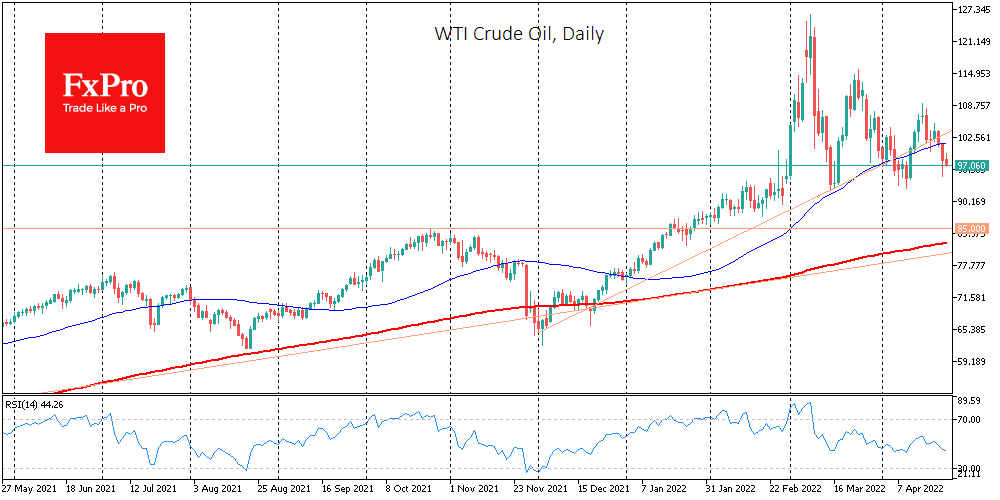
A break of the upward trend will be confirmed in case of a break below $93.50, the area of the lows of March and the first half of April.
On the side of the bears is the slowdown of economic growth in China, the threat of a fall in consumption due to the expanding lockdowns, and the risk that Beijing may also soon be closed.
If the oil gets fixed under 93.50, like in the case of Gold before, we might see a relatively quick surrender of the bull speculators, which would take the price back to $82.50-85.0, which is the area of October picks and the 200-day moving average.
Falling below $80 for the foreseeable future would represent a break in the uptrend originating from the area of pandemic lows. Such a scenario is possible in a sharp increase in turbulence in the financial markets, possibly due to a sharp tightening of monetary policy by the world’s biggest central banks, led by the Fed.
ECB Kazaks: Rate hike in July is possible and reasonable
ECB Governing Council member Martins Kazaks said "a rate rise in July is possible and reasonable" and "ending the Asset Purchases Programme in early July is appropriate,"
"Markets are pricing two or three 25 basis point steps by the end of the year. I have no reason to object to this, it's quite a reasonable view to take," he said. "Whether it happens in July or September is not dramatically different, but I think July would be a better option."
Gold at Risk of Bearish Continuation; 1,890 Level in Focus
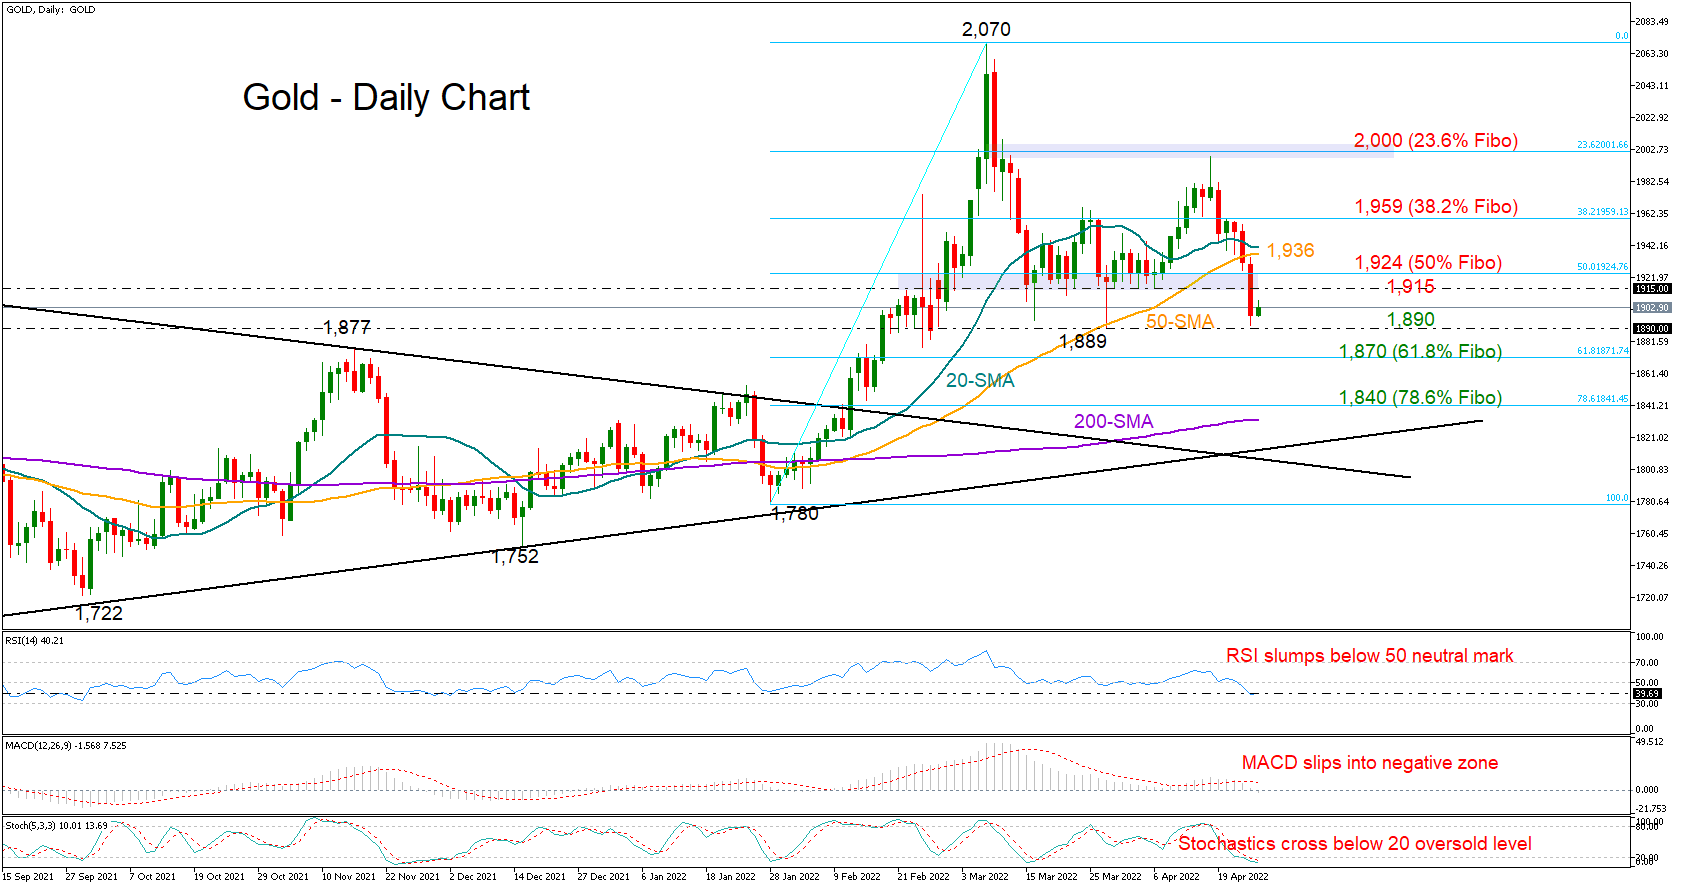
Gold started the week on the wrong foot, drifting below the $1,900 level on Monday after hitting a wall around the 50-day simple moving average (SMA) at $1,934.
More importantly, the precious metal closed clearly below the tough support of $1,915 after almost two months of consolidation, raising the stakes for additional declines in the coming sessions. The technical indicators back this narrative too as the RSI has slumped below its 50 neutral mark and the MACD has slipped below zero.
Encouragingly, there is another floor at $1,890, and with the Stochastics positioned in the oversold territory, an upside reversal or some stabilization cannot be ruled out. In case sellers persist, the $1,870 area, which includes the 61.8% Fibonacci retracement of the $1,780 – $2,070 upleg, will be critical for a broad outlook deterioration. Another losing battle here is expected to press the price towards the 78.6% Fibonacci of $1,840 and the 200-day, while lower, all eyes will turn to the area of trendlines at $1,812 –$1,800.
On the upside, the 50-day SMA currently at $1,936 will remain in scope. A break above this line is expected to provide access to the 38.2% Fibonacci of $1,959. Running higher, the price will push harder to claim the crucial $2,000 level, and if efforts prove successful this time, the door will open for the all-time high of $2,079.
In brief, gold is in a bearish situation for another week. Unless it maintains the base at $1,890, expectations are for a continuation to the downside, which could consequently ruin the 2022 pattern of higher highs.
Dow Jones and Nasdaq 100 volatility continues
US equities bounced back on Monday as investors reacted to the deal between Twitter and Elon Musk. In a statement, Twitter said that it had reached a deal to sell itself for $44 billion. The Dow Jones rose by 238 points while Nasdaq 100 rose by 165 points ahead of the upcoming big tech earnings. Investors are concerned about the slowing economy as China locks down major cities like Shanghai and as the war in Ukraine continued. Some of the top movers were companies like Moderna, Match Group, and Alphabet. Coca-Cola shares rose after the company announced spectacular results. On the other hand, companies like Schlumberger, Haliburton, and Deere declined by more than 8%.
The US dollar index held steady as the CBOE volatility index rose. The index rose above $101.75, which was the highest level since 2020. The currency will react to the latest durable goods order, consumer confidence, and new home sales numbers. Economists expect the data to show that consumer confidence rose from 107.2 in March to 108.0 even as inflation continued. Further, they expect that new home sales reduced from 772k to 765k. Other numbers are expected to show that durable goods orders rose to 1.0% after falling by 2.1% in February.
Gold crashed to the lowest level since March 25th as the commodity sell-off continued. It declined sharply even as bond yields also crashed hard. For example, the 10-year yield declined to 2.78%, which was lower than this year’s high of 2.98%. Similarly, the 30-year yield dropped to 2.87% while the 2-year fell to 2.57%. In addition to gold, other commodity prices also declined sharply. For example, silver crashed to $23 while Brent and West Texas Intermediate (WTI) fell to $100 and $96.30, respectively.
XAGUSD
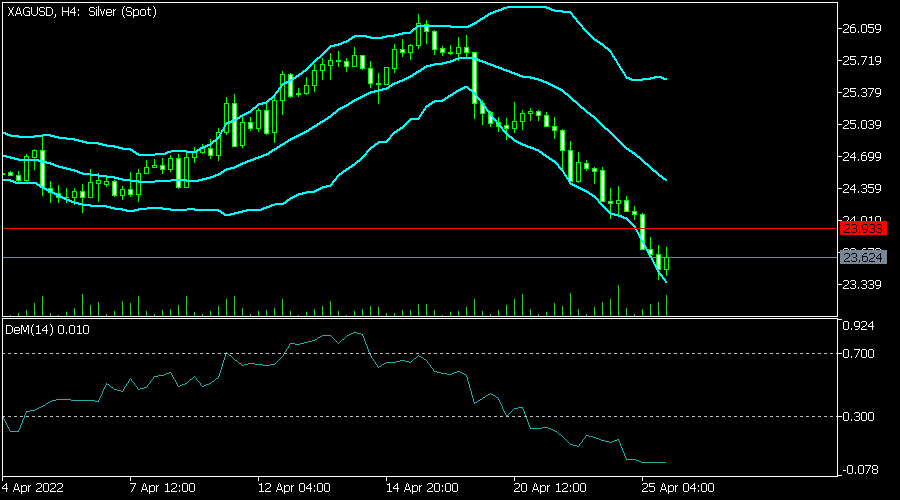
The XAGUSD pair crashed hard as commodity prices declined. It fell to a low of 23.40, which was the lowest level since February 18. On the four-hour chart, the pair moved below the important support level at 23.93. It also moved below the 25-day and 50-day moving averages. The DeMarker indicator moved below the oversold level. The price is also along the lower side of the Bollinger Bands. Therefore, the pair will likely have a relief rally soon.
XAUUSD
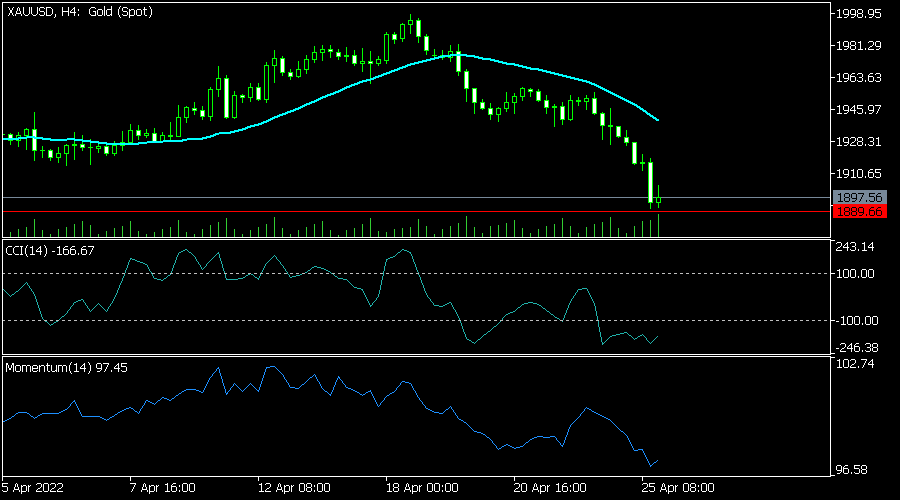
The XAUUSD pair crashed to a low of 1,889, which was last at the lowest level on March 29. On the four-hour chart, the pair managed to move below the 25-day moving average while the momentum indicator has been falling. The commodity channel index has also moved below the oversold territory. Like silver, there is a possibility that the pair will likely rebound in the near term.
EURUSD
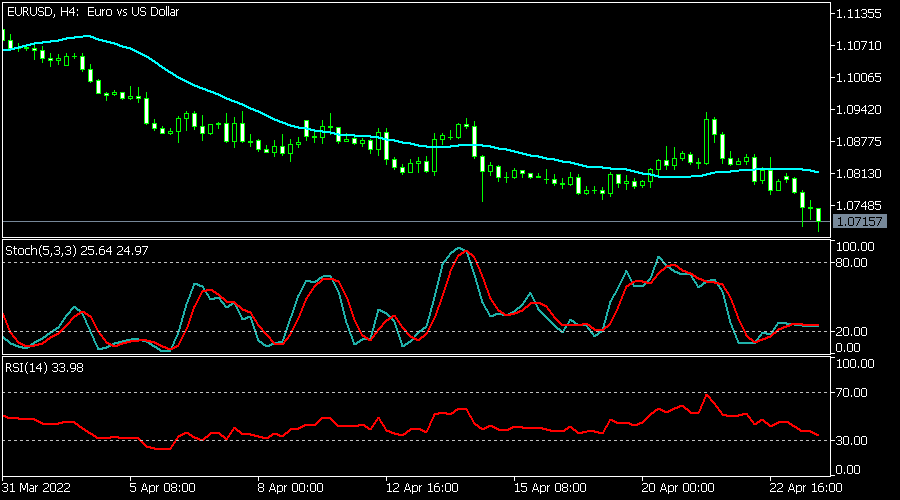
The EURUSD pair continued its bearish trend in the past few days. The pair crashed to the lowest level since 2020 as volatility rose. It has moved below the 25-day and 50-day moving averages. Also, the Relative Strength Index (RSI) is approaching the oversold level on the 4H chart. The Stochastic oscillator is hovering near the oversold level. Therefore, the pair will likely have a relief rally today.
Beijing Blues Hold Asia in Thrall
Asian markets are showing tentative signs of life today after the sell-everything move lower yesterday. It looks more dead cat bounce than brave new world though as Beijing’s Covid-19 situation has knocked the Ukraine/Russia war, the Federal Reserve, threats of nuclear war from Russia, and even Elon Musk and Twitter off the headlines. I can’t imagine Elon is happy about that. Nothing that a 6,000 km wide (3,728.25 miles for Americans), hashtag etched on the surface of Mars won’t cure.
Covid casts pall over China’s growth
It seems that threats to China’s growth outlook thanks to its Covid-zero policy but begun by its regulatory clampdown and the property developer leverage trainwreck, trumps all as far as financial markets are concerned. That is an entirely reasonable assumption. For over two decades, China’s growth has been as solid an investment as an AAA-rated bond. China stopped the rot in the Asian financial crisis (the 1990’s kids), by not devaluing the yuan. It became the consumer of last resort through and post the GFC. If this party is about to end as leverage, a virus and stubbornness catch up with China, it is indeed a schism, and not just for China.
Part of the problem is that the rest of the world has become addicted to China hitting a stimulate button bigger than anything you could buy in Amsterdam at the first sign of trouble. This time around, China appears to be sticking to its guns and simultaneously trying to deleverage certain sectors (property), while applying targeted stimulus to specific sectors such as SMEs, energy, agricultural production, etc, as it locks down swaths of the country and keeps borders closed to play whack-a-mole with Covid-19.
Little surprise then that news of mass testing and limited lockdowns in areas of Beijing was the straw that broke the camel’s back. Unfortunately, China is finding out what other previously Covid-zero countries have. You have to be right 100% of the time, the virus only has to get lucky once. The incipient relief rally across currencies, equities, energy, and metals that we saw in New York and early Asia is likely to run into a China growth brick wall, as news emerges that China will expand mass testing to the whole of Beijing between the 26th and 30th of April. Asian currencies, including the offshore Yuan, and equities, are showing almost no reaction to the PBOC’s overnight foreign reserve cut for China banks, or further PBOC-speak around adequate liquidity and targeted support measures.
The China growth concerns have subsumed any data releases from Asia today. South Korean Advanced Q1 GDP eased to 3.10%, slightly better than expected. Similarly, Japan’s Unemployment for March fell to 2.60%. The Japanese finance minister has been on the wires denying the US and Japan were planning joint USD/JPY intervention, while also trotting out the usual watching currency markets closely rhetoric. USD/JPY hasn’t moved.
Singapore Industrial Production later today has downside risks, and a soft print may increase pressure on the Singapore Dollar once again, suffering like the Malaysian ringgit, from its high beta to China growth. The Indonesian rupiah weakened notably yesterday, breaking out of its carefully managed multi-month range after President Jokowi announced a palm oil export ban. The government has softened Pak Jokowi’s ban today to processed oils but contained a non-too-subtle warning to the country’s food oligarchs, that if cooking oil disappeared off the shelves again, the ban would be expanded. As I mentioned yesterday, food nationalism is an existential threat to social order and inflation in 2022. The rupiah’s fall won’t be enough to bring forward Bank Indonesia’s tightening schedule, for now.
Europe’s data calendar is quiet, but the US releases a swath of data. That includes Durable Goods, S&P Case-Shiller House Prices, the House Price Index, Richmond Fed Manufacturing and Service, as well New Home Sales. Soft data will ease the Fed tightening noise, possibly supporting equities. While firm data is likely to have the opposite effect. Likely we will get a mixed bag with New Home Sales, in particular, having downside risks as mortgage interest rates soar.
With Fed speakers in pre-FOMC media lockdown, the only data that could break the markets out of its hawkish FOMC/China growth funk will be tech heavyweight earnings this week. Today we have Microsoft and Alphabet. Both should have had impressive quarters, but the real meat in the sandwich will be their 2022 outlooks going forward. Softer guidance will have stock markets back to square one once again.
Markets Spooked By China Lockdowns and Rate Hike Jitters
Asian markets were wrapped in caution on Tuesday as investors nursed the nasty hangover from the previous day’s rout as fears over the impact of China’s new lockdowns lingered in the air.
Overnight, Wall Street was thrown a lifeline later in the session after Twitter agreed to be bought by billionaire Elon Musk. In the currency space, the mighty dollar climbed to its highest level since March 2020 thanks to risk aversion and expectations over the Fed raising rates by 50 basis points next month. There was no love for gold despite the risk-off mood, with the precious metal securing a daily close below $1900, while oil tumbled below $100 amid worries about the global energy demand outlook.
Caution is likely to remain the name of the game this week with sentiment fragile as strict lockdowns in China, concerns around a global slowdown, Fed rate hike fears and geopolitical risks leave investors on edge. On the data front, there are a couple of key economic data releases from major economies, especially in the United States. Tech titans will be publishing their earnings this week with Microsoft and Google’s parent company Alphabet announcing their results on Tuesday after the market close. With so much going on, this promises to be another eventful and potentially volatile week for financial markets. Yesterday’s wild movements across the FX, commodity and equity space are testament to this.
Dollar bulls charge on…
The dollar kicked off the week by appreciating against almost every single G10 currency as concerns over the economic impact of China’s strict lockdown sent investors rushing towards safety.
Market expectations over the Federal Reserve aggressively raising interest rates also empowered dollar bulls, propelling the dollar index (DXY) to a fresh two-year high. There are several key economic data points over the next few days which are likely to inject the currency with renewed vigour. US consumer confidence, Q1 GDP, and the PCE deflator will all be published, ahead of the key FOMC meeting next week. Should the data further reinforce market expectations over the Fed aggressively raising interest rates, the dollar could be set to appreciate further.
Oil back below $100
Oil benchmarks wobbled below $100 this morning after experiencing a sharp selloff in the previous session, due to fears that lockdowns in China will hit energy demand in the world’s second largest economy. On top of this, an appreciating dollar is adding extra pressure on the global commodity with Brent shedding roughly 1.5% this month. That said, geopolitical risks may limit downside losses, especially if the United States and its allies consider expanding sanctions on Russian oil imports.
On the data front, it may be wise to keep a close eye on the Energy Information Administration (EIA) report published on Wednesday. Another weekly drawdown in crude inventories could lend oil bulls a helping hand.
Commodity spotlight - Gold
After trading within a range for many weeks, gold finally experienced a solid breakdown below $1920 support with bears securing a daily close beneath the psychological $1900 level. The precious metal struggled to shine against a mighty dollar and aggressive Fed rate hike bets. With the greenback on a tear and potentially receiving further support in the week ahead, this could spell more trouble for gold despite the market caution and risk aversion.
Looking at the technical picture, sustained weakness below $1920 could signal a decline towards $1880 and $1850. Should $1900 prove to be reliable support, prices could retest $1920. A move back above this level will send prices into the prior range with the first level of resistance at $1960.
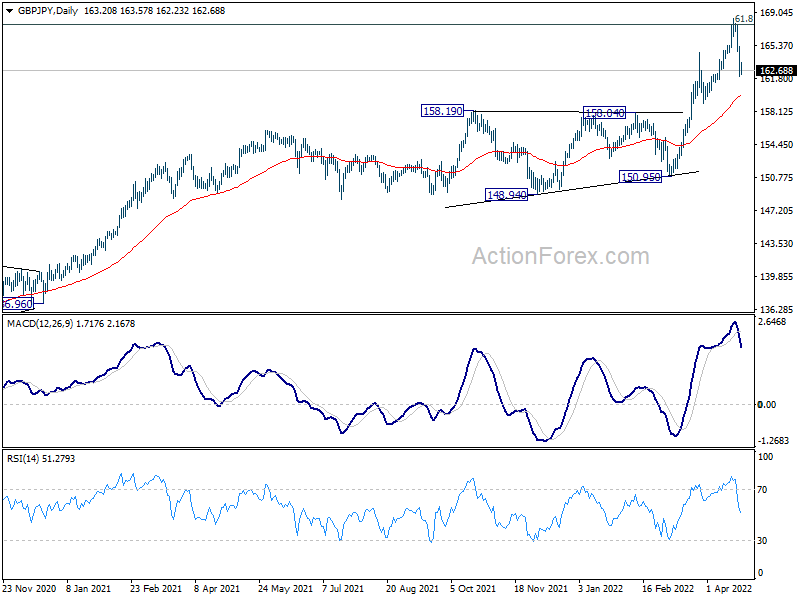
GBP/JPY Daily Outlook
Daily Pivots: (S1) 161.77 (P) 163.55; (R1) 165.04; More...
Intraday bias in GBP/JPY remains neutral as correction from 168.40 is extending. downside should be contained by 159.02 support to bring another rally. On the upside, break of 168.40 will resume larger up trend. However, firm break of 159.02 will dampen this bullish case and bring deeper pull back.
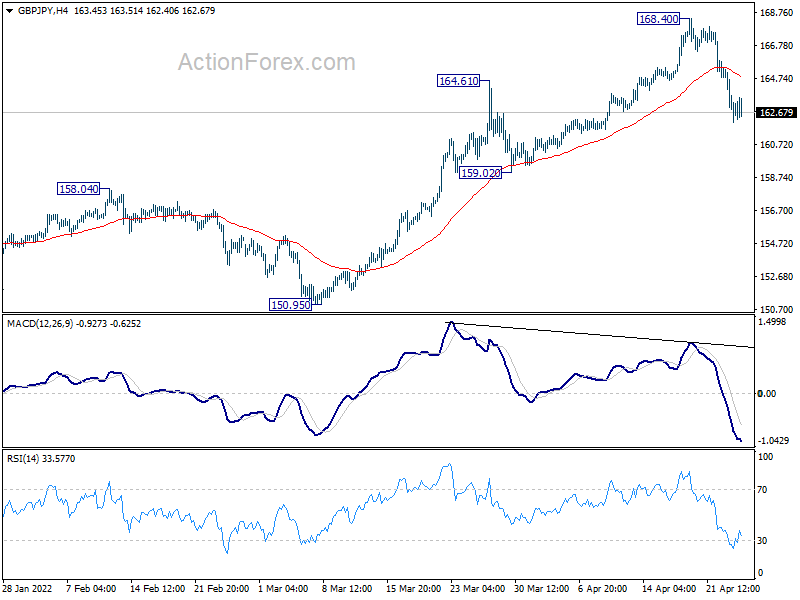
In the bigger picture, up trend from 123.94 (2020 low) is still in progress. Sustained break of 61.8% retracement of 195.86 (2015 high) to 122.75 (2016 low) at 167.93 will be a long term bullish signal, and could pave the way back to 195.86 high. This will now remain the favored case as long as 150.95 support holds, even in case of deep pull back.
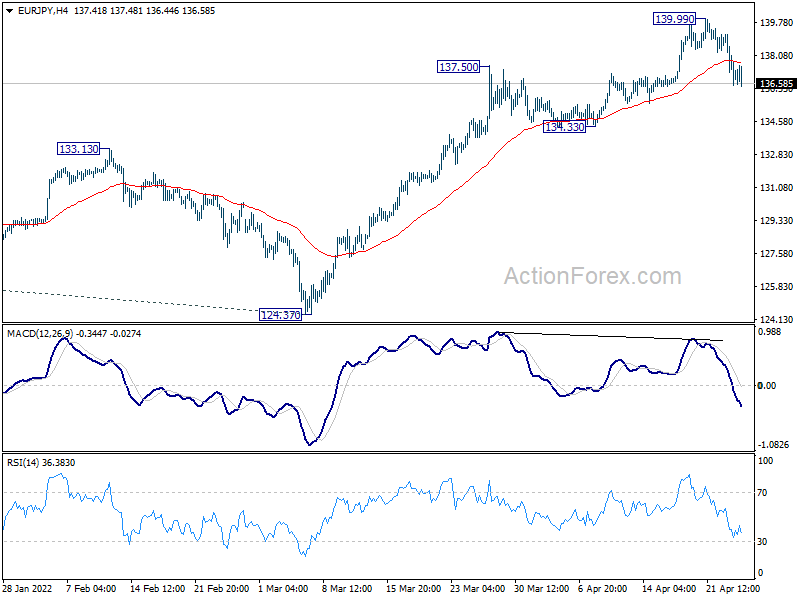
EUR/JPY Daily Outlook
Daily Pivots: (S1) 136.08; (P) 137.65; (R1) 138.80; More....
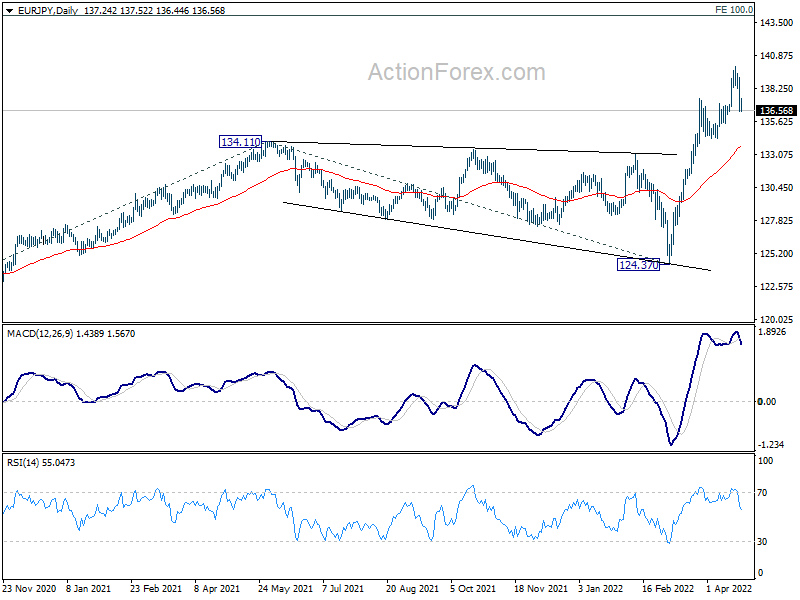
Intraday bias in EUR/JPY remains neutral as correction from 139.99 is extending. Downside should be contained by 134.33 support to bring up trend resumption. On the upside, break of 139.99 will resume larger up trend to 144.06 projection level next. However, sustained break of 134.33 will dampen this bullish case and bring deeper pull back.
In the bigger picture, up trend from 114.42 (2020 low) is in progress. Such rise is seen as the third leg of the pattern from 109.30 (2016 low). Next target will be 100% projection of 114.42 to 134.11 from 124.37 at 144.06. In any case, outlook will now remain bullish as long as 124.37 support holds, in case of deep pull back.
EUR/AUD Daily Outlook
Daily Pivots: (S1) 1.4854; (P) 1.4954; (R1) 1.5017; More...
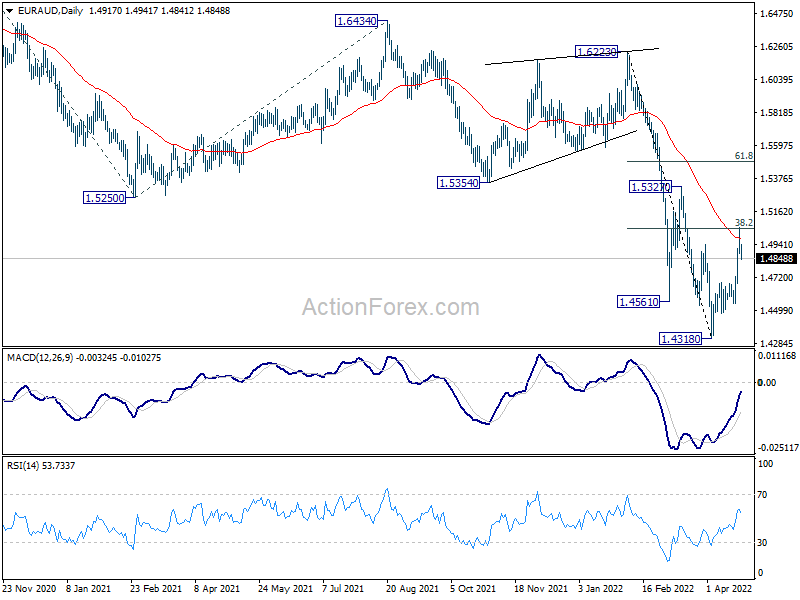
EUR/AUD retreats after hitting 38.2% retracement of 1.6223 to 1.4318 at 1.5046. Intraday bias remains is turned neutral first, and further rise is in favor with 1.4687 support intact. On the upside, break of 1.5053 will target 61.8% retracement at 1.5495. On the downside, below 1.4687 minor support will turn bias back to the downside for retesting 1.4318 instead.
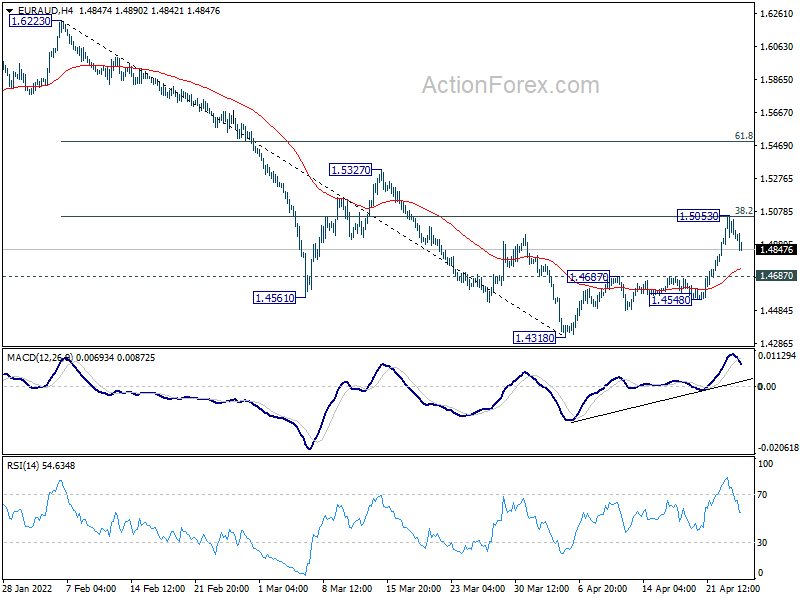
In the bigger picture, fall from 1.9799 is seen as a long term impulsive move. Next target is 61.8% projection of 1.9799 to 1.5250 from 1.6434 at 1.3623, which is close to 1.3624 long term support (2017 low). Some support could be seen there to bring interim rebound. But overall, break of 1.5354 support turned resistance is needed to be the first sign of medium term bottoming. Otherwise, outlook will stay bearish in case of recovery.