

Sample Category Title
USD/CHF Daily Outlook
Daily Pivots: (S1) 0.9584; (P) 0.9606; (R1) 0.9647; More....
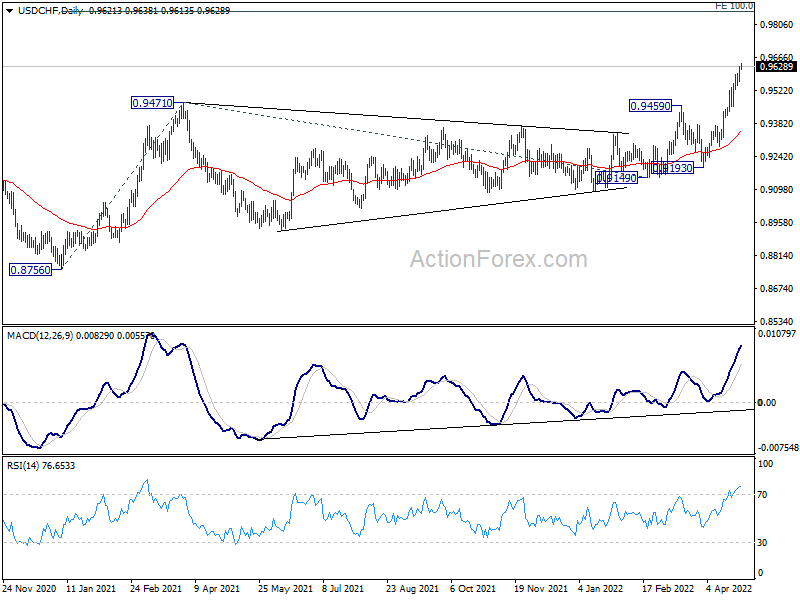
Intraday bias in USD/CHF is back on the upside as rally resumed after brief consolidation. Current rise should target 0.9864 projection level next. On the downside, below 0.9545 minor support will turn intraday bias neutral and bring consolidations. But downside of retreat should be contained above 0.9372 resistance turned support to bring another rally.
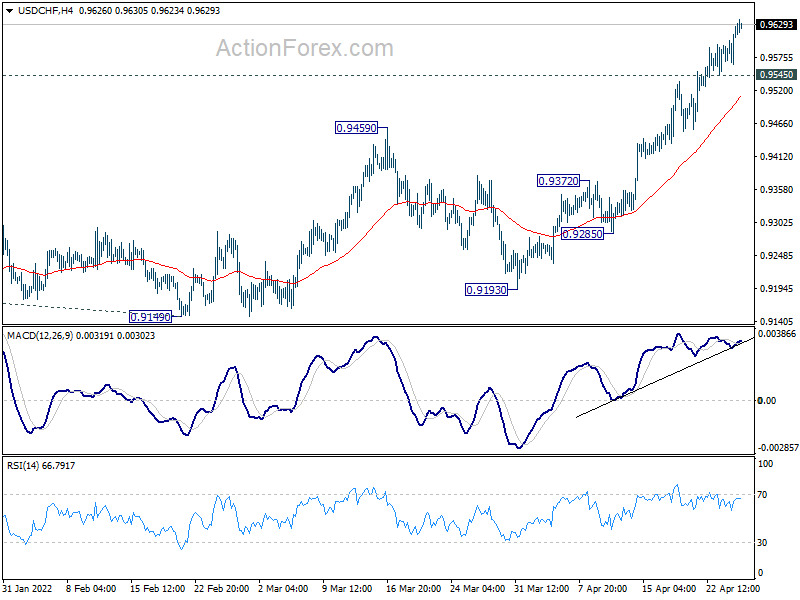
In the bigger picture, down trend from 1.0342 (2016 high) should have completed with three waves down to 0.8756 (2021 low) already. Rise from 0.8756 is likely a medium term up trend of its own. Next target is 100% projection of 0.8756 to 0.9471 from 0.9149 at 0.9864. This will now remain the favored case as long as 0.9459 resistance turned support holds.
USD/JPY Daily Outlook
Daily Pivots: (S1) 126.76; (P) 127.49; (R1) 127.96; More...
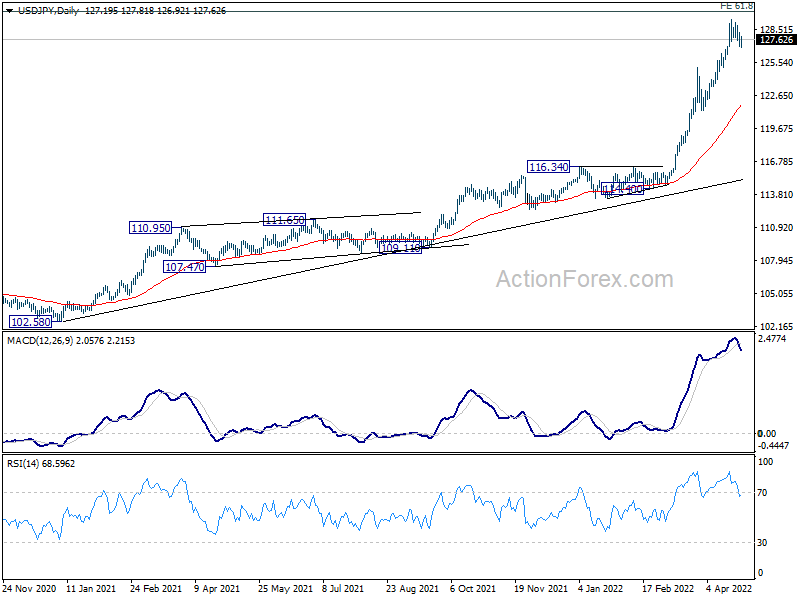
USD/JPY is still extending the consolidation from 129.39 and intraday bias remains neutral for the moment. Deeper retreat could be seen but downside should be contained above 125.09 resistance turned support to bring another rally. On the upside, above 129.39 will target 130.04 long term projection level next.
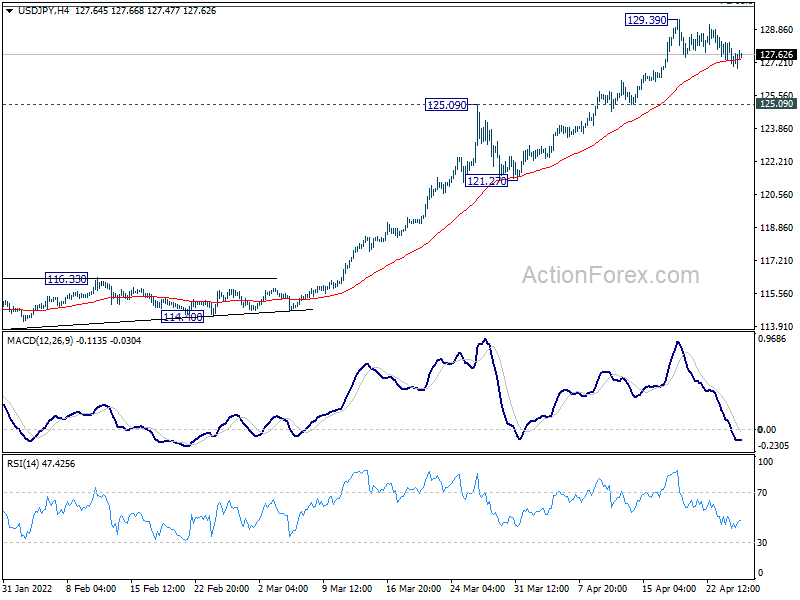
In the bigger picture, the break of 125.85 resistance (2015 high) suggests that whole up trend from 75.56 (2011 low) is resuming. Further rise should be seen to 61.8% projection of 75.56 (2011 low) to 125.85 (2015 high) from 98.97 at 130.04. Sustained break there wave the way to 147.68 (1998 high). For now, this will remain the favored case as long as 121.27 support holds.
USD/CAD Daily Outlook
Daily Pivots: (S1) 1.2731; (P) 1.2780; (R1) 1.2874; More...
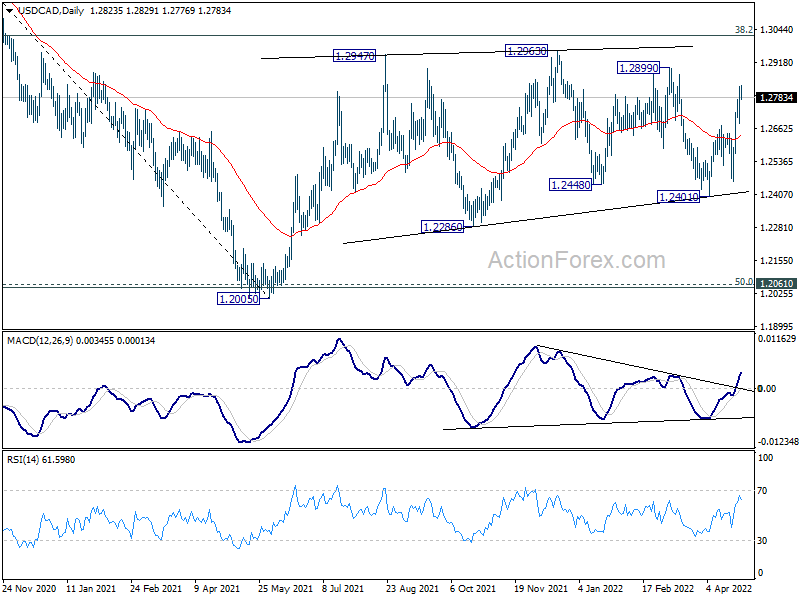
USD/CAD's rally from 1.2401 is still in progress and intraday bias stay s on the upside for 1.2899 resistance. Break there will target 1.3022 fibonacci level next. On the downside, however, break of 1.2683 minor support will mix up the near term outlook and turn intraday bias neutral again.
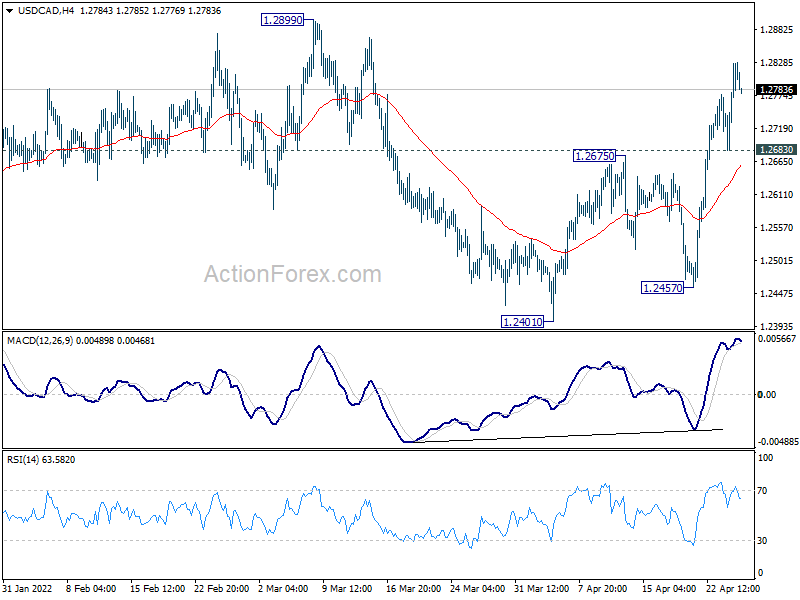
In the bigger picture, focus stays on 38.2% retracement of 1.4667 (2020 high) to 1.2005 (2021 low) at 1.3022. Sustained break there should confirm that the down trend from 1.4667 has completed after defending 1.2061 long term cluster support. Further rise would then be seen towards 61.8% retracement at 1.3650. However, rejection by 1.3022 will maintain medium term bearishness. Break of 1.2005 will resume the down trend from 1.4667 and that carries larger bearish implications too.
AUD/USD Daily Report
Daily Pivots: (S1) 0.7086; (P) 0.7157; (R1) 0.7196; More...
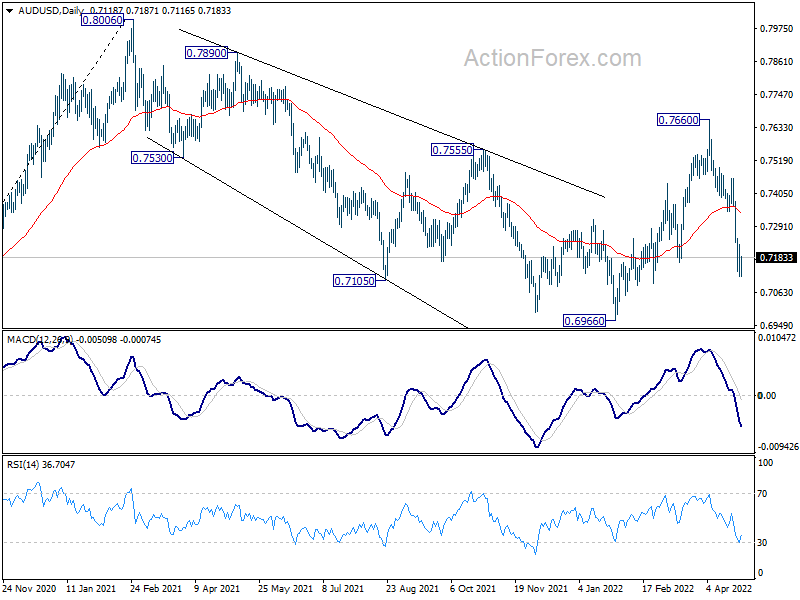
A temporary low is formed at 0.7116 in AUD/USD and intraday bias is turned neutral first. But near term outlook will remain cautiously bearish with 0.7342 support turned resistance intact. Current development argues that larger correction from 0.8006 is in its third leg. Below 0.7116 will target a retest on 0.6966 low first.
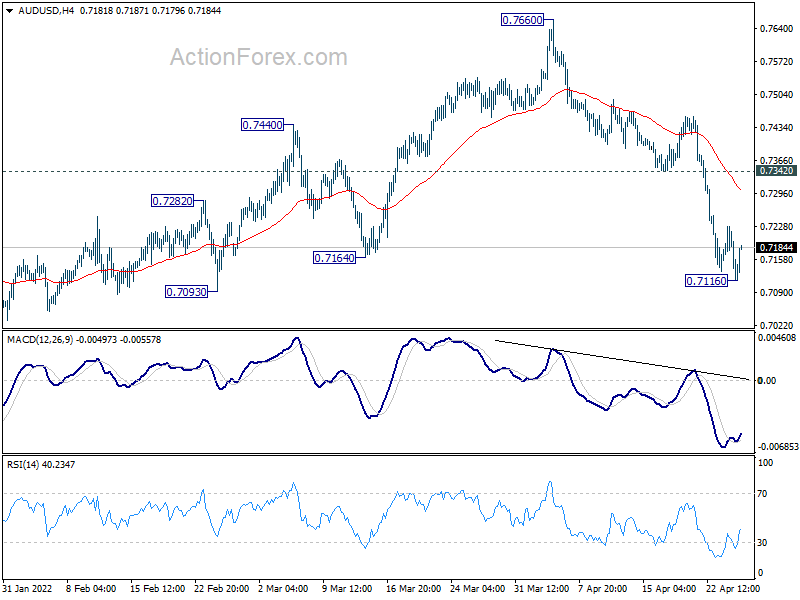
In the bigger picture, price actions from 0.8006 are seen as a corrective pattern to rise from 0.5506 (2020 low). Break of 0.7164 will suggest that such correction is still in progress, with fall from 0.7660 as the third leg. Next target will be 50% retracement of 0.5506 to 0.8006 at 0.6756. On the upside, break of 0.7660 will revive that case that the correction has already completed at 0.6966.
Aussie Stabilizing after Strong CPI, Yen and Dollar Strong on Risk Aversion
Yen and Dollar are both staying in the driving seat as risk-off sentiment continues to dominate the markets. Sterling remains the worst performing one, followed by Euro, with selling focus mainly on them. Australian Dollar recovers mildly as stronger than expected CPI data prompted some speculations that RBA could hike next week. But it's not too far away from Euro and Sterling in terms of weakness.
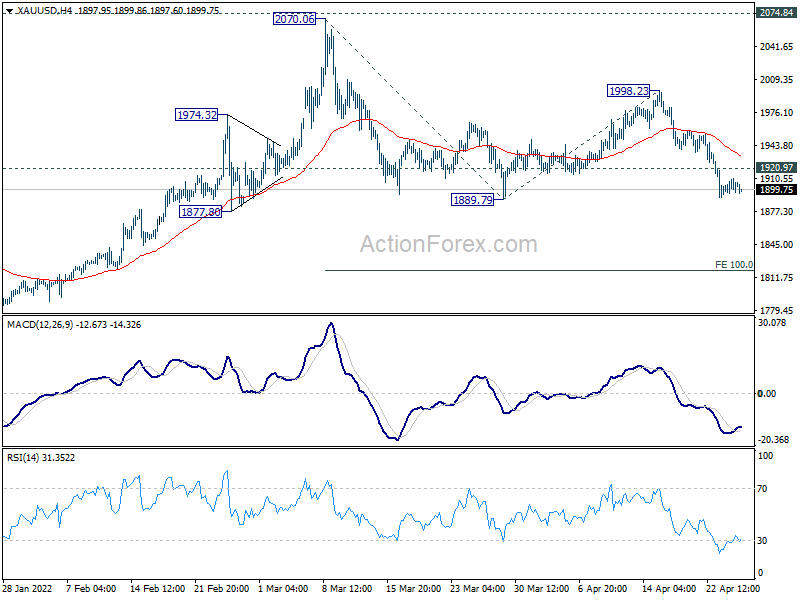
Technically, Gold is currently still struggling around 1900 handle but looks rather vulnerable. The fall from 1988.23 is seen as the third leg of the pattern from 2070.06. Deeper decline is expected as long as 1920.97 minor resistance holds. Break of 1889.79 will target 100% projection of 2070.06 to 1889.79 from 1998.23 at 1817.98. The move could be accompanied by another wave broad based buying in Dollar.
In Asia, at the time of writing, Nikkei is down -1.38%. Hong Kong HSI is up 0.09%. China Shanghai SSE is up 0.38%. Singapore Strait Times is down -0.09%. Japan 10-year JGB yield is down -0.0013 at 0.246. Overnight, DOW dropped -2.38%. S&P 500 dropped -2.81%. NASDAQ dropped -3.95%. 10-year yield dropped -0.054 to 2.772.
NASDAQ hits new low as medium term correction resumes
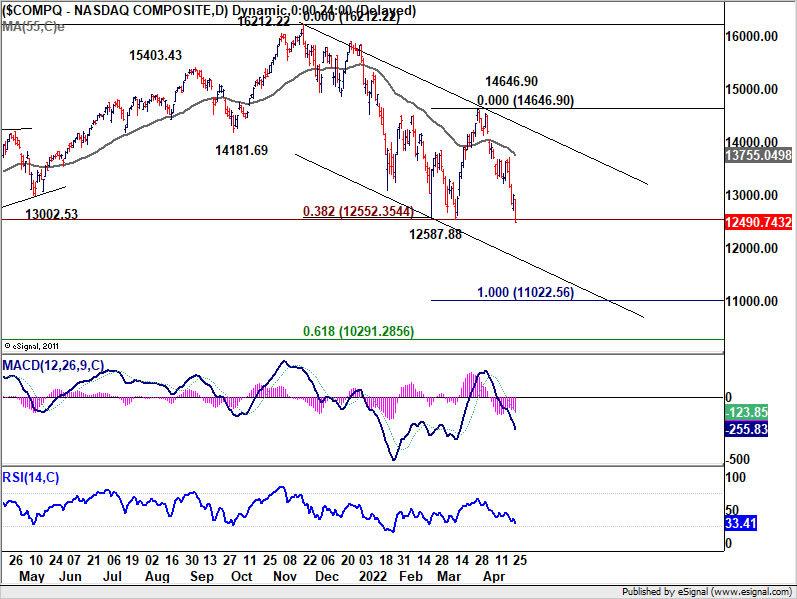
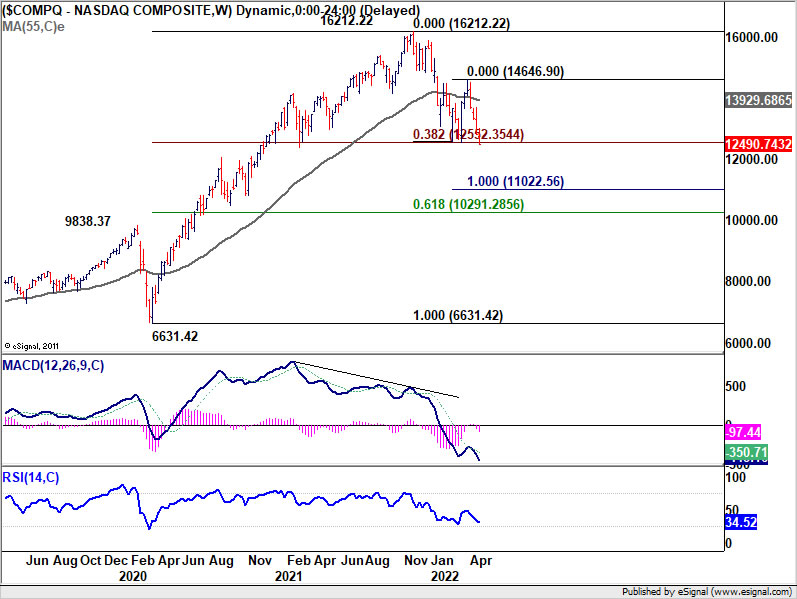
NASDAQ lost -3.95%% overnight and closed at a new 2022 low. The development suggests that whole corrective fall from 16212.22 is resuming. More importantly, a key medium term fibonacci support at 38.2% retracement of 6631.41 to 16212.22 at 12552.35 is taken out. If this fibonacci support cannot be reclaimed soon, the decline ahead could be rather deep.
Tentatively, NASDAQ should target 100% projection of 16212.22 to 12587.88 from 14646.90 at 11022.56 next. There should be strong support around this level, and above 61.8% retracement of 6631.42 to 16212.22 at 10291.28 to contain downside to finish the correction.
Australia CPI accelerated to 2.1% qoq, 5.1% yoy, highest since 2000
Australia CPI rose 2.1% qoq in Q1, accelerated from Q3's 1.3% qoq, above expectation of 1.7% qoq. For the 12-month period, CPI accelerated to 5.1% yoy, up from 3.5% yoy, above expectation of 4.6% yoy. RBA trimmed mean CPI also accelerated from 2.6% yoy to 3.7% yoy, above expectation of 3.4% yoy.
Head of Prices Statistics at the ABS, Michelle Marquardt, said "The CPI recorded its largest quarterly and annual rises since the introduction of the goods and services tax (GST) (in 2000)"
"Strong demand combined with material and labour supply disruptions throughout the year resulted in the highest annual inflation for new dwellings since the introduction of the GST. Annual price inflation for automotive fuel was the highest since the 1990 Iraqi invasion of Kuwait."
Marquardt said: "Annual trimmed mean inflation was the highest since 2009. This reflected the broad-based nature of price rises, as the impacts of supply disruptions, rising shipping costs and other global and domestic inflationary factors flowed through the economy."
Looking ahead
Germany Gfk consumer sentiment and Swiss Credit Suisse economic expectations will be featured in European session. Later in the day, US will release goods trade balance and pending home sales.
AUD/USD Daily Report
Daily Pivots: (S1) 0.7086; (P) 0.7157; (R1) 0.7196; More...
A temporary low is formed at 0.7116 in AUD/USD and intraday bias is turned neutral first. But near term outlook will remain cautiously bearish with 0.7342 support turned resistance intact. Current development argues that larger correction from 0.8006 is in its third leg. Below 0.7116 will target a retest on 0.6966 low first.
In the bigger picture, price actions from 0.8006 are seen as a corrective pattern to rise from 0.5506 (2020 low). Break of 0.7164 will suggest that such correction is still in progress, with fall from 0.7660 as the third leg. Next target will be 50% retracement of 0.5506 to 0.8006 at 0.6756. On the upside, break of 0.7660 will revive that case that the correction has already completed at 0.6966.
Economic Indicators Update
| GMT | Ccy | Events | Actual | Forecast | Previous | Revised |
|---|---|---|---|---|---|---|
| 01:30 | AUD | CPI Q/Q Q1 | 2.10% | 1.70% | 1.30% | |
| 01:30 | AUD | CPI Y/Y Q1 | 5.10% | 4.60% | 3.50% | |
| 01:30 | AUD | RBA Trimmed Mean CPI Q/Q Q1 | 1.40% | 1.20% | 1.00% | |
| 01:30 | AUD | RBA Trimmed Mean CPI Y/Y Q1 | 3.70% | 3.40% | 2.60% | |
| 06:00 | EUR | Germany Gfk Consumer Confidence May | -15.7 | -15.5 | ||
| 08:00 | CHF | Credit Suisse Economic Expectations Apr | -27.8 | |||
| 12:30 | USD | Goods Trade Balance (USD) Mar P | -105.0B | -106.6B | ||
| 12:30 | USD | Wholesale Inventories Mar P | 2.30% | 2.50% | ||
| 14:00 | USD | Pending Home Sales M/M Mar | -1.00% | -4.10% | ||
| 14:30 | USD | Crude Oil Inventories | 0.1M | -8.0M |
NASDAQ hits new low as medium term correction resumes
NASDAQ lost -3.95%% overnight and closed at a new 2022 low. The development suggests that whole corrective fall from 16212.22 is resuming. More importantly, a key medium term fibonacci support at 38.2% retracement of 6631.41 to 16212.22 at 12552.35 is taken out. If this fibonacci support cannot be reclaimed soon, the decline ahead could be rather deep.
Tentatively, NASDAQ should target 100% projection of 16212.22 to 12587.88 from 14646.90 at 11022.56 next. There should be strong support around this level, and above 61.8% retracement of 6631.42 to 16212.22 at 10291.28 to contain downside to finish the correction.
Australia CPI accelerated to 2.1% qoq, 5.1% yoy, highest since 2000
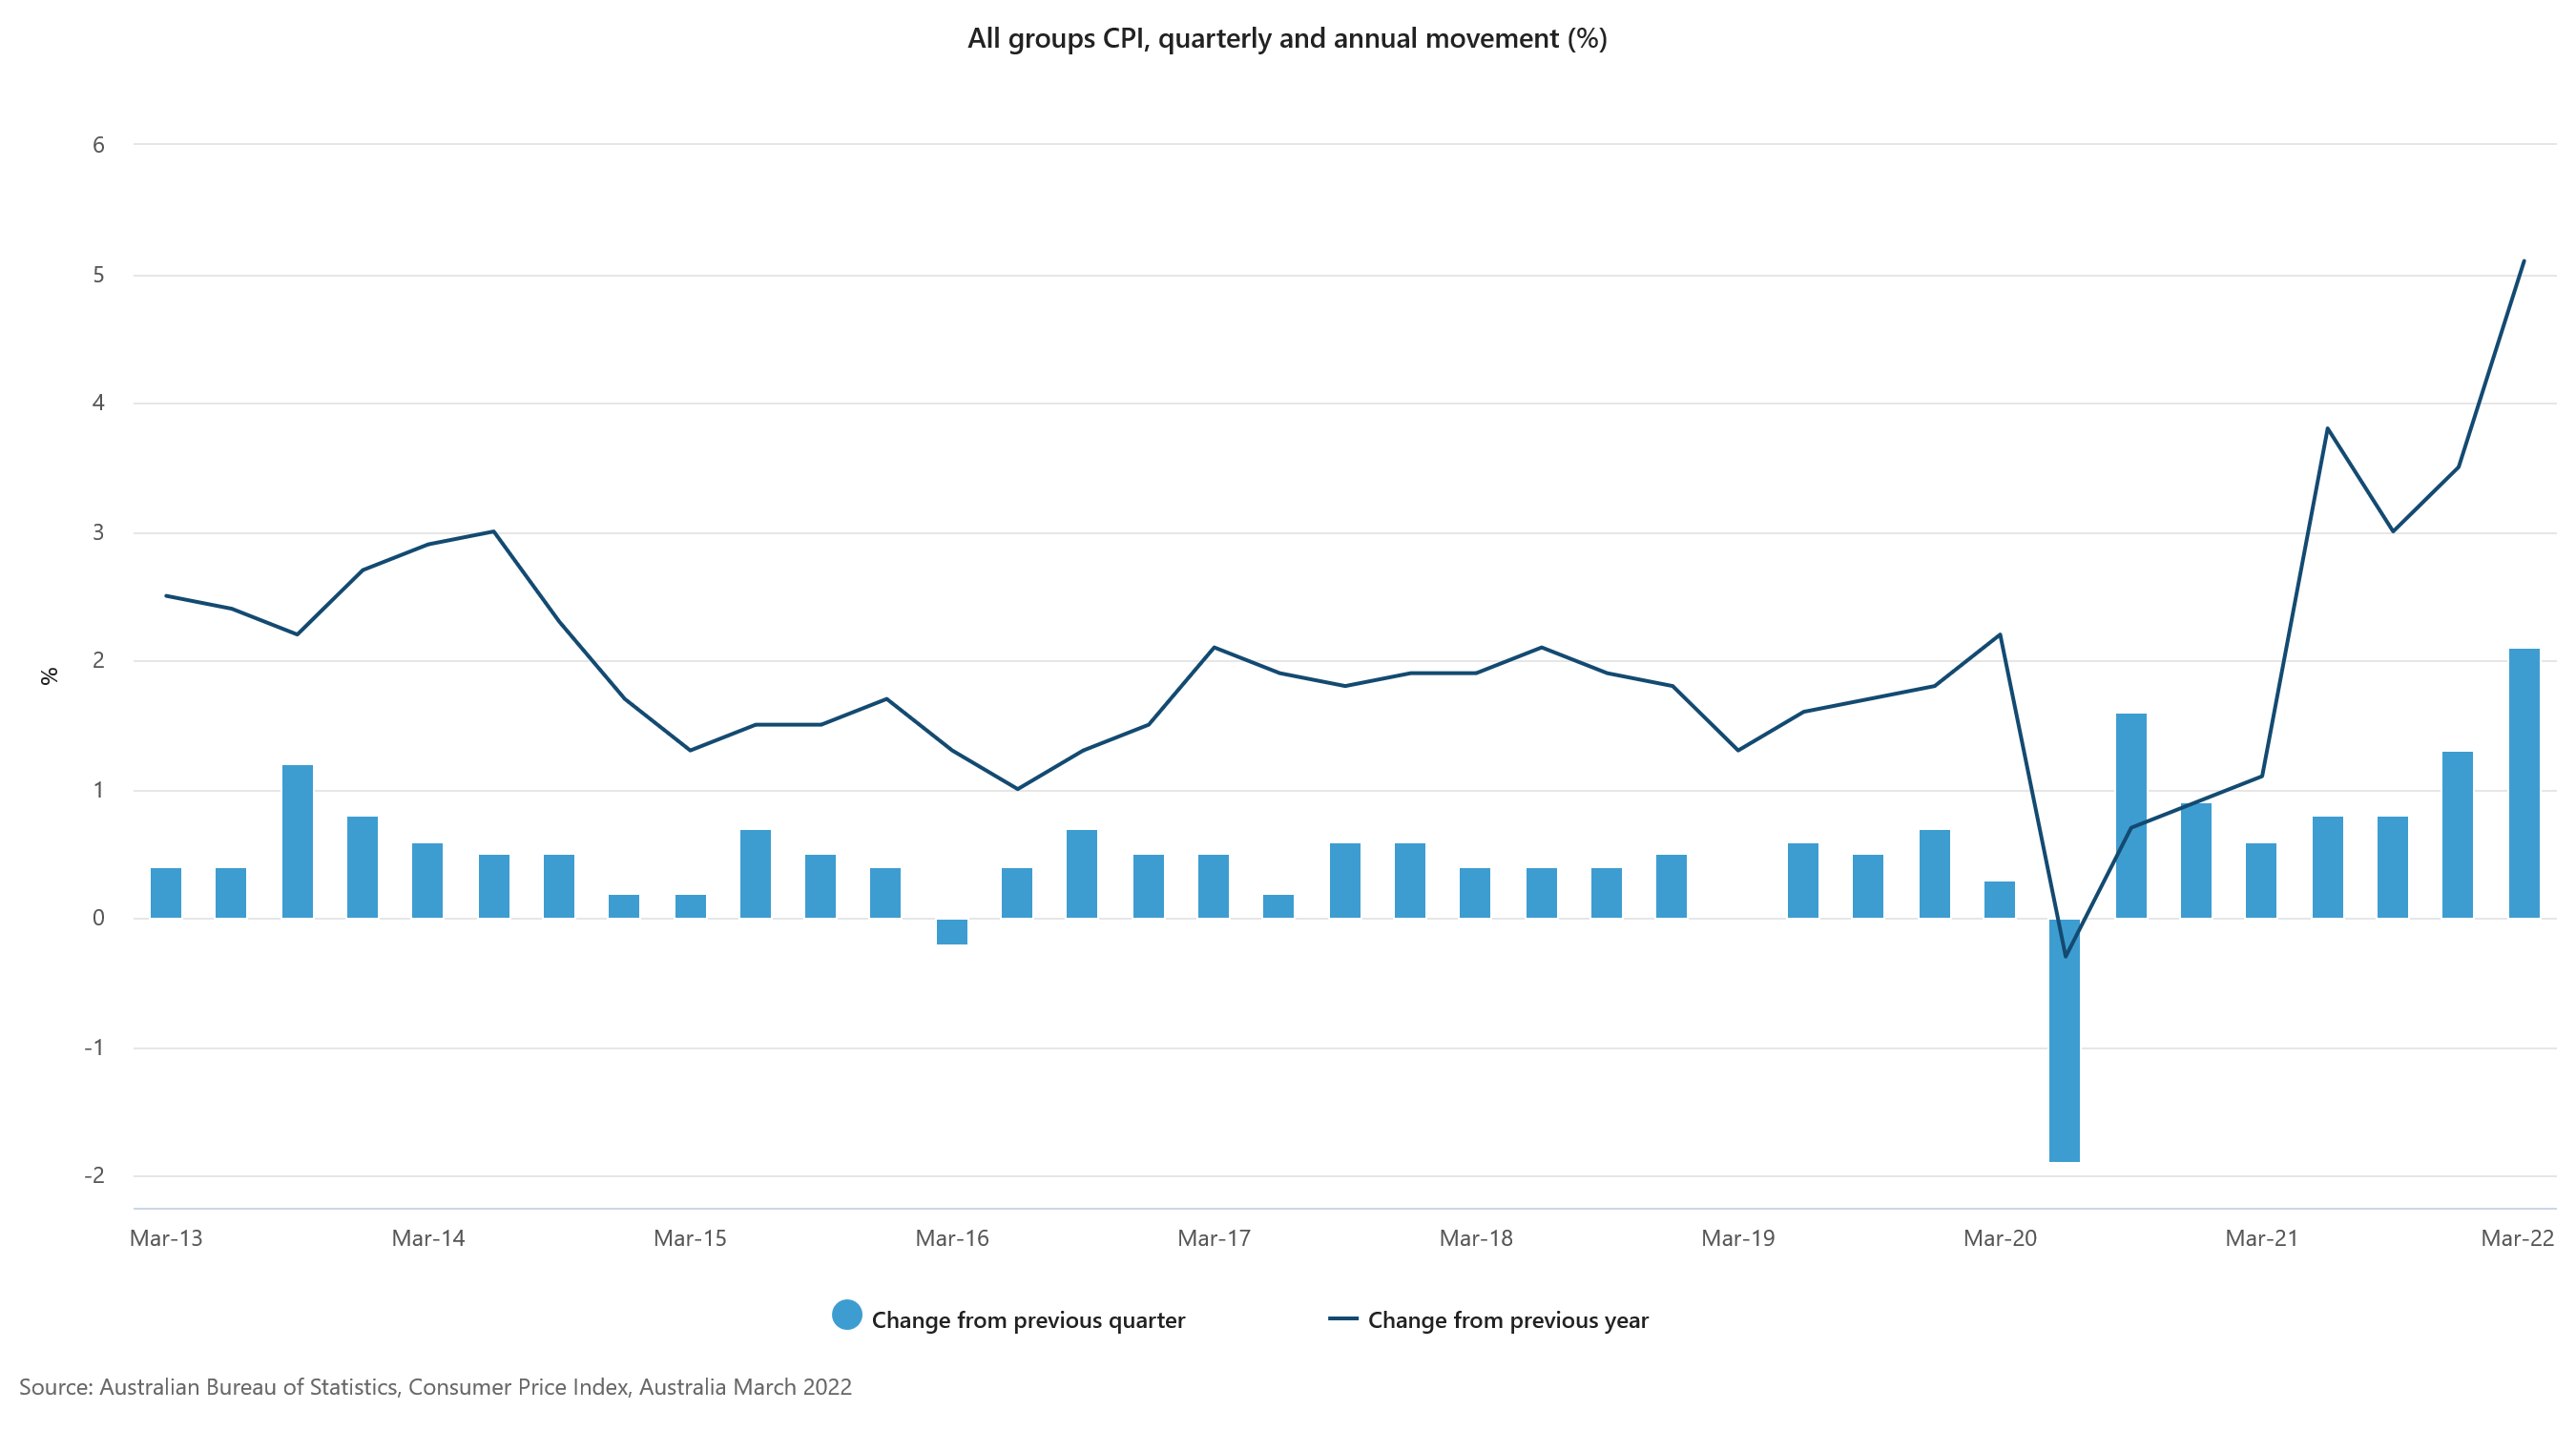
Australia CPI rose 2.1% qoq in Q1, accelerated from Q3's 1.3% qoq, above expectation of 1.7% qoq. For the 12-month period, CPI accelerated to 5.1% yoy, up from 3.5% yoy, above expectation of 4.6% yoy. RBA trimmed mean CPI also accelerated from 2.6% yoy to 3.7% yoy, above expectation of 3.4% yoy.
Head of Prices Statistics at the ABS, Michelle Marquardt, said "The CPI recorded its largest quarterly and annual rises since the introduction of the goods and services tax (GST) (in 2000)"
"Strong demand combined with material and labour supply disruptions throughout the year resulted in the highest annual inflation for new dwellings since the introduction of the GST. Annual price inflation for automotive fuel was the highest since the 1990 Iraqi invasion of Kuwait."
Marquardt said: "Annual trimmed mean inflation was the highest since 2009. This reflected the broad-based nature of price rises, as the impacts of supply disruptions, rising shipping costs and other global and domestic inflationary factors flowed through the economy."
Technical Outlook and Review
DXY:
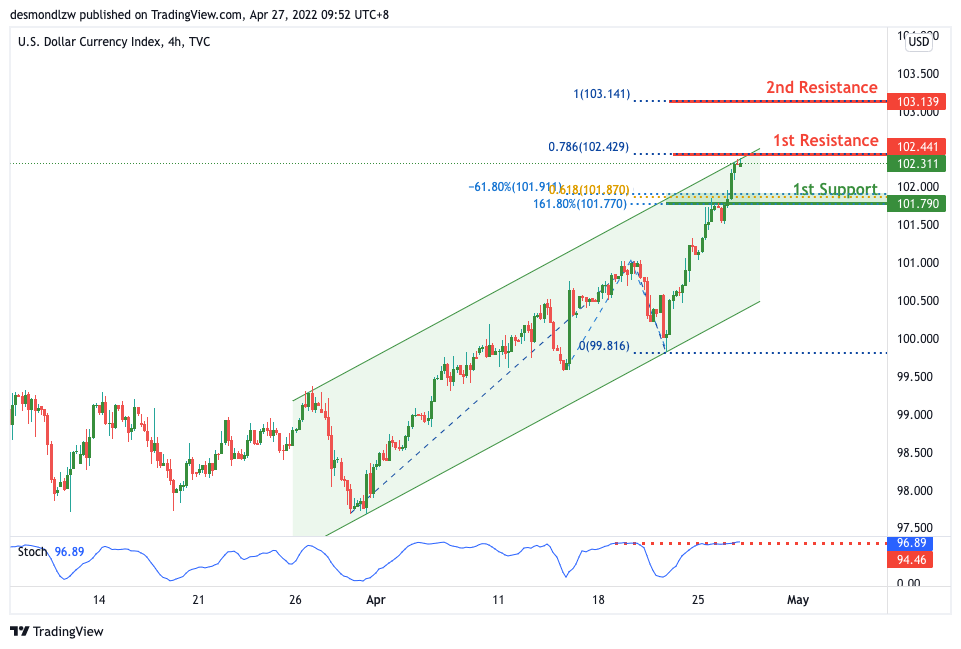
On the H4, with price expected to reverse off the stochastics indicator, we have a bearish bias that price will drop from our 1st resistance at 102.441 where the 78.6% Fibonacci retracement is to our 1st support at 101.790 in line with the horizontal pullback support, 161.8% Fibonacci extension, 61.8% Fibonacci projection and -61.8% Fibonacci expansion. Alternatively, price may break 1st resistance structure and head for 2nd resistance where the 100% Fibonacci projection.
Areas of consideration:
- H4 time frame, 1st resistance at 102.441
- H4 time frame, 1st support at 101.790
XAU/USD (GOLD):
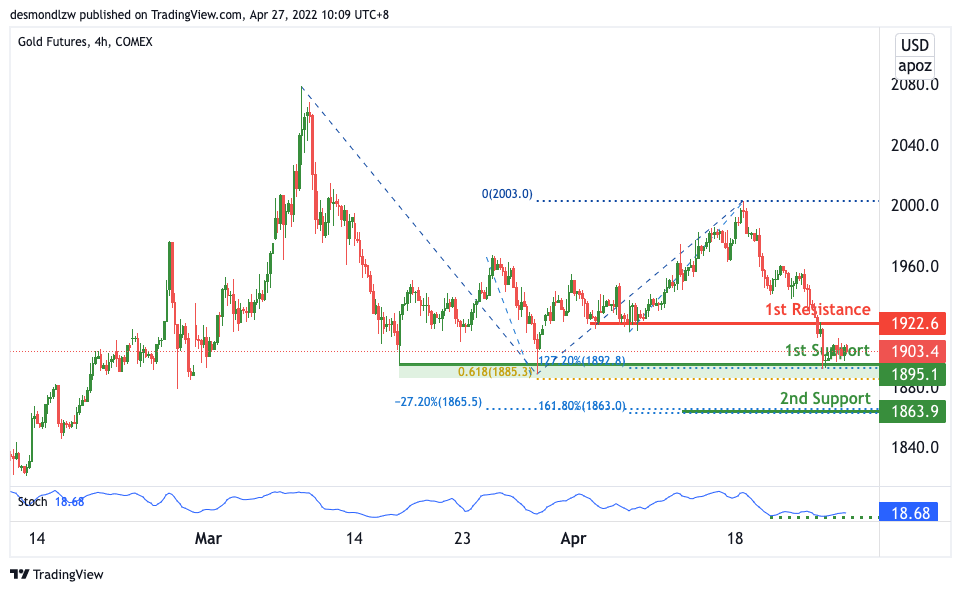
On the H4, with price expected to bounce off the stochastics indicator, we have a bullish bias that price will rise to our 1st resistance at 1922 where the pullback resistance is from our 1st support at 1895 in line with the horizontal swing low support and 61.8% Fibonacci projection and 127.2% Fibonacci extension. Alternatively, price may break 1st support structure and head for 2nd support where the 161.8% Fibonacci extension and -27.2% Fibonacci expansion is at 1863.
Areas of consideration:
- H4 time frame, 1st Resistance at 1922
- H4 time frame, 1st Support at 1895
GBP/USD:
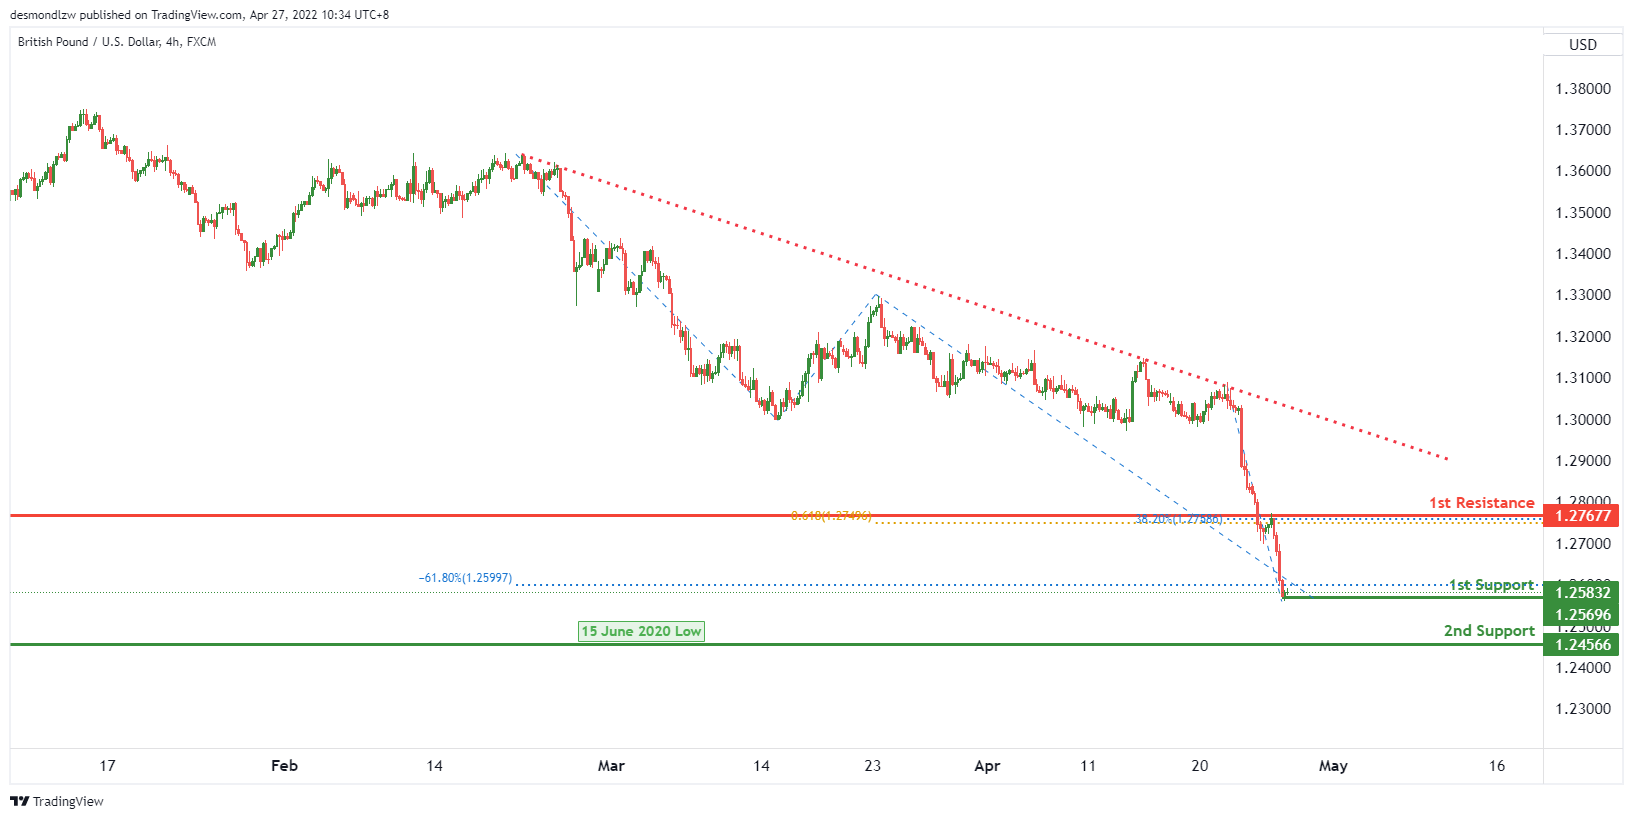
On the H4, we have a bullish bias that price will rise from 1st support level of 1.25696 which lines up with -61.8% fibonacci expansion towards the 1st resistance level of 1.27677 which lines up with 61.8% fibonacci projection and 38.2% fibonacci retracement.
Areas of consideration:
- H4 1st resistance at 1.27677
- H4 1st support at 1.25696
- H4 2nd support at 1.24566
USD/CHF:
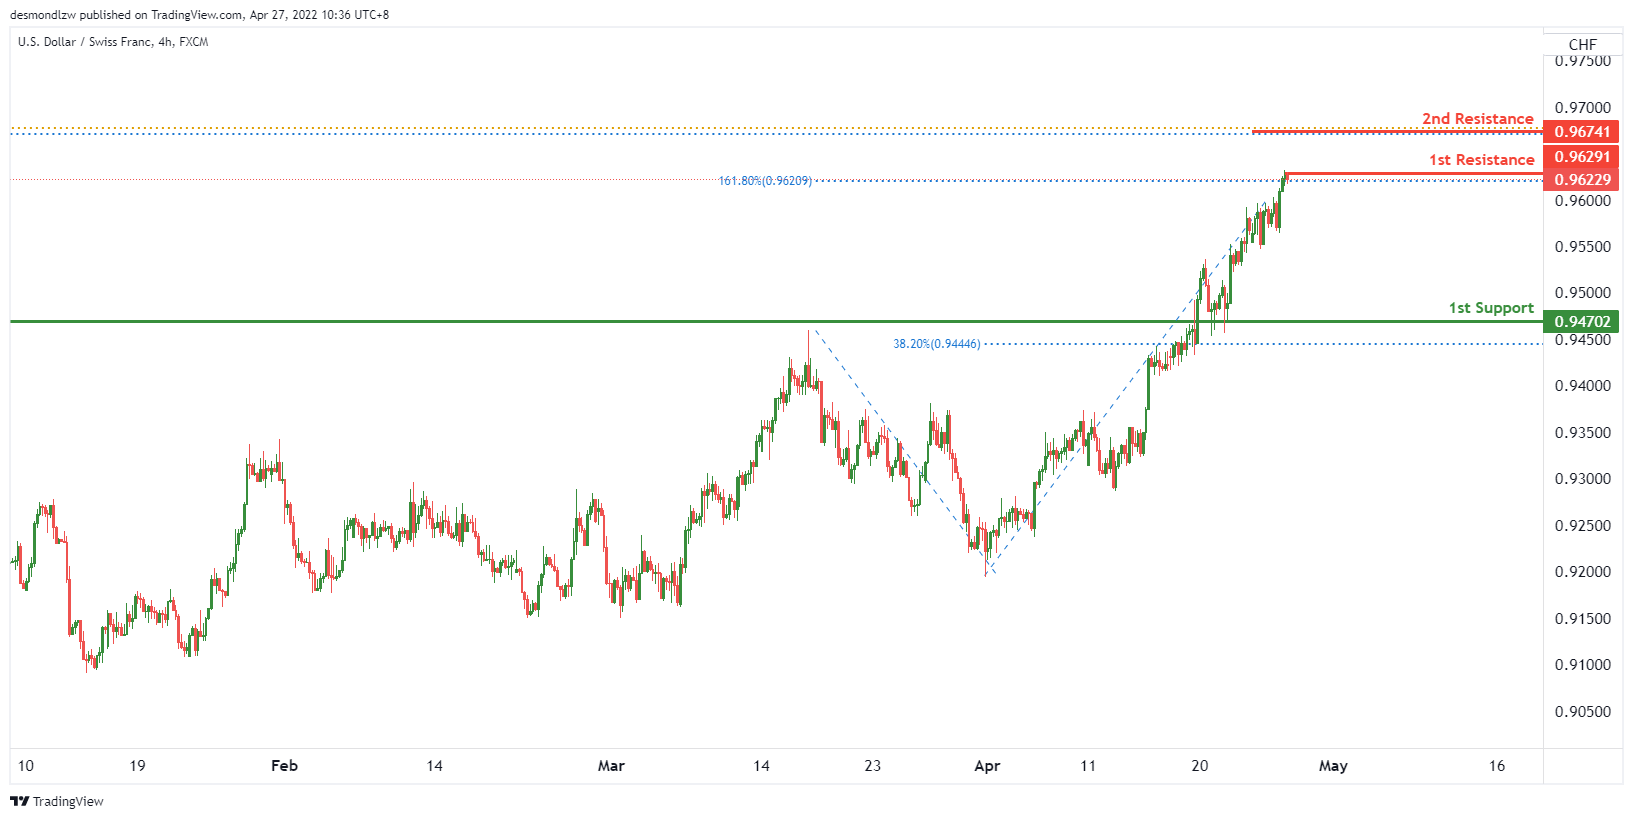
On the H4, price is near to the key resistance level. We expect that price will potentially reverse from 1st resistance level of 0.96291 in line with 161.8% fibonacci extension towards the 1st support level of 0.94702 in line with 38.2% fibonacci retracement.
Areas of consideration
- 1st support level at 0.94702
- 1st resistance level at 0.96291
- 2nd resistance level at 0.96741
EUR/USD :
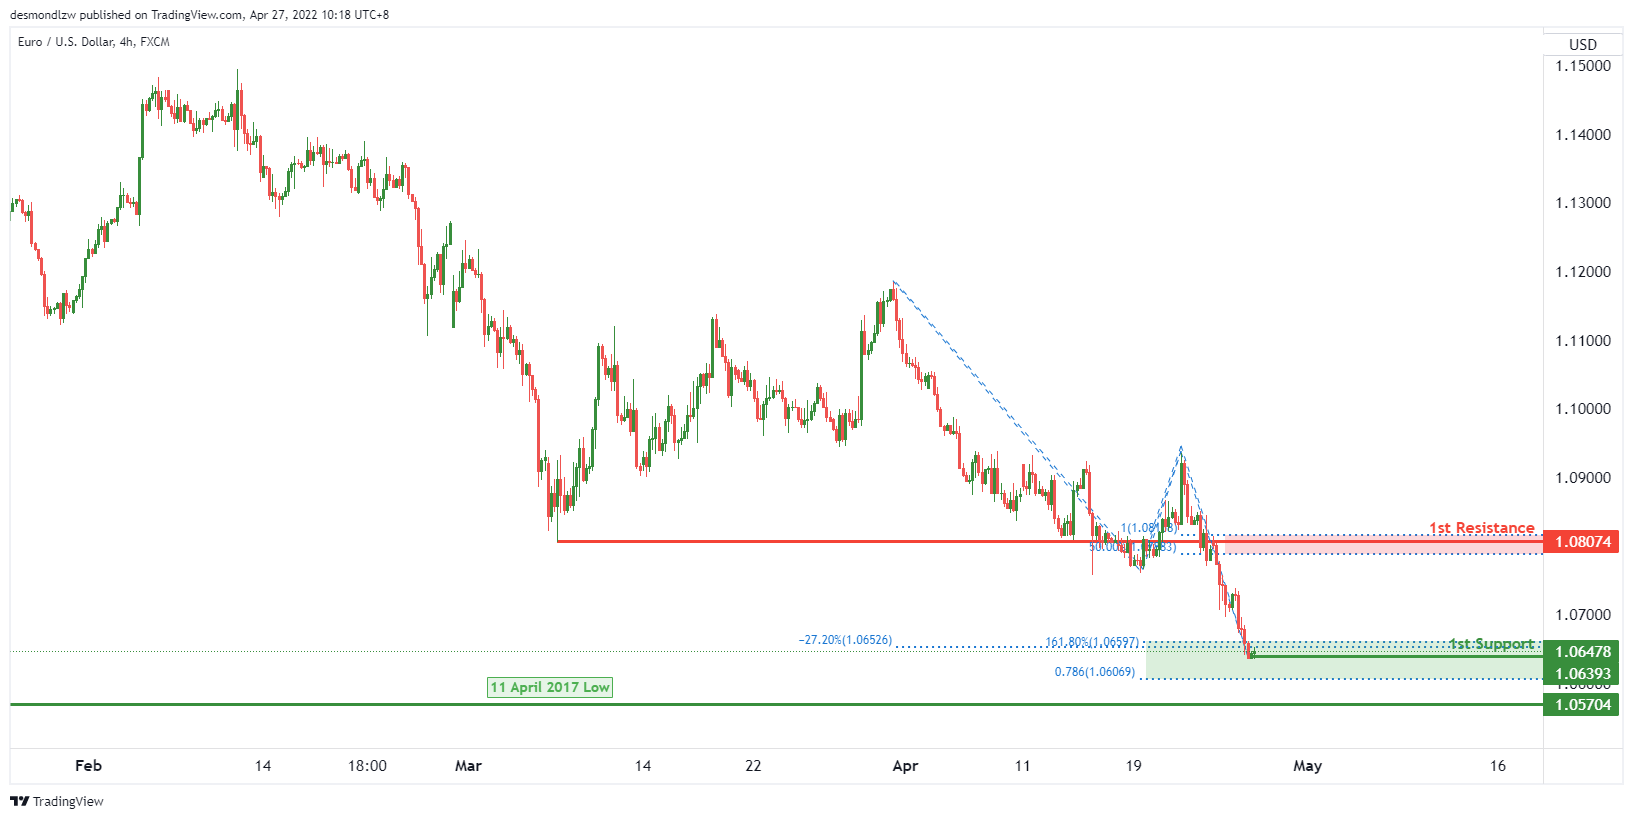
On the H4, price is near the pivot level. We expect price to potentially rise from 1st support level of 1.06393 in line with 78.6% fibonacci retracement, -27.2% fibonacci expansion and 161.8% fibonacci extension towards the 1st resistance level of 1.08074 in line with 50% fibonacci retracement and 100% fibonacci projection.
Areas of consideration :
- H4 1st resistance at 1.08074
- H4 1st support at 1.06393
- H4 2nd support at 1.05704
USD/JPY:
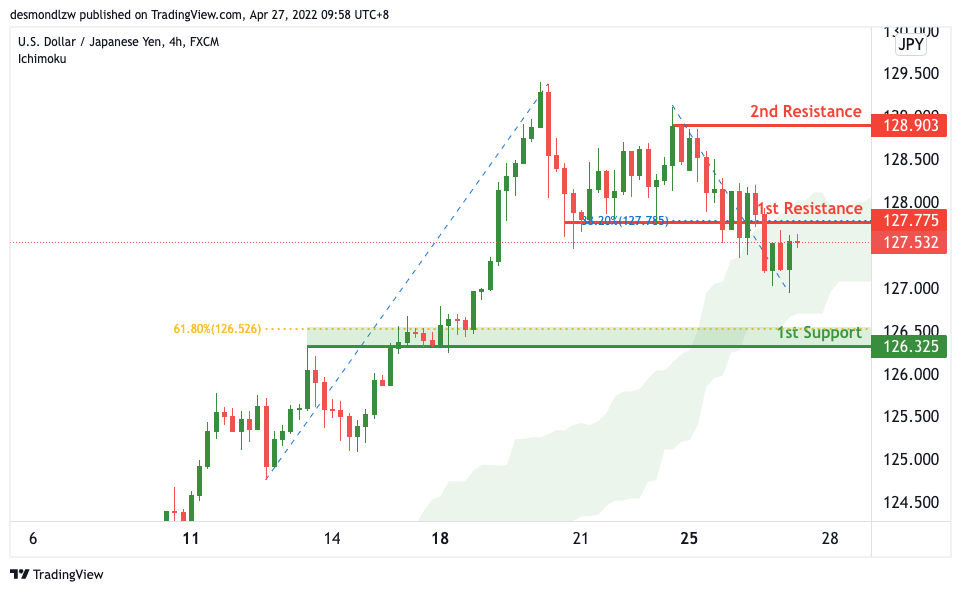
On the H4, with price moving below the ichimoku cloud indicator, we have a bearish bias that price will drop from our 1st resistance at 127.775 where the 38.2% Fibonacci retracement is to our 1st support at 126.325 in line with the horizontal pullback support and 61.8% Fibonacci retracement. Alternatively, price may break 1st resistance structure and head for 2nd resistance where the horizontal swing high resistance is at 108.903.
Areas of consideration:
- H4 time frame, 1st resistance at 128.331
- H4 time frame, 1st support at 127.667
AUD/USD:
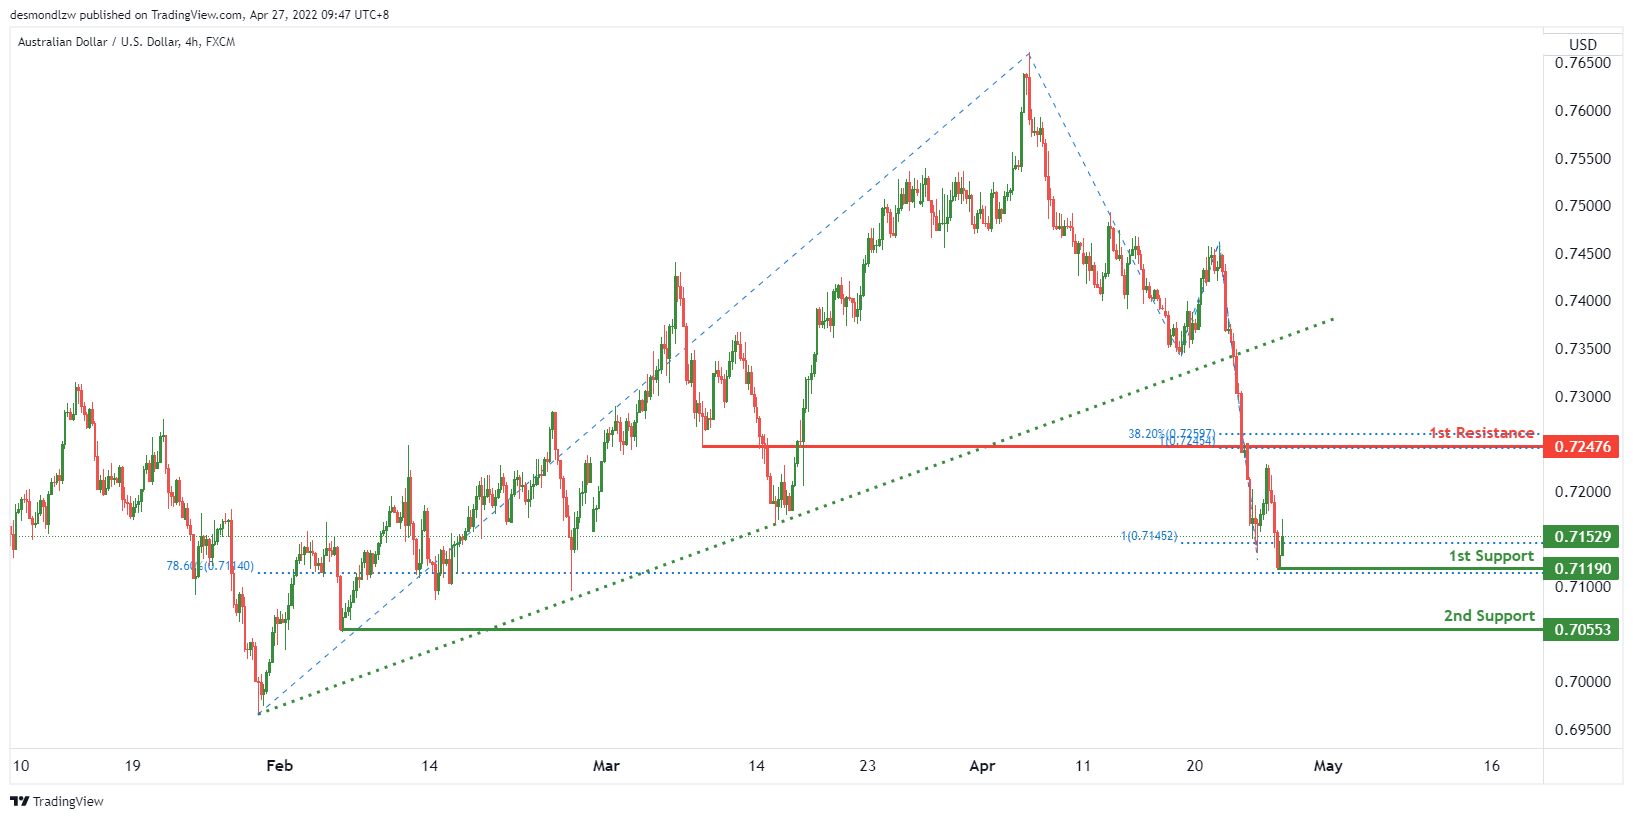
On the H4 timeframe, price is near the key support level, We see the potential of a bullish rise from 1st support level of 0.71190 in line with 78.6% fibonacci retracement and 100% fibonacci projection towards the 1st resistance level of 0.72476 in line with 38.2% fibonacci retracement and 100% fibonacci projection. Otherwise, price might break the key support level to trigger a dip towards the 2nd support of 0.70553 which is in line a previous horizontal swing low support.
Areas of consideration
- H4 1st resistance at 0.72476
- H4 1st support at 0.71190
- H4 2nd support at 0.70553
NZD/USD:
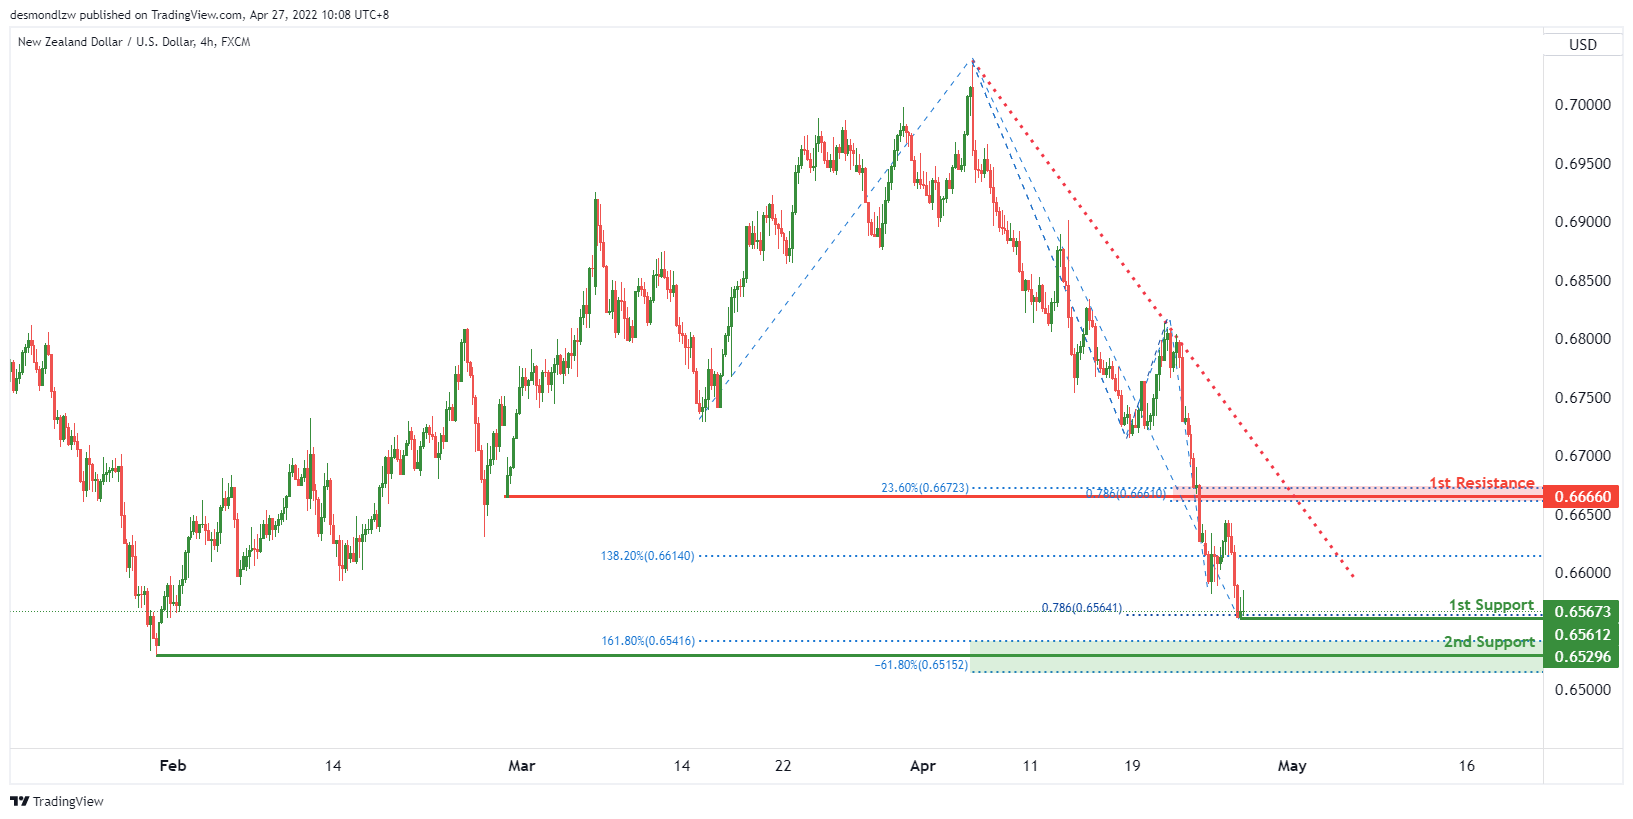
On the H4, we see the potential of bullish bounce from 1st support level of 0.65612 in line up with 78.6% fibonacci projection towards the 1st resistance level of 0.66660 in line with 23.6% fibonacci retracement and 78.6% fibonacci projection.
Areas of consideration:
- H4 time frame, 1st support at 0.65612
- H4 time frame, 1st resistance at 0.66660
- H4 time frame, 2nd support at 0.65296
USD/CAD:
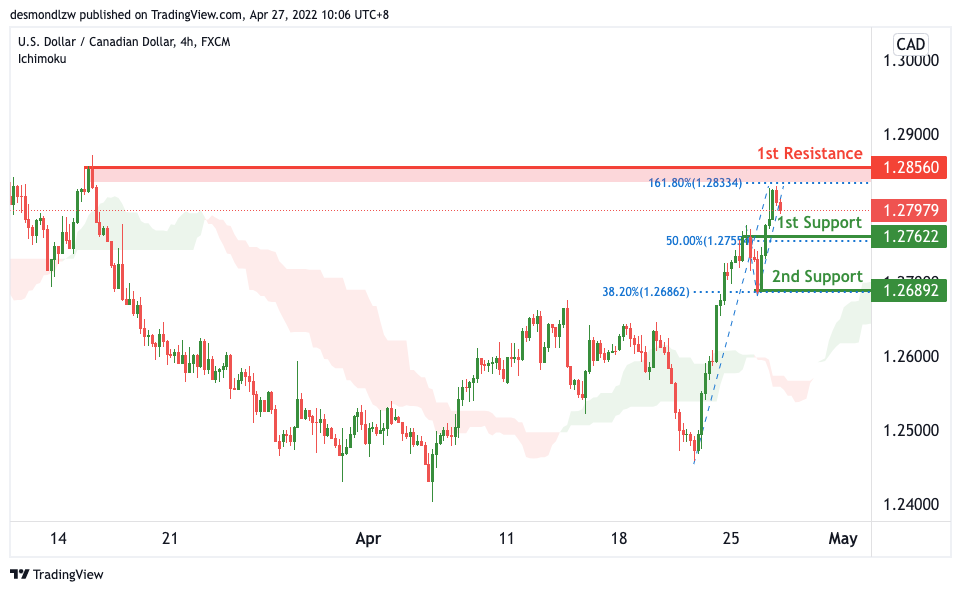
On the H4, with price moving above the ichimoku cloud, we have a bullish bias that price will rise to our 1st resistance at 1.28560 where the swing high resistance and 161.8% Fibonacci extension is from our 1st support at 1.27622 in line with the horizontal pullback support and 50% Fibonacci retracement. Alternatively, price may break 1st support structure and head for 2nd support where the horizontal swing low support and 38.2% Fibonacci retracement is.
Areas of consideration:
- H4 time frame, 1st resistance at 1.28560
- H4 time frame, 1st support at 1.27622
OIL:
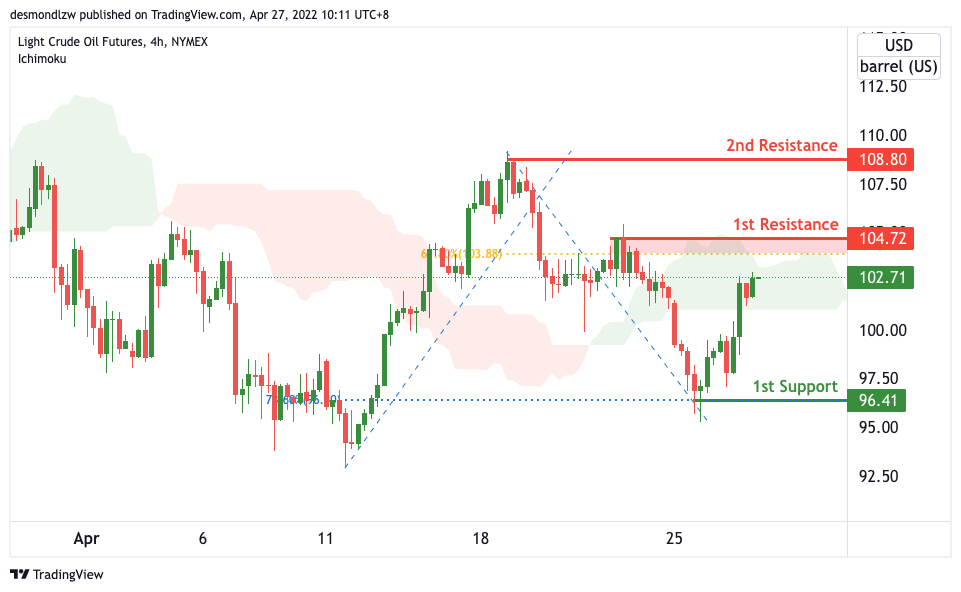
On the H4, with price expected to reverse off the resistance of the ichimoku cloud, we have a bearish bias that price will drop from our 1st resistance at 104.72 where the swing high resistance and 61.8% Fibonacci retracement is to our 1st support at 96.41 in line with the horizontal swing low support and 78.6% Fibonacci retracement. Alternatively, price may break 1st resistance structure and head for 2nd resistance where the horizontal swing high resistance at 108.80.
Areas of consideration:
- H4 time frame, 1st resistance of 104.72
- H4 time frame, 1st support of 96.41
Dow Jones Industrial Average:
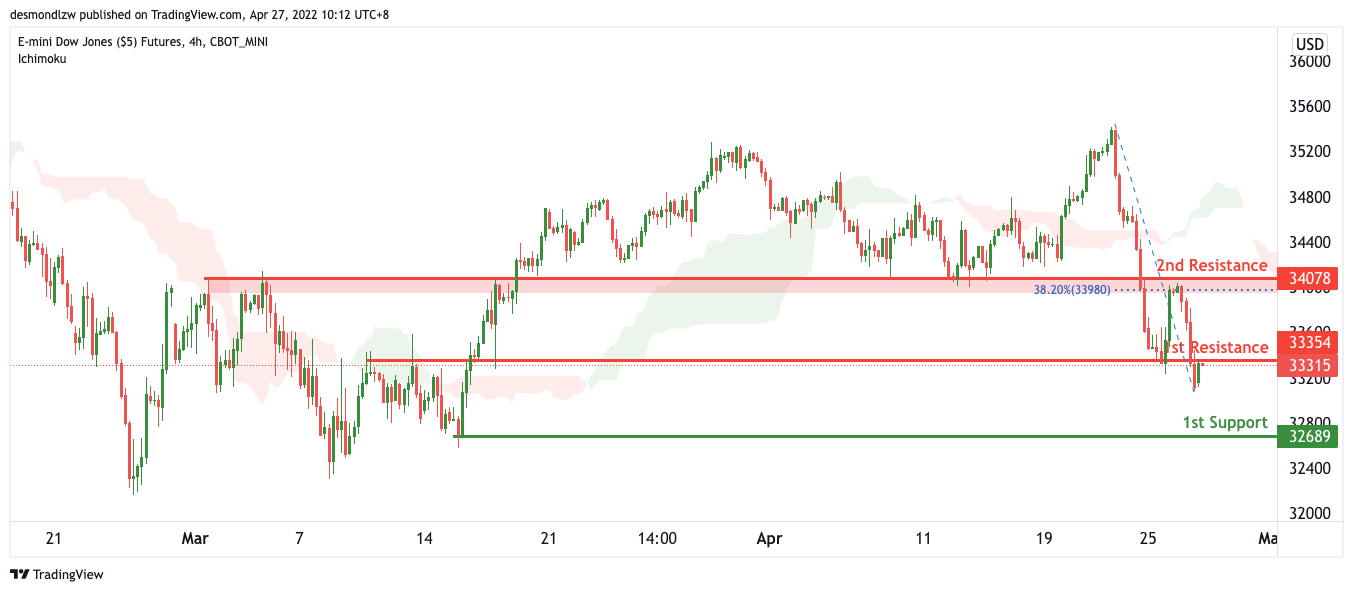
On the H4, with price moving below the ichimoku cloud, we have a bearish bias that price will drop from our 1st resistance at 33354 where the horizontal overlap resistance is to our 1st support at 32689 in line with the horizontal swing low support. Alternatively, price may break 1st resistance structure and head for 2nd resistance where the horizontal overlap resistance and 38.2% Fibonacci retracement is at 34078.
Areas of consideration :
- H4 time frame, 1st resistance at 33354
- H4 time frame, 1st support at 32689
Aust Q1 CPI – Inflationary Pressures Broad Based
Headline CPI 2.1%qtr/5.1%yr; trimmed mean 1.4%qtr/3.7%yr, weighted median 1.0%qtr/3.0%yr. The 1.4% rise in core inflation captures the broad nature of the inflationary pulse with more than 60% of the components in the CPI now running at a greater than 2.5%yr pace.
Inflation came in 2.1%, well above the market forecast of 1.7% even exceeding Westpac’s top of the range forecast of 2.0%. This was the largest quarterly rise in the CPI since the introduction of the GST. At two decimal places it was 2.14 so rounded up or softer 2.1%.
The annual pace lifted from 3.5% to 5.1% the fastest pace of annual inflation since the introduction of the GST in 2000 and significantly faster than the June 2021 print of 3.8% which was a twelve year high. While the unwinding of the HomeBuilder grants continues to be part of the story behind the boost in inflation it is the shortages of building supplies and labour, heightened freight costs and ongoing strong demand also contributed to price rises for newly built dwellings as well as a broader inflationary pulse.
This broad spread inflationary pulse was captured by 1.4% gain in the trimmed mean, both the market and Westpac were expecting 1.2%, which the ABS reports as the largest quarterly rise since the beginning of the series in 2002. If we compare to the RBA historical estimates of the trimmed mean it is the largest quarterly rise since the 1.8% print in December 1990. The 1.4% gain has lifted the annual pace of core inflation to 3.7%ry, the fastest pace since a 4.1%yr print in March 2009. The ABS reports the lift in core inflation “reflected the broad-based nature of price rises, as the impacts of supply disruptions, rising shipping costs and other global and domestic inflationary factors flowed through the economy."
This widespread nature of this inflationary pulse was further emphasised by the rise in the share of components of the CPI running faster than a 2.5%yr pace. The share lifted to 66% from 32% in March, the largest share of the CPI components running faster than 2.5%yr since December 2001 (post the introduction of GST).
At two decimal places the trimmed mean rose 1.37% so a hard 1.4%; for history the weighted median gained 1.0% for 3.2%yr.
The ABS reports that most significant price rises were for new dwelling purchase by owner-occupiers (5.7% vs 5.4% WBC), automotive fuel (11.0% vs 10.9% WBC) and tertiary education (6.3% vs. WBC 2.4%). Also worth noting were the strong gains in food (2.8% vs 2.1% WBC) along with the unseasonal rise in furniture & furnishings (1.1% vs -1.1% WBC) and communication (0.3% vs flat WBC)
The ABS provides more details on food noting that the increases reflected high transport, fertiliser, packaging and ingredient costs, as well as Covid-related disruptions and herd restocking due to favourable weather. Main contributors to the rise in food prices included vegetables (6.6% vs 8.7% WBC), waters, soft drinks & juices (5.6% vs 1.7% WBC), fruit (4.9% vs 3.9% WBC) and beef (7.6% vs 3.4% WBC).
Inflationary pressures in the food group was softened by voucher programs in Sydney and Melbourne, which reduced out of pocket costs for meals out & takeaway foods. The grocery component of the group, which excludes meals out and takeaway foods, rose 4.0%. Prices for other grocery items, such as non-durable household products which includes products such as toilet paper and paper towels, rose 6.7% in the March quarter.
The ABS reported that automotive fuel rose for the 7th consecutive quarter, resulting in the strongest annual rise since the Iraqi invasion of Kuwait in 1990. It was also a record level for auto fuel due to an oil price shock caused by the Russian invasion of Ukraine, paired with ongoing easing of Covid-19 restrictions strengthening global demand. The national quarterly average price for unleaded petrol was $1.83 per litre in the March quarter. The halving of the fuel excise in the recent budget will have will be a meaningful disinflationary force in the June quarter but this will be reversed when the excise is reinstated in the December quarter.
The ABS continues to report a two-speed rental market in Australia but as we expected Sydney and Melbourne shifted from negative to positive gains for rents. Rents across the remaining capital cities continue to record relatively stronger rises, reflecting historically low vacancy rates. The positive growth in rents for Sydney and Melbourne was mainly driven by rising rents for houses, while other dwellings recorded a relatively smaller rise in Sydney and a small fall in Melbourne. Rental conditions for other dwellings remained subdued in Melbourne reflecting higher vacancy rates. Rents for both houses and other dwellings increased at a similar rate in the remaining capital cities.
Non-discretionary annual inflation (6.6%yr) was higher than the CPI (5.1%yr) and more than twice the rate of discretionary inflation. (2.7%yr). Non-discretionary inflation includes goods and services that households are less likely to reduce their consumption of, such as food, automotive fuel, housing and health costs which have all experienced price rises through the year. In the quarter non-discretionary items 3% driven by housing, auto fuel and food.
We are processing this data and will review what implications it has for our CPI forecasts. But it is worth noting that the 5.1%yr pace in annual CPI inflation is already higher than our forecast peak of 4.9%yr. The 3.7%yr pace in core inflation (trimmed mean) is narrowing in on our forecast peak of 4.0%yr in the September quarter.
Gold Price Trims Gains, $1,890 Is The Key
Key Highlights
- Gold price started a fresh decline and traded below $1,920.
- It traded below a key bullish trend line with support near $1,955 on the 4-hours chart.
- EUR/USD extended decline below 1.0700, and GBP/USD traded below 1.2600.
- Crude oil price declined below $100 but found support near $95.50.
Gold Price Technical Analysis
Gold price struggled to stay above the $1,950 support against the US Dollar. The price started a fresh decline after it settled below $1,950 and $1,940.
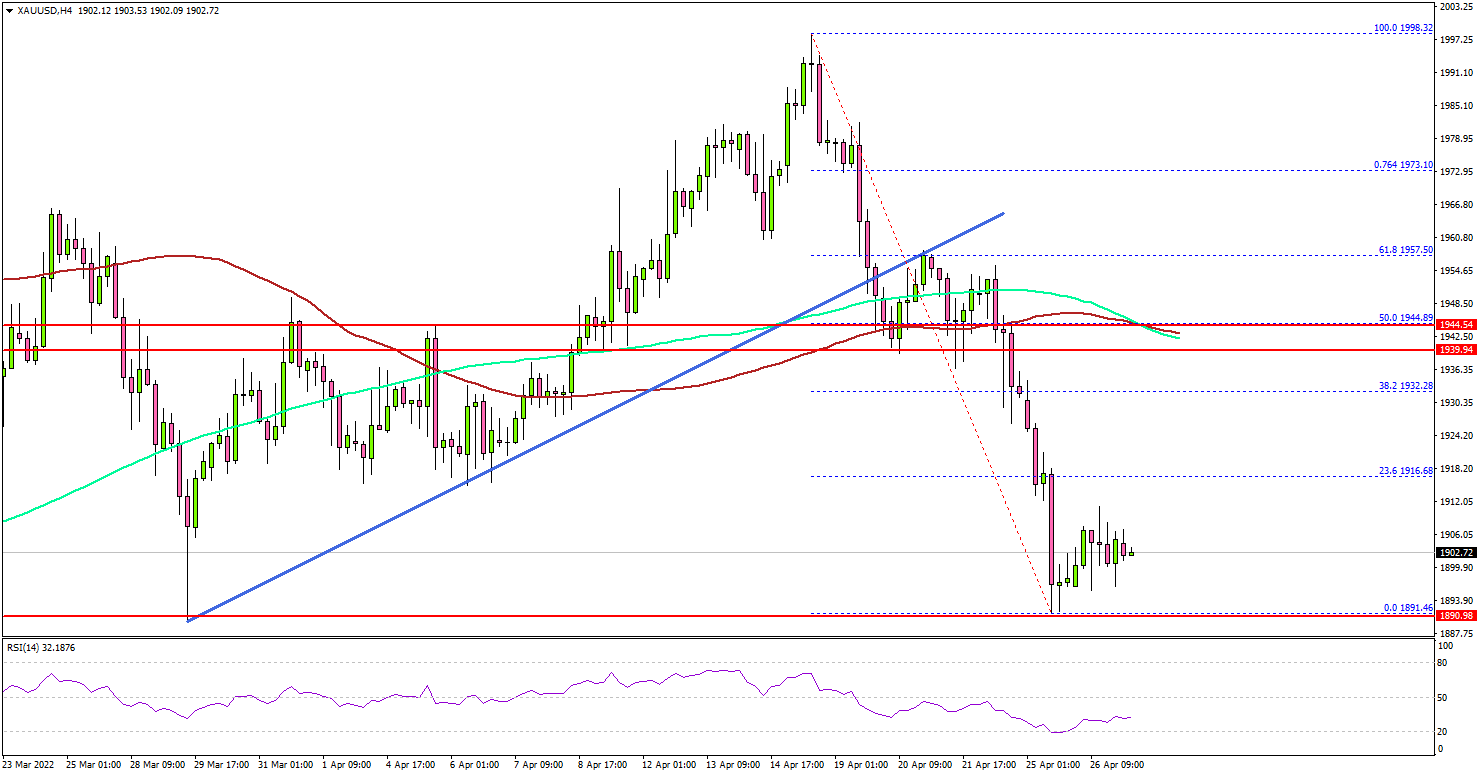
The 4-hours chart of XAU/USD indicates that the price traded below the $1,920 support zone. There was also a move below the $1,900 level, and the price settled below the 100 simple moving average (red, 4-hours) and the 200 simple moving average (green, 4-hours).
It retested the key $1,890 support area, where the bulls emerged. It is now consolidating losses above $1,890. On the upside, the price might face resistance near $1,915.
The next key resistance could be $1,920, above which the bulls might aim a move towards the main resistance at $1,945. The 100 simple moving average (red, 4-hours) and the 200 simple moving average (green, 4-hours) are also near the $1,945 zone to act as a resistance.
If there is no upward move, the price could decline below the $1,890 support. The next major support is near the $1,865 level, below which it could even test $1,850.
Looking at EUR/USD, the pair is still trading in a bearish zone and there was a move below the 1.0700 support. Similarly, GBP/USD resumed its decline below 1.2600.
Economic Releases to Watch Today
- Germany’s GfK Consumer Confidence for May 2022 – Forecast -16.0, versus -15.5 previous.
- US Pending Home Sales for March 2022 (YoY) - Forecast -1.7%, versus -4.1% previous.