Sample Category Title
Why Current Level is the Most Important for EURUSD
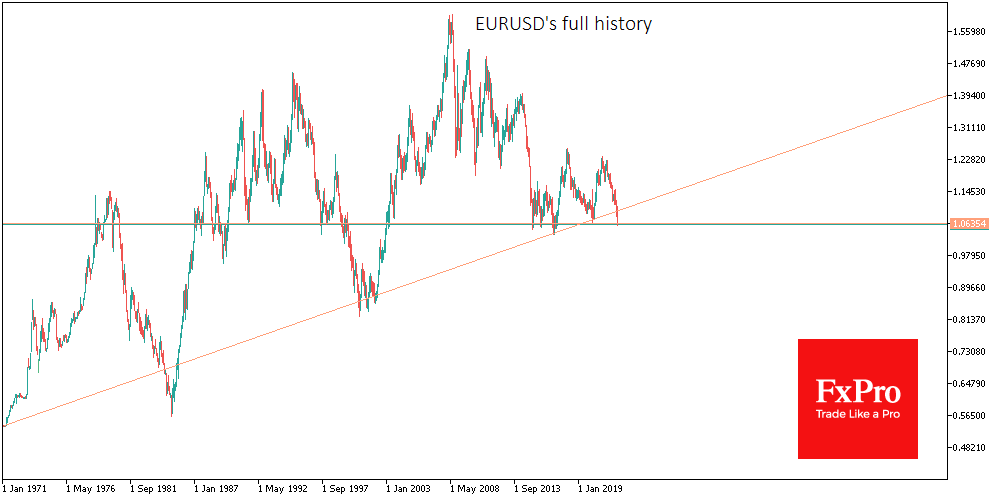
The single currency has fallen under 1.0590, below pandemic lows and at its lowest level since April 2017. The 1.0600 area for EURUSD has repeatedly worked as a turning point since 2015. In 1997 and 1998 the selloffs also stopped at this level. And in late 1999, a move below 1.06 after a prolonged consolidation was the start of a 20% failure in the pair.
Thus, the EURUSD has reached one of its most important historical milestones, even more important than the euro/dollar parity.
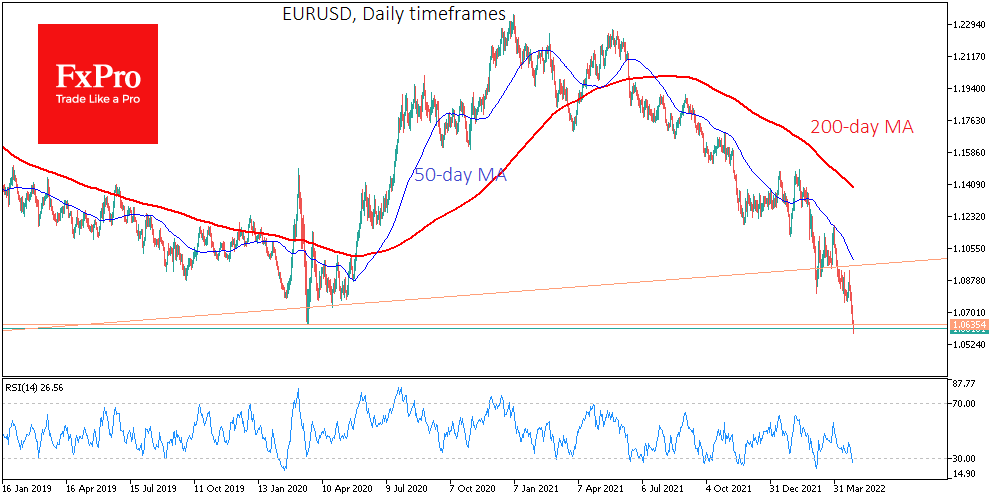
And there are now increasing signs that the next steps for EURUSD will be more of a repeat of 1999 than 2017 or 2020.
On the monthly charts, the EURUSD is consolidating below the ultra-long term uptrend line dating back to 1971, including passing near the lows of 2000-2002, 2016 and 2020. We could see a furious selloff in the single currency without a sharp rebound in the pair over the next couple of weeks.
On the sellers’ side, there is a sharply slipping economic mood. A new survey by Germany’s GfK noted the worst consumer sentiment in history, even worse than at the lowest point of the pandemic.
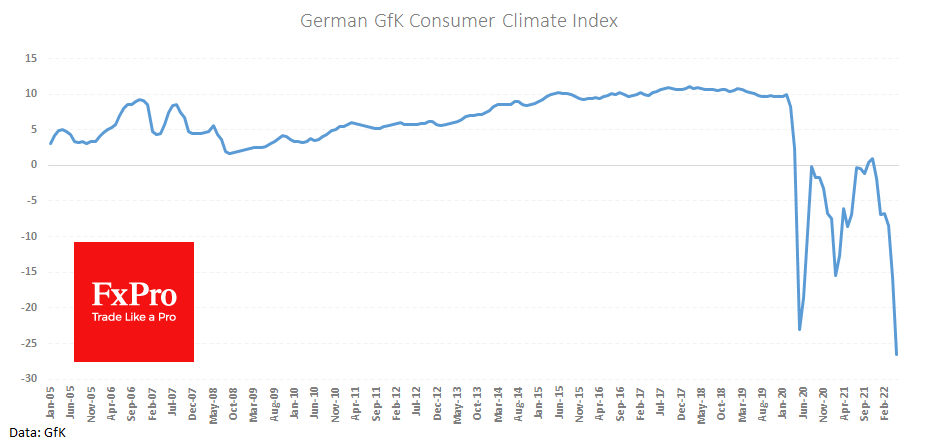
Consumers are reducing their income expectations and sharply increasing their propensity to save. This consumer sentiment works against economic recovery as it reduces consumer spending and hence corporate and government revenues.
Potentially for the debt-burdened Eurozone, this is a bad sign because the currency’s weakness leads to higher bond yields and makes debt service even more expensive. This is especially true for Greece and Italy, and several other countries.
Potentially, a fixation of EURUSD below 1.0600 could trigger a true Euro capitulation with potential targets at 0.9700 and a more distant target at 0.8500 in 2023.
Aussie Rebounds as CPI Jumps
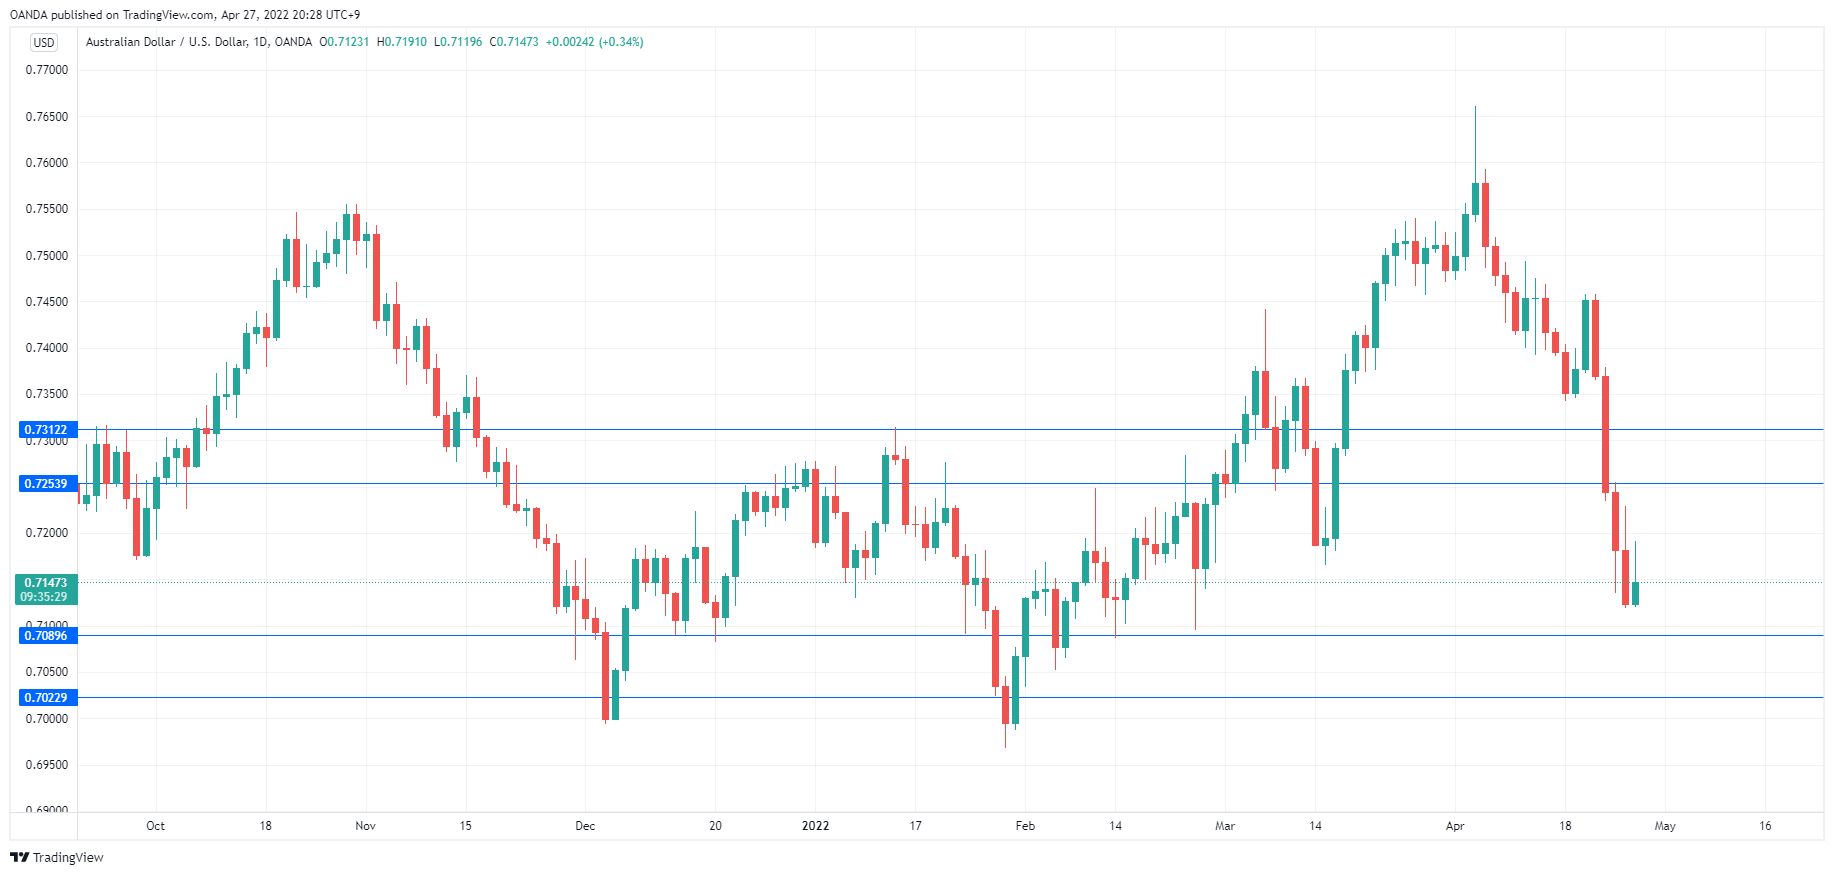
The Australian dollar has finally turned things around after a nasty four-day slide. AUD/USD as much has 330 points during that time but is currently trading at 0.7149, up 0.37% on the day.
CPI higher than expected
Australian inflation continues to accelerate, with CPI in Q1 rising to 5.1% YoY, after a Q4 release of 3.5%. This easily beat the consensus of 4.6%, and is the highest since the GFC back in 2008. Inflation has been widely distributed, as seen in Core CPI, which climbed 3.7% (2.6% prior), above the forecast of 3.4%.
With inflation showing no signs of easing, it is a no-brainer that the RBA will have to step in and deliver a series of rate hikes to curb inflation. What isn’t as clear is the timing of a lift-off rate increase. The RBA meets next week, but with a federal election at the end of May, the RBA would prefer to avoid any major moves until after the election. The problem is that the central bank is under strong pressure on two fronts to raise rates – there is the inflation issue as well as the aggressive rate hikes we are seeing from other major central banks.
The Federal Reserve, for example, is widely expected to raise rates by 0.50% next week and could follow up with more such hikes, as it struggles to contain spiralling inflation. This means that the RBA could press the trigger at next week’s meeting. Whether the RBA makes a move in May or waits until June, an oversize hike of 0.40% looks increasingly likely.
The strong inflation report appears to have cemented an imminent rate hike, which has given a much-needed boost to the Australian dollar. The Aussie is still trading close to 2-month lows, as a jump in risk apprehension as weighed on risk-sensitive currencies like the Aussie. China is experiencing sharp growth pains, exacerbated by the harsh zero-Covid policy which has dampened growth. This could disrupt supply chains and have an impact on the Australian economy.
AUD/USD Technical
- There is support at 0.7089 and 0.7023
- AUD/USD faces resistance at 0.7253 and 0.7312
USD/JPY Pair Formed a New Multi-Year High at 129.40
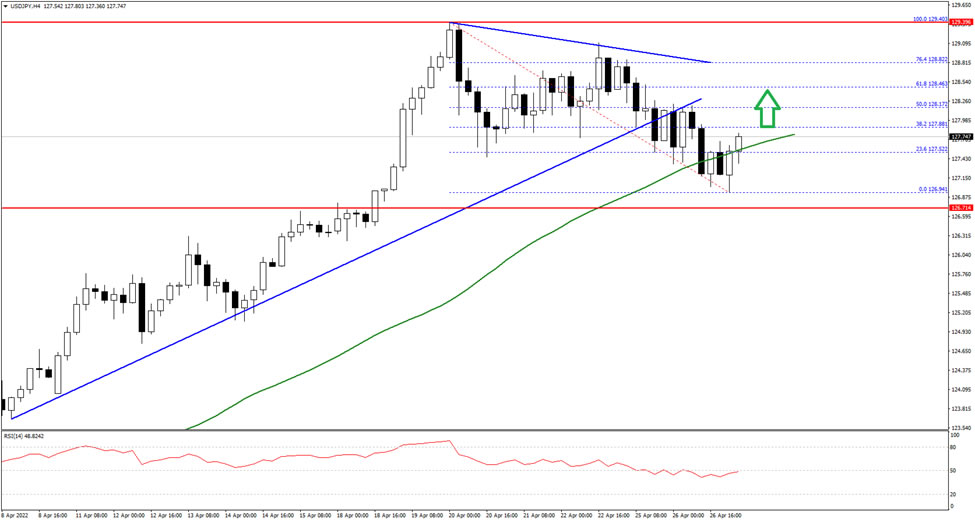
The US Dollar gained pace above the 128.00 resistance against the Japanese Yen. The USD/JPY pair even traded above 128.50 and formed a new multi-year high at 129.40.
Recently, there was a downside correction below 129.00. There was a break below a key bullish trend line with support near 128.15 on the hourly chart. However, the bulls were active near the 127.00 level. It is now back above 127.50 and the 50 hourly simple moving average.
On the upside, an immediate resistance is near the 128.20 level. A clear break above the 128.20 resistance could push the price towards 128.80. The next major resistance is near the 129.20 level or 129.40 on FXOpen.
On the downside, an initial support is 127.50. The next major support sits near the 127.00 level, below which there is a risk of more downsides. In the stated case, the pair could decline towards the 126.20 level.
US Dollar Soars on Risk-Aversion
US dollar rises as investors seek safety
The US dollar soared overnight as risk aversion swept financial markets, with the euro having a particularly painful session as Russian risks accelerated. The dollar index smashed through 102.00 on its way to a 0.56% gain to 102.30, where it remains in Asia today. At these levels, the dollar index is potentially testing the upper boundary of a 5-year triangle. A weekly close above 103.00 resistance this week will have me pondering making a call for the 120.00 region in the months ahead. In the short-term, support lies at 101.00 followed by 99.75.
EUR/USD had a torrid session as the Russia energy risks started coming true. EUR/USD fell by 0.70% to 1.0635, before booking a tiny gain back to 1.0645 in Asia. The 1985 support line is now well and truly broken and a move back below parity in the coming months is suggested. Widening Russian energy weaponisation will hasten that outlook. In the near-term, the technical picture, potential energy sanctions on Russia, and a widening US/Europe interest rate differential, suggest EUR/USD will now test support at 1.0600 en route to 1.0300. Resistance is at 1.0760 and 1.0810.
GBP/USD fell through 1.2700 and 1.2760 overnight, on its way to a 1.30% loss to 1.2575, where it remains in Asia. Sterling is guilty by association with the euro, with Brexit nerves around Northern Ireland, a too dovish Bank of England, and a soaring cost of living all weighing on the currency. That said, the relative strength index (RSI) is now at extreme oversold levels, meaning some sharp relief rallies are now possible. The technical picture is now signalling further losses to 1.2200 and potentially sub-1.2000 in the weeks ahead. GBP/USD would need to reclaim 1.3050 to change the bearish outlook.
Falling US yields and perhaps some haven flows into yen itself eased the upward pressure once again on USD/JPY overnight. USD/JPY fell 0.70% to 127.25 overnight, drifting to 127.65 in Asia. USD/JPY risks remain heavily skewed higher, thanks to a hawkish Fed. Support remains at 127.00 and 126.00, with resistance at 129.50 and 130.00.
AUD/USD reclaimed most of its overnight losses today after higher than expected inflation data increased the pressure on the RBA to start tightening policy sooner. AUD/USD has rallied by 0.66% to 0.7170 today, having closed below support at 0.7150 overnight. AUD/USD could spend the next few sessions consolidating between 0.7150 and 0.7250 but remains vulnerable to another US equity or Russia/China risk-aversion move. NZD/USD slumped another 0.90% to 0.6370 overnight and ominously, has not coat-tailed the AUD higher today. Short-term rallies back to 0.6700 are possible, but it remains on track to test 0.6525 and potentially, 0.6400 this week.
USD/CNH and USD/CNY traded sideways overnight and are almost unchanged at 6.5850 and 6.5540 today. The PBOC set another neutral USD/CNY fixing this morning, possibly signalling that the yuan selloff has gone far enough for now. Additionally, stronger Industrial Profits data and a quiet Covid-zero news ticker today appear to be lending the yuan temporary support. The plethora of China risks are now complicated by Russia’s energy militancy, and thus USD/Yuan risk remains heavily weighted to the upside, even if some short-term pullbacks are possible thanks to very overbought short-term technicals.
USD/KRW and USD/THB rose sharply overnight, but some stability in the yuan, and lower US yields, are allowing Asia currencies to pause for breath today. Whether the relief is temporary or not is up for conjecture. A Russia-derived spike in energy prices again will certainly increase downward pressure on regional currencies. USD/MYR finally steadied and USD/INR mysteriously unwound yesterday’s palm-oil-ban gains. Like the Philippines, it appears that Bank Indonesia is back capping US dollar gains, as is the Bank of Korea apparently.
GBP/USD Outlook: Cable Continues to Trend Lower as Geopolitical Tensions Rise
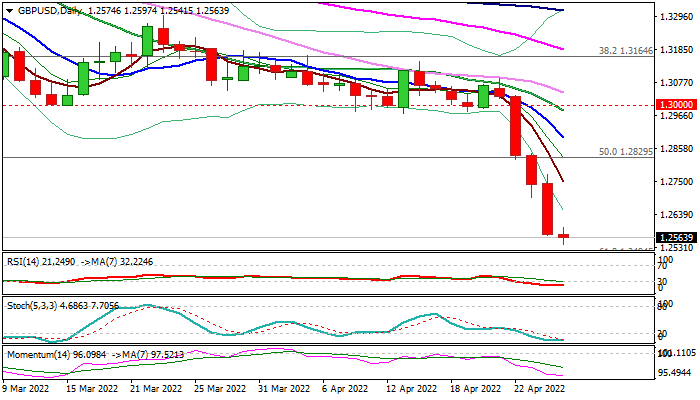
Steep fall extends into fifth straight day, with the pair falling nearly 4% in past as sterling remains under increased pressure from risk aversion and growing geopolitical tensions, while negative economic data warn that the UK economy is likely to slow significantly this year.
Fresh extension lower, following Tuesday’s 1.3% drop, establishes below 1.2600 handle, trading at the lowest levels in 21 month.
Bears eye key Fibo support at 1.2494 (61.8% of 1.1409/1.4249) where bids may emerge as 4-hr and daily studies are oversold.
Limited upticks should stay below falling daily Tenkan-sen 1.2815, to offer better selling opportunities, as negative sentiment is likely to persist and keep the pound in red for prolonged period, due to escalating situation with economic and political impact from the war in Ukraine.
Res: 1.2597; 1.2653; 1.2697; 1.2748.
Sup: 1.2541; 1.2494; 1.2400; 1.2359.
Bitcoin’s Last Hope for $38K
Bitcoin has lost 5.3% in the past 24 hours, falling to $38.4K. Ethereum is down 5.4% to $2845 in the same time frame. In the top 10 altcoins, losses range from 3.6% (BNB) to 12.7% (Dogecoin).
Total crypto market capitalisation, according to CoinMarketCap, fell 5.1% overnight to $1.77 trillion. Bitcoin’s dominance index fell to 41.2%.
By Wednesday, the Cryptocurrency Fear and Greed Index fell 6 points to 21 and moved back to “extreme fear”.
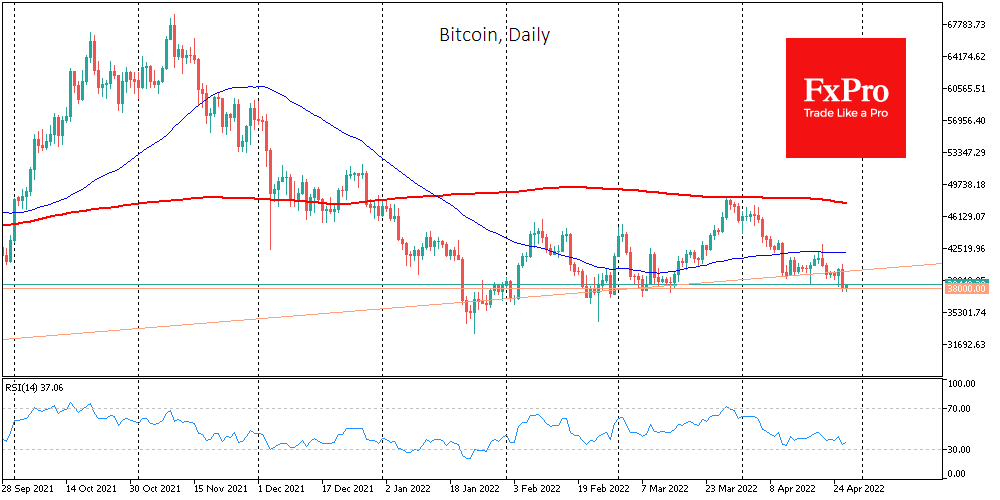
Bitcoin collapsed with acceleration to the stock market on Tuesday, falling the most in 15 days. Near the $38K level, the first cryptocurrency fumbled for buyer demand. Around these levels in February and early March, buyers were already breaking the downtrend, but the upside momentum proved unsustainable.
On the balance sheet, we have contradictory short-term signals. The BTCUSD has abruptly fallen below a critical support line, a bearish signal. At the same time, the uptrend breakdown failed to be confirmed by buying near previous local lows. We can describe it as Bitcoin fell out of the window but latched onto the windowsill.
Equally contradictory was the news backdrop.
According to CoinShares, institutional investors continue to withdraw capital from crypto funds from the downside. The net outflow of funds last week was $7.2 million, although it was down from the previous two weeks when investors withdrew more than $231 million.
In addition, regulatory pressure continues unabated, as ECB spokesman Fabio Panetta called the cryptocurrency industry the “Wild West” and called for stricter regulation.
Meanwhile, bitcoin steps further in recognition of a long-term investment vehicle. Fidelity Investments, one of the largest asset management firms, will make it possible to add bitcoin to its retirement portfolios.
In addition, the sustainability of mining has improved. The Bitcoin Mining Council (BMC) stated that mining efficiency increased by 63% in the last quarter thanks to the widespread adoption of sustainable energy and modern techniques.
As a result of the controversial picture, investors refrain from active action. According to Kaiko, trading volume on cryptocurrency exchanges has fallen to its lowest level since the summer of 2021. Glassnode believes that bitcoin’s fundamental metrics have improved in recent months.
NZDUSD Weighs on Key Support Base as Sellers Step Up
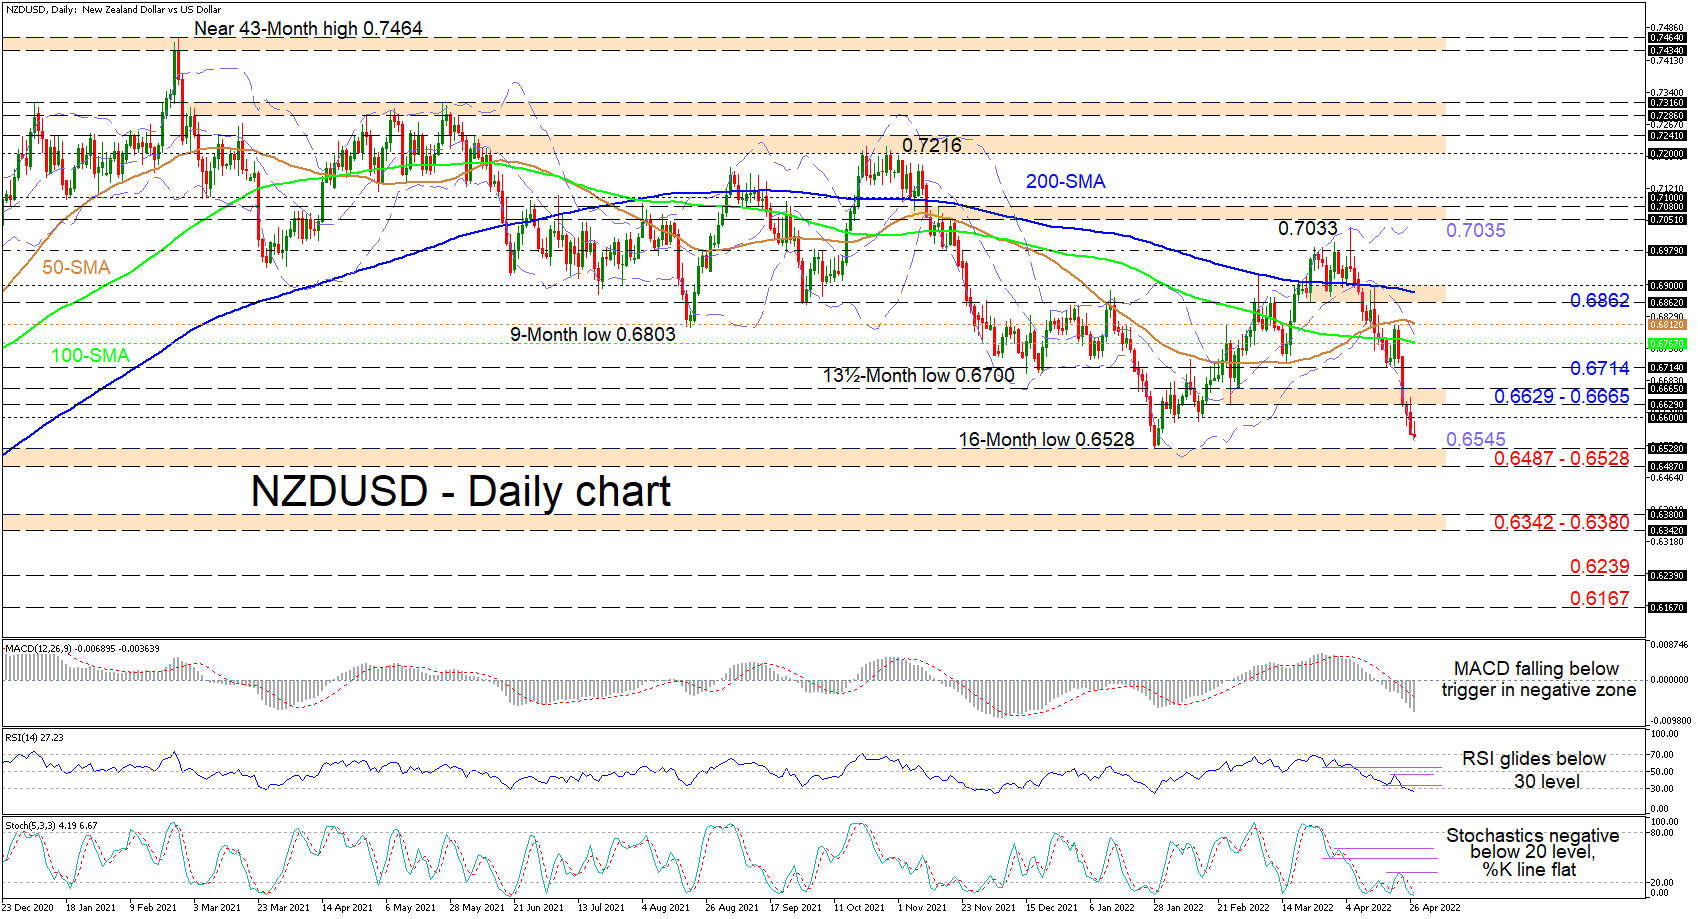
NZDUSD is tracing the lower Bollinger band and is just shy of retesting the 16-month low of 0.6528, which is the upper border of the critical 0.6487-0.6528 foundation, moulded by the troughs over the mid-July until end of September 2020 period. The rolling over of the 50-day simple moving average (SMA) is hinting that downward pressures are strengthening, while the longer-term 100- and 200-day SMAs continue to sponsor a bearish trend.
Presently, the short-term oscillators are skewed to the downside, reflecting that sellers are in command. The MACD, south of its zero threshold, is suggesting that negative momentum is strengthening, while the RSI has slid into oversold territory. Meanwhile, the stochastic oscillator, which is in the oversold region, is signalling that buyers are pushing back but have yet to overpower the prevailing negative tone in the pair.
In the negative scenario, downside limitations could commence from the lower Bollinger band at 0.6545 prior to the 0.6487-0.6528 tough boundary. Downside risks are likely to increase in the event that sellers defeat this crucial base, which may then result in the bears aiming for the 0.6342-0.6380 support barricade that stretches back to early March 2020. Diving below the latter obstacle, which includes the lows from the second half of June 2020, the pair could then steer for the 0.6239 mark before the door opens for a test of the 0.6239 support border.
Otherwise, if buyers retake control and drive the price over the 0.6600 handle, nearby resistance could transpire from the 0.6629-0.6665 zone (previous support-now-resistance). If buying interest strengthens further, the 0.6714 inside swing low may try to delay buyers from taking a crack at the resistance section existing between the 100- and 50-day SMAs at 0.6767 and 0.6812 respectively. Successfully conquering these averages, the pair could then challenge the 0.6862-0.6900 resistance section, which encapsulates the 200-day SMA as well.
Summarizing, NZDUSD is exhibiting a neutral-to-bearish bias below the 0.6714 low and the SMAs. A break below 0.6487-0.6528 could bolster the downward trajectory, while a climb in the price north of the 0.7033 high may reinforce belief in a positive outlook.
King Dollar Strength Accelerates Amid Multiple Risks
American stocks declined sharply on Tuesday as volatility in the financial market continued. The Dow Jones slipped by more than 400 points while the tech-heavy Nasdaq 100 index fell by 330 points. Investors have been worried about the ongoing lockdowns in China and the thinning margins by most industrial companies. On Tuesday, General Electric said that it expects that its adjusted free cash flow will be negative in the second quarter. Its stock crashed by more than 12% after the news. On the other hand, technology giants like Microsoft and Alphabet reported strong quarterly results. Tesla shares fell by more than 10% after Elon Musk’s decision to acquire Twitter.
The US dollar rose as global risks and the fear and greed index slipped to the fear level. Data published by Conference Board showed that consumer confidence declined from 107.6 to 107.3. This decline was worse than the median estimate of 108. Further data revealed that new home sales declined from 835k in February to 763k in March. Again, this drop was worse than the expected 765k. Meanwhile, the house price index rose from 1.6% to 2.1%. Durable goods orders rose by 0.8%. Still, these numbers will not change the Fed’s decision to be more hawkish.
The price of crude oil rose after Germany unveiled its plan to end its dependence on Russian oil. In a statement, the country’s economy minister said that it could end this dependence within days, after saying that it would take till the end of the year. In the statement, he said that the country now imports about 12% of oil from Russia, down from 35% since February. There was also optimism in China as government officials started ending the lockdown that has been going on in Shanghai. The EIA will publish the latest inventories data. After falling by over 8 million in the previous week, analysts expect that inventories rose to over 2.16 million barrels.
XBRUSD
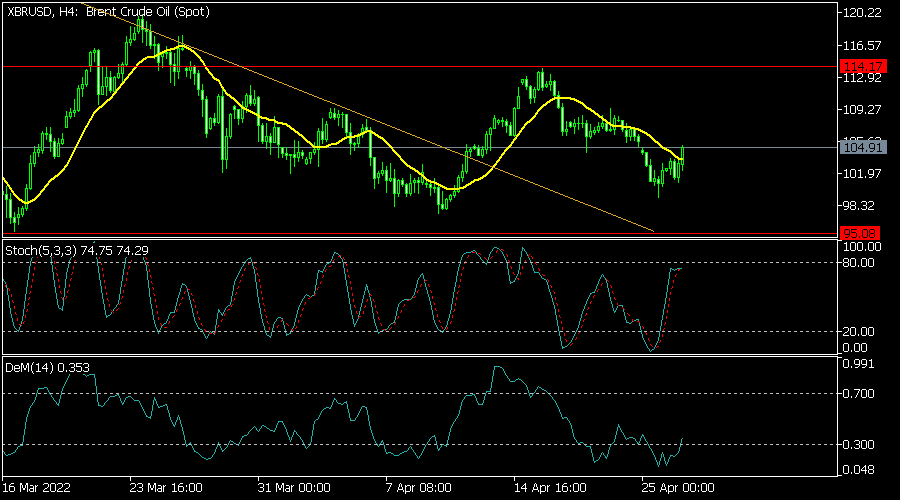
The XBRUSD pair rose to a high of 104.97 in the overnight session. It rose above the 25-day moving average while the Stochastic oscillator is approaching the overbought level. The DeMarker indicator has moved above the oversold level. It is also between the important support and resistance levels at 95.03 and 114.17. Therefore, there is a possibility that the pair will resume the downward trend ahead of the latest EIA data.
EURJPY
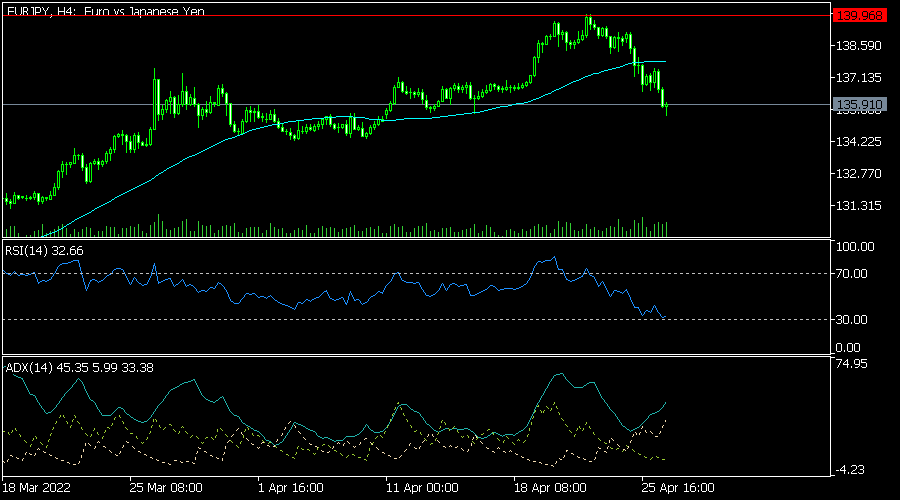
The EURJPY pair declined sharply as investors predicted that the Bank of Japan will start tightening. It is trading at 135.86, which is below this month’s high of 140. On the four-hour chart, it has moved below the 25-day and 50-day moving averages while the Relative Strength Index (RSI) has continued its downward trend. The Average Directional Movement index has moved above 47. Therefore, the pair will likely keep falling.
EURUSD
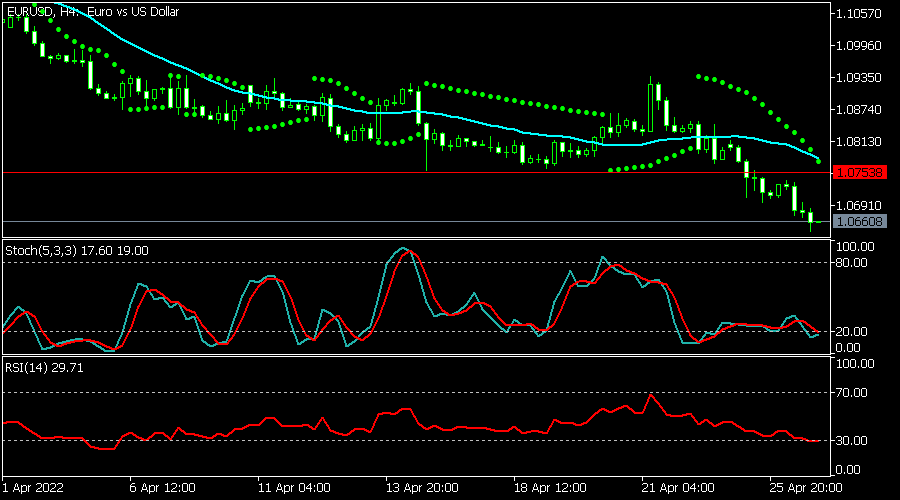
The EURUSD pair dropped sharply as the US dollar index continued rising. The pair is trading at 1.0660, which is below the important resistance level at 1.0753. It has moved below the dots of the Parabolic SAR indicator. Also, the pair is below the 25-day moving average while oscillators have kept falling. Therefore, the pair will likely keep falling.
GBP/CAD extending down trend towards 2016 low
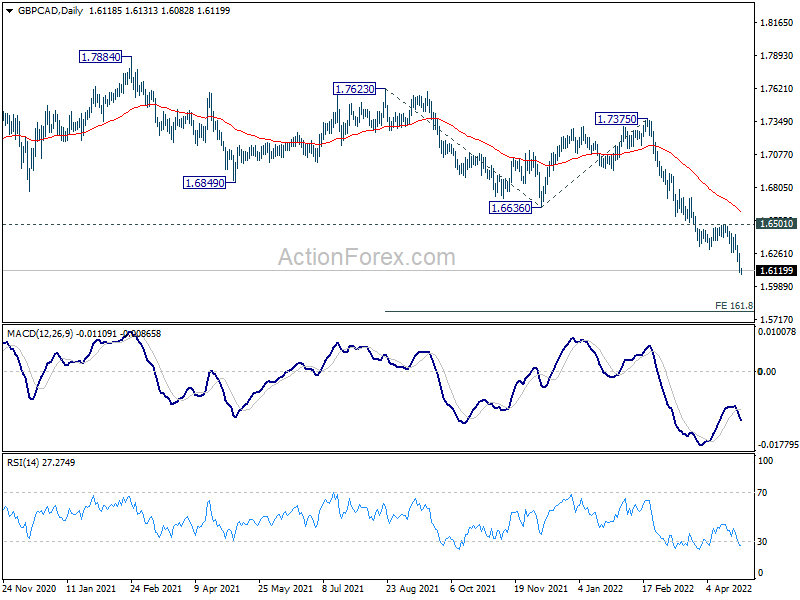
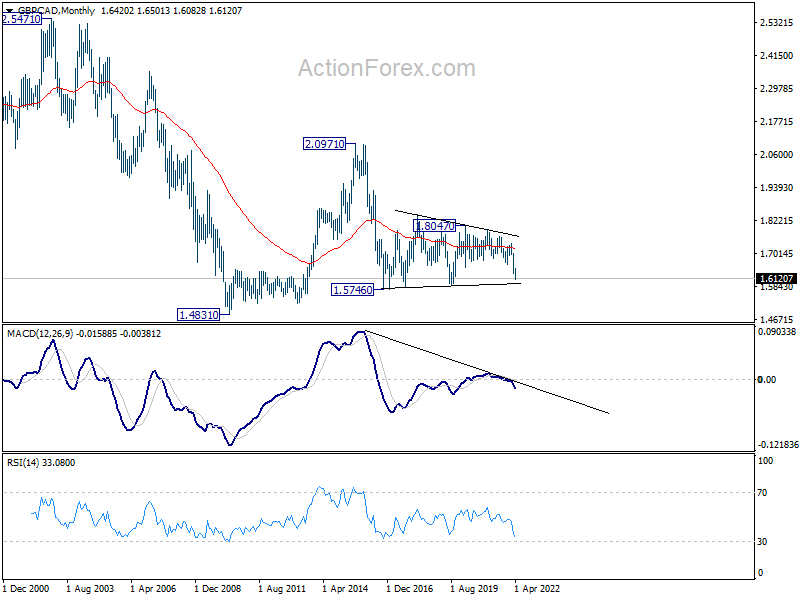
GBP/CAD's down trend continues this week on broad based selloff in Sterling, while Canadian Dollar has been relatively resilient. Current decline should target 161.8% projection of 1.7623 to 1.6636 from 1.7375 at 1.5778. This lies inside key long term support zone between 1.5746 (2016 low) and 1.5875 (2019 low).
The question is whether such 1.5746/5875 support zone would hold. If not, that would firstly mark the resume of the down trend from 2.0971 (2015 high). More importantly, that would also raise the chance of resumption of down trend from 2.5471 (2002 high) through 1.4831 (2010 low).
USDJPY Appears to Gain Some Steam; Back Near 128.00
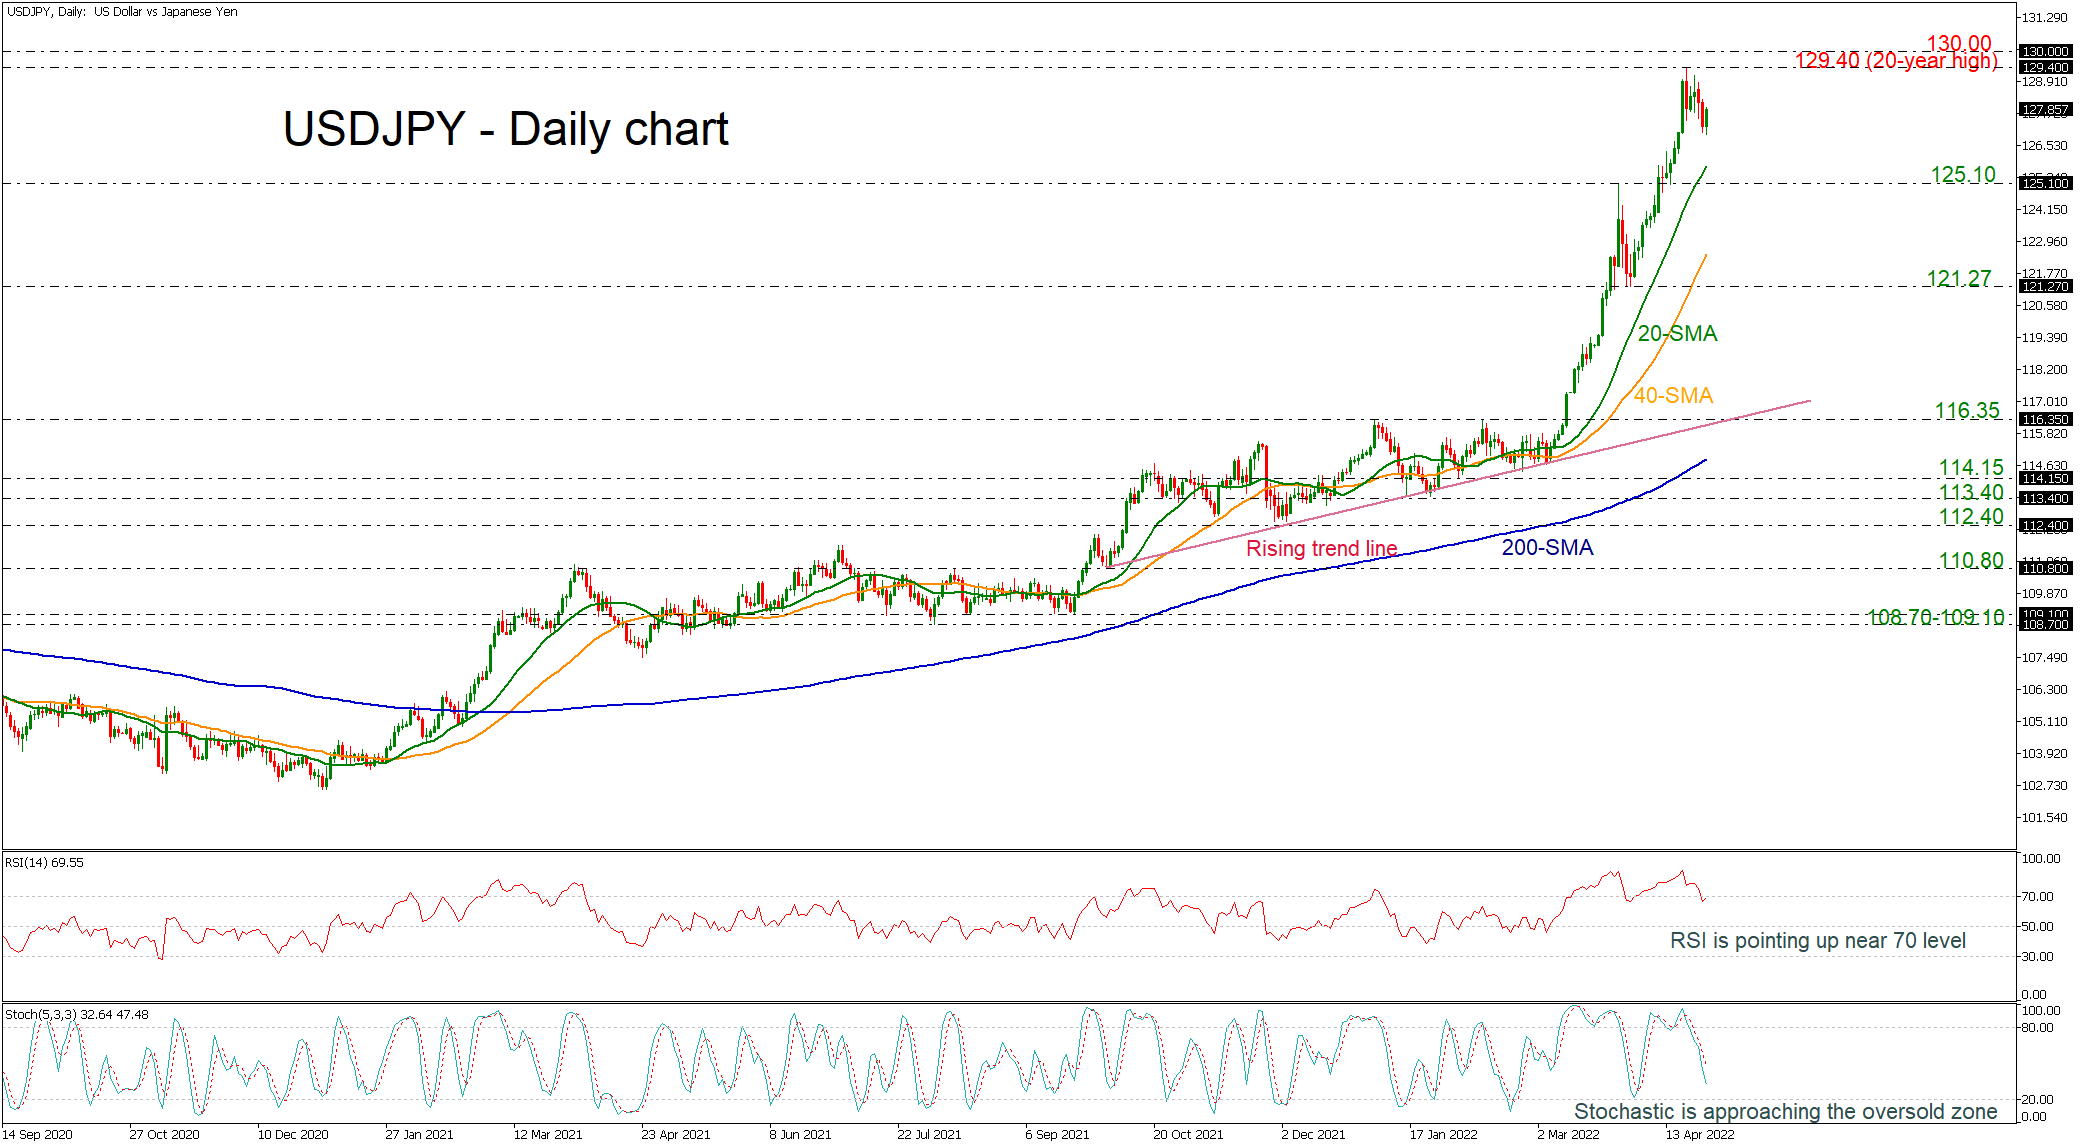
USDJPY has lost its positive momentum after the impressive bullish rally towards the 20-year high of 129.40 on April 20, but today it is appearing positive again. In the short-term, the market could retain the negative momentum as the RSI dropped beneath the overbought region and the stochastic oscillator is approaching the oversold territory.
Should the pair stretch south, the 20-day simple moving average (SMA) at 125.75 could provide immediate support before the pair touches the 125.10 barrier. A significant step lower could bring the bearish sentiment into play, sending the price probably towards the 40-day SMA at 122.46. If the sell-off extends, attention could then turn to the 121.27 barrier, taken from the latest lows.
On the flip side, the multi-year high of 129.40 may halt upside movements as it did in the previous weeks, while more increases could meet the 130.00 psychological mark. More bullish actions could drive the market until the next resistance at 135.20, registered in January 2002.
In the medium-term picture, USDJPY has been trading bullish in the past six months after the close above 112.40. If there is also a climb beyond the 130.00 round number, this would endorse the strong positive outlook.