Sample Category Title
Technical Outlook and Review
DXY:
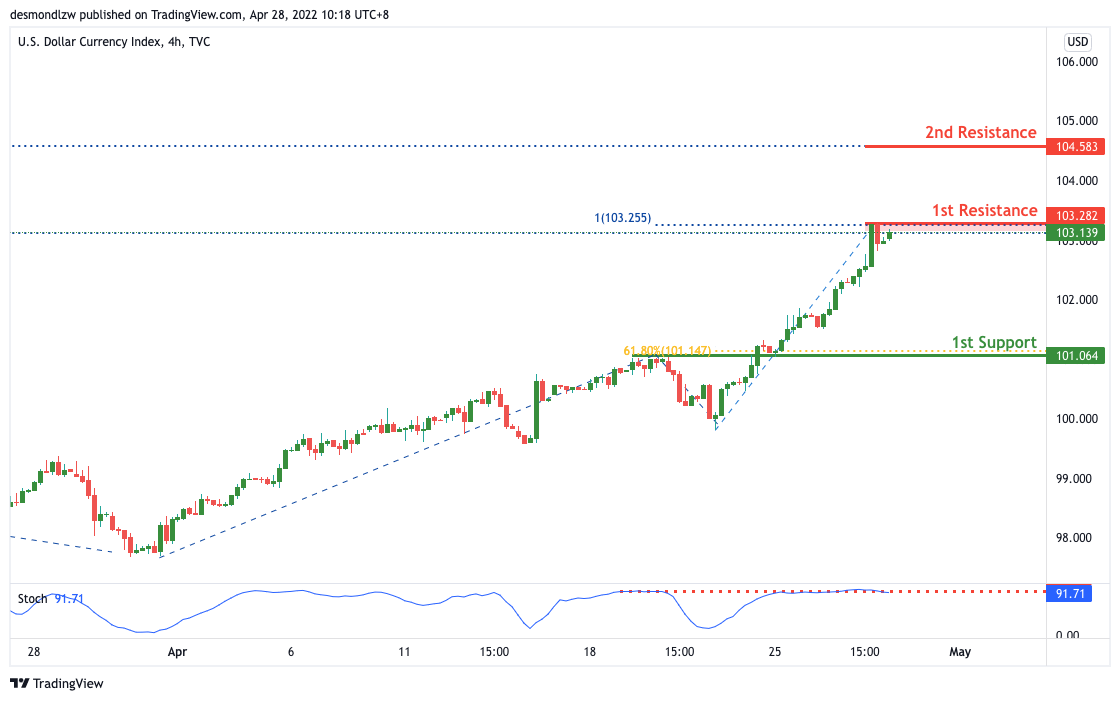
On the H4, with price expected to reverse off the stochastics indicator, we have a bearish bias that price will drop from our 1st resistance at 103.282 where the 78.6% Fibonacci retracement is to our 1st support at 101.064 in line with the horizontal pullback support, 161.8% Fibonacci extension, 61.8% Fibonacci projection and -61.8% Fibonacci expansion. Alternatively, price may break 1st resistance structure and head for 2nd resistance where the 100% Fibonacci projection.
Areas of consideration:
- H4 time frame, 1st resistance at 102.441
- H4 time frame, 1st support at 101.790
XAU/USD (GOLD):
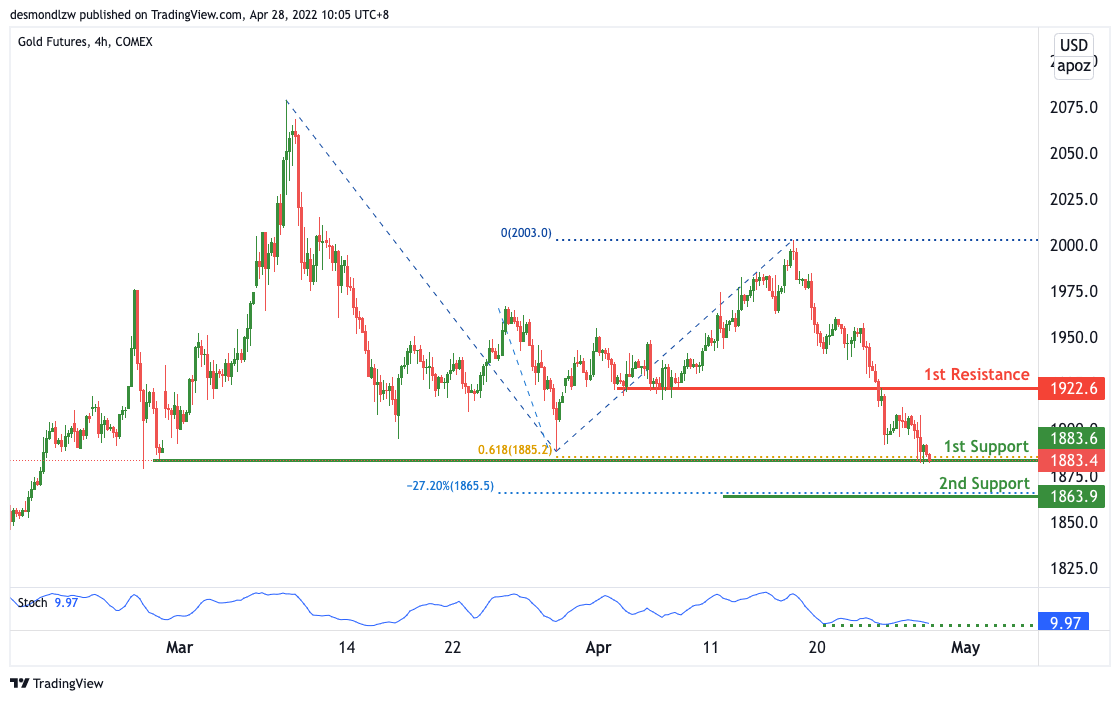
On the H4, with price expected to bounce off the stochastics indicator, we have a bullish bias that price will rise to our 1st resistance at 1922 where the pullback resistance is from our 1st support at 1883 in line with the horizontal swing low support and 61.8% Fibonacci projection and 127.2% Fibonacci extension. Alternatively, price may break 1st support structure and head for 2nd support where the 161.8% Fibonacci extension and -27.2% Fibonacci expansion is at 1863.
Areas of consideration:
- H4 time frame, 1st Resistance at 1922
- H4 time frame, 1st Support at 1895
GBP/USD:
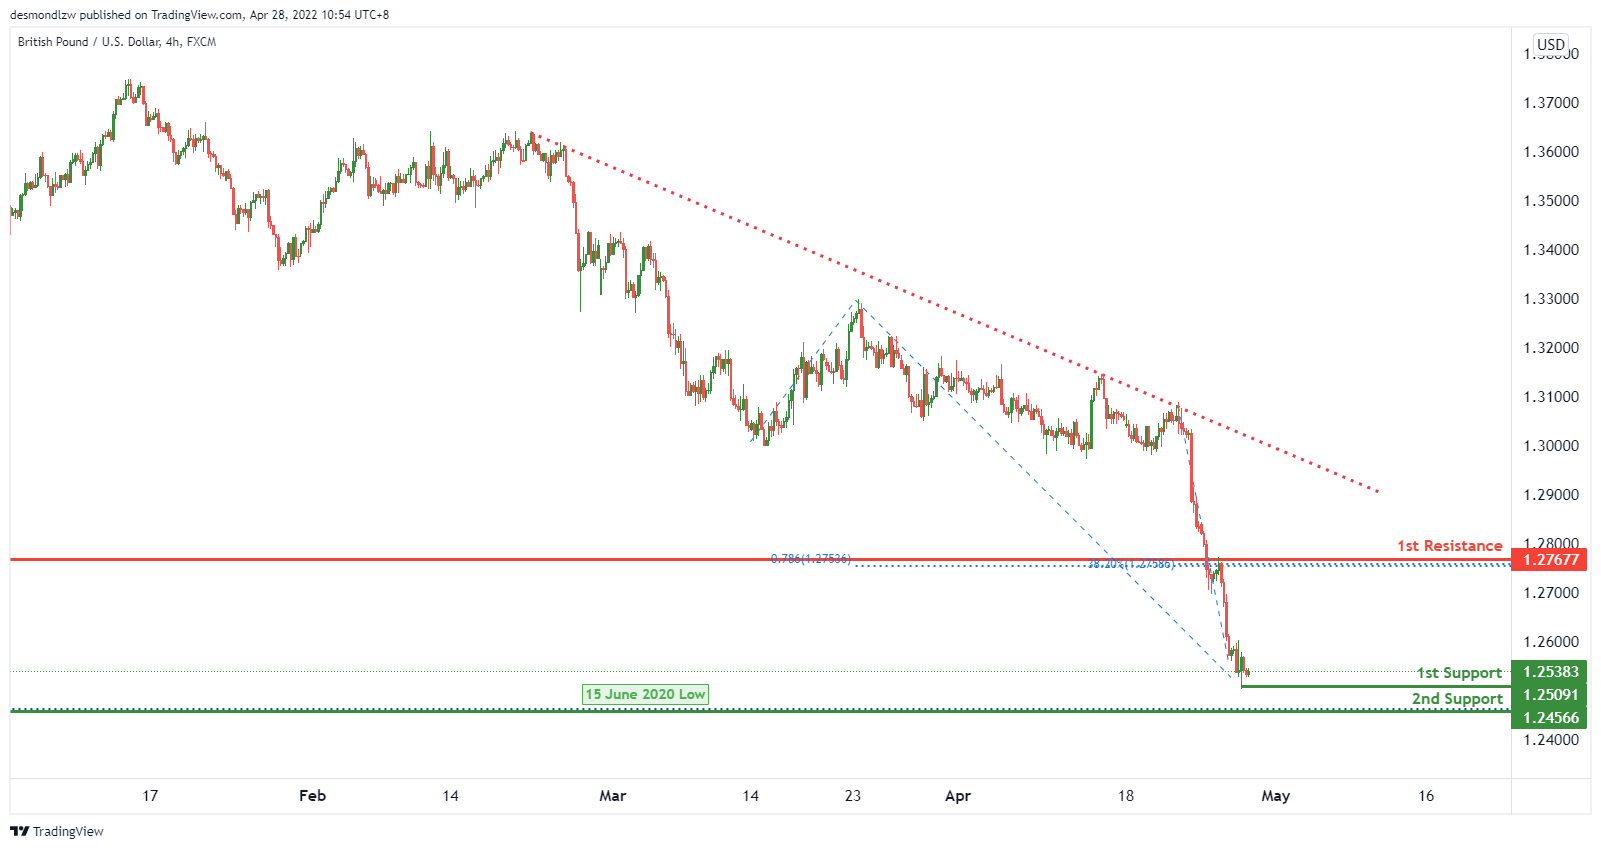
On the H4, we have a bullish bias that price will bounce from 1st support level of 1.25091 which lines up with graphical swing low support towards the 1st resistance level of 1.27677 which lines up with 78.6% fibonacci projection and 38.2% fibonacci retracement.
Areas of consideration:
- H4 1st resistance at 1.27677
- H4 1st support at 1.25091
- H4 2nd support at 1.24566
USD/CHF:
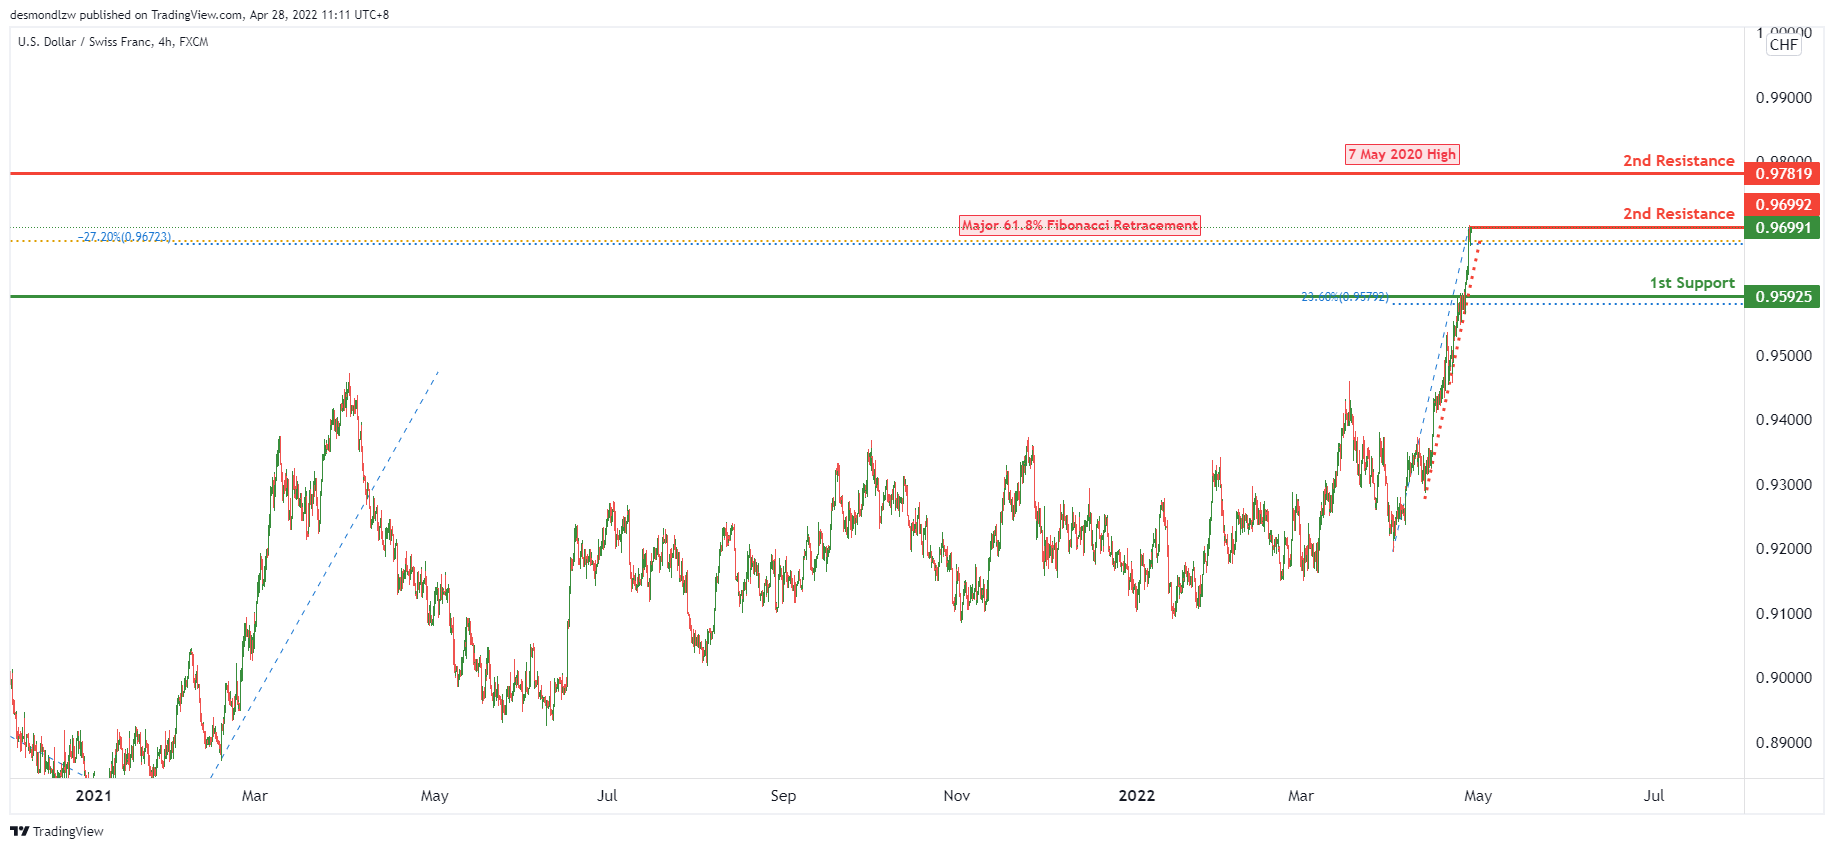
On the H4, price is near to the key resistance level. We expect that price will potentially reverse from 1st resistance level of 0.97034 in line with -27.2% fibonacci expansion and a major 61.8% fibonacci retracement towards the 1st support level of 0.95925 in line with 23.6% fibonacci retracement.
Areas of consideration
- 1st support level at 0.95925
- 1st resistance level at 0.97034
- 2nd resistance level at 0.97819
EUR/USD :
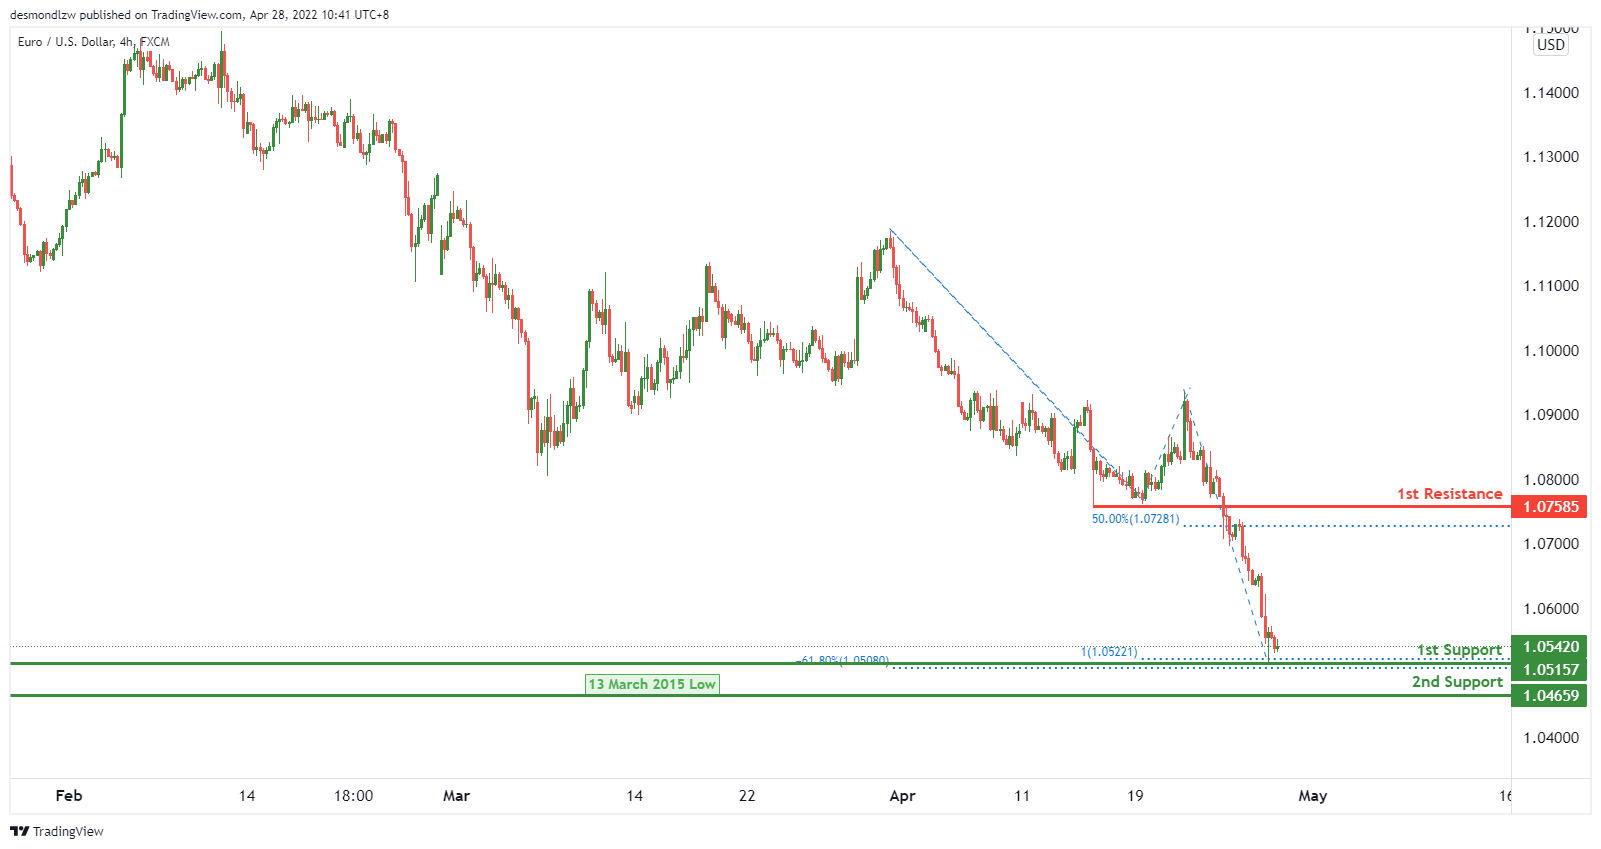
On the H4, price is near the pivot level. We expect price to potentially bounce from 1st support level of 1.05157 in line with 100% fibonacci retracement and -61.8% fibonacci expansion towards the 1st resistance level of 1.07585 in line with 50% fibonacci retracement.
Areas of consideration :
- H4 1st resistance at 1.07585
- H4 1st support at 1.05157
- H4 2nd support at 1.04659
USD/JPY:
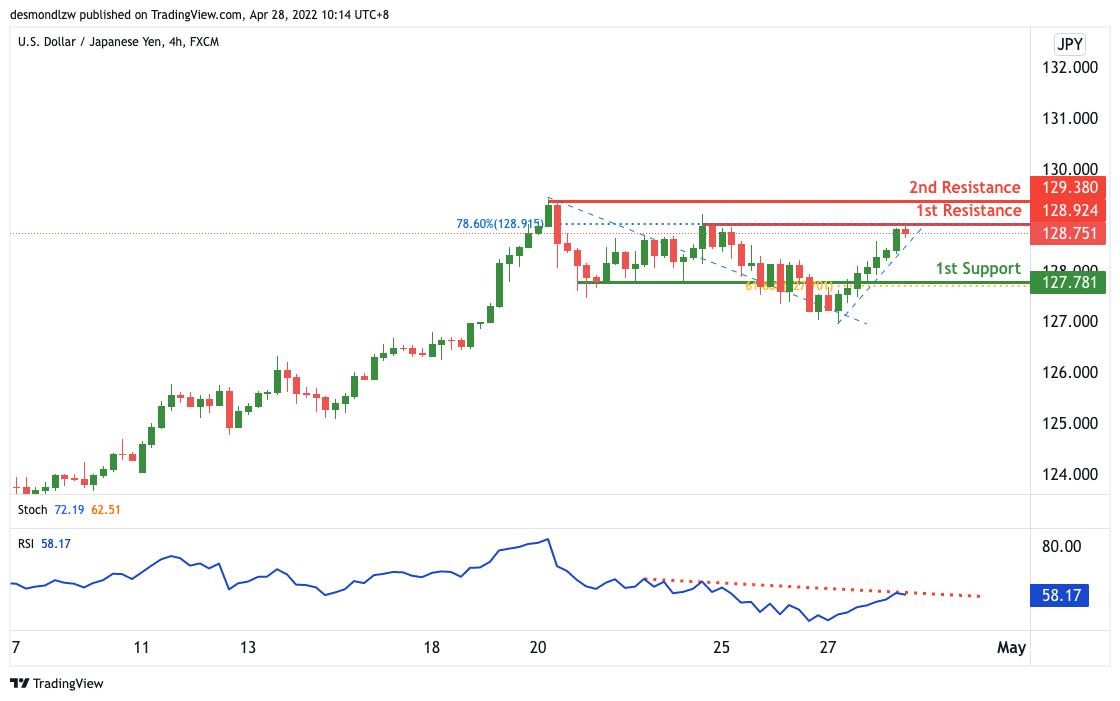
On the H4, with price moving below the ichimoku cloud indicator, we have a bearish bias that price will drop from our 1st resistance at 128.924 where the 38.2% Fibonacci retracement is to our 1st support at 127.781 in line with the horizontal pullback support and 61.8% Fibonacci retracement. Alternatively, price may break 1st resistance structure and head for 2nd resistance where the horizontal swing high resistance is at 129.380.
Areas of consideration:
- H4 time frame, 1st resistance at 128.331
- H4 time frame, 1st support at 127.667
AUD/USD:
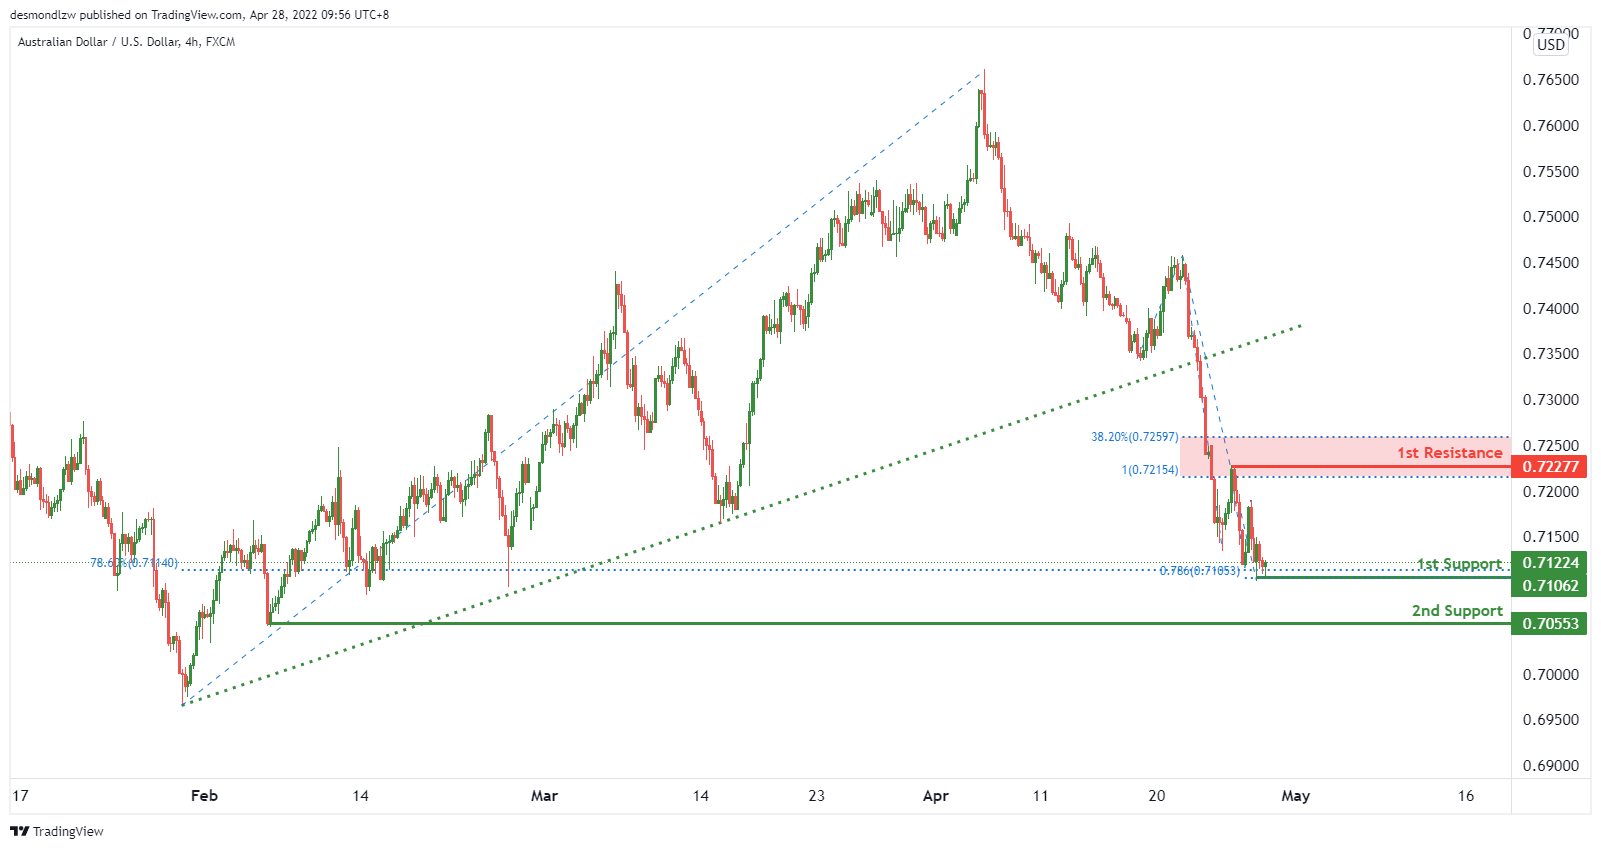
On the H4 timeframe, price is near the key support level, We see the potential of a bullish bounce from 1st support level of 0.71062 in line with 78.6% fibonacci retracement and 78.6% fibonacci projection towards the 1st resistance level of 0.72277 in line with 38.2% fibonacci retracement and 100% fibonacci projection. Otherwise, price might break the key support level to trigger a dip towards the 2nd support of 0.70553 which is in line a previous horizontal swing low support.
Areas of consideration
- H4 1st resistance at 0.72277
- H4 1st support at 0.71062
- H4 2nd support at 0.70553
NZD/USD:
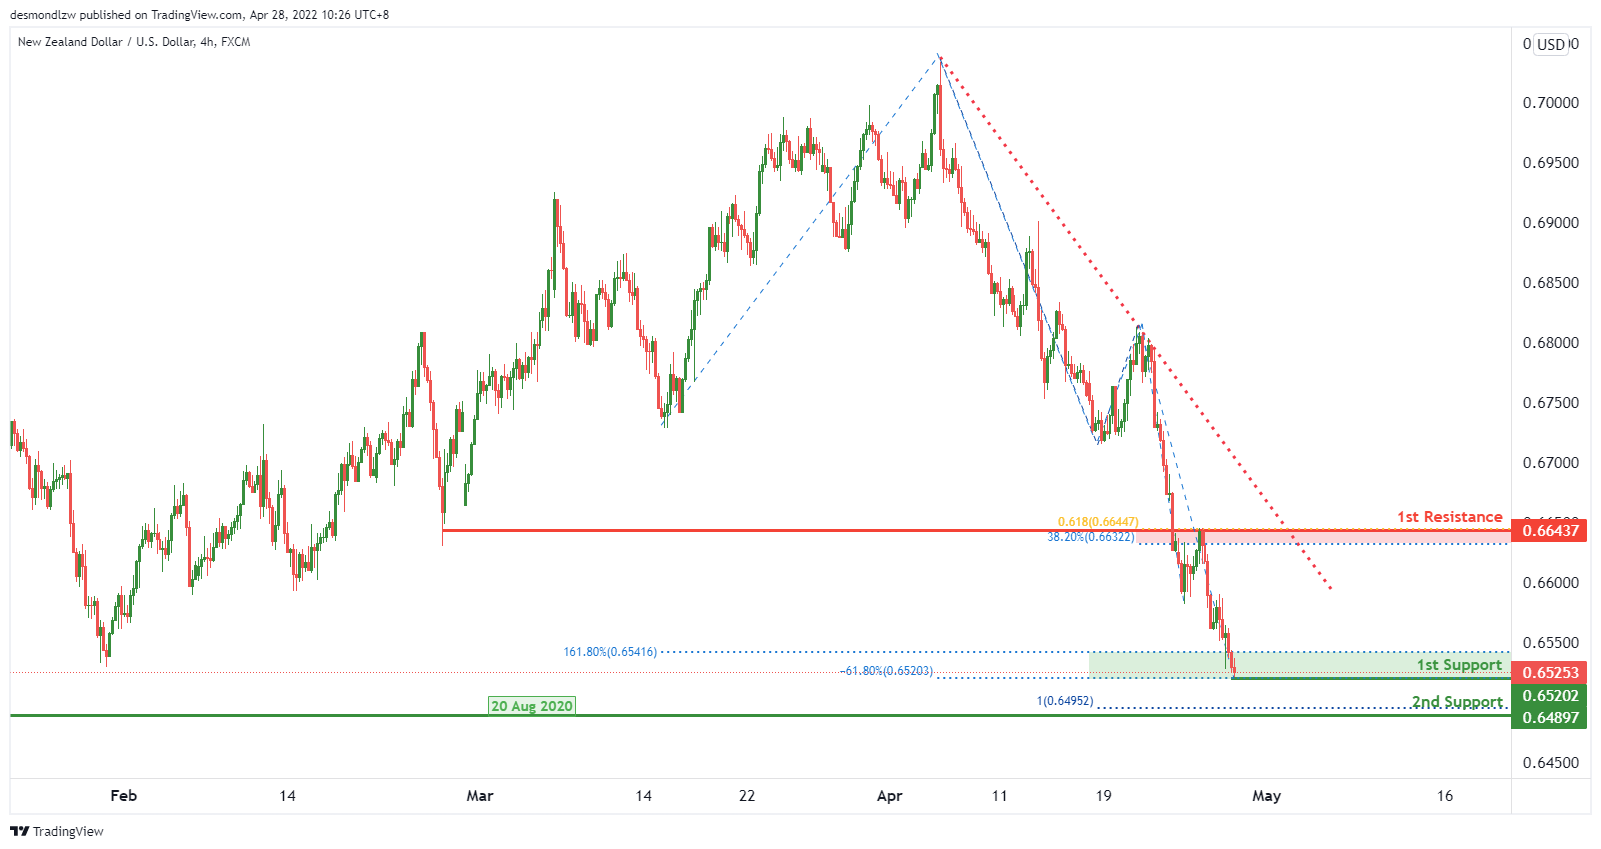
On the H4, we see the potential of bullish bounce from 1st support level of 0.65202 in line up with 161.8% fibonacci extension and -61.8% fibonacci expansion towards the 1st resistance level of 0.66437 in line with 38.2% fibonacci retracement and 61.8% fibonacci projection.
Areas of consideration:
- H4 time frame, 1st support at 0.65202
- H4 time frame, 1st resistance at 0.66437
- H4 time frame, 2nd support at 0.64897
USD/CAD:
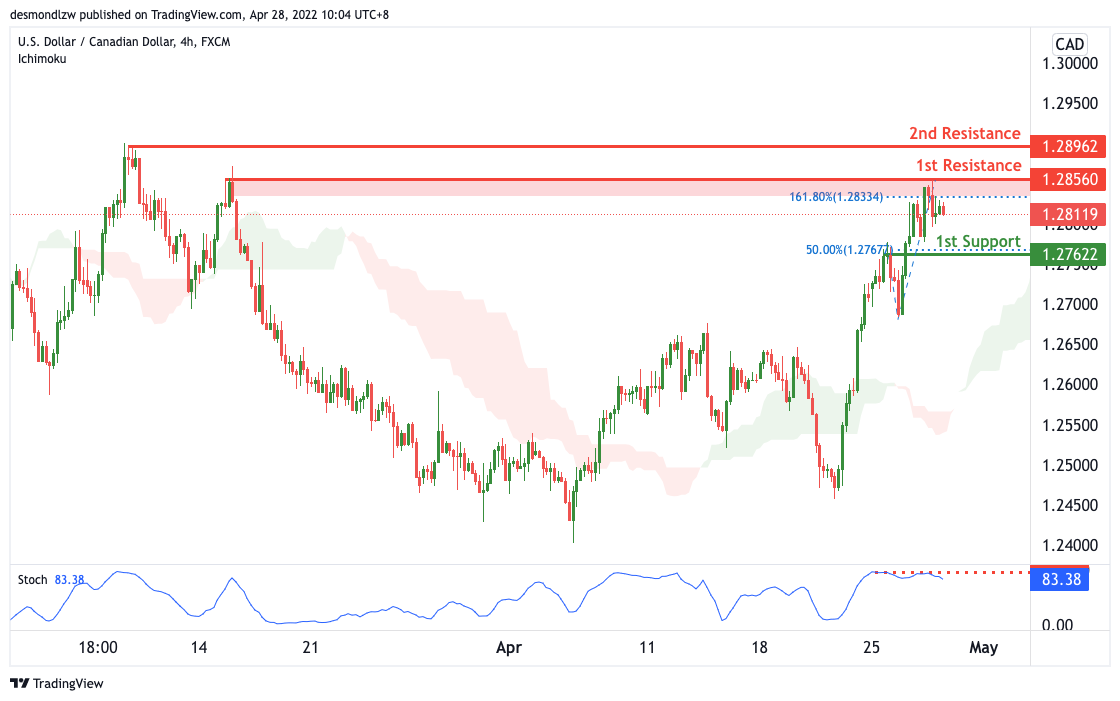
On the H4, with price moving above the ichimoku cloud, we have a bullish bias that price will rise to our 1st resistance at 1.28560 where the swing high resistance and 161.8% Fibonacci extension is from our 1st support at 1.27622 in line with the horizontal pullback support and 50% Fibonacci retracement. Alternatively, price may break 1st support structure and head for 2nd support where the horizontal swing low support and 38.2% Fibonacci retracement is.
Areas of consideration:
- H4 time frame, 1st resistance at 1.28560
- H4 time frame, 1st support at 1.27622
OIL:
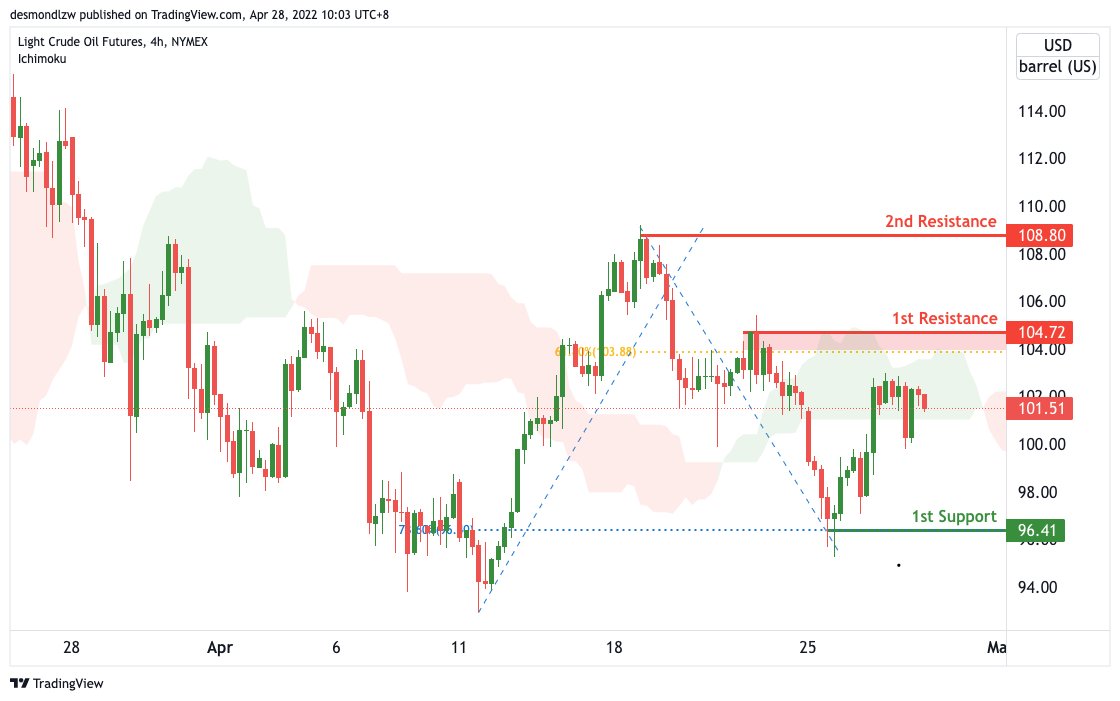
On the H4, with price expected to reverse off the resistance of the ichimoku cloud, we have a bearish bias that price will drop from our 1st resistance at 104.72 where the swing high resistance and 61.8% Fibonacci retracement is to our 1st support at 96.41 in line with the horizontal swing low support and 78.6% Fibonacci retracement. Alternatively, price may break 1st resistance structure and head for 2nd resistance where the horizontal swing high resistance at 108.80.
Areas of consideration:
- H4 time frame, 1st resistance of 104.72
- H4 time frame, 1st support of 96.41
Dow Jones Industrial Average:
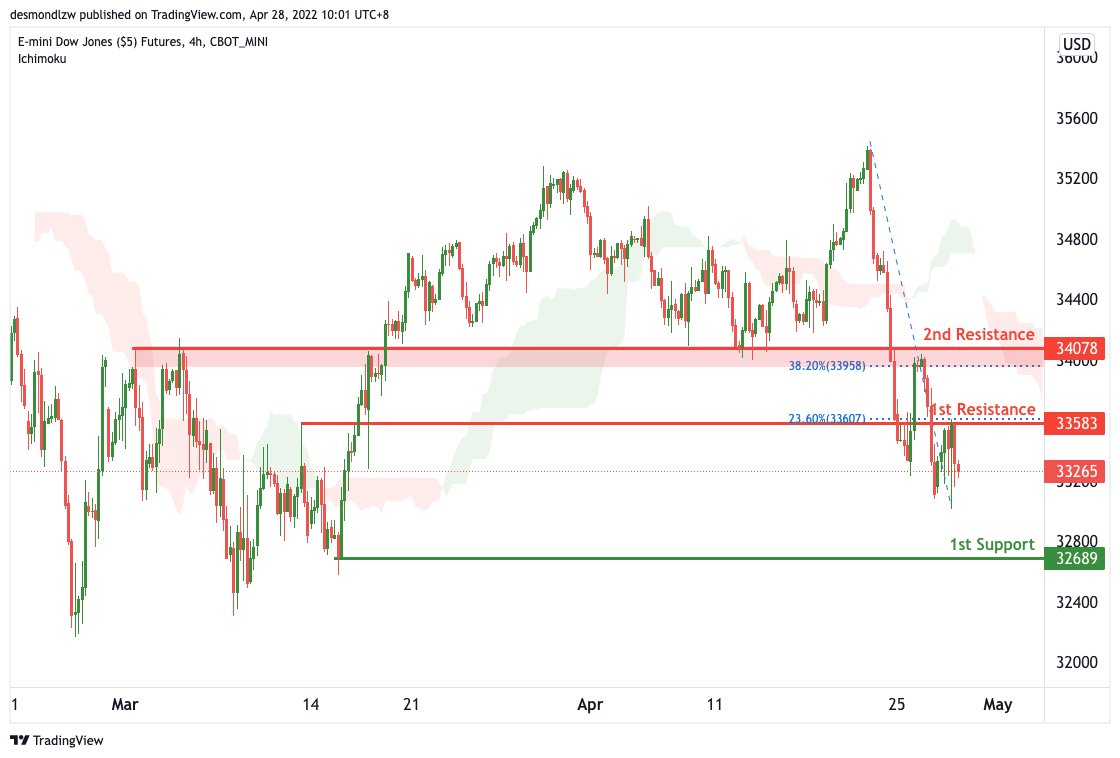
On the H4, with price moving below the ichimoku cloud, we have a bearish bias that price will drop from our 1st resistance at 33583 where the horizontal overlap resistance is to our 1st support at 32689 in line with the horizontal swing low support. Alternatively, price may break 1st resistance structure and head for 2nd resistance where the horizontal overlap resistance and 38.2% Fibonacci retracement is at 34078.
Areas of consideration :
- H4 time frame, 1st resistance at 33583
- H4 time frame, 1st support at 32689
Crude Oil Price Recovery Won’t Be Easy, Hurdles Nearby
Key Highlights
- Crude oil price found support near $95.50 and corrected higher.
- It broke a key bearish trend line with resistance near $100.10 on the 4-hours chart.
- Gold price could extend losses below $1,890 and $1,880.
- The US GDP could grow 1.1% in Q1 2022 (Prelim), down from 6.9%.
Crude Oil Price Technical Analysis
After facing rejection near $109.55, crude oil price started a fresh decline against the US Dollar. The price traded below the $105 support to move into a short-term bearish zone.
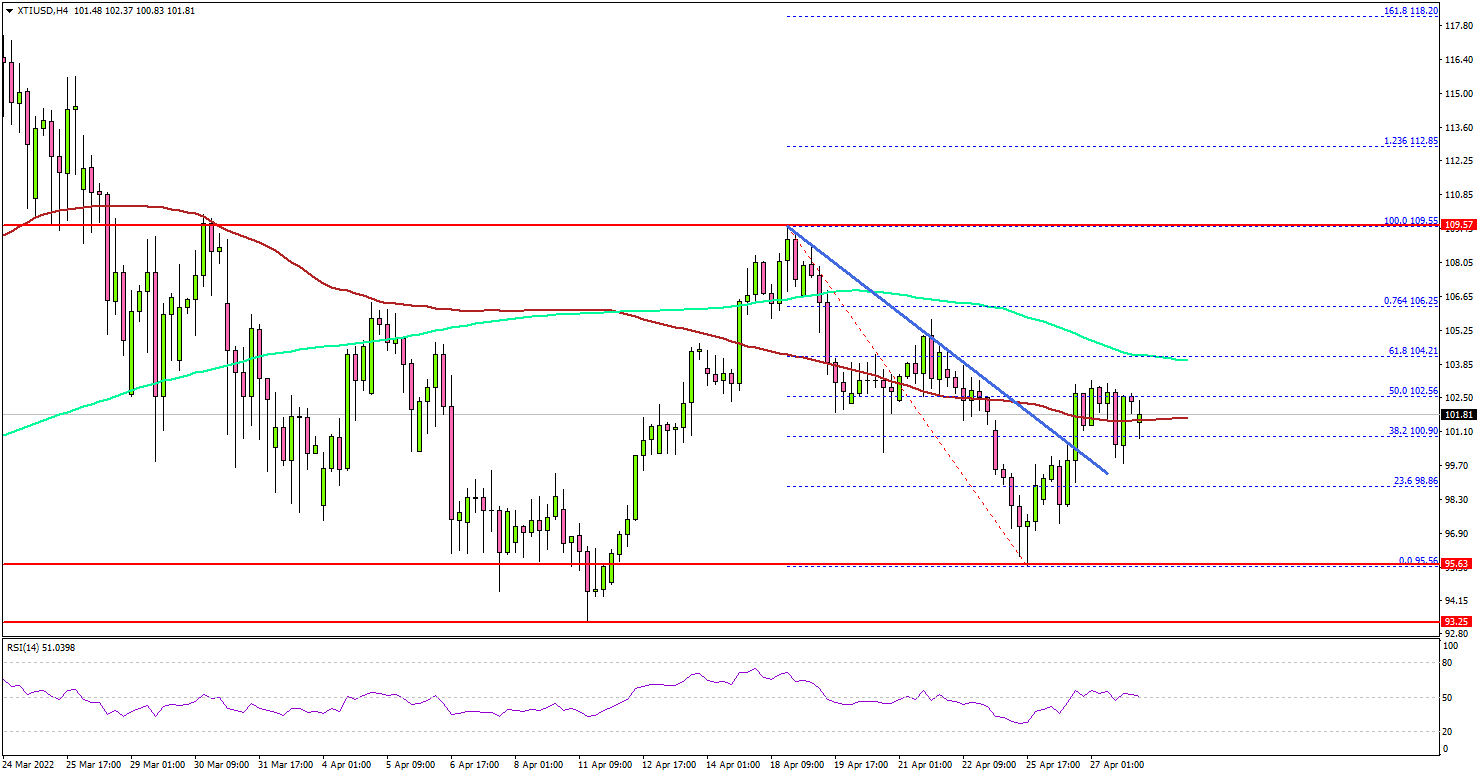
Looking at the 4-hours chart of XTI/USD, the price traded below the $100 support, the 100 simple moving average (red, 4-hours), and the 200 simple moving average (green, 4-hours).
It traded as low as $95.56 before the bulls appeared. The price started an upside correction above the $98 and $99 levels. There was also a break above a key bearish trend line with resistance near $100.10 on the same chart.
However, the price faced resistance near $102.50 and the 50% Fib retracement level of the downward move from the $109.55 swing high to $95.56 low.
The main resistance on the upside is near the $104.20 level. A clear move above the $104.20 resistance zone could open the doors for a steady move towards the $110 resistance level. The next major resistance might be near the $115 level.
If there is no upside break, the price could start another decline below $98. The next major support is near $95.50, below which there is a risk of a move towards the $93.25 level. Any more losses might call for a test of the $85 support.
Looking at the gold price, the bears remained active below the $1,920 level. A close below $1,890 and $1,880 might spark a sharp decline.
Economic Releases to Watch Today
- German Consumer Price Index for April 2022 (YoY) – Forecast +7.2%, versus +7.3% previous.
- German Consumer Price Index for April 2022 (MoM) – Forecast +0.6%, versus +2.52% previous.
- US Gross Domestic Product for Q1 2022 (Preliminary) – Forecast 1.1% versus previous 6.9%.
Elliott Wave View: Dollar Index (DXY) Should Continue to Extend Higher
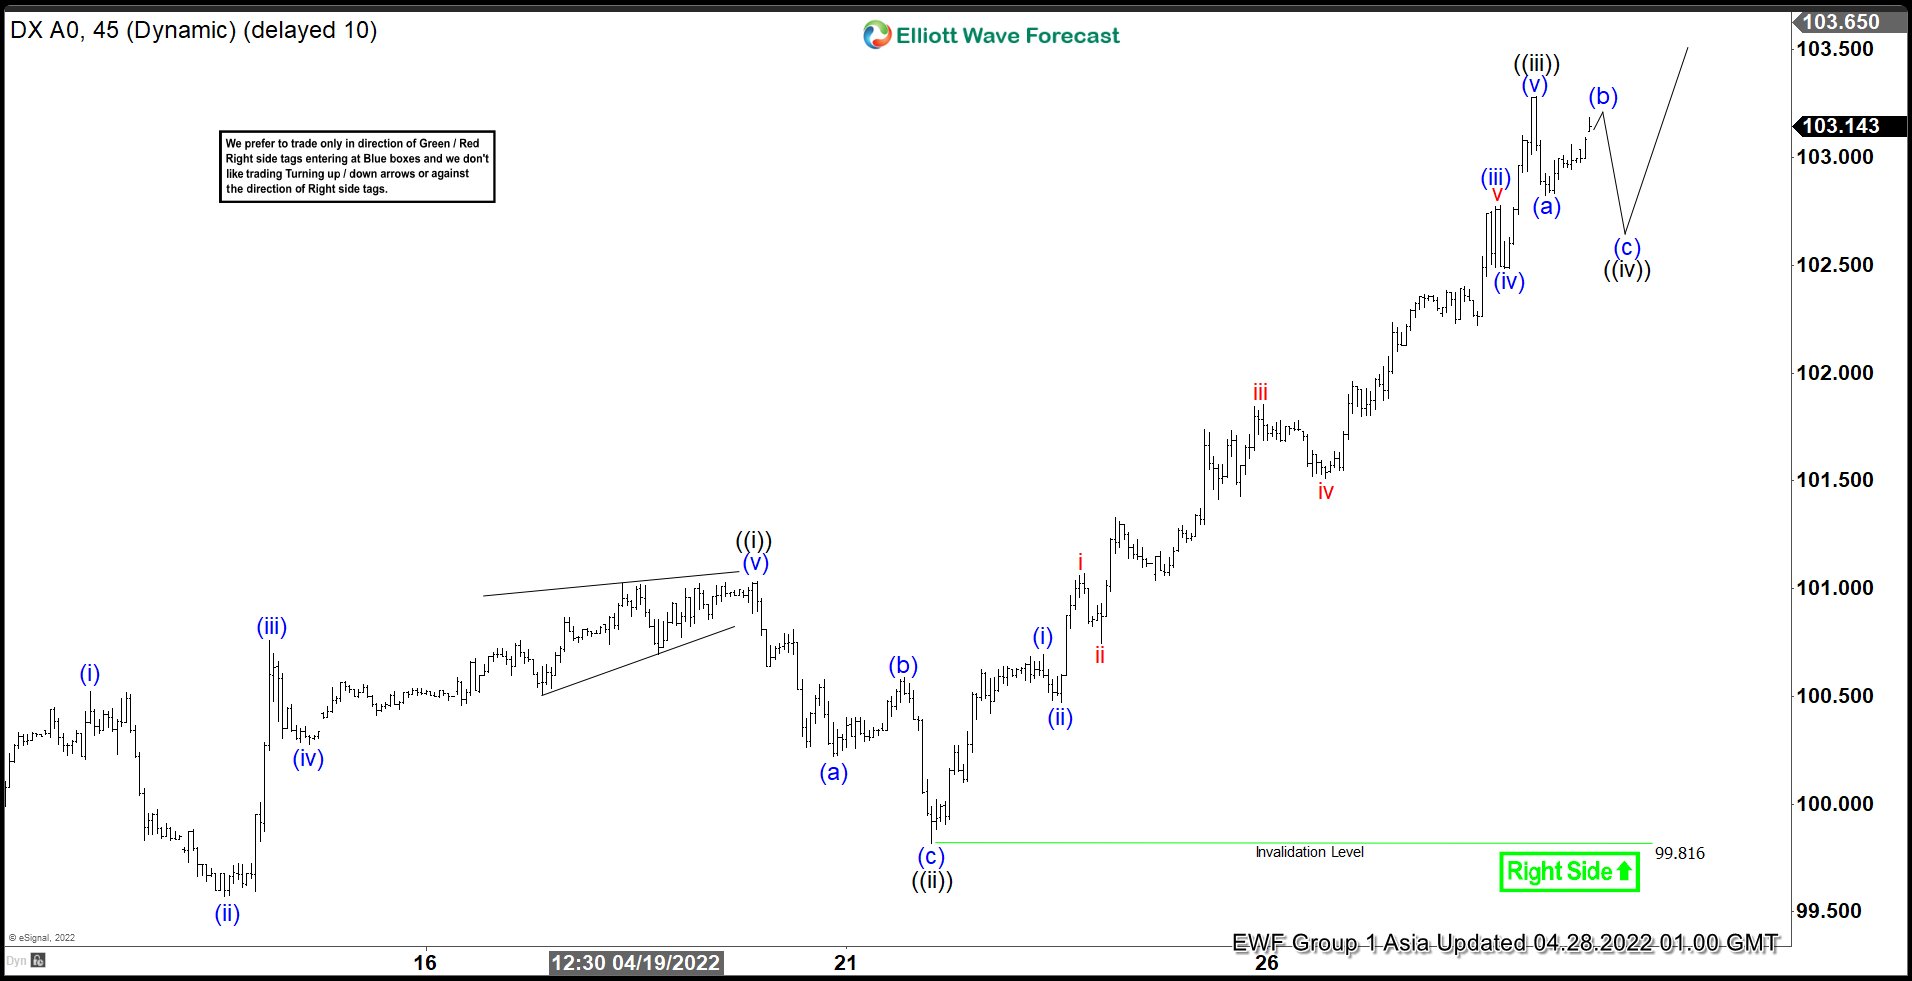
Short term view in Dollar Index (DXY) suggests the cycle from March 30, 2022 low is ongoing as an impulse Elliott Wave structure. Up from March 30 low, wave (i) ended at 100.52 and pullback in wave (ii) ended at 99.57. Index then resumes higher in wave (iii) towards 100.76. Dips in wave (iv) ended at 100.27, and final leg wave (v) ended at 101.03. This completed wave ((i)) in higher degree.
Index then pullback in wave ((ii)) which ended at 99.81. Dollar then rallies higher again and wave ((iii)) is proposed complete at 103.28. If the Index breaks above 103.28 again, then this suggests wave ((iii)) still remains in progress. Short term pullback in wave ((iv)) can see the Index correcting the rally from April 21 low before it resumes higher again.
Pullback is proposed to be in the form of a zigzag (a)-(b)-(c). Near term, as far as March 30 pivot low at 97.7 holds, expect any pullback to find support in 3, 7, or 11 swing for further upside. Assuming wave ((iii)) has really ended, ideally wave ((iv)) ends around 23.6 – 38.2 Fibonacci retracement of wave ((iii)). This comes at 101.95 – 102.46.
Dollar Index 45 Minutes Elliott Wave Chart
Eco Data 4/28/22
[php_everywhere instance="1"]
EURUSD Wave Analysis
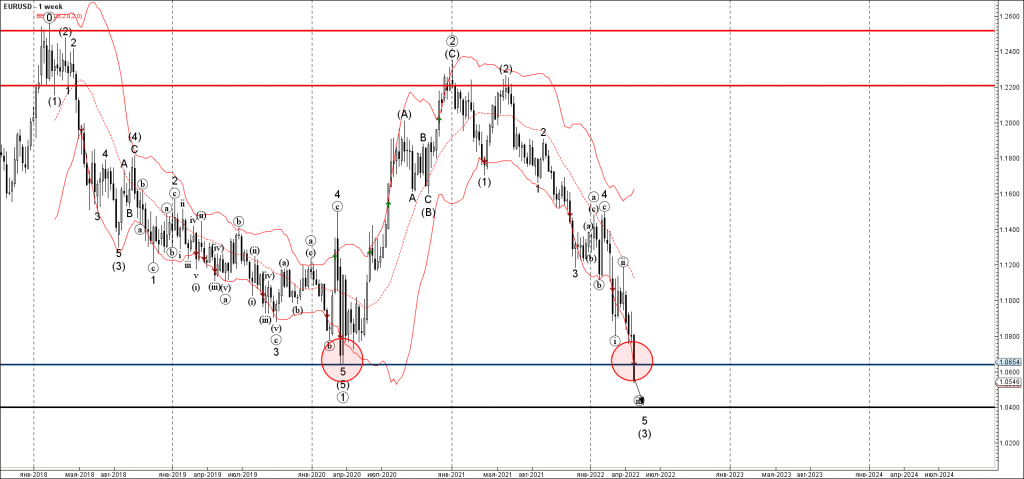
- EURUSD broke long-term support level 1.0640
- Likely to fall to support level 1.0400
EURUSD currency pair under the strong bearish pressure after the price the long-term support level 1.0640 (the previous yearly low from the start of January).
The breakout of the support level 1.0640 accelerated the active impulse waves 5 and (3).
EURUSD currency pair can be expected to fall further toward the next support level 1.0400 (target for the completion of the active impulse waves 5) .
S&P 500 Wave Analysis
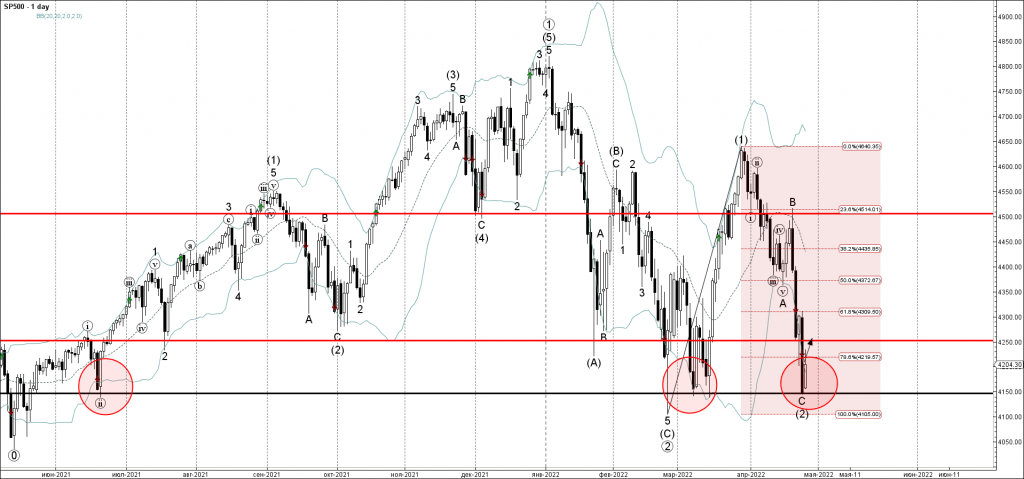
- S&P 500 reversed from support zone
- Likely to rise to resistance level 4250.00
S&P 500 index recently reversed up from the support area lying located between the long-term support level 4150.00 (which has been reversing the price from last June) and the lower daily Bollinger Band.
The upward reversal from this support zone stopped the earlier sharp intermediate ABC correction (2).
Given the strength of the aforementioned support zone – S&P 500 index can be expected to rise further toward the next resistance level 4250.00.
Breakdown of the Swiss Franc’s Half-Century Status
The Swiss franc is on track for its most substantial monthly decline against the dollar in almost ten years.
The USDCHF pair chart has shown neat support on declines from increasingly higher levels since the beginning of last year. And in April, we see the bulls attempting to develop the offensive.
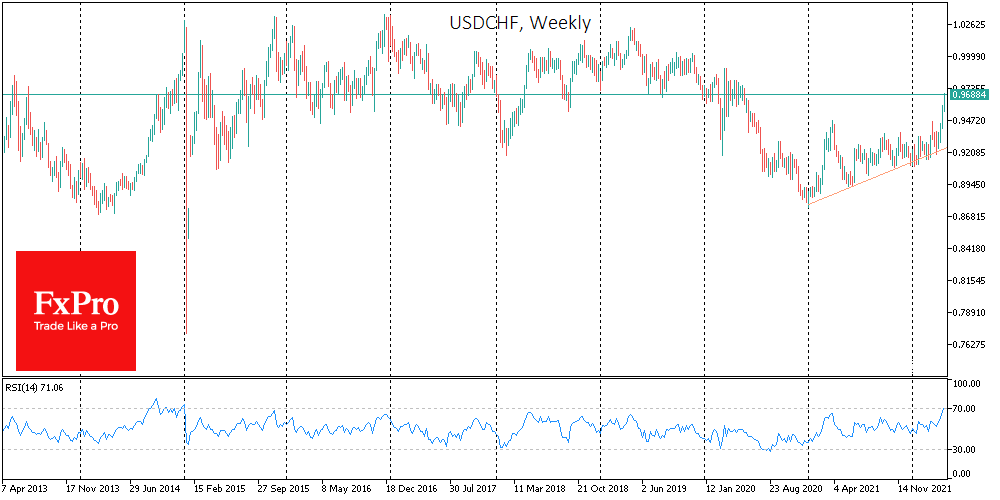
The pair rushes upward without any prolonged stop near 0.9500 (February-March 2021 pivot point). This increase attracts particular attention because it comes at the same time as impressive pressure on the financial markets, which rejects the idea of a weaker franc on recovery of demand for risky assets.
The USDCHF dynamics are now more like the behaviour of long-term government bond yields in the USA, where the downtrend of the last 40 years is breaking down. Interestingly, the long-term buying of the CHF in the previous 50 years has almost completely absorbed the loss in purchasing power of the USD. For a half-century to 2021, CHF has shown an average annual gain of 3.1% versus USD against an average 3.9% inflation.
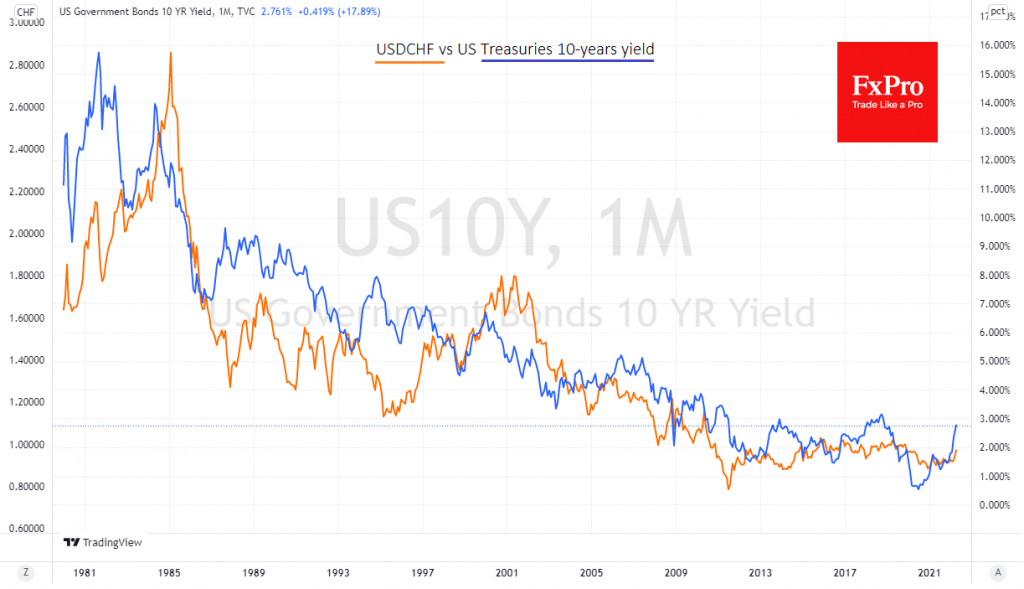
Long-term bond yields, like the USDCHF, have fallen in response to globalisation and accompanying deflationary pressures. However, this trend, which is older than many of us, is about to be broken.
The 2.78% yield on 10-year US bonds is close to the turning points of 2.9% and 3.06% in 2014 and 2018. A consolidation above 3% would thus be a turning point in a trend which has lasted more than two generations. The same can broadly be said of the USDCHF. A move above 1.02 would confirm a break from the historical trend in the 1970s that tunnelled in the mid-1980s.
Bitcoin Fails to Rreclaim $40,000 Level as Stocks Selloff Drags Cryptos Lower
It’s been a tumultuous few weeks for Bitcoin and other cryptocurrencies as the war in Ukraine has been both a positive and a negative driving force for digital currencies. But the deepening rout in equity markets is threatening to undo Bitcoin’s 46% rebound from its January trough as the $38,000 support was tested again.
A bumpy uptrend
Bitcoin posted an impressive, though bumpy, rally between January and March when it recovered from a six-month low of $32,950.72 to climb as high as $48,234 on March 28. Russia’s invasion of Ukraine was a major setback, but it didn’t take long for the rally to resume as, apart from a rebound in risk appetite, cryptocurrencies were also benefiting from speculation that Russians were using digital assets to evade Western sanctions as well as the capital controls imposed by Moscow. The encouragement by Ukraine’s government for international donations to be made in cryptos to help its war efforts also likely boosted prices during March.
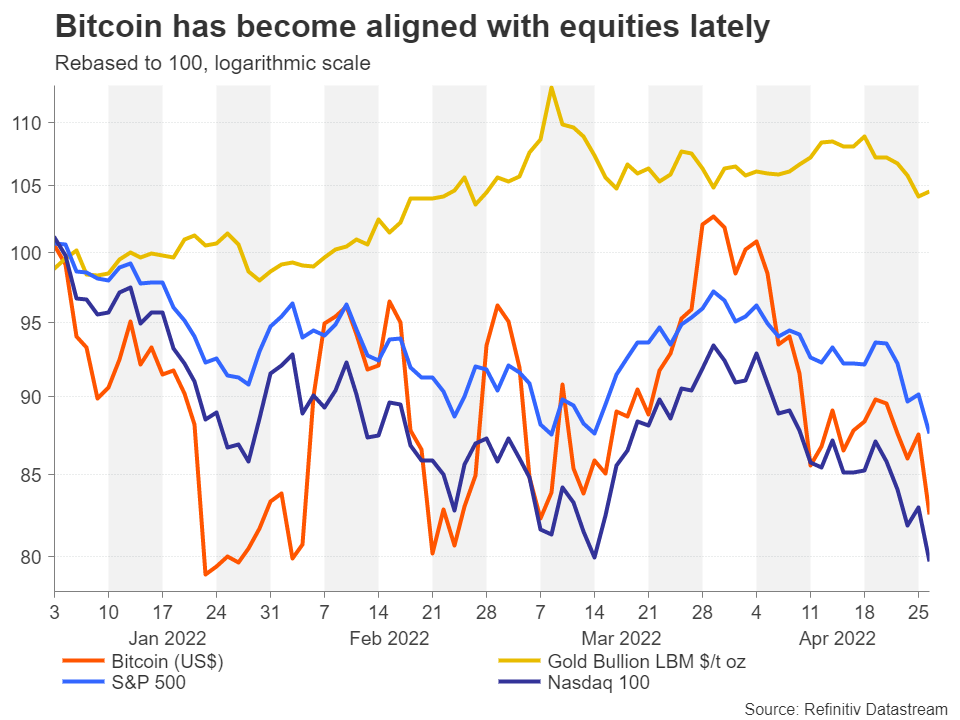
However, the mood has faltered dramatically in April as intensifying expectations that the Federal Reserve will hike interest rates multiple times this year has dented confidence in riskier assets. Although in the past, Bitcoin has illustrated some convincing correlation with safe havens such as gold, its relationship with risk assets has been even stronger lately.
Mounting headwinds
Stocks have been hammered this month on fears that soaring inflation, rising borrowing costs and lingering supply disruptions will slow growth in the major economies, if not tip them into outright recession. In the United States, where inflation is at a four-decade high and the Fed is expected to hike rates by at least another 200 basis points this year, the yield on 10-year Treasury notes came close to reaching 3% last week for the first time in more than three years. This has been weighing on tech and growth stocks, which are more sensitive to long-term lending rates.
An overall better-than-expected earnings season for Q1 has provided some support but hasn’t been enough to turn Wall Street around amid all the gloom. However, although this is spurring many traders to seek less risky investments, cryptocurrencies remain attractive as alternative assets. The heightened sense of uncertainty could therefore generate bouts of buying interest during this torrid period, especially on days where there are positive developments concerning the cryptocurrency market.
The Elon Musk effect
For example, Fidelity Investments announced on Tuesday it will start offering Bitcoin to retirement savers. The news was unable to offset the negative sentiment in the broader markets and could only offer a temporary lift, pushing it briefly above $40,000. Similarly, Monday’s gains on the back of Twitter’s acceptance of the takeover bid by Tesla boss, Elon Musk were also wiped out.
But this does nevertheless highlight that cryptocurrencies are unlikely to be ever entirely driven by equity markets. It’s also another reminder that the industry has yet to fully mature and is evolving fast, so prices will continue to be sensitive to headlines that involve either their growing adoption or fresh regulatory curbs.
Musk’s acquisition of Twitter could yet provide a more sustained boost to cryptos should speculation that the move will lead to the social media platform accepting Dogecoin as a payment system prove correct – something that would potentially benefit all digital coins.
Downslide may have further to go
In the meantime, however, Bitcoin’s bearish bias in the short term remains intact, though weakened slightly. The price slipped below its medium-term uptrend line last week and was blocked twice from stepping back above it. Although there is some upside pressure today, the Relative Strength index has some way to go before it can move back into bullish territory above 50.
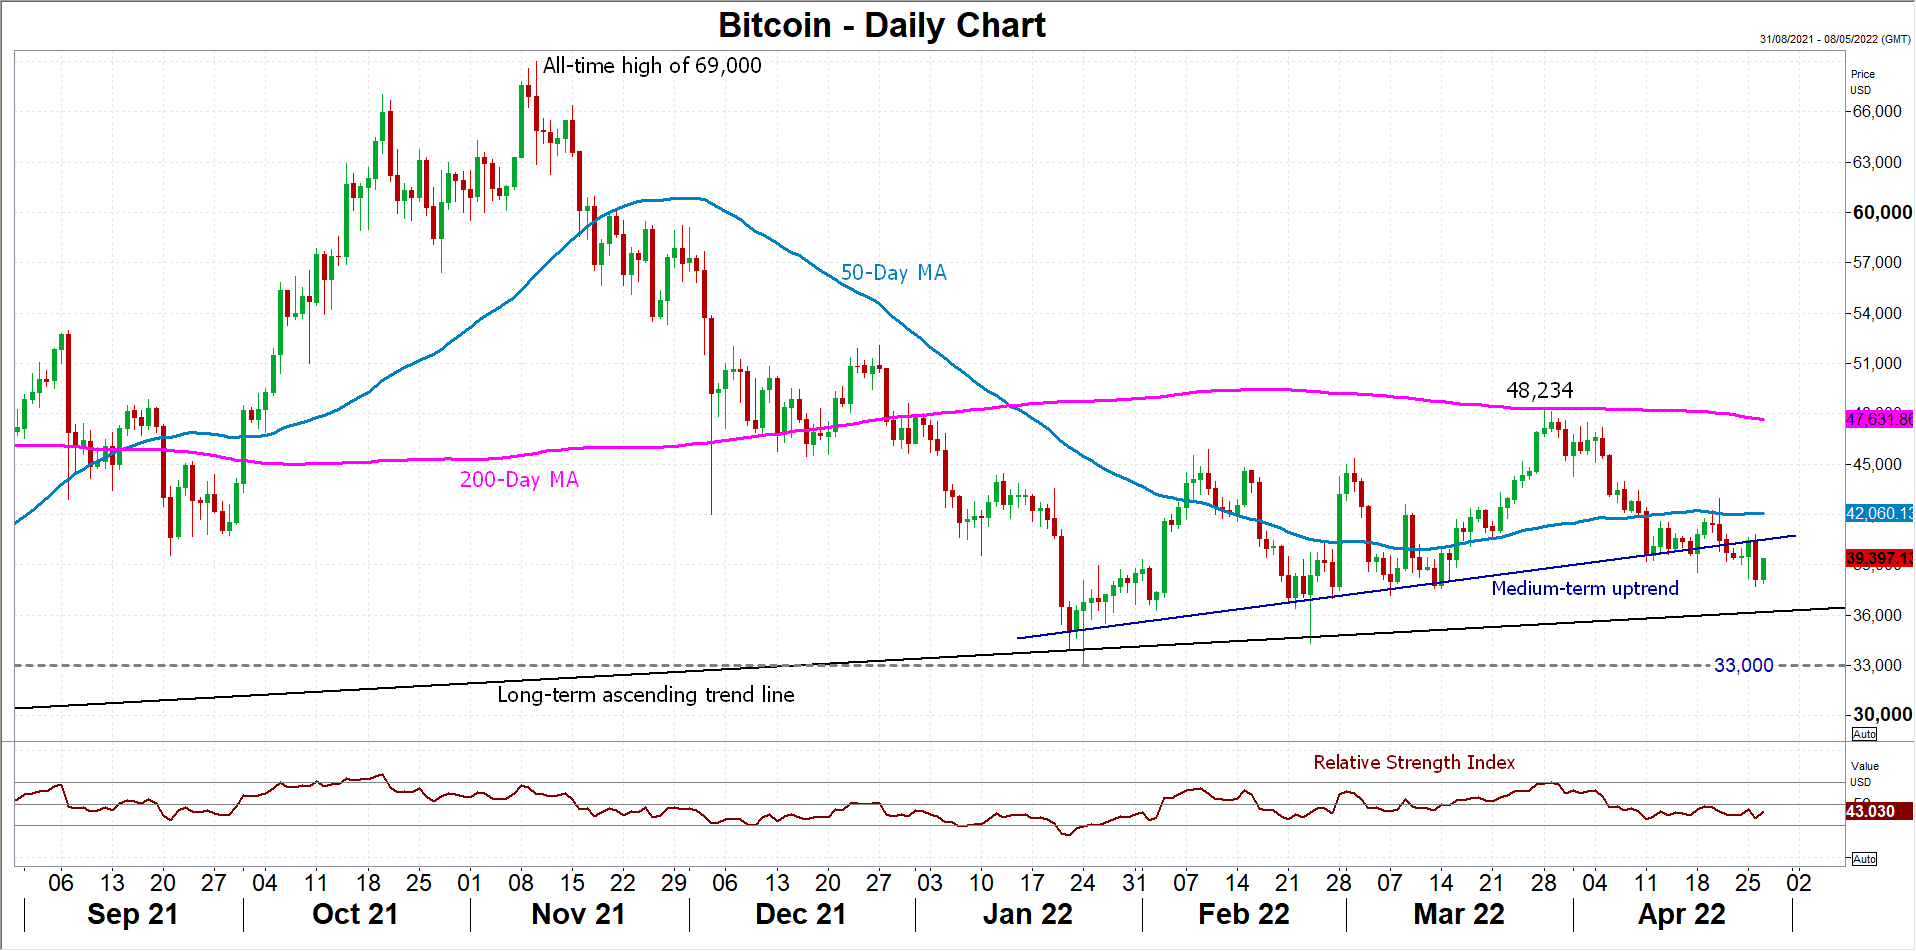
If the selling pressure persists, the price could soon breach the longer-term ascending trend line, and this would then turn the focus on the $33,000 level.
However, if sentiment improves in the coming days, the 50-day moving average is a potentially difficult obstacle just above the $42,000 level that would have to be overcome. Though, for a more convincing rebound, Bitcoin would need to challenge the March peak of 48,234.
Euro Falls to the Lowest in Five Years Following Break of 2020 Low
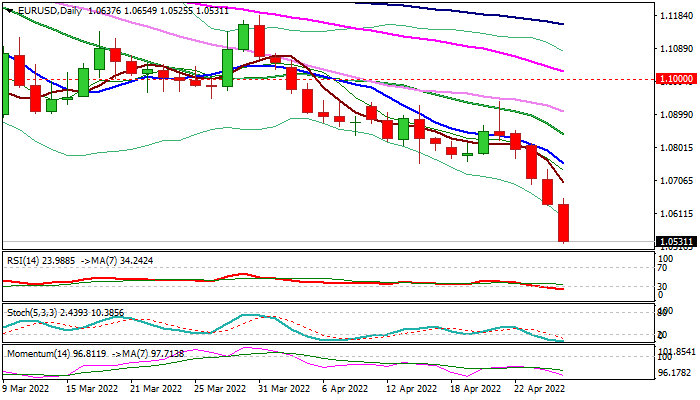
The Euro surged through key support at 1.0635 (2020 low) on Wednesday, extending steep fall into fifth straight day and hitting levels last traded in March 2017, after triggering stops parked below.
The single currency is pressured by risk aversion on worsening geopolitics, surging dollar, with stop of Russian gas supplies to Poland and Bulgaria today and strong fall in German consumer morale, adding to negative factors that weigh on Euro.
Close below broken 1.0635 pivot would signal an end of a cycle and open way for further losses as Euro is in extremely negative environment.
Bears eye initial supports at 1.0500 zone (Mar/Feb 2017 lows) followed by 1.0461 (Mar 2015 low) which guards key longer-term support at 1.0340 (Jan 2017 low), as the pair is on track for the biggest monthly fall since Jan 2015.
Minor price adjustments on strongly oversold conditions, are expected to offer better selling opportunities, as long as consequences from the Ukraine’s conflict persist.
Res: 1.0600; 1.0635; 1.0727; 1.0806
Sup: 1.0500; 1.0461; 1.0400; 1.0340
Euro Slides to 5-Tear Low
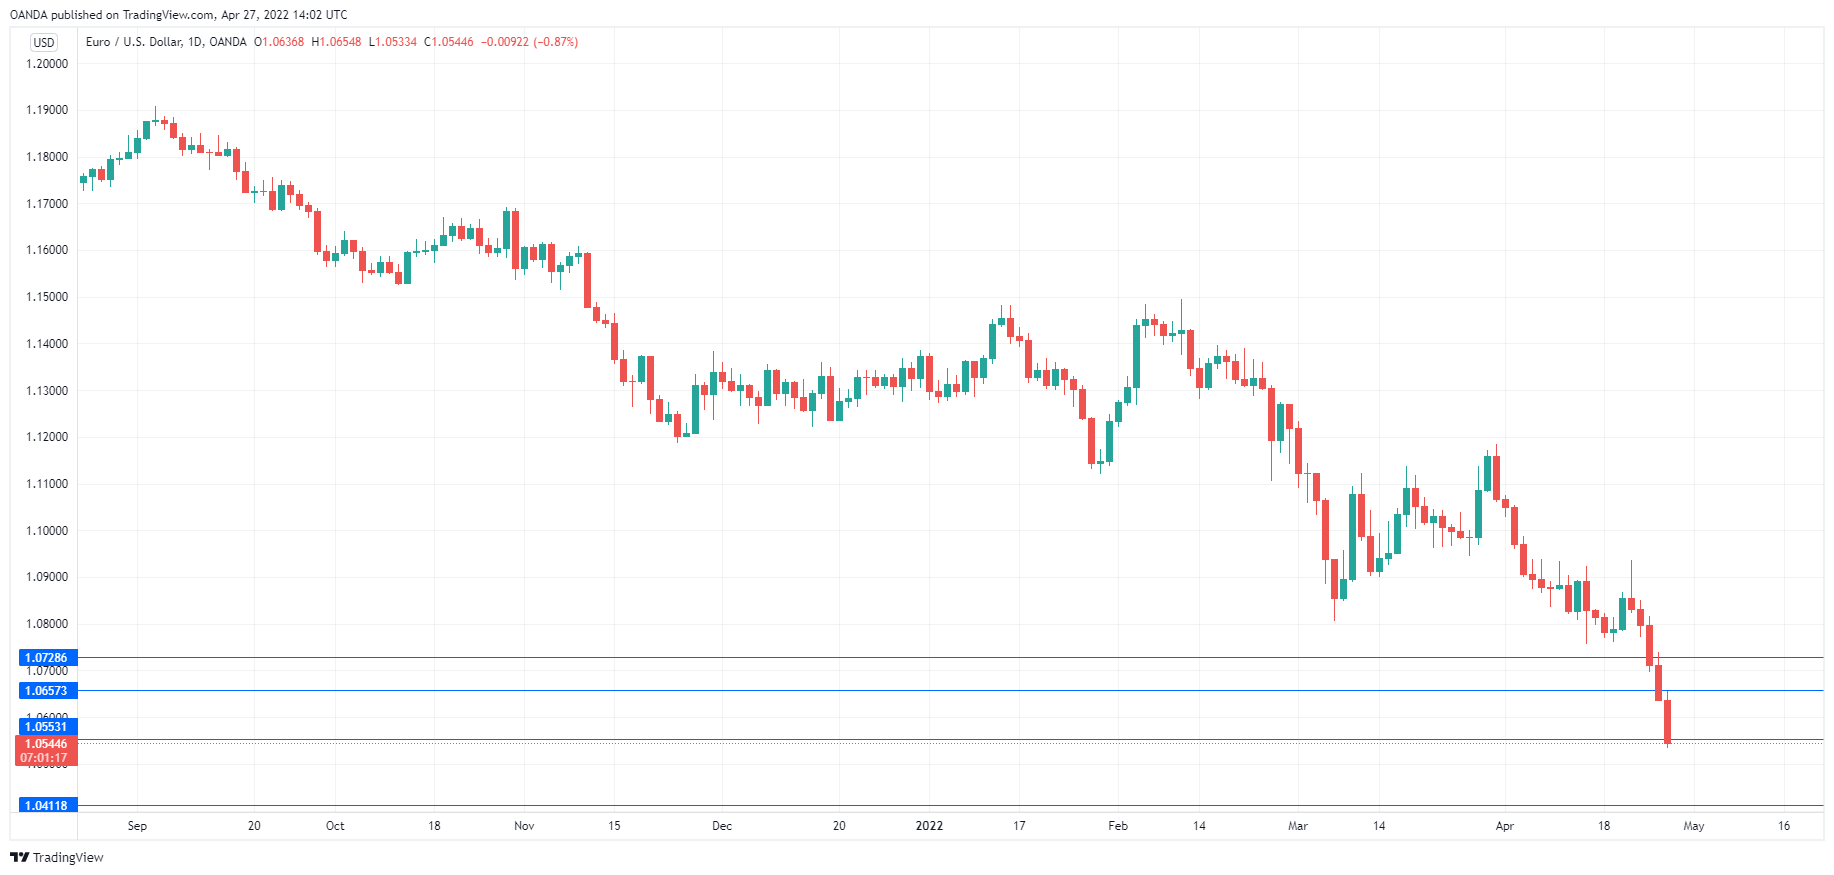
The euro continues to lose ground and is down for a fifth successive day. EUR/USD has fallen close to 1% today, as it trades at 1.0542.
Russia’s comments weigh on markets
The euro blues show no signs of easing, as the currency is getting pummeled by the US dollar. EUR/USD is down 2.34% this week and has plunged a massive 4.72% in April. Comments out of Moscow have dampened risk appetite and weighed on the wobbly euro. Russia is clearly perturbed by the shipments of weapons from the US and Western Europe to Ukraine, and Russian officials have responded with threatening rhetoric, warning that these weapon shipments are legitimate targets. Russian foreign minister Lavrov has added that the threat of nuclear war is “real”.
If this wasn’t enough to give investors the jitters, Russia announced that Poland and Bulgaria would have their natural gas supplies cut off if they did not pay in roubles. Moscow is raising the ante by the weaponisation of its energy supplies, a move that could have dire consequences for European countries dependent on Russian energy. In this bleak environment, it’s no surprise that the euro is under strong pressure, and could be headed for 1.0300 and even parity if the standoff between the West and Russia continues.
Another factor weighing on the euro is the Federal Reserve, which is tightening policy and is virtually certain to deliver a half-point rate increase next week. With Fed Chair Powell and other FOMC members saying that more half-point hikes could be on the way, an aggressive Fed is widening the US/Europe rate differential and making the euro less attractive to investors.
EUR/USD Technical
- EUR/USD continues to break through support levels. 1.0553 is under pressure, followed by support at 1.0411
- There is resistance at 1.0657 and 1.0728