Sample Category Title
Full Steam Ahead for the Dollar
The currency market has gone a little crazy. Key currency pairs with the dollar have reached significant round levels, attracting attention, and the extent of US currency appreciation continues to pick up speed.
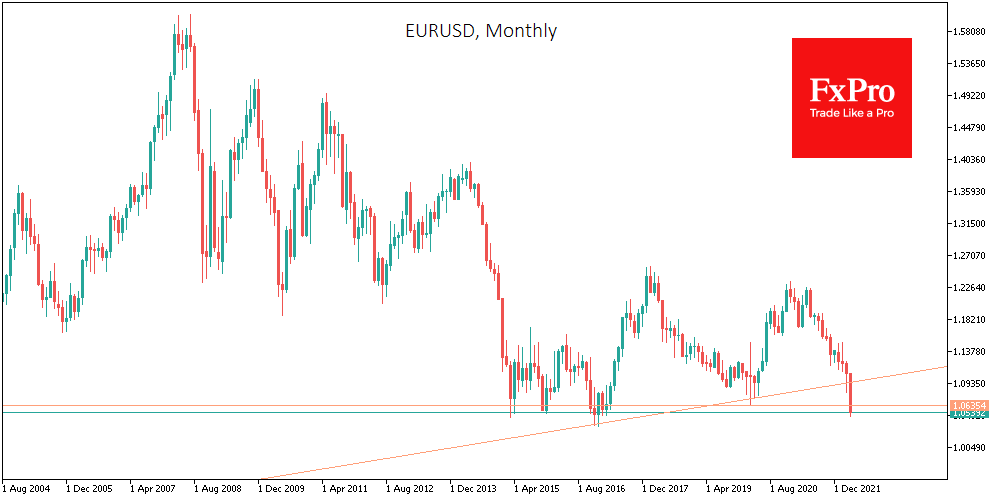
EURUSD on Thursday morning fell to 1.05, the last intermediate round level before parity. However, the 1.06 that the bears took yesterday is more important from a historical perspective. The current currency market dynamics look like a final capitulation of the bulls on the euro.
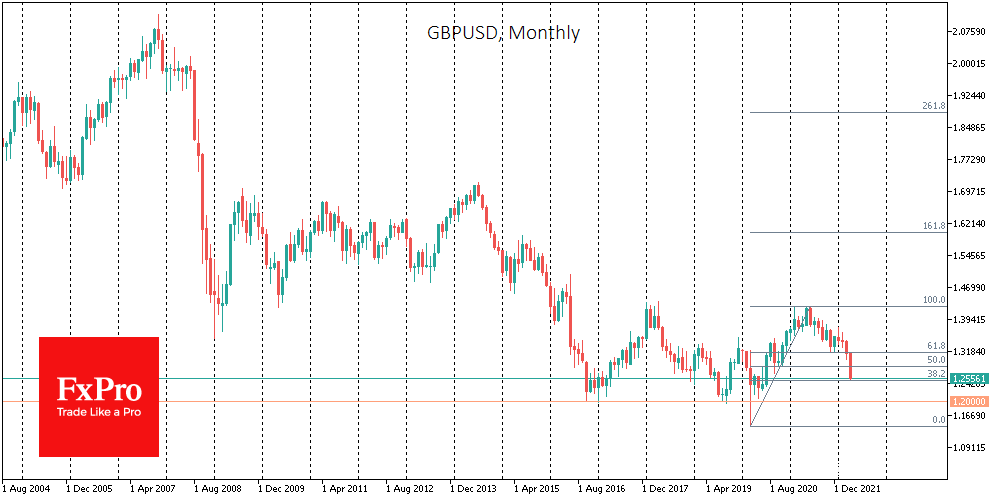
GBPUSD has fallen back to 1.25, taking back more than 60% of the amplitude of the pandemic rise. This is also a crucial intermediate stage before the last defensive line at 1.2000, which has repeatedly stopped the sellers’ onslaught over the previous six years.
The USDJPY has taken another round figure, breaking 130 on Thursday morning. The last time the yen was this cheap was in April 2002.
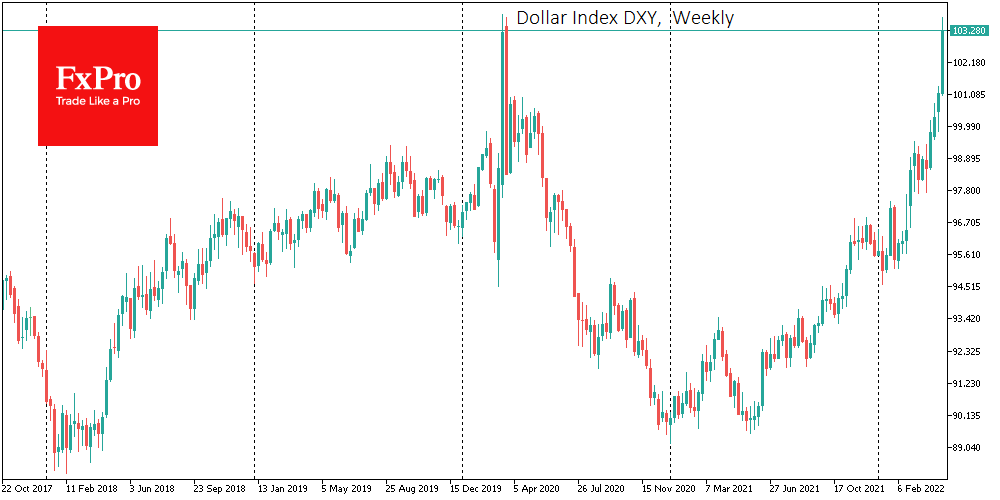
The dollar index shows the sharpest increase since the beginning of the week in more than two years. Last time we saw such dollar performance was in a mix with a crash in the stock markets and an all-out flight into short-term US government bonds.
But now we see the opposite, with stock indices gaining for the second day in a row, finding support near last month’s lows. We are not catching a flight to the ‘defensive dollar’ but rather an interest in a ‘strong dollar economy’.
Interest in the US currency is growing out of a combination of confidence in a sharp Fed rate hike in the coming months (which other countries’ peers will not be able to do) and a continued macroeconomic solid performance at the same time. The second hypothesis is likely to be put to a severe test in the coming weeks, but right now, it is a thesis that is working for the USD.
Perhaps the only thing that can restrain dollar buyers now is the Fed, but the American Central Bank has already started a week of silence before the next FOMC meeting. Therefore, we will not know how the FOMC will react to a strong dollar until next Wednesday.
There are hopes that the Fed will ease expectations of a key rate hike in the coming months because a sharp rate hike may come as an economic shock and could be a spoke in the wheels of an economy that is moving at full throttle.
At the same time, it is unlikely that strengthening the US currency will alarm the regulator as it helps to bring down inflationary pressures and inflation expectations, which is the number one target for monetary policy right now.
XAU/USD Outlook: Bears Crack Pivotal Supports at $1900 Zone as Dollar Rises Further
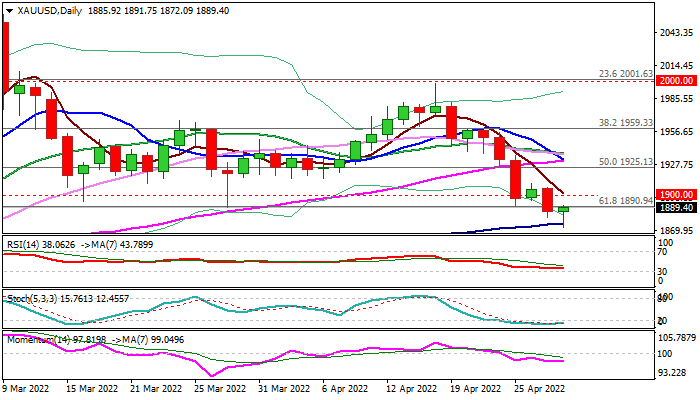
Spot gold fell to 10-week low on Thursday registering a firm break of psychological $1900 level and a marginal close below important technical support at $1890 (Fibo 61.8% of $1780/$2070 / lows of Mar 29 and Apr 25) on Wednesday that added to negative signals.
The yellow metal lost traction after recovery failed at $2000 barrier in mid-April and came under pressure from surging dollar on prospects for more aggressive Fed that hurt demand, along with lockdowns in China due to new wave of Omicron variant infections.
Probe below $1900/$1890 pivots cracked support at $1875 (100DMA) but need to register a clear break lower (after attacks at $1900 zone failed several times in past two months) to signal continuation of the bear-leg from $1998 and open way for extension towards $1848 (Fibo 76.4%), possibly to $1833 (200DMA).
Res: 1900; 1907; 1911; 1925.
Sup: 1875; 1872; 1848; 1833.
USD/JPY Surges Through 130 Barrier after Dovish BOJ
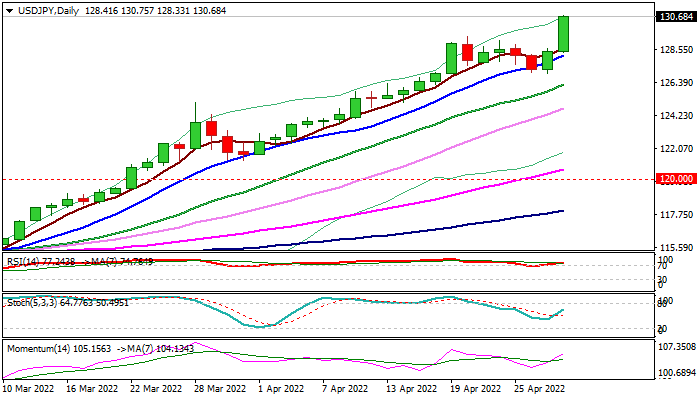
The USDJPY accelerated sharply higher on Thursday and broke above psychological 130 barrier, to hit 20-year high and test pivotal Fibo barrier at 130.65 (76.4% retracement of 1998/2011 147.68/75.55 downtrend.
The Japanese yen is in strong downtrend for over one year, with fresh increased pressure coming from the Bank of Japan’s decision to keep ultra-low interest rates and maintain its massive stimulus, diverging from its major peers which already started shifting towards tighter monetary policy.
The pair advanced nearly 1.7% in the Asian and early European session on Thursday, with sustained break above 130.00/65 pivots, to generate fresh bullish signal for further rally.
Technical studies on daily chart are in full bullish setup and support the action, along with overall dollar-supportive fundamentals, as geopolitical tensions rise and continue to prompt traders into safe-haven greenback.
US GDP data for the first quarter of 2022 are the key event today, with estimation for the US economy’s growth to reduce pace to 1.1% from 6.9% in Q4, however, previous data point to optimistic view that the economy would stay on recovery track.
This would add to positive signals for the greenback, which remains supported by expectations for the Fed’s aggressive approach to the monetary policy tightening in the coming months and safe-haven buying.
Bulls are on track for the second consecutive strong monthly advance and focus Jan 2002 high at 135.16, violation of which would unmask 1998 peak at 147.68.
Broken 130 level reverted to initial support, followed by previous high of Apr 20 at 129.40 and rising 10DMA (128.15).
Res: 130.92; 131.28; 131.86; 132.80.
Sup: 130.00; 129.40; 128.98; 128.33.
Bitcoin: Buying the Dip and Ready to Hold
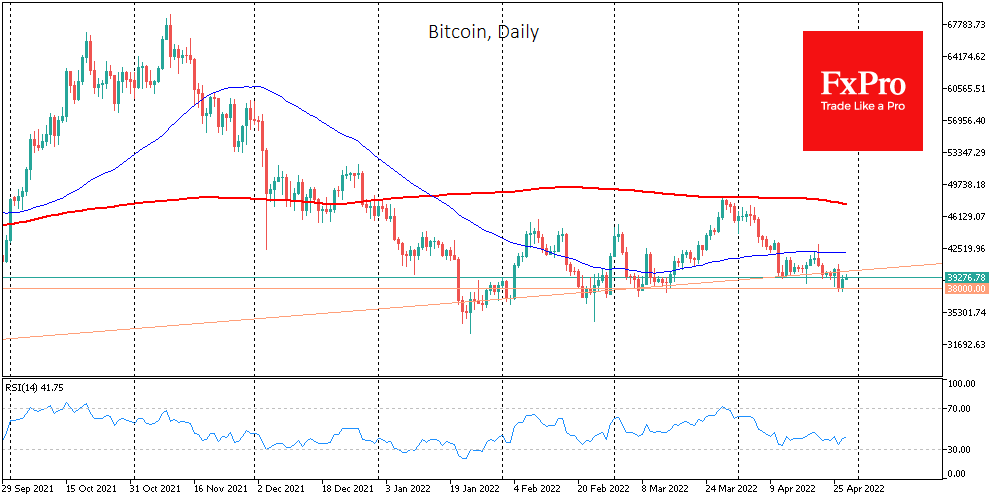
Bitcoin found buyers’ support Wednesday morning after touching levels below $38K, followed by a relatively calm rise to $39.4K as of Thursday morning with a strengthening of 2.4% in 24 hours. Ethereum added 1.4% over the same interval, with the other leading altcoins in the top 10 showing mixed dynamics, ranging from a 0.6% decline (XRP) to a 2% gain (Solana).
The cryptocurrency Fear & Greed Index was up 3 points to 24 by Thursday but remains in “extreme fear”.
Total cryptocurrency market capitalisation, according to CoinMarketCap, rose 1.6% overnight to $1.8 trillion. Bitcoin again finds itself one step ahead of the cryptocurrency market, being not only its largest representative but also its locomotive. Bitcoin’s dominance index has added 0.3% to 41.5%.
Short-term, Bitcoin has gained support on the decline to an important support area, withstanding an onslaught of sellers since late February. But at the same time, it remains below the support line of the last ten months, hinting at a pause in the decline but not a final victory for the buyers.
For its part, bitcoin has been helped by the US stock market, where buyers have stepped up on the S&P500’s decline in the February and March lows. The stock market is now acting as a guide for the first cryptocurrency.
However, it is hardly fair to say that the cryptocurrency market is entirely secondary. There are some reasonably internal solid drivers out there.
For example, bitcoin supply in the market has been falling steadily, reaching late 2018 levels, Arcane Research notes. Active BTC hoarding is causing a shortage in the market and pushing exchange prices upwards. Virtually, bitcoin holders are getting richer from these community tactics.
The crowd is buying back the decline to local lows and intends to hold bitcoin for some extended period.
Fort Worth in Texas was the first US city to start mining bitcoin at the initiative of a millennial mayor. In doing so, the city promises not to sell the coins.
US crypto investor Grayscale said it is considering entering the European market amid an expanding market for digital assets.
The mayor of Buenos Aires has called for blockchain technology to make tax collection more efficient.
US research firm NBER reported that 60% of Salvadorans stopped actively using the Chivo wallet after spending a welcome bonus in BTC. This result is called a failure of the bitcoin experiment.
The developers of the Cardano blockchain have increased the block size by 10%, to 88Kb. This should improve the bandwidth and performance of decentralised applications on the network.
WTI Futures Struggle to Extend Past 103 Mark, Outlook Neutral
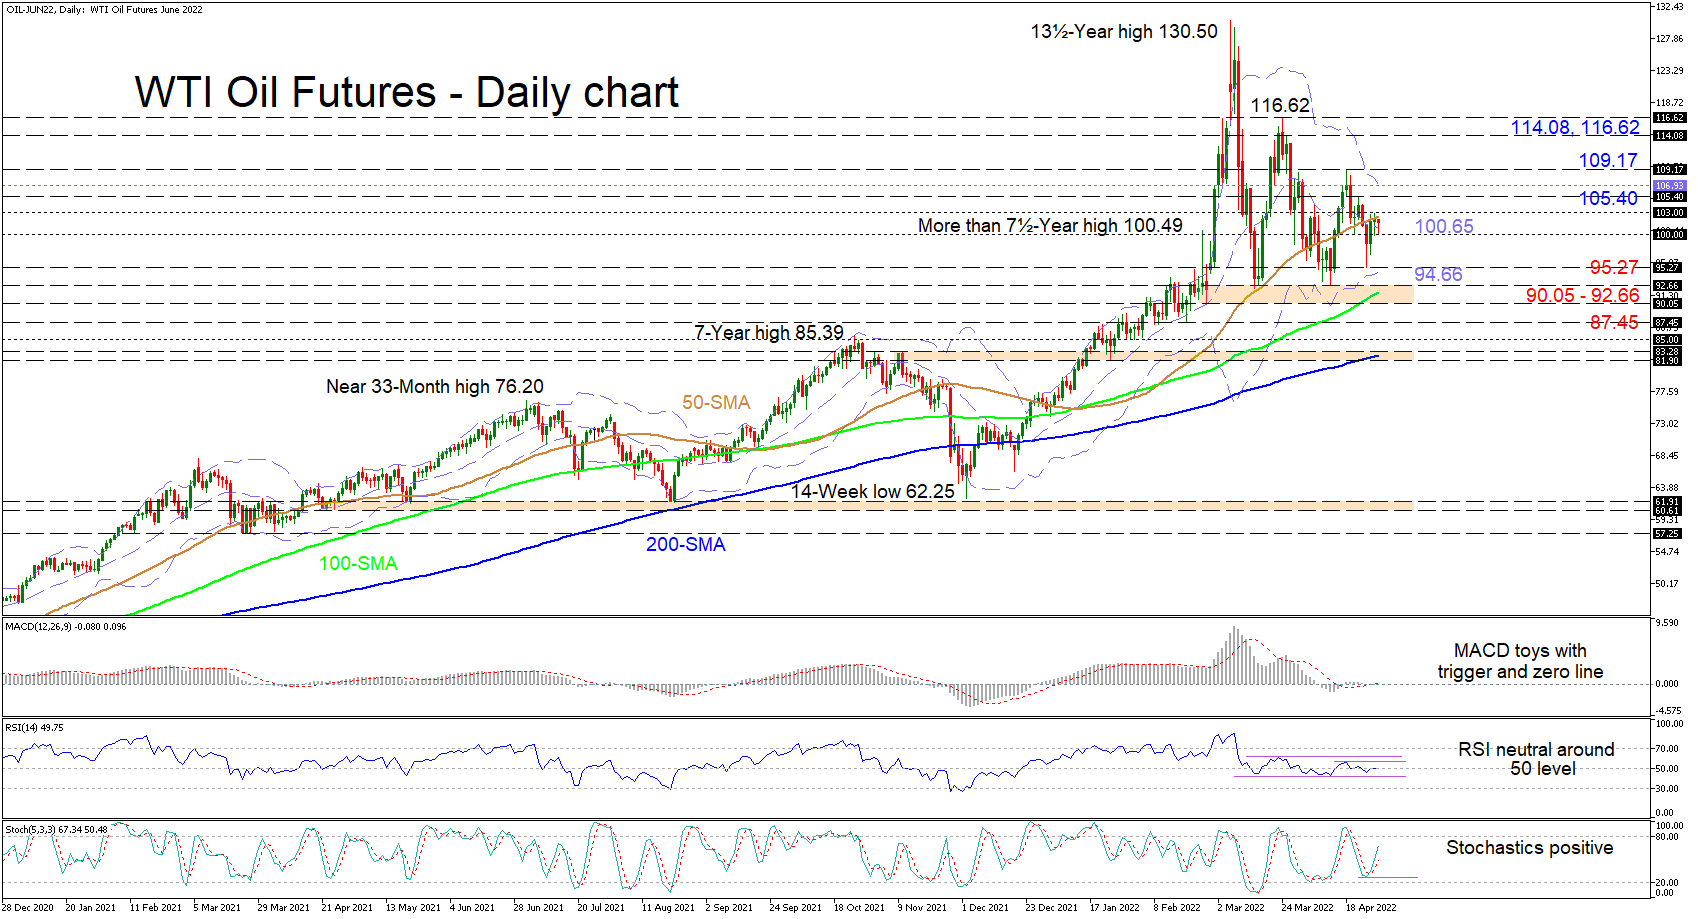
WTI oil futures are trading around the mid-Bollinger band, which is currently north of the 100.00 border, after the commodity found positive traction prior to reaching the lower Bollinger band. The climbing longer-term 100- and 200-day simple moving averages (SMAs) are defending the broader bullish structure, while the 50-day SMA has yet to reflect any dominance in negative forces.
The short-term oscillators are not indicating any definitive driving forces in the black liquid, endorsing a neutral tone for now. The MACD and the RSI, which are both static around their neutral thresholds, are not transmitting any directional messages, while the positively charged stochastic oscillator is promoting positive moves in the commodity.
Noteworthy, is the recent consolidation’s range, which is tightening with the price recording lower highs and higher lows. Furthermore, the squeezing of the lower and upper Bollinger bands is inferring that a surge in volatility is anticipated, which suggests a more profound move in the price may unfold in the near-term.
For positive developments to be rekindled, the price would need to overstep the 50-day SMA and the adjacent 103.00 barrier, which may then reveal the next resistance obstacle at 105.40. If bullish forces intensify, the price could then challenge the upper Bollinger band at 106.93 before confronting the 109.17 nearby high. Successfully recapturing the area beyond this high may cheer buyers to propel for the 114.08 resistance mark and the high of 116.62, recorded on March 24.
Alternatively, if the 50-day SMA and the 103.00 handle curb advances, immediate support could emanate from the mid-Bollinger band at 100.65 and the 100.00 border. Dropping lower, the price may then target the 95.27 trough and the lower Bollinger band beneath at 94.66. Next, the crucial 90.05-92.66 support section could put selling pressures to the test should sellers retain command. A break of this key barricade may then reel in the 87.45 trough.
Summarizing, WTI oil futures are exhibiting a neutral picture with a lack of directional impetus. That said, for a clearer direction to evolve, the price would need to either pilot past the 109.17 high or sink beyond the critical 90.05-92.66 support foundation.
Yuan extends down trend, USD/CNH pressing important resistance
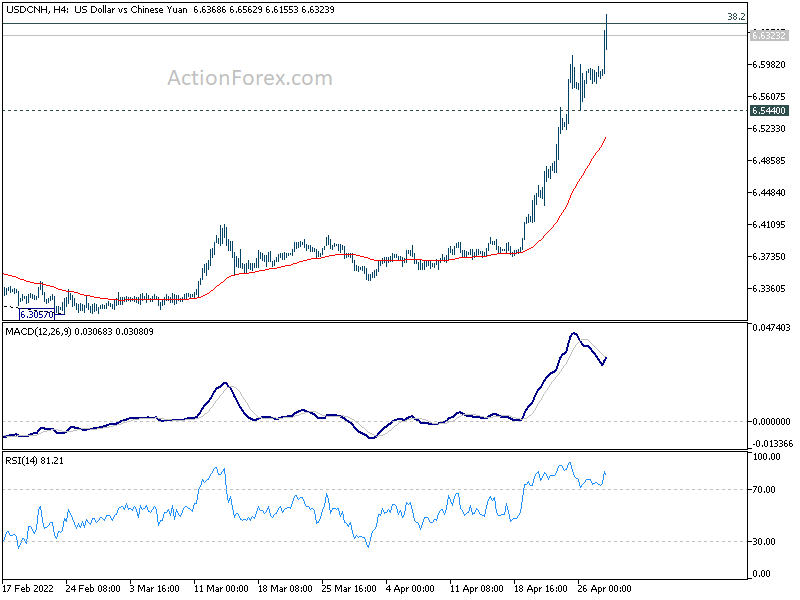
Offshore Chinese Yuan's decline resumes today with USD/CNH hitting as high as 6.637 so far. Earlier this week, PBoC announced to cut the foreign exchange reserve ratio by 100bps from 9% to 8%. That was aimed providing liquidity to stabilize exchange rate. But so far the impact was very brief.
Capital was seen flowing out of China in accelerated manner since march, due to divergence in policies with other major central bank. Russia invasion of Ukraine, and the risk of tough spread of tough Shanghai like lockdowns added additional uncertainty.
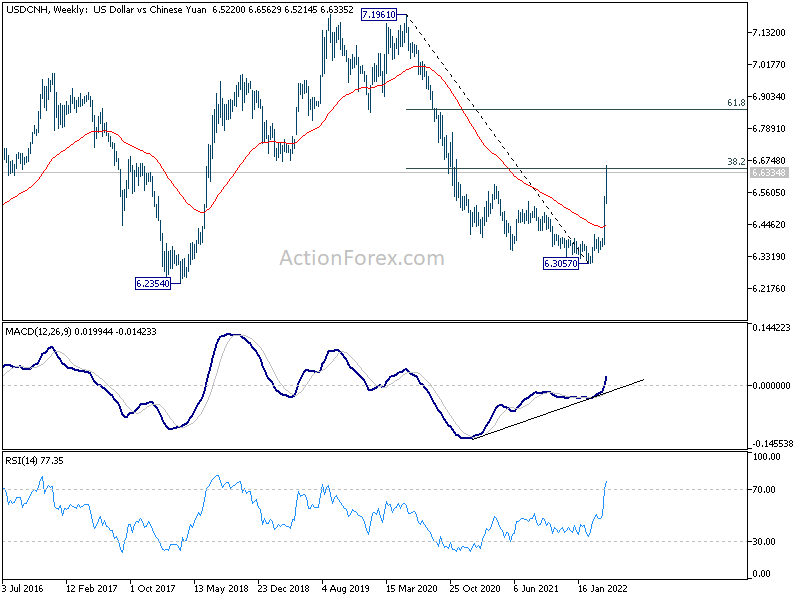
Nevertheless, technically, USD/CNH is now at an important resistance of 38.2% retracement of 7.1961 (2020 high) to 6.3057 (2022 low) at 6.6458. Strong resistance could be seen at the current level to cap upside. Break of 6.544 support would indicate short term topping. However, sustained break of 6.6458 would be a significant development, which could push USD/CNH further to 61.8% retracement at 6.8560.
EURUSD Crash Continues ahead of US GDP Data
American stocks rose on Wednesday as the earnings season continued. The Dow Jones index rose by 326 points while the Nasdaq 100 and S&P 500 rose by more than 1%. Companies that performed well were Microsoft, Visa, and Mastercard. Microsoft published strong earnings, helped by cloud computing. Visa, on the other hand, reported strong results as the travel industry rebounded. Spotify shares crashed by more than 10% even after the company’s business did well. Other top laggards were Boeing, Roku, Netflix, and Warner Bros Discovery.
The US dollar index continued rallying as global risks continued to escalate. Russia has already stopped supplying natural gas to Bulgaria and Poland and there are signs that it will end its supplies to other countries in Europe. Therefore, analysts expect that central banks like the ECB will be more cautious when it comes to hiking interest rates. Another risk is that the Covid-19 lockdowns are continuing in China. The key data to watch today will be the latest American GDP data. Economists expect the numbers to show that the American economy did well in the first quarter as the reopening process continued.
The economic calendar will have several important events on Thursday. Earlier on, the Bank of Japan delivered its interest rate decision. As was expected, the bank decided to leave its interest rate unchanged. It also hinted that it would intervene in the coming months as consumer inflation starts rising. In Europe, the European Commission will publish the latest consumer and industrial sentiment data. Economists expect these numbers will show that confidence declined in April as the cost of doing business rose. The other important data to watch will be the American consumer initial jobless claims and German inflation numbers.
EURUSD
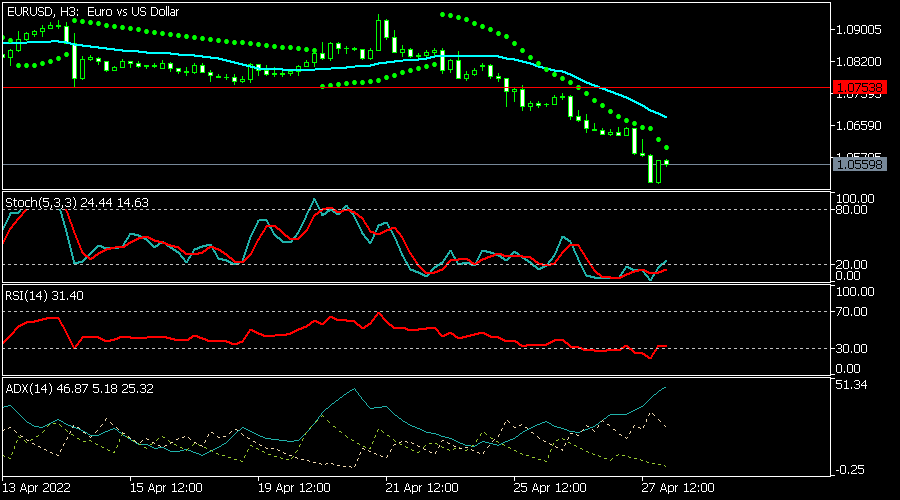
The EURUSD pair is hovering near its lowest level since 2017 as risks for the European economy continued. The Average Directional Index rose to a high of 46, which is a sign that the bearish trend is strong. The Stochastic oscillator and the Relative Strength Index have tilted upwards on the three-hour chart. It has also moved below the dots of the parabolic SAR and the 25-day moving average. The pair will likely keep falling today.
USDMXN
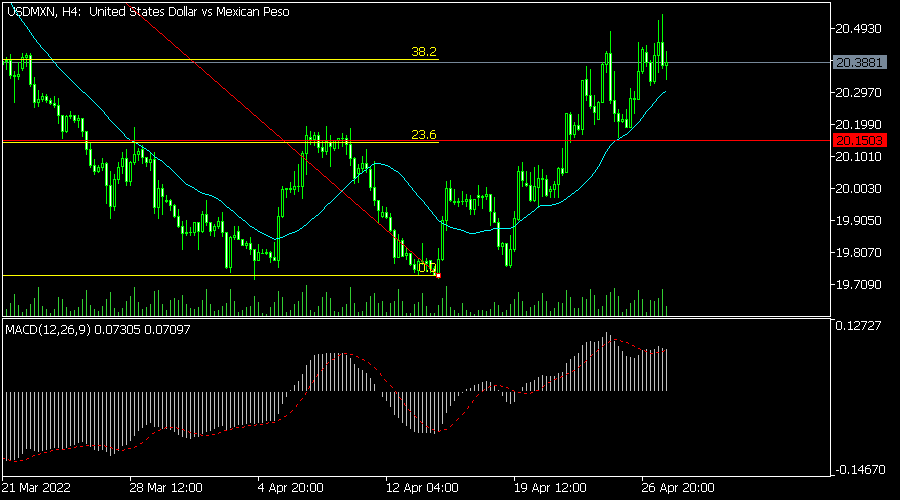
The USD/MXN pair continued rising as the strength of the US dollar continued. It rose to a high of 20.51, which was the highest level since March 21st. It has moved above the 25-day and 50-day moving averages. It has also moved to the 50% Fibonacci retracement level while the MACD has moved above the neutral level. The pair will likely keep rising as bulls target the key resistance at 20.60.
EURCAD
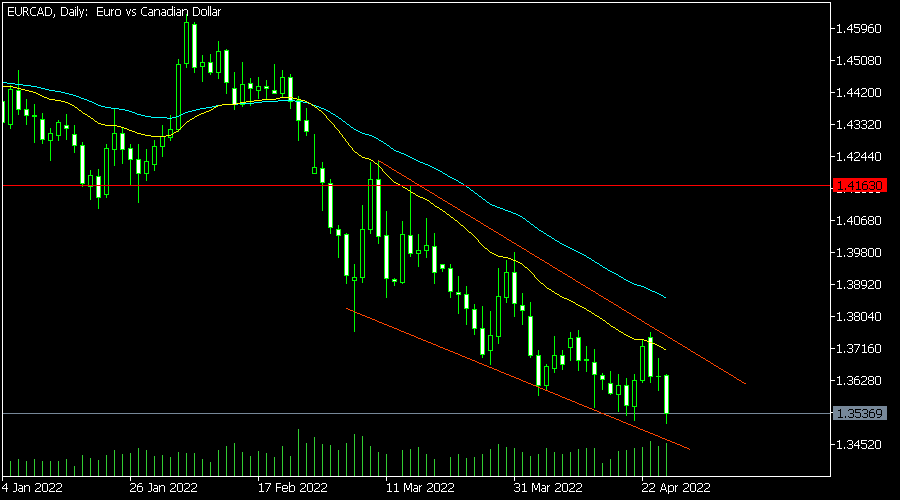
The EURCAD pair dropped to a low of 1.3536, which was the lowest point in years. The pair’s downward trend is supported by the 25-day and 50-day moving average. It also moved below the important support at 1.4163. It has also formed a falling wedge pattern that is shown in red. Therefore, while the downward trend may continue, there is a possibility that it will bounce back soon.
ECB de Guindos: Russia invasion casts a dark shadow over Europe
In remarks to a Committee of the European Parliament, ECB Vice President Luis de Guindos said, Russian invasion of Ukraine has "cast a dark shadow over" Europe, as a human tragedy and affecting the economy. Economic activity is expected to continue to growth this year, "albeit at a slower pace than was expected ". The war has "amplified the impact on consumer energy prices".
The surge in energy prices is "reducing demand and raising production costs" while the war is "weighing heavily on business and consumer confidence and has created new bottlenecks." These developments point to slower growth in the period ahead.
Prices increased will "most likely remain high over the coming months". Medium term inflation expectations indicates inflation ares around the 2% target. But, " inflation expectations have been rising in recent months though and initial signs of above-target revisions in those measures warrant close monitoring."
He reiterated that the APP will be concluded in Q3 and changes to interest rates will follow "some time after" the end of the net purchases, and will be "gradual".
US Oil Bounces Off Support
WTI crude found support from a lower-than-expected increase in stockpiles. The price has held well around 94.00 at the base of the flag consolidation from the daily chart.
The uptrend is still intact and the bulls may see the pattern as an opportunity to accumulate. The RSI’s double bottom in the oversold zone attracted some buying interest.
105.00 is the first resistance from the recent sell-off. Then 109.00 is a major ceiling where a breakout could prompt the last sellers to exit and resume the rally in the medium-term.
USD/CAD Tests Key Resistance
The Canadian dollar struggles as risk appetite remains fragile, in regard to commodity currencies. The bulls did not waste time after they pushed through the supply zone near 1.2650.
A combination of short-covering and momentum buying dialed-up volatility. 1.2870 near March’s highs is a major hurdle and its breach could pave the way for a bullish reversal above 1.2950.
Nonetheless, the RSI’s bearish divergence suggests that the rally could be losing steam in the near term. 1.2690 is the first support for buyers to regroup.