

Sample Category Title
Sunset Market Commentary
Markets
Russia yesterday moved to a next phase in the war of retaliatory economic sanctions, cutting of gas supply to Poland and Bulgaria as they refuse to pay in ruble. However, the market reaction was ‘remarkably’ guarded. Risk sentiment even improvement after yesterday’s outright risk-off session. European equities trade with modest gains (0.0%/0.5%). US indices also regained an, albeit limited, part of yesterday’s steep losses. Positive earnings from bellwethers (Microsoft, Daimler amongst others) apparently supported some dip-buying. European gas prices jumped sharply higher at the open, but intraday gains gradually eased. Crude oil also maintains most of yesterday’s gain but near $104 p/b, Brent currently trades in what has become ‘familiar’ territory. Other commodities like iron ore or copper stabilized or gain slightly. Maybe the explanation is a bit more positive as it might be (partially) inspired by China’s intentions to engage in big infrastructure projects to support ailing economic growth. Aside from a more constructive equity performance, interest rate markets also entered calmer waters. After tumbling sharply lower yesterday, the US yield curve succeed a modest bear flattening trend with the 2-y yield rising 4.5 bps and the 30-y gaining 2.5 bp. There is no Fed speak due to the black-out period ahead of next week’s policy meeting and visibility on growth and inflation for sure didn’t improve. However, after yesterday’s correction, markets concluded that there is no profound reason yet to question the Fed guidance on aggressive policy frontloading. German yields, which decline less than their US counterparts yesterday, show a bull flattening trend with yields are ceding up 5.5 bps (2-y/5-y) to 1.5 bp (30-y). The escalation in economic sanctions between Russia and the US apparently causes further uncertainty on decisive ECB policy action. It also doesn’t help peripheral bond markets. In a daily perspective, widening remains modest. However, at 177 bps the 10-y Italian spread is near the highest level since June 2020.
No change of trend on the FX market. The dollar continues to shine with the DXY index testing the corona top at 103. At the same time, the picture of the euro looks ever more ugly. EUR/USD fiercely cleared the previous YTD low at 1.0636, currently trading at 1.0560, the lowest level since March 2017. The EUR/USD 1.0341 (2017 low) and even the parity level are looming on the horizon. After a brief setback, USD/JPY also resumes its uptrend (128.1). As investors are counting down to tomorrow’s BoJ policy decision. Sterling remains in the defensive as cable (1.255) set a new correction low, but outperforms an even weaker euro (EUR/GBP 0.841). In CE markets, the zloty (EUR/PLN 4.70) and Czech krone (EUR/CZK 24.5) regain slight ground after yesterday’s setback. The forint underperforms with EUR/HUF testing the 380/382 resistance area.News Headlines
The German government cut the 2022 outlook from 3.6% to 2.2%, a move that reflects the impact of soaring prices on consumers and companies, burdened by uncertainty from the war in Ukraine. Growth is expected to pick up marginally in 2023 to 2.5%. Germany’s Economy Ministry predicts inflation to average 6.1% this year before slowing down to 2.8% in 2023. Both growth and inflation dynamics depend largely on geopolitical developments. Russia cut off gas flows to Poland and Bulgaria and threatened to do the same with other countries labeled “unfriendly”. This includes Germany and, if targeted, may affect output and prices dramatically in a stagflationary way. German inflation numbers are due tomorrow while Q1 GDP numbers will be published on Friday.
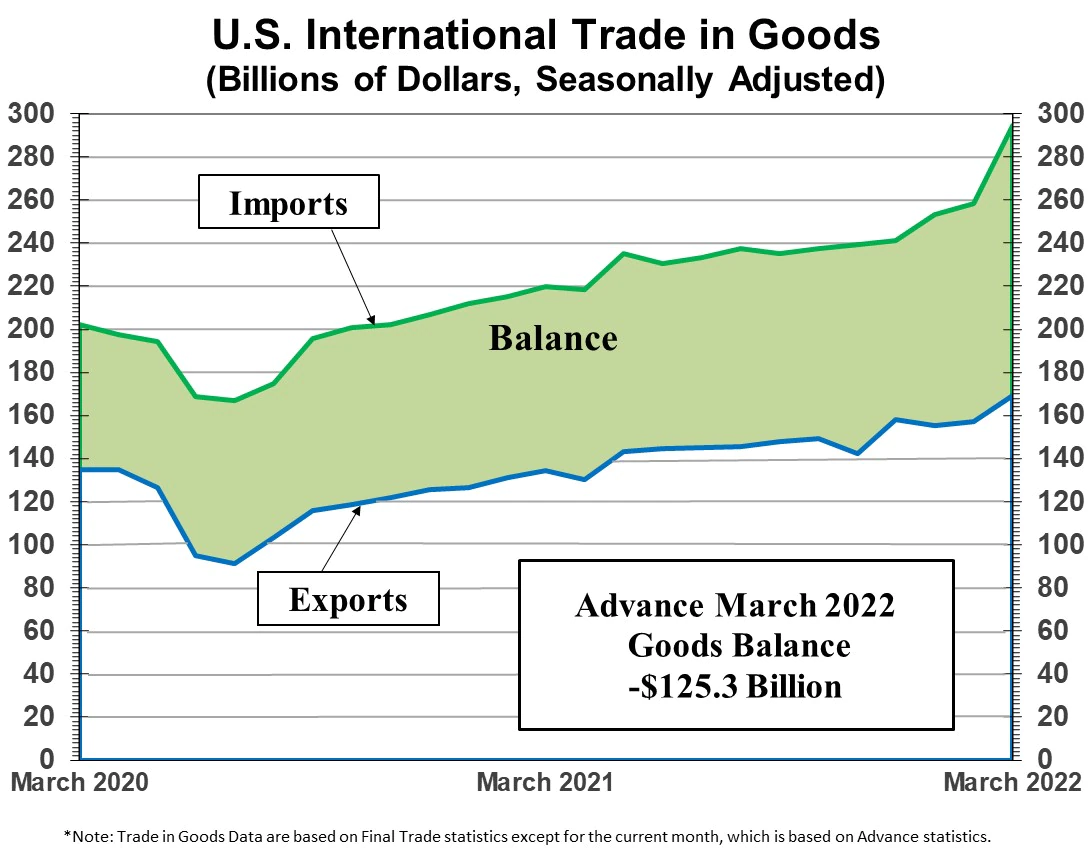
The US’s goods trade deficit soared to a record high in March. The balance came in at -$125.3bn, the biggest deficit ever recorded and eclipsing the previous record in January of -$107bn. At first glance, this may negatively affect Q1 GDP numbers (due tomorrow) through lower net-exports. Another batch of US data, however, showed a strong inventory buildup in both February (2.6% wholesale, 1.5% retail) and March (2.3% and 2%), contributing positively to GDP. It suggests the US seized the opportunity of restocking via imports before new snarls hit supply chains (eg. China lockdowns).
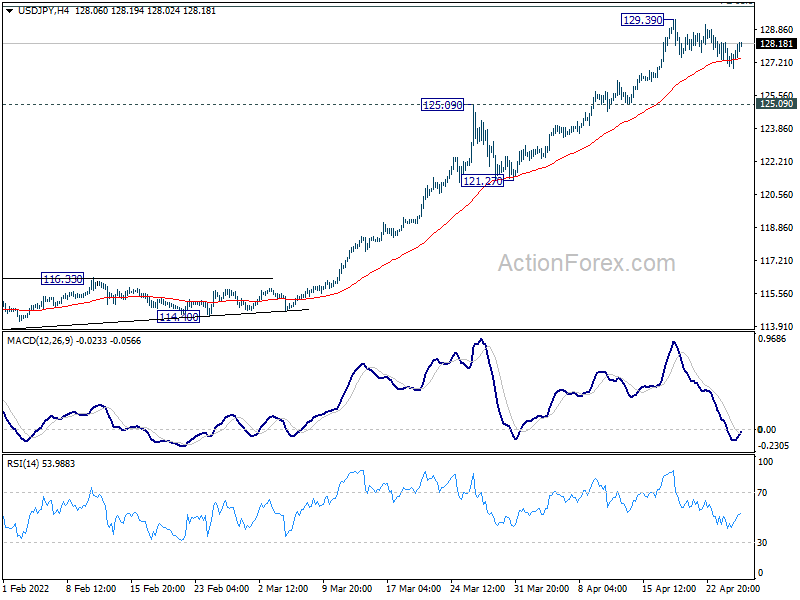
USD/JPY Mid-Day Outlook
Daily Pivots: (S1) 126.76; (P) 127.49; (R1) 127.96; More...
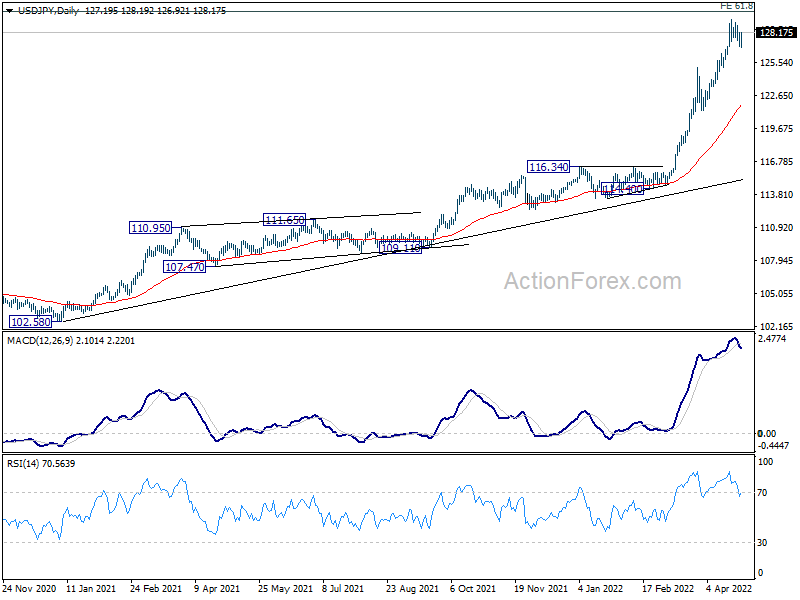
Intraday bias in USD/JPY remains neutral as consolidation form 129.39 is still extending. Deeper retreat could be seen but downside should be contained above 125.09 resistance turned support to bring another rally. On the upside, above 129.39 will target 130.04 long term projection level next.
In the bigger picture, the break of 125.85 resistance (2015 high) suggests that whole up trend from 75.56 (2011 low) is resuming. Further rise should be seen to 61.8% projection of 75.56 (2011 low) to 125.85 (2015 high) from 98.97 at 130.04. Sustained break there wave the way to 147.68 (1998 high). For now, this will remain the favored case as long as 121.27 support holds.
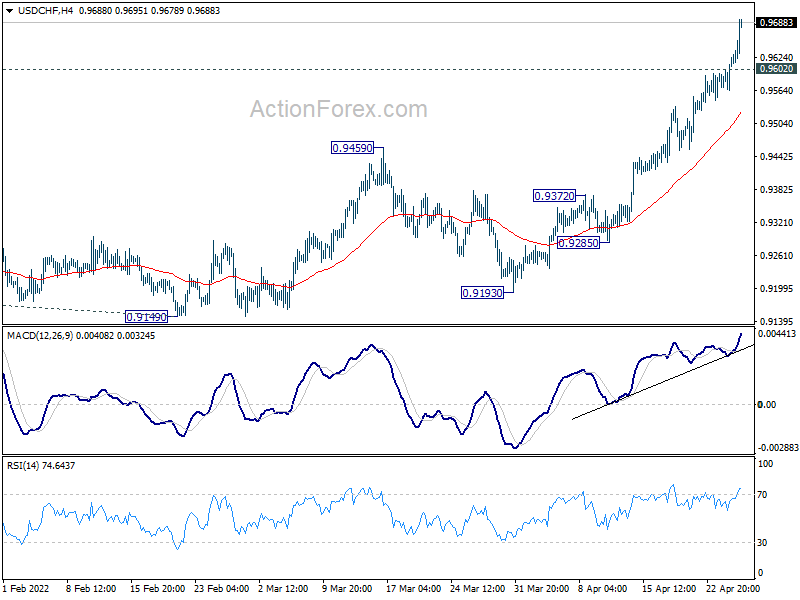
USD/CHF Mid-Day Outlook
Daily Pivots: (S1) 0.9584; (P) 0.9606; (R1) 0.9647; More....
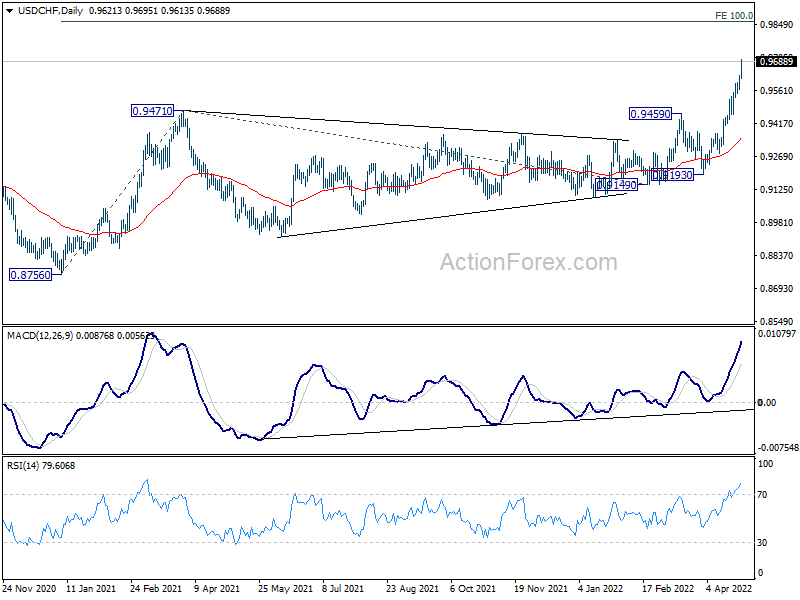
USD/CHF's rally is still in progress and outlook is unchanged. Intraday bias remains on the upside for next projection level at 0.9864. On the downside, below 0.9602 minor support will turn intraday bias neutral and bring consolidations. But downside of retreat should be contained well above 0.9372 resistance turned support to bring another rally.
In the bigger picture, down trend from 1.0342 (2016 high) should have completed with three waves down to 0.8756 (2021 low) already. Rise from 0.8756 is likely a medium term up trend of its own. Next target is 100% projection of 0.8756 to 0.9471 from 0.9149 at 0.9864. This will now remain the favored case as long as 0.9459 resistance turned support holds.
GBP/USD Mid-Day Outlook
Daily Pivots: (S1) 1.2507; (P) 1.2639; (R1) 1.2708; More...
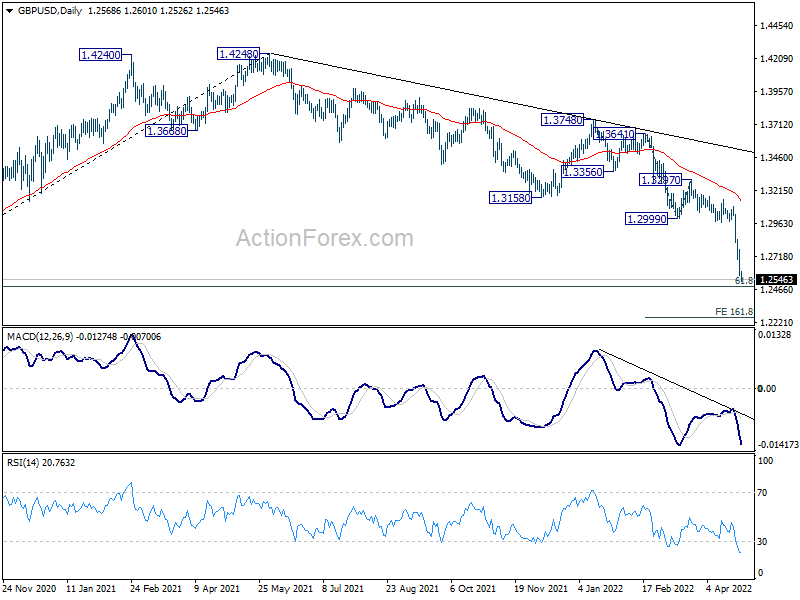
GBP/USD's down trend is extending and outlook is unchanged. Intraday bias remains on the downside for 161.8% projection of 1.3641 to 1.2999 from 1.3297 at 1.2258. On the upside, above 1.2696 minor resistance will turn intraday bias neutral and bring consolidation first, before staging another decline.
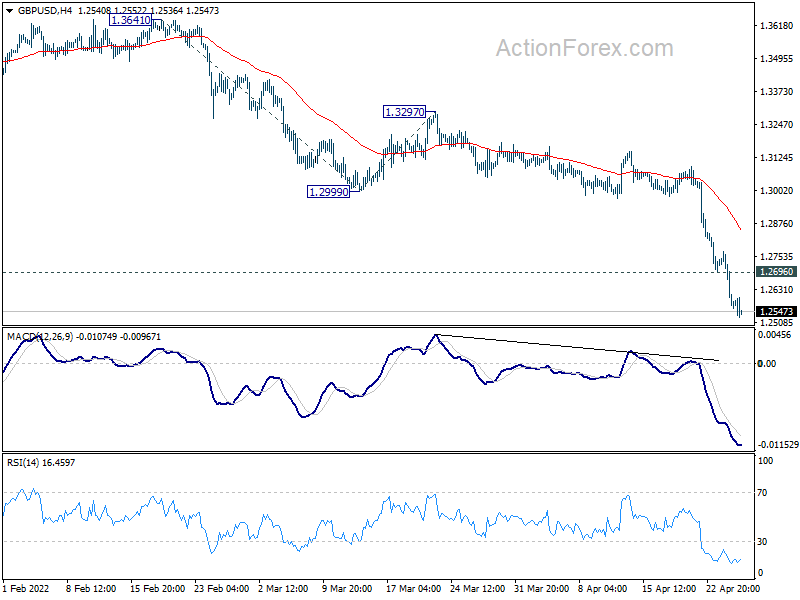
In the bigger picture, rise from 1.1409 (2020 low) has completed at 1.4248, ahead 1.4376 long term resistance (2018 high). Decline from 1.4248 could still be a corrective move, or it could be the start of a long term down trend. In either case, deeper decline would be seen back to 61.8% retracement of 2.1161 to 1.1409 at 1.2493. In any case, break of 1.3158 support turned resistance is needed to be the first sign of medium term bottoming. Otherwise, outlook will stay bearish in case of rebound.
EUR/USD Mid-Day Outlook
Daily Pivots: (S1) 1.0602; (P) 1.0671 (R1) 1.0705; More...
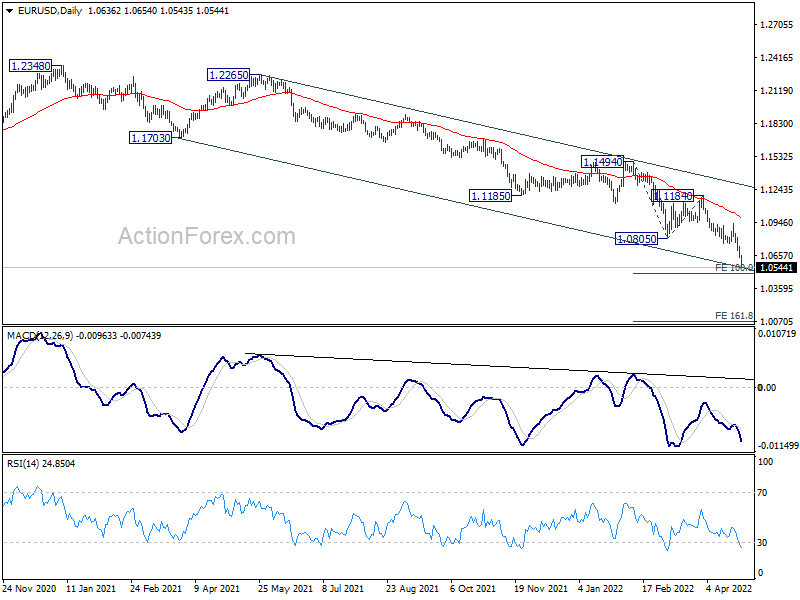
Intraday bias in EUR/USD remains on the downside for 100% projection of 1.1494 to 1.0805 from 1.1184 at 1.0495. Firm break there will pave the way to 161.8% projection at 1.0069. On the upside, above 1.0654 minor resistance will turn bias neutral and bring consolidations. But upside should be limited by 1.0756 support turned resistance to bring fall resumption.
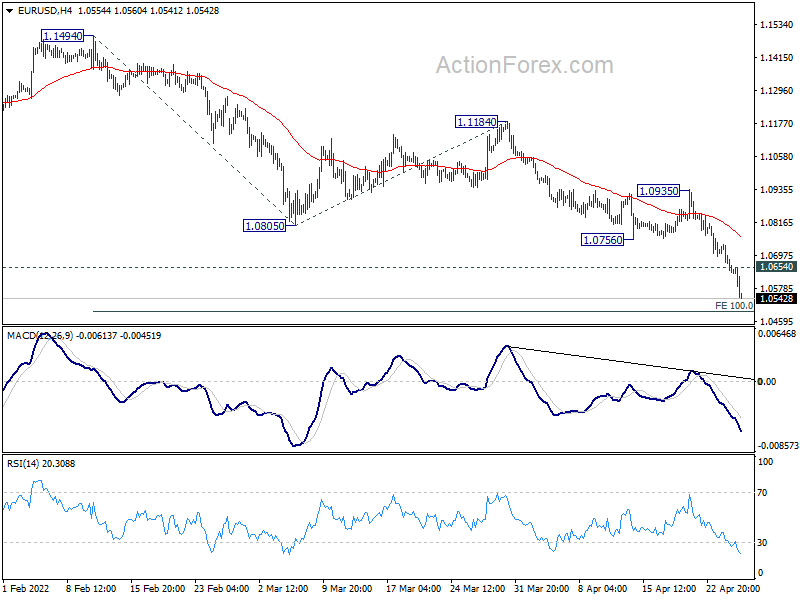
In the bigger picture, the decline from 1.2348 (2021 high) is expected to continue as long as 1.1185 support turned resistance holds. Firm break of 1.0635 (2020 low) will raise the chance of long term down trend resumption and target a retest on 1.0339 (2017 low) next. Nevertheless, break of 1.1185 will maintain medium term neutral outlook, and extending term range trading first.
Euro Decline Accelerates Again, Dollar Looking Strong
Selloff in Euro accelerates again today, as Germany benchmark 10-year yield tumbles back below 0.8 handle. Swiss Franc and Sterling are also the weaker ones. Australian Dollar is supported by stronger than expected CPI reading, but looks rather vulnerable into US session. Indeed the greenback is probably ready to power up again, including against commodity currencies and even Yen.
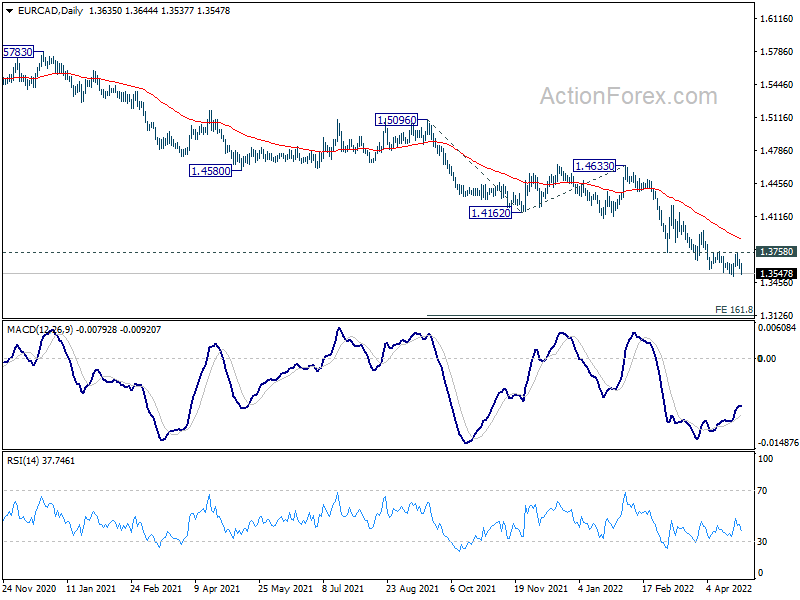
Technically, EUR/CAD will be a focus as it's heading back to 1.3517 temporary low. Firm break there will resume larger down trend to 161.8% projection of 1.5096 to 1.4162 from 1.4633 at 1.3122. At the same time, break of 1.4687 support in EUR/AUD will also bring retest of 1.4318 low, and solidify Euro's selloff against commodity currencies.
In Europe, at the time of writing, FTSE is up 0.57%. DAX is up 0.08%. CAC is up 0.26%. Germany 10-year yield is down -0.031 at 0.787. Earlier in Asia, Nikkei dropped -1.17%. Hong Kong HSI rose 0.06%. China Shanghai SSE rose 2.49%. Singapore Strait times dropped -0.04%. Japan 10-year JGB yield rose 0.0026 to 0.250.
US trade deficit widened to USD -125.3B in Mar
US goods exports rose USD 11.4B over the month to USD 169.3B in March. Goods imports rose USD 30.3B to USD 294.6B. Trade deficit came in at USD -125.3B, versus expectation of USD -105.0B.
Wholesale inventories rose2.3% mom to USD 837.7B. Retail inventories rose 2.0% mom to USD 684.3B.
Germany economy ministry cut 2022 GDP growth forecast sharply to 2.2%
Germany's economy ministry cuts 2022 GDP growth forecast to 2.2%, down from January's projection of 3.6%. Nevertheless, 2023 GDP growth forecast is upgraded slightly from 2.3% to 2.5%. It expects Russia's invasion of Ukraine, resulted sanctions and higher energy prices will weigh on output.
Inflation is forecast to be at 6.1% in 2022 and 2.8% in 2023, on rising energy prices and consumer prices.
Germany Gfk consumer sentiment plunged to -26.5, new historic low
Germany Gfk consumer sentiment for May dropped significantly from -15.7 to -26.5, well below expectation of -15.7. That's the second month of decline, as well as a new historic low.
Looking at some details for April, economic expectations plunged from -8.9 to -16.4. Income expectations dropped from -22.1 to -31.3. Propensity to buy dropped from -2.1 to -10.6.
"The war in Ukraine and rates of high inflation have dealt a severe blow to consumer sentiment. This means that hopes of a recovery from the easing of pandemic-related restrictions have finally been dashed," explains Rolf Bürkl, GfK consumer expert.
Australia CPI accelerated to 2.1% qoq, 5.1% yoy, highest since 2000
Australia CPI rose 2.1% qoq in Q1, accelerated from Q3's 1.3% qoq, above expectation of 1.7% qoq. For the 12-month period, CPI accelerated to 5.1% yoy, up from 3.5% yoy, above expectation of 4.6% yoy. RBA trimmed mean CPI also accelerated from 2.6% yoy to 3.7% yoy, above expectation of 3.4% yoy.
Head of Prices Statistics at the ABS, Michelle Marquardt, said "The CPI recorded its largest quarterly and annual rises since the introduction of the goods and services tax (GST) (in 2000)"
"Strong demand combined with material and labour supply disruptions throughout the year resulted in the highest annual inflation for new dwellings since the introduction of the GST. Annual price inflation for automotive fuel was the highest since the 1990 Iraqi invasion of Kuwait."
Marquardt said: "Annual trimmed mean inflation was the highest since 2009. This reflected the broad-based nature of price rises, as the impacts of supply disruptions, rising shipping costs and other global and domestic inflationary factors flowed through the economy."
GBP/CAD extending down trend towards 2016 low
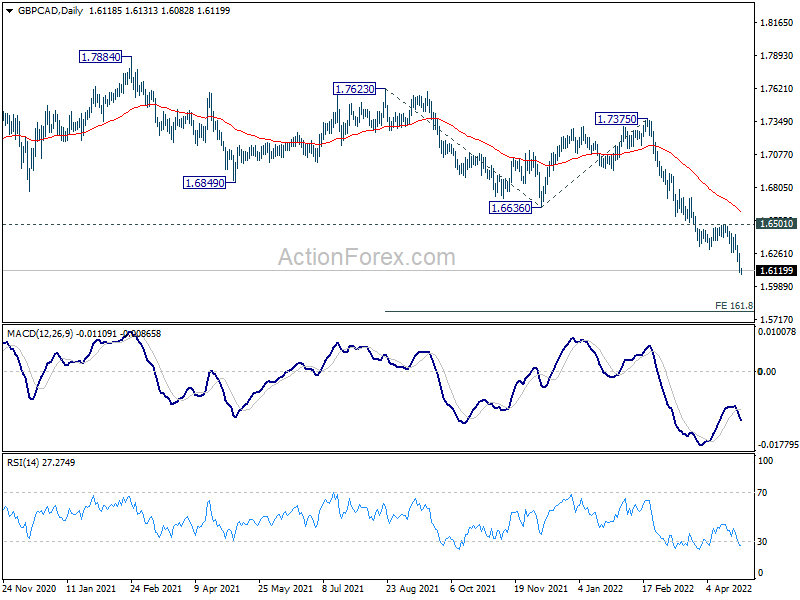
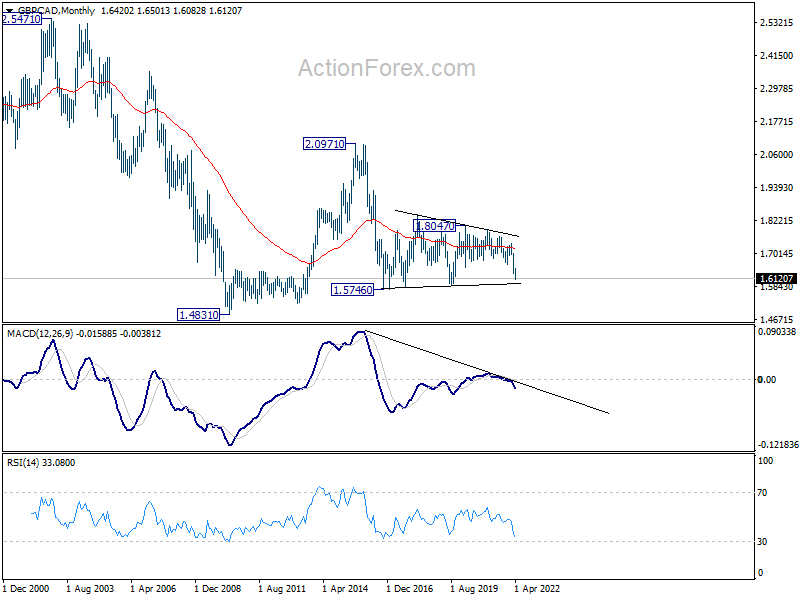
GBP/CAD's down trend continues this week on broad based selloff in Sterling, while Canadian Dollar has been relatively resilient. Current decline should target 161.8% projection of 1.7623 to 1.6636 from 1.7375 at 1.5778. This lies inside key long term support zone between 1.5746 (2016 low) and 1.5875 (2019 low).
The question is whether such 1.5746/5875 support zone would hold. If not, that would firstly mark the resume of the down trend from 2.0971 (2015 high). More importantly, that would also raise the chance of resumption of down trend from 2.5471 (2002 high) through 1.4831 (2010 low).
EUR/USD Mid-Day Outlook
Daily Pivots: (S1) 1.0602; (P) 1.0671 (R1) 1.0705; More...
Intraday bias in EUR/USD remains on the downside for 100% projection of 1.1494 to 1.0805 from 1.1184 at 1.0495. Firm break there will pave the way to 161.8% projection at 1.0069. On the upside, above 1.0654 minor resistance will turn bias neutral and bring consolidations. But upside should be limited by 1.0756 support turned resistance to bring fall resumption.
In the bigger picture, the decline from 1.2348 (2021 high) is expected to continue as long as 1.1185 support turned resistance holds. Firm break of 1.0635 (2020 low) will raise the chance of long term down trend resumption and target a retest on 1.0339 (2017 low) next. Nevertheless, break of 1.1185 will maintain medium term neutral outlook, and extending term range trading first.
Economic Indicators Update
| GMT | Ccy | Events | Actual | Forecast | Previous | Revised |
|---|---|---|---|---|---|---|
| 01:30 | AUD | CPI Q/Q Q1 | 2.10% | 1.70% | 1.30% | |
| 01:30 | AUD | CPI Y/Y Q1 | 5.10% | 4.60% | 3.50% | |
| 01:30 | AUD | RBA Trimmed Mean CPI Q/Q Q1 | 1.40% | 1.20% | 1.00% | |
| 01:30 | AUD | RBA Trimmed Mean CPI Y/Y Q1 | 3.70% | 3.40% | 2.60% | |
| 06:00 | EUR | Germany Gfk Consumer Confidence May | -26.5 | -15.7 | -15.5 | -15.7 |
| 08:00 | CHF | Credit Suisse Economic Expectations Apr | -51.6 | -27.8 | ||
| 12:30 | USD | Goods Trade Balance (USD) Mar P | -125.3B | -105.0B | -106.6B | |
| 12:30 | USD | Wholesale Inventories Mar P | 2.30% | 2.30% | 2.50% | |
| 14:00 | USD | Pending Home Sales M/M Mar | -1.00% | -4.10% | ||
| 14:30 | USD | Crude Oil Inventories | 0.1M | -8.0M |
Gold Sellers Look to Drive the Precious Metal Lower
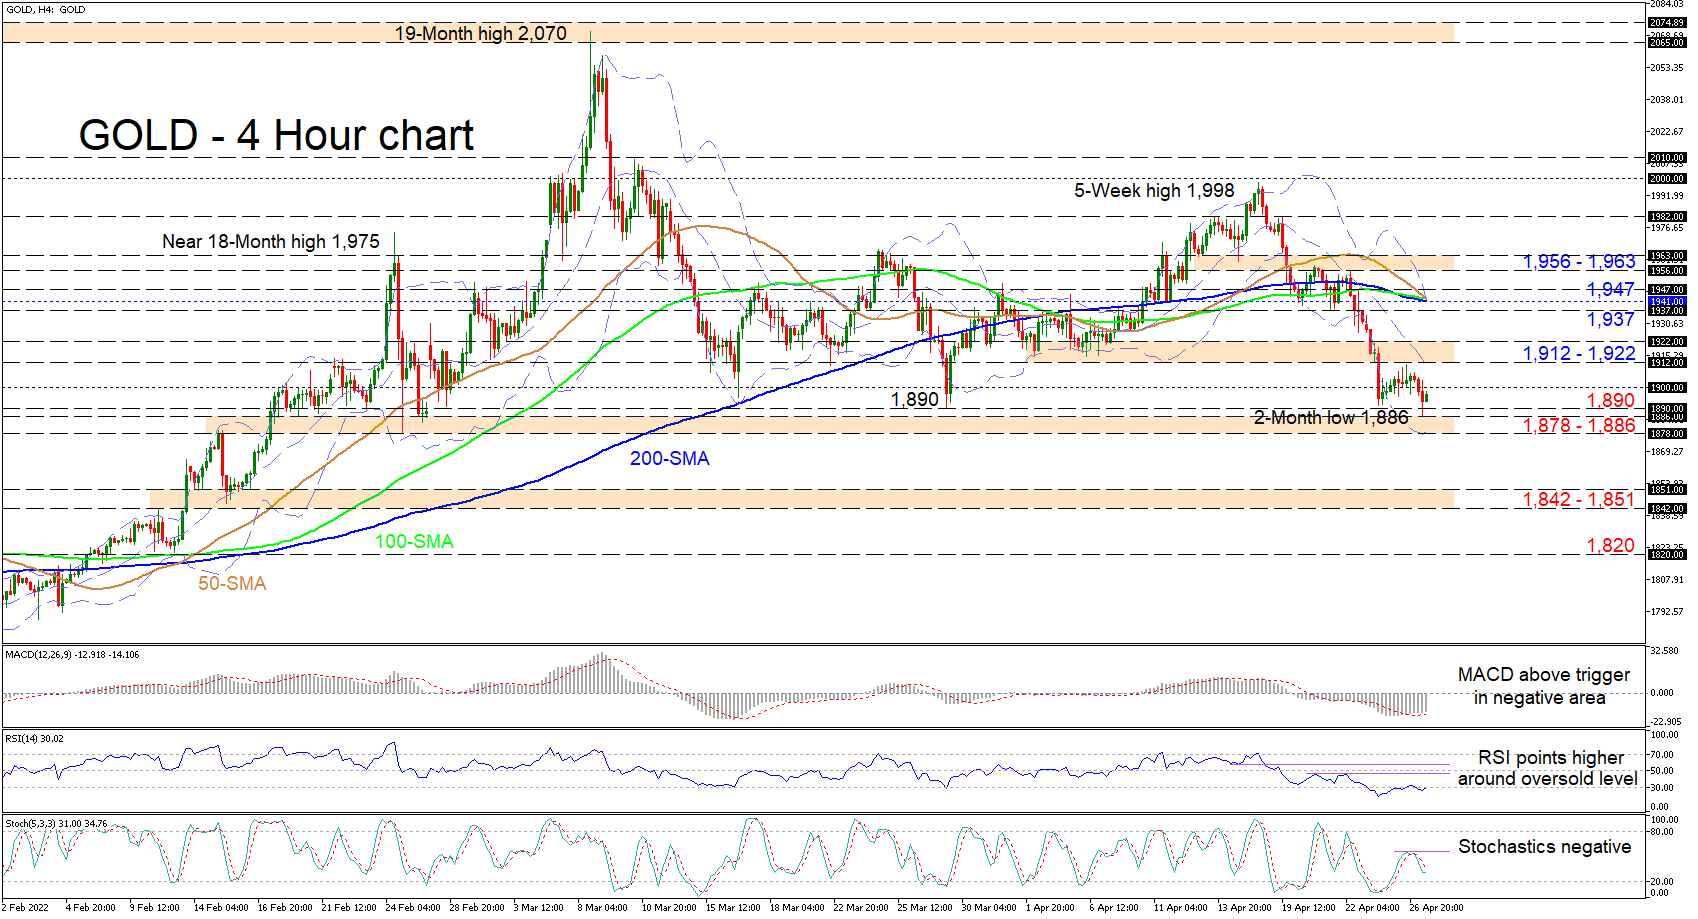
Gold’s one-week decline from the 2,000 price vicinity has steered the commodity slightly beneath the 1,900 handle. The rolling over of the simple moving averages (SMAs), and the near completion of bearish crossovers of the longer-term 200-period SMA by the 50- and 100-period SMAs, are signals, which endorse the bearish trend in the yellow metal.
Presently, the short-term oscillators are suggesting that buyers are fighting to overturn the bearish mood in the commodity. The MACD, south of the zero threshold, is hovering above its upward creeping red trigger line, while the now pointing higher RSI, is flirting with the 30 oversold barrier. Meanwhile, the negative charge in the stochastic oscillator is a bit shaky as the %K line has flattened beneath its %D line.
For the recent descent to intensify, the price would need to simultaneously dive past the March trough of 1,890 and the 1,878-1,886 support base that stretches back to mid-February. Extending beyond the lower Bollinger band, which is contained in this foundation, the commodity could then target the 1,842-1,851 barricade before sinking to challenge the 1,820 trough, recorded on February 11.
Alternatively, if buying interest picks up and pushes the price over the 1,900 hurdle, the bulls could then jump to test the 1,912-1,922 resistance border, which took shape around the early part of April, and includes the mid-Bollinger band. If buying pressures endure, buyers could be encouraged to challenge the resistance section between the 1,937 and 1,947 levels, fortified by the SMAs.
Summarizing, gold is exhibiting a negative bearing, which could significantly intensify with a break below the 1,878-1,886 support.
Germany economy ministry cut 2022 GDP growth forecast sharply to 2.2%
Germany's economy ministry cuts 2022 GDP growth forecast to 2.2%, down from January's projection of 3.6%. Nevertheless, 2023 GDP growth forecast is upgraded slightly from 2.3% to 2.5%. It expects Russia's invasion of Ukraine, resulted sanctions and higher energy prices will weigh on output.
Inflation is forecast to be at 6.1% in 2022 and 2.8% in 2023, on rising energy prices and consumer prices.
US trade deficit widened to USD 125.3B in Mar
US goods exports rose USD 11.4B over the month to USD 169.3B in March. Goods imports rose USD 30.3B to USD 294.6B. Trade deficit came in at USD -125.3B, versus expectation of USD -105.0B.
Wholesale inventories rose2.3% mom to USD 837.7B. Retail inventories rose 2.0% mom to USD 684.3B.
EUR/USD: Running Out of Chart
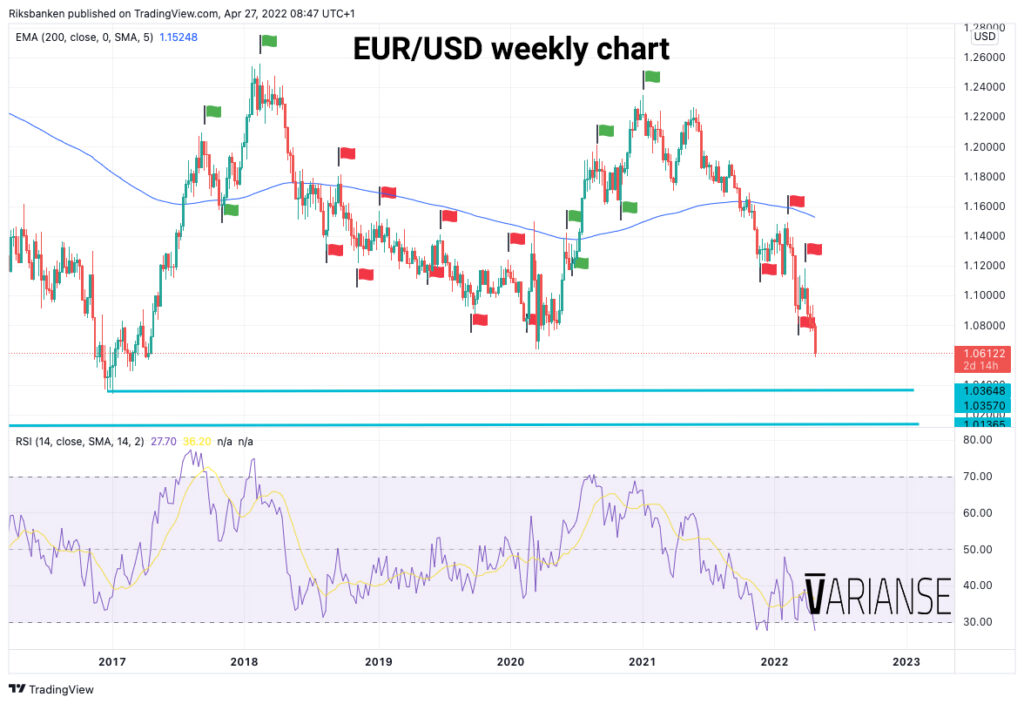
Things are bad when there is a need to look far into the past to draw support lines. EUR/USD is no exception in that regard. At the time of writing, EUR/USD had touched 1.05856 - its lowest level since April 2017. Pummelled by escalating events related to war in Ukraine, further lockdown fears in China, and expectations of aggressive tightening from the US Federal Reserve, the single currency has fallen by nearly 1.7% so far this week and is heading toward its 4th consecutive week of declines.
Sellers didn’t even blink as EUR/USD slid below the March 2020 low of 1.06361. Now will certainly be eyeing the 1.04, followed by the January 2017 low of 1.034 level as the next area of support. If the latter fails to hold, the next clear support level looks to be at the 1.0195 region, which acted as prior resistance back in July 2002. That said, none of these support levels seem to be places of quick rejection. The price history also feels a bit stale in the current market context.
Last week, I highlighted that it would take more than words from the European Central Bank (ECB) to lift EUR/USD. Recent developments suggest that even a quicker end to asset purchases and a clear signal of higher policy rates from the ECB may only have a marginal impact on EUR/USD. Maybe enough to stem further declines, but possibly not to the degree that would for a wholesale revaluation higher in EUR/USD. No action from the ECB, on the other hand, could spell bigger trouble for EUR/USD down the line.
Shifting market sentiment around the EUR/USD won’t be easy. Although the currency has dropped a great deal, the fall has been relatively orderly versus the parabolic decline that might suggest a quick bounce back. Dislodging the current negative market sentiment toward the pair may require price to smash above the last swing high of 1.09364, before buyers are convinced of a bigger move higher. Until then, traders make sure you don’t run out of chart history to reference.