

Sample Category Title
GBP/USD Daily Outlook
Daily Pivots: (S1) 1.2679; (P) 1.2762; (R1) 1.2826; More...
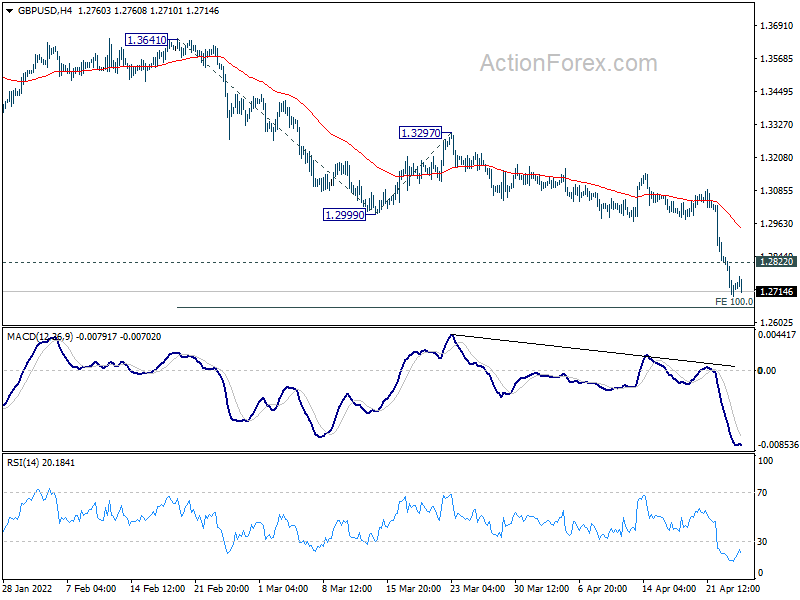
Intraday bias in GBP/USD remains on the downside for 100% projection of 1.3641 to 1.2999 from 1.3297 at 1.2655. Sustained break there will target 161.8% projection at 1.2258. On the upside, above 1.2822 minor resistance will turn intraday bias neutral and bring consolidation first, before staging another decline.
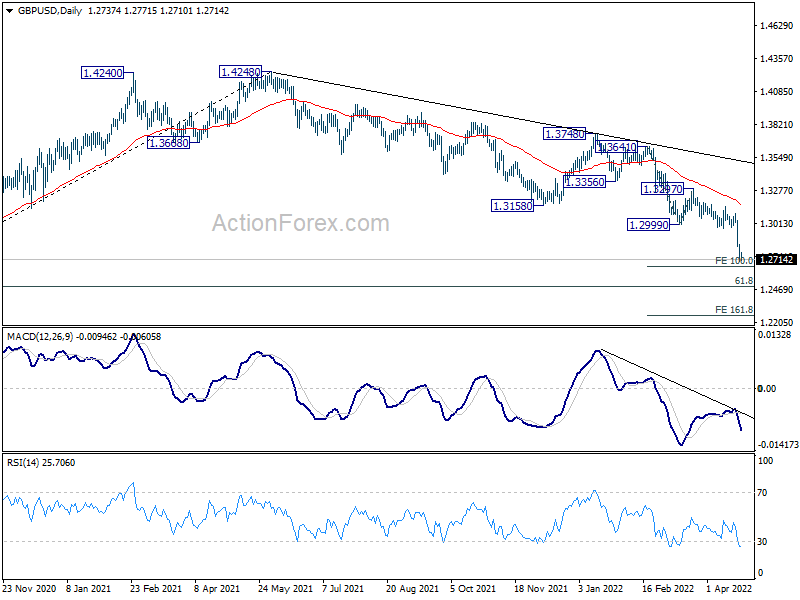
In the bigger picture, rise from 1.1409 (2020 low) has completed at 1.4248, ahead 1.4376 long term resistance (2018 high). Decline from 1.4248 could still be a corrective move, or it could be the start of a long term down trend. In either case, deeper decline would be seen back to 61.8% retracement of 2.1161 to 1.1409 at 1.2493. In any case, break of 1.3158 support turned resistance is needed to be the first sign of medium term bottoming. Otherwise, outlook will stay bearish in case of rebound.
Daily Technical Analysis
EUR/USD
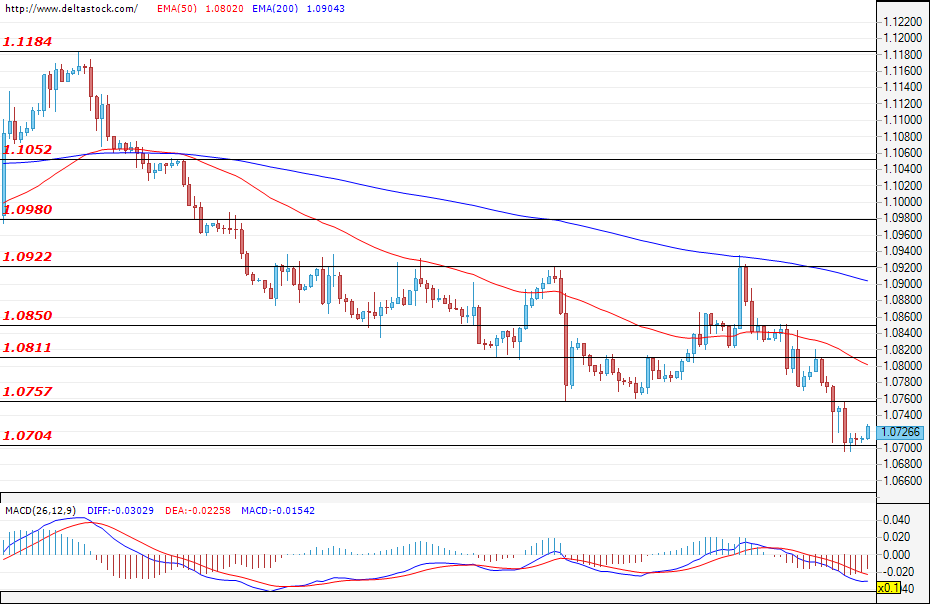
After the breach of the important support at 1.0757, the Euro lost quite a bit of ground against the dollar and the pair tested the support zone at 1.0704. During the early hours of today`s trading, the EUR/USD consolidated around the mentioned level and if the bearish attack continues and this level falls, then the pair will most likely head towards the lows from Мarch 2020 at around 1.0650. The first target for the bulls is the mentioned level at 1.0757, which is currently acting as resistance, followed by the target at 1.0811.
USD/JPY
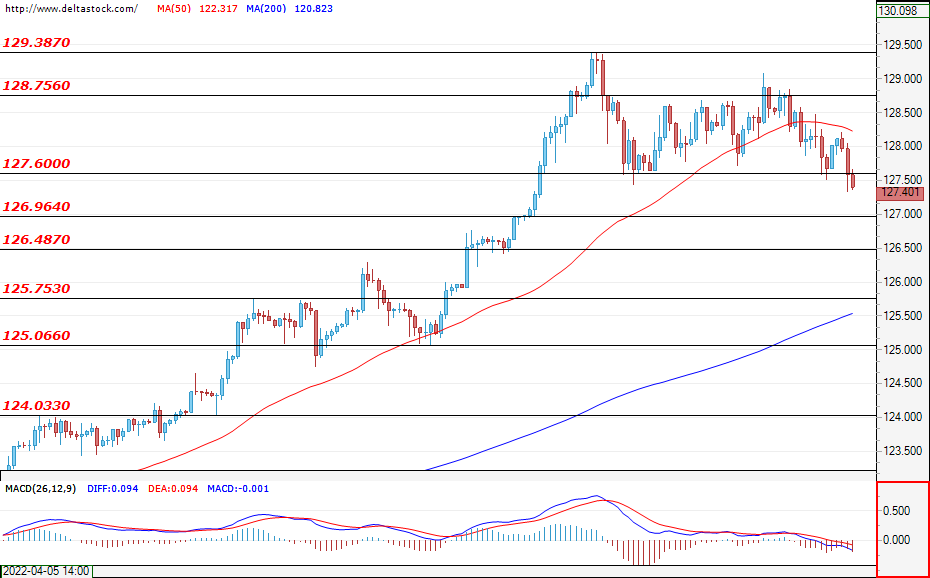
The bears prevailed, and during the early hours of today`s trading, the currency pair fell below the lower border of the range between 127.60 and 128.75. A confirmed breach here could easily deepen the decline and lead to a sell-off towards the support zone at 126.96, followed by the level at 126.48. If the bulls enter the market, then a violation of the important resistance at 128.75 could easily pave the way for a new attack on the high at 129.38 and would strengthen the positive expectations for the future path of the Ninja.
GBP/USD
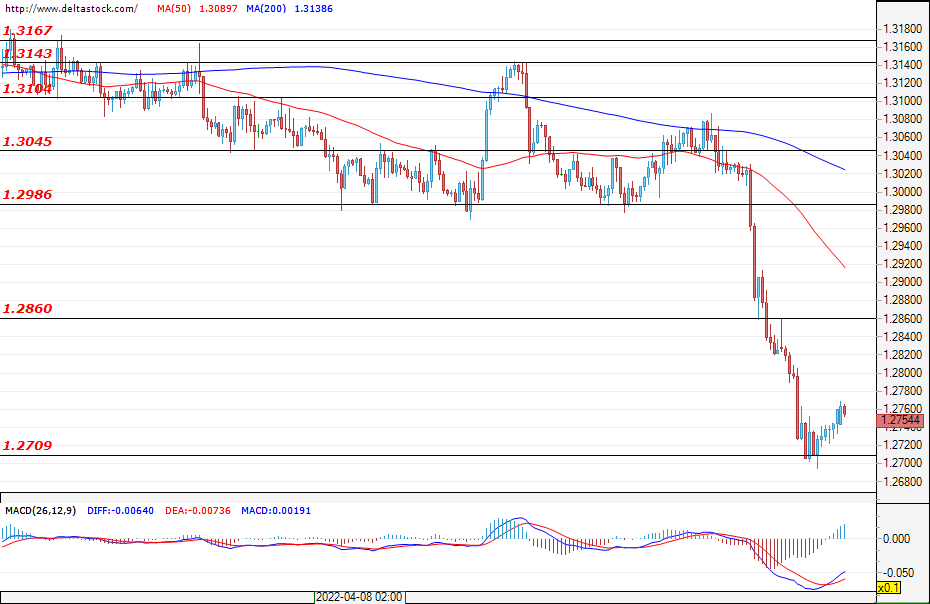
The depreciation for the pound against the dollar was limited to the support zone at 1.2709, and at the time of writing the analysis, the Cable is holding positions above the aforementioned level. If the bearish momentum fades and the bulls prevail, then they could lead the pair towards the resistance level at 1.2986, but only a successful violation of the target at 1.3045 could lead to a change in the current sentiment of the market participants. If the sellers remain in control, however, then a new breach attempt of the zone at 1.2709 would be the most probable scenario. If confirmed, this breach could prolong the sell-off and could easily lead to future losses towards 1.2670 for the sterling.
EUGERMANY40
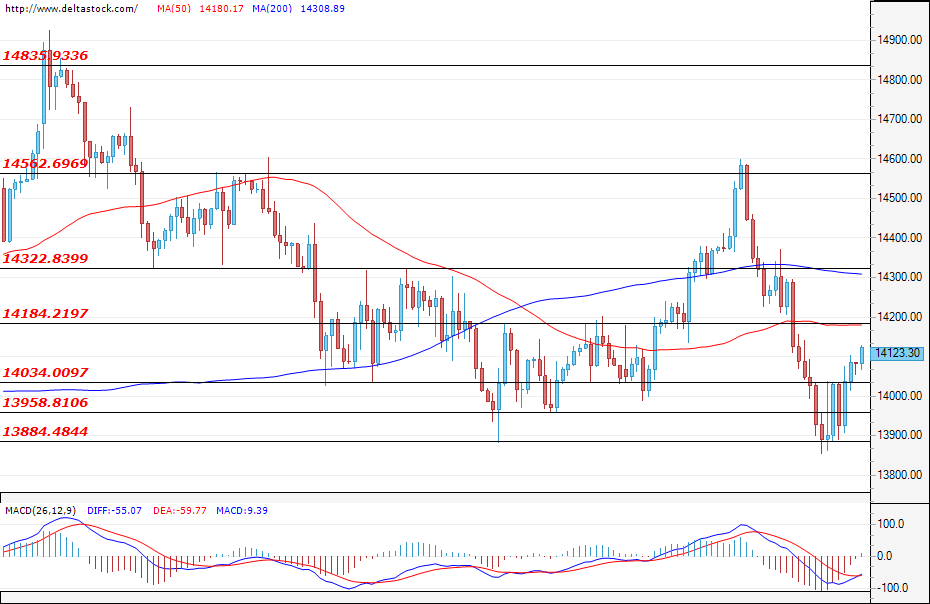
The German index regained some of its recent losses, and after the breach of the resistance at 14034, the price headed for a test of the next target at 14184. A successful violation of the mentioned level could easily lead to a rally and could continue the recovery towards the major zone at 14322. If the bears enter the market instead and manage to violate the level at 14034, then their next support can be found at 13958, followed by the lower target at 13884.
US30
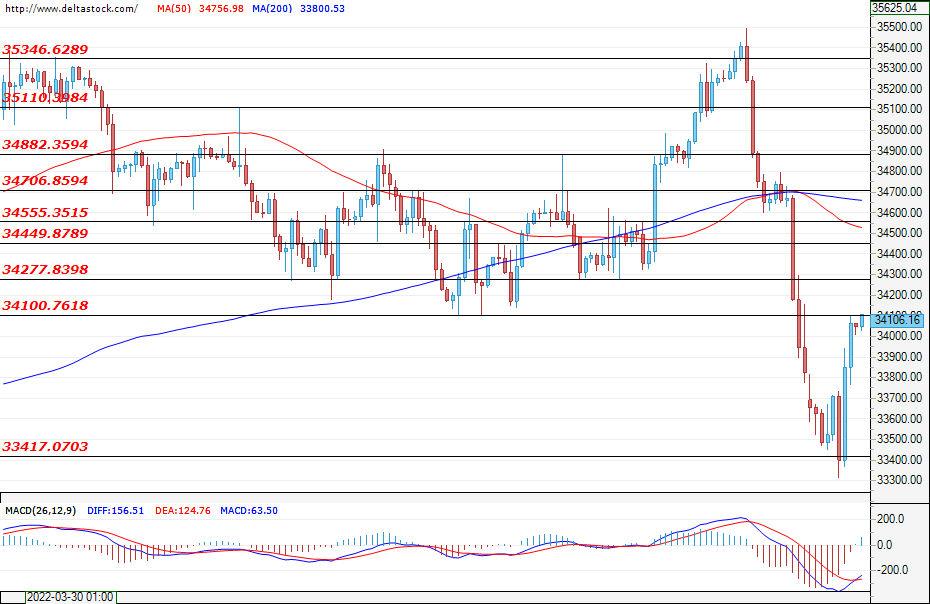
During the tech sector earnings, the sell-off was limited around the zone at 33400, after which the U.S. index staged a massive rally. A successful breach of the resistance zone at 34100 could easily lead to more gains and could head the price for a test of the higher level at 34277, followed by the one at 34449. If the mentioned zone at 34100 defends against the bullish attack, then a new attempt at breaching the low at 33417 would be the most probable scenario, marking the current move as a corrective one.
Why Not Lock in Some Gains Awaiting Some Fresh Guidance?
Markets
A Chinese growth slowdown ranks as one of the biggest risks to future global growth. March data already showed the impact of lockdowns in Shanghai (still in place), with an outbreak in Beijing over the weekend adding to worries. Risk sentiment soured in Asian and European dealings with main equity indices losing over 2%. Wall Street eventually made it off the intraday lows to close in positive territory in an intriguing comeback.
Core bonds corrected significantly higher following last week’s sharp hawkish repositioning. The decline at the longer end tenors was mostly driven by a decline in inflation expectations resulting from uncertainty around future growth/demand. European bonds significantly outperformed US Treasuries, again risk sentiment turned after the European bell (thus pulling US T’s off best intraday levels). US yields eventually closed 4 bps (2-yr) to 8.3 bps (7-yr) lower with the belly of the curve outperforming the wings. German yields lost 8.3 bps (30-yr) to 16.3 bps (5-yr). The UK Gilt curve bull steepened with yields sliding by 9 bps (30-yr) to 15.5 bps (2-yr).
The dollar remains markets’ favorite both in the risk-off setting and because of the Fed’s determination to tackle the inflation problem. The trade-weighted greenback (DXY) closed at 101.86, eying the 2020 top at 102.98. EUR/USD closed at a new cycle low of 1.0713 from an open at 1.0807. Commodities and commodity-related currencies suffered a setback as well. Brent crude for example touched $100/b from a >$105/b open, before bouncing back above $103.
Asian markets this morning join WS’s better shape yesterday evening. Core bonds are slipping away again. It’s still early days, but it could be that yesterday’s moves on bond markets was some profit taking on short positions with markets gradually keeping next week’s FOMC meeting in mind. The trend on bond markets has been very strong with an aggressive Fed tightening cycle discounted by now. Why not lock in some gains awaiting some fresh guidance? The dollar stabilizes near yesterday’s closing levels.
Today’s eco calendar is interesting in the US with March durable goods orders, housing data, consumer confidence and Richmond Fed manufacturing. We especially eye consumer confidence to see how Joe Sixpack stomachs the inflation surge. The US Treasury starts its end-of-month refinancing operation with a $48bn 2-yr Note auction. It will be interesting to see whether demand picks up at current absolute yield levels (2.64%). It might be just a little bit too early with US money markets pricing a 3%+ policy rate peak next year. Q4 corporate earnings and a speech by ECB Villeroy are wildcards.
News Headlines
South Korean GDP expanded by 0.7% q/q in the first quarter of this year, or 3.1% y/y. The quarterly increase was exclusively driven by net-exports, adding 1.4 ppts to the headline figure. Private consumption (-0.2 ppts) and gross capital formation (-0.5 ppts) were a drag as the country in Q1 grappled with the highest virus tally ever. Economic momentum is set to hold up in the current quarter, thanks to a rebound in consumption and ongoing strong exports. This allows for the central bank of Korea to continue its hiking cycle (policy rate now 1.5%) to tackle above-target inflation (4.1% in March). A key risk going forward is China’s growth slowdown affecting exports. Rising commodity prices meanwhile will impact both consumption and inflation and increase the BoK’s policy dilemma. The SK won trades stoic around USD/KRW 1248.5 this morning. Barring the volatile period in the early pandemic days, that is near the weakest level for the won since 2010.
Bank of Canada governor Macklem was the most explicit about another 50 bps rate hike at the next policy gathering in June yet. Speaking at a parliamentary committee hearing, he said the MPC “will be considering taking another 50-basis point step”. The idea of an even larger hike (eg. 75 bps) floated last week would be “very unusual”, Macklem said. Canadian short-term swap yields fell almost 10 bps but were already declining before his speech. Markets did price in lower odds of such even larger increase. Instead they stick to three consecutive 50 bps hikes at every meeting through September. The Canadian dollar eased to USD/CAD 1.273.
China Reacts to Financial Stress
Market movers today
We have a number of US data releases today. Consumer confidence from Conference Board, durable goods orders, new home sales and house prices will add more information on the state of the economy. Most interesting will probably be new home sales following the sharp rise in mortgage rates, although the biggest impact will probably not be felt until we get the April and May data. US 30-year mortage rates have increased from 3.25% to 5.25% since the beginning of the year pushing up the cost for new home buyers.
China's covid development and how much the virus spreads in Beijing is also worth watching.
The 60 second overview
Volatile markets: global growth concerns have increasingly become a market theme. Over the last week concerns have been amplified by China's zero Covid-policy and continued aggressive tightening signals from central banks such as the Fed and the ECB. Assets that tend to trade closely in tandem with the cyclical outlook have performed poorly, market volatility has increased and the broad USD is one of the few assets that has performed recently.
Markets will continue to follow Chinese developments closely amid China expanding coronavirus testing to most of Beijing which could precede a shut-down of the city similar to Shanghai. A possible shutdown risks putting further upside pressure on global supply chain issues and removes demand from the physical commodity market as evident from the recent setback to commodity prices.
Chinese authorities react: Overnight, the People's Bank of China has reacted to the financial stress in Chinese markets by pledging its support to the real economy. In a statement, the central bank announced new liquidity measures and stated that it "will step up the prudent monetary policy's support to the real economy, especially for industries and small businesses hit hard by the pandemic". Markets have reacted positively to the statement this morning: we see some stabilisation in the heavily battered Chinese equity market, broader equity futures are trading in green and yields are rebounding somewhat after a sharp setback in yesterday's session
CNY and global inflation: Following the sharpest weekly decline in the CNY since 2015 the Chinese authorities yesterday announced a decline in the FX reserve requirement ratio (RRR). The change means that Chinese banks need not hold as much foreign exchange incentivising domestic CNY buying. We do not believe that China minds a weaker CNY but the pace of the latest decline has likely been a worry. Given the importance of the Chinese economy for global growth and not least global goods production changes to the currency is important for global inflationary pressures. All else equal a weaker CNY acts as a dis-inflationary force and is likely welcome by central banks around the world fighting high imported inflationary pressures.
Equities: In our opinion there were no news out yesterday justifying the elevated volatility in equity markets. In our book this comes down to massive uncertainty among investors with the overshadowing question being whether central banks can orchestra a soft landing. Sector and style performance were very different on the two sides of the Atlantic with Min Vol outperforming. Min Vol is getting a lot of support from the combination of elevated uncertainty and stagflation.
FI: Sour risk sentiment on growth concerns from China due to Covid outbreak has sent European rates massively lower this week - bar this morning's stabilization. Being the most growth/policy segment of the curve, the 5y point in Germany ended 16bp lower yesterday, but also the shorter (2y lower by 13bp) and longer end (30y lower by 8bp) of the curve moved lower. Despite a pro-EU outcome of the French election, we did not see a noteworthy outperformance of French bonds. BTPs-Bund spreads widened 4bp to 174bp, which is the widest since Q2 2020. From a near-term macro aspect, we expect the high volatility to continue, with no particular circuit breaker in sight this week, hence we keep an eye out for next week's Fed meeting where a 50bp hike and QT announcement is widely expected.
FX: For once JPY was top performing G10 currency in part on the back of the drop in oil prices with Scandies losing out. EUR/USD drifted lower and close to the 1.07 mark.
Credit: The credit markets remain choppy. Yesterday iTraxx main widened 2.3bp to 84.3bp while Xover widened 10.6bp to 398.6bp. The subdued sentiment is also taking its toll on the primary markets where we see limited new issue printing.
EUR/USD Daily Outlook
Daily Pivots: (S1) 1.0668; (P) 1.0741 (R1) 1.0786; More...
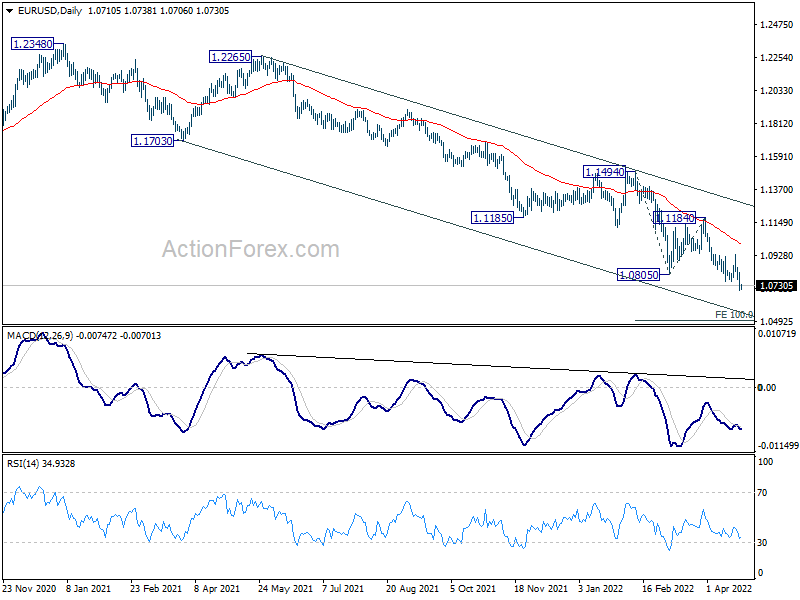
EUR/USD's decline is still in progress and intraday bias remains on the downside. Current down trend should target 100% projection of 1.1494 to 1.0805 from 1.1184 at 1.0495 next. On the upside, break of 1.0935 resistance is needed to indicate short term bottoming. Otherwise, outlook will stay bearish in case of recovery.
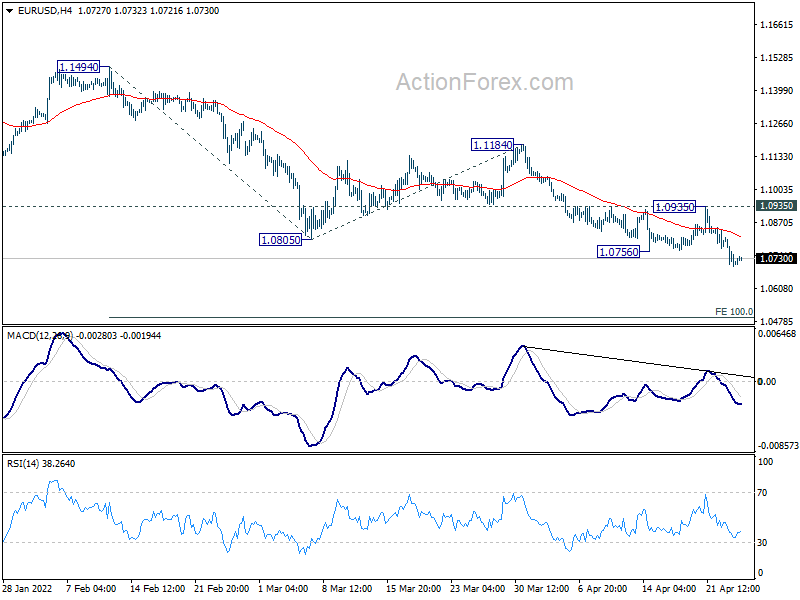
In the bigger picture, the decline from 1.2348 (2021 high) is expected to continue as long as 1.1185 support turned resistance holds. Firm break of 1.0635 (2020 low) will raise the chance of long term down trend resumption and target a retest on 1.0339 (2017 low) next. Nevertheless, break of 1.1185 will maintain medium term neutral outlook, and extending term range trading first.
Euro Staying Vulnerable as Market Sentiment Stabilized
Markets sentiment stabilized a bit in Asia, following the recovery in US stocks overnight. Commodity currencies are paring some losses while Dollar and Yen are retreating. But so far, the Japanese currency is still the strongest one for the week, backed by overall risk-off sentiment, while Dollar is also firm, except versus Loonie. Euro is currently the worst performing one, followed by Sterling. With the downside breakout in EUR/USD, there's likely more selloff in Euro ahead.
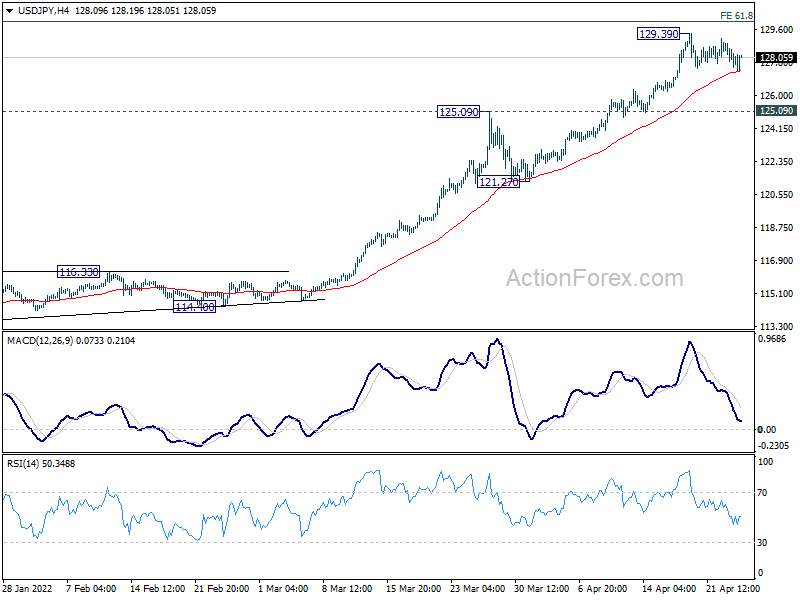
Technically, while the pull back in some Yen crosses was deep, USD/JPY is just engaging in very shallow retreat. There is prospect of rally resumption soon, if the pair could draw enough support from 4 hour 55 EMA. Yet the main hurdle is in the long term projection level at 61.8% projection of 75.56 (2011 low) to 125.85 (2015 high) from 98.97 at 130.04. 130 is also a level that's rumored to trigger currency intervention. So, let's see.
In Asia, at the time of writing, Nikkei is up 0.61%. Hong Kong HSI is up 1.77%. China Shanghai SSE is up 0.69%. Singapore Strait Times is down -0.18%. Japan 10-year JGB yield is up 0.0005 at 0.251. Overnight DOW rose 0.70%. S&P 500 rose 0.57%. NASDAQ rose 1.29%. 10-year yield dropped -0.08 to 2.826.
IMF slashes Asia Pacific growth forecast to 4.9%, warns of stagflationary outlook
IMF lowered growth forecast for Asia Pacific by -0.5% to 4.9% in 2022. Inflation forecast, on the other hand, was raised by 1% to 3.4%. Anne-Marie Gulde-Wolf, acting director of the IMF's Asia and Pacific Department, warned, "the region faces a stagflationary outlook, with growth being lower than previously expected, and inflation being higher."
In a blog post, she also warned of three main headwinds to the outlook. An escalation of the war in Ukraine would further increase food and energy prices. A tightening of US monetary policy that is materially faster or larger than currently expected by markets—or both—would have large spillovers to Asia. Also, a greater slowdown in China's economy due to broader virus lockdowns or other risk factors such as the continued weakness in the real estate sector, would also have large implications for the region
"More broadly, a potential fragmentation of supply chains and added geopolitical tensions will remain risks for the longer term for a region that has flourished in recent decades from rising wealth and other economic gains from globalization," she added.
Japan unemployment rate dropped to 2.6% in Mar, lowest in 2 years
Japan unemployment rate dropped from 2.7% to 2.6% in March, better than expectation of 2.7%. That;s also the lowest rate since April 2020. Number of workers rose 180k while unemployed dropped -90k. Job-to-applicant ratio rose 0.01 pts to 1.22.
"The drop in unemployment rate indicates signs of recovery" in the labour market, a government official told a media briefing. "But the impact of the pandemic appears to be lingering and requires close attention."
Looking ahead
Swiss trade balance and UK public sector net borrowing will be released in European session. But focuses will be on US durable goods orders and consumer confidence later in the day.
EUR/USD Daily Outlook
Daily Pivots: (S1) 1.0668; (P) 1.0741 (R1) 1.0786; More...
EUR/USD's decline is still in progress and intraday bias remains on the downside. Current down trend should target 100% projection of 1.1494 to 1.0805 from 1.1184 at 1.0495 next. On the upside, break of 1.0935 resistance is needed to indicate short term bottoming. Otherwise, outlook will stay bearish in case of recovery.
In the bigger picture, the decline from 1.2348 (2021 high) is expected to continue as long as 1.1185 support turned resistance holds. Firm break of 1.0635 (2020 low) will raise the chance of long term down trend resumption and target a retest on 1.0339 (2017 low) next. Nevertheless, break of 1.1185 will maintain medium term neutral outlook, and extending term range trading first.
Economic Indicators Update
| GMT | Ccy | Events | Actual | Forecast | Previous | Revised |
|---|---|---|---|---|---|---|
| 23:30 | JPY | Unemployment Rate Mar | 2.60% | 2.70% | 2.70% | |
| 06:00 | CHF | Trade Balance (CHF) Mar | 6.23B | 5.95B | ||
| 06:00 | GBP | Public Sector Net Borrowing (GBP) Mar | 14.2B | 12.3B | ||
| 12:30 | USD | Durable Goods Orders Mar | 1.00% | -2.10% | ||
| 12:30 | USD | Durable Goods Orders ex Transportation Mar | 0.50% | -0.60% | ||
| 13:00 | USD | S&P/Case-Shiller Home Price Indices Y/Y Feb | 18.40% | 19.10% | ||
| 13:00 | USD | Housing Price Index M/M Feb | 1.40% | 1.60% | ||
| 14:00 | USD | Consumer Confidence Apr | 108.5 | 107.2 | ||
| 14:00 | USD | New Home Sales Mar | 774K | 772K |
Japan unemployment rate dropped to 2.6% in Mar, lowest in 2 years
Japan unemployment rate dropped from 2.7% to 2.6% in March, better than expectation of 2.7%. That;s also the lowest rate since April 2020. Number of workers rose 180k while unemployed dropped -90k. Job-to-applicant ratio rose 0.01 pts to 1.22.
"The drop in unemployment rate indicates signs of recovery" in the labour market, a government official told a media briefing. "But the impact of the pandemic appears to be lingering and requires close attention."
IMF slashes Asia Pacific growth forecast to 4.9%, warns of stagflationary outlook
IMF lowered growth forecast for Asia Pacific by -0.5% to 4.9% in 2022. Inflation forecast, on the other hand, was raised by 1% to 3.4%. Anne-Marie Gulde-Wolf, acting director of the IMF's Asia and Pacific Department, warned, "the region faces a stagflationary outlook, with growth being lower than previously expected, and inflation being higher."
In a blog post, she also warned of three main headwinds to the outlook. An escalation of the war in Ukraine would further increase food and energy prices. A tightening of US monetary policy that is materially faster or larger than currently expected by markets—or both—would have large spillovers to Asia. Also, a greater slowdown in China's economy due to broader virus lockdowns or other risk factors such as the continued weakness in the real estate sector, would also have large implications for the region
"More broadly, a potential fragmentation of supply chains and added geopolitical tensions will remain risks for the longer term for a region that has flourished in recent decades from rising wealth and other economic gains from globalization," she added.
Technical Outlook and Review
DXY:
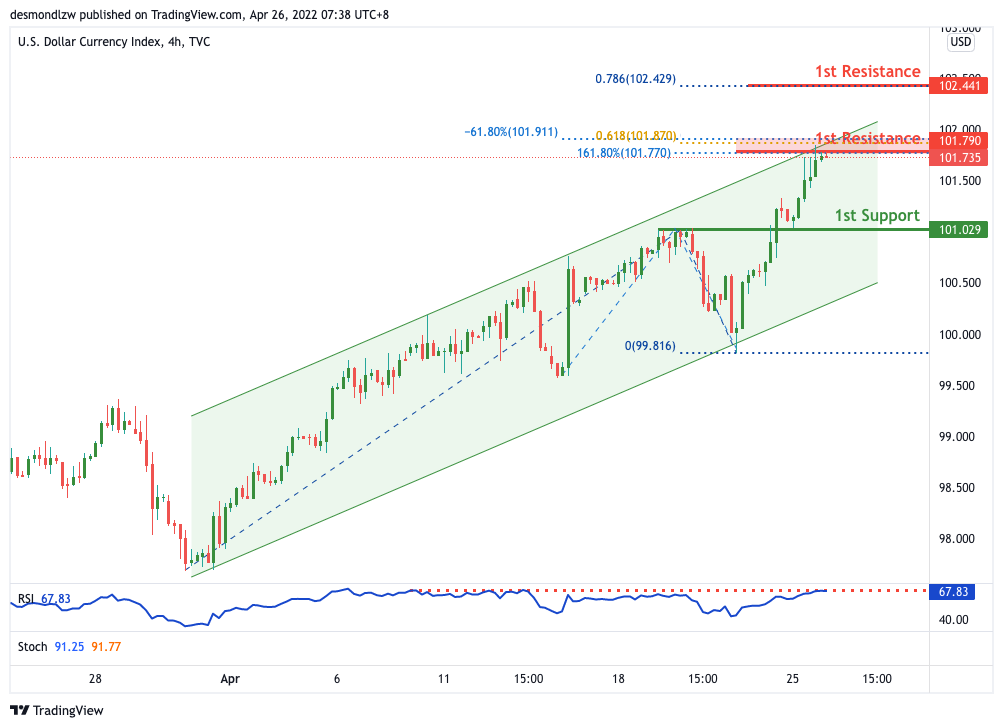
On the H4, with price expected to reverse off the stochastics indicator, we have a bearish bias that price will drop from our 1st resistance at 101.790 where the 161.8% Fibonacci extension, 61.8% Fibonacci projection and -61.8% Fibonacci expansion is to our 1st support at 101.209 in line with the horizontal pullback support and 38.2% Fibonacci retracement. Alternatively, price may break 1st resistance structure and head for 2nd resistance where the 78.6% Fibonacci projection is at 102.441.
Areas of consideration:
- H4 time frame, 1st resistance at 101.790
- H4 time frame, 1st support at 101.209
XAU/USD (GOLD):
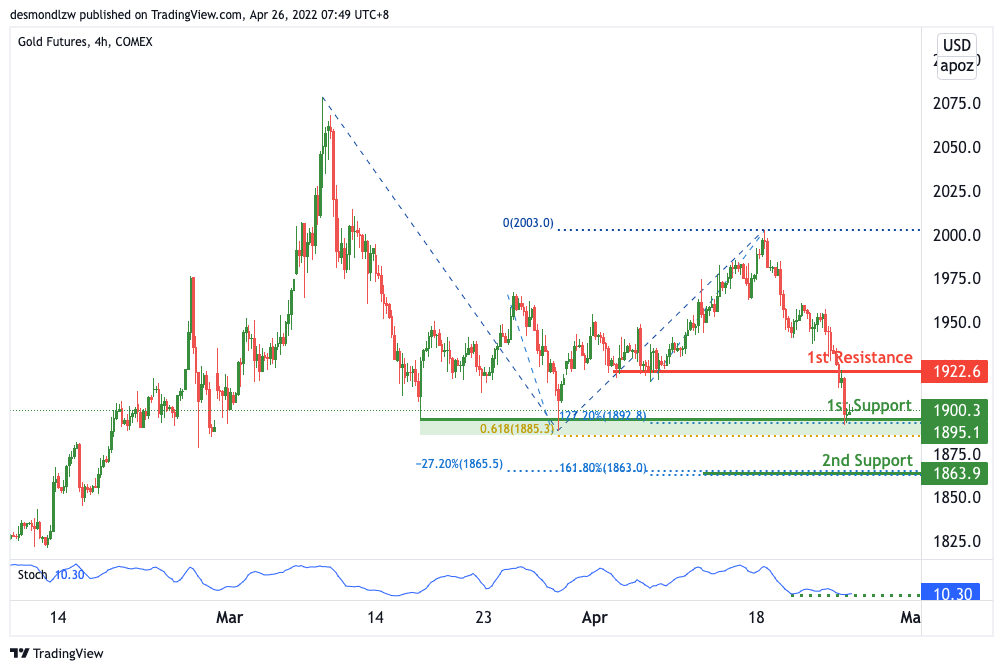
On the H4, with price expected to bounce off the stochastics indicator, we have a bullish bias that price will rise to our 1st resistance at 1922 where the pullback resistance is from our 1st support at 1895 in line with the horizontal swing low support and 61.8% Fibonacci projection and 127.2% Fibonacci extension. Alternatively, price may break 1st support structure and head for 2nd support where the 161.8% Fibonacci extension and -27.2% Fibonacci expansion is at 1863.
Areas of consideration:
- H4 time frame, 1st Resistance at 1922
- H4 time frame, 1st Support at 1895
GBP/USD:
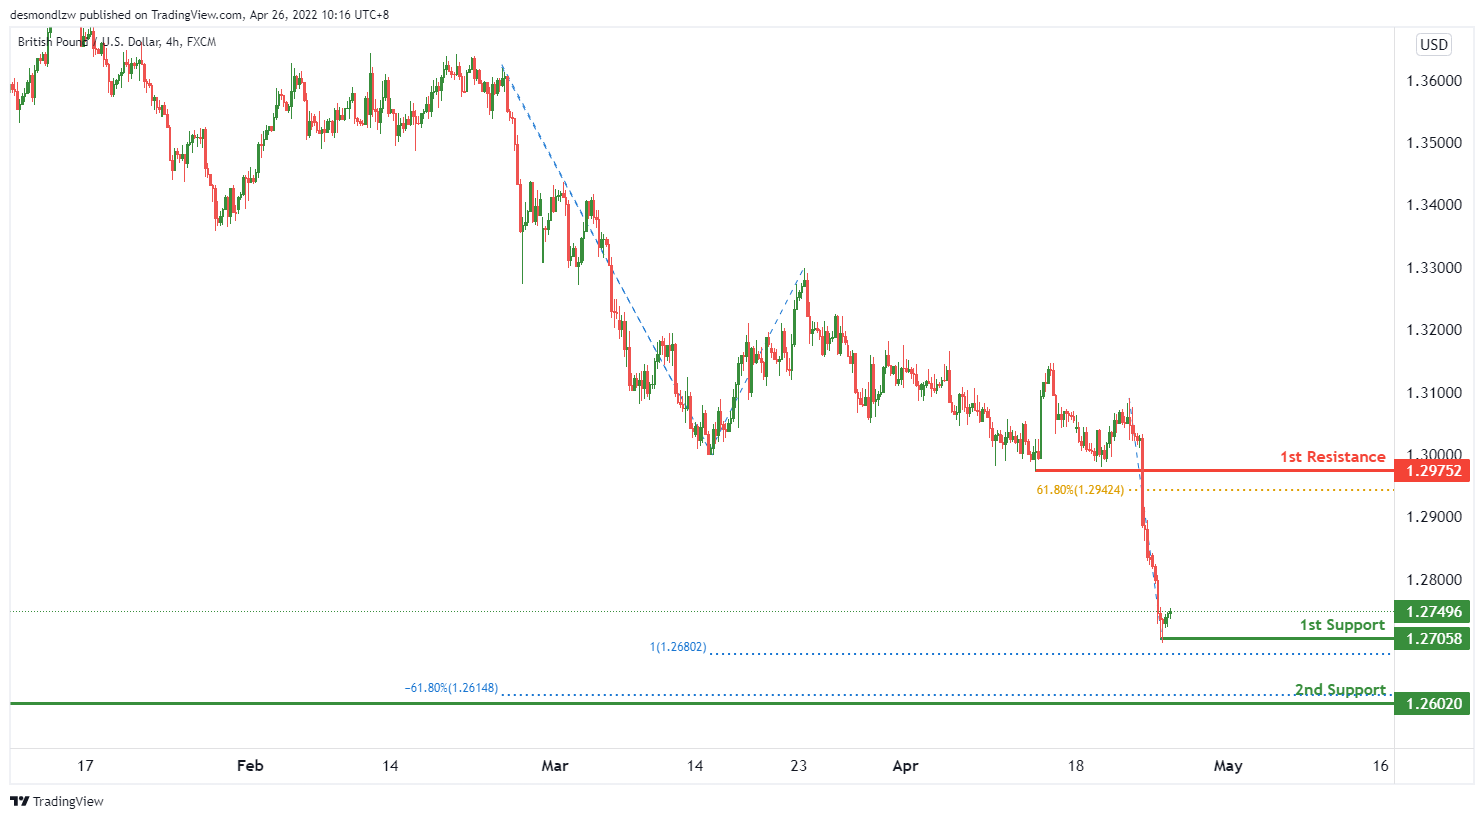
On the H4, we have a bullish bias that price will rise from 1st support level of 1.27058 which lines up with 100% fibonacci projection towards the 1st resistance level of 1.29752 which lines up with 61.8% fibonacci projection.
Areas of consideration:
- H4 1st resistance at 1.29752
- H4 1st support at 1.27058
- H4 2nd support at 1.26020
USD/CHF:
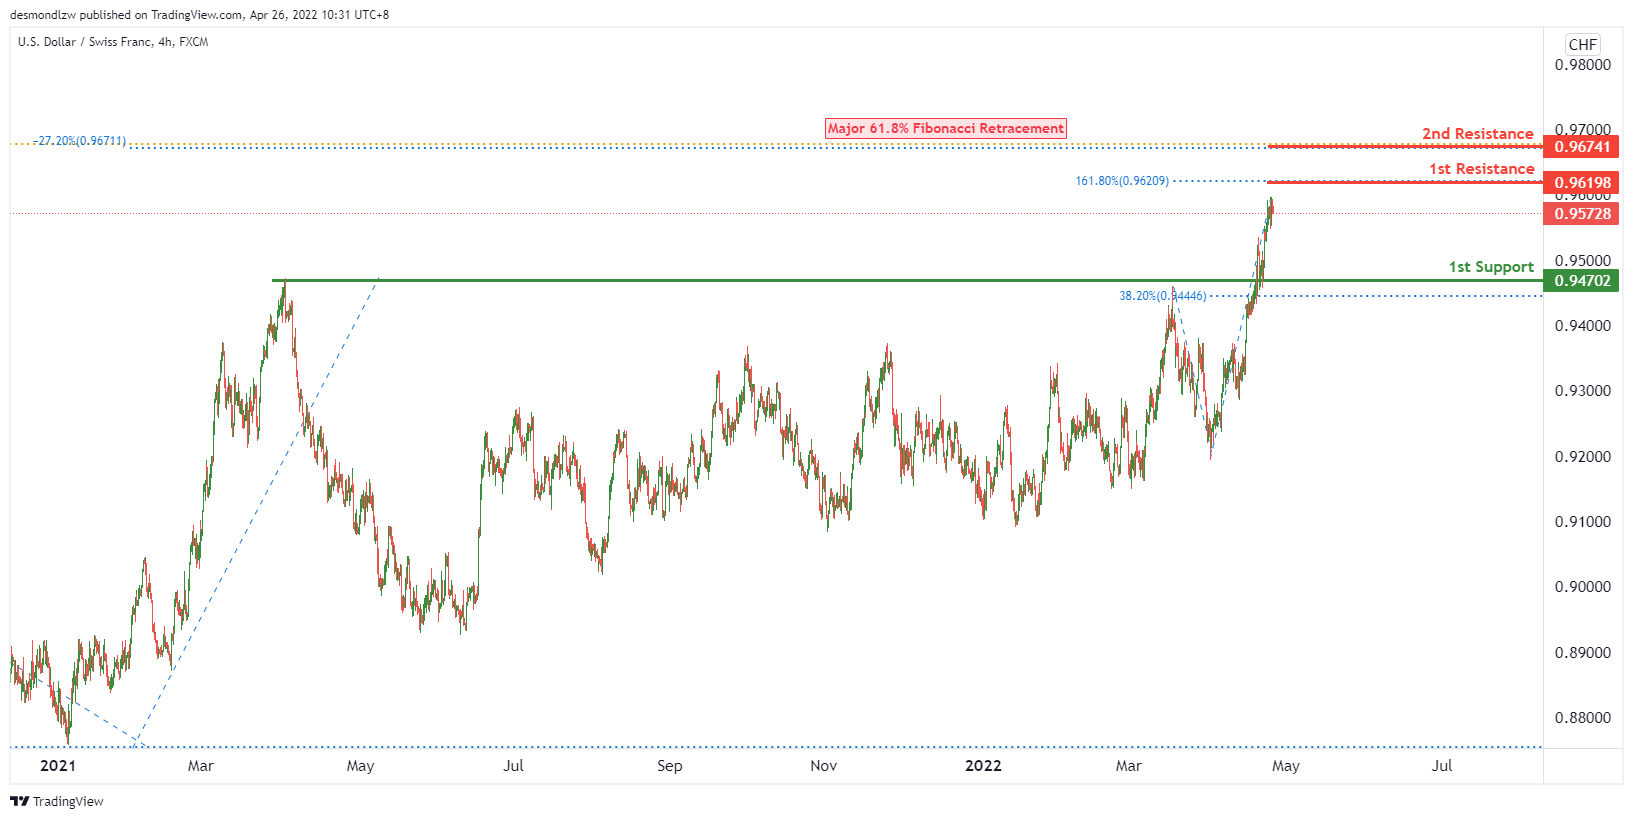
On the H4, price is near to the key resistance level. We expect that price will potentially reverse from 1st resistance level of 0.96198 in line with 161.8% fibonacci extension towards the 1st support level of 0.94702 in line with 38.2% fibonacci retracement.
Areas of consideration
- 1st support level at 0.94702
- 1st resistance level at 0.96198
- 2nd resistance level at 0.96741
EUR/USD :
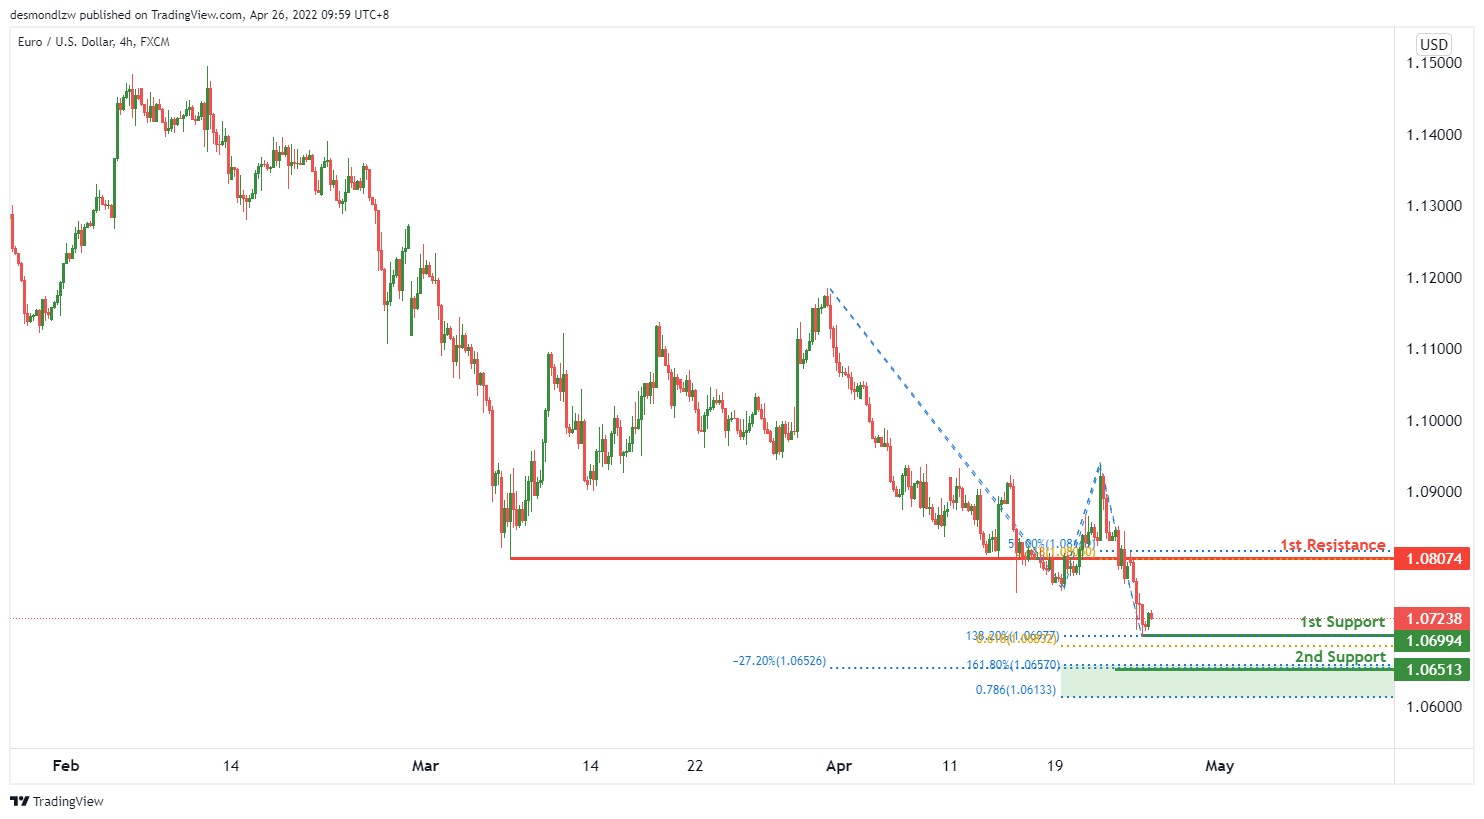
On the H4, price is near the pivot level. We expect price to potentially bounce from 1st support level of 1.06994 in line with 61.8% fibonacci retracement and 138.2% fibonacci extension towards the 1st resistance level of 1.08074 in line with 50% fibonacci retracement and 61.8% fibonacci projection.
Areas of consideration :
- H4 1st resistance at 1.08074
- H4 1st support at 1.06994
- H4 2nd support at 1.06513
USD/JPY:
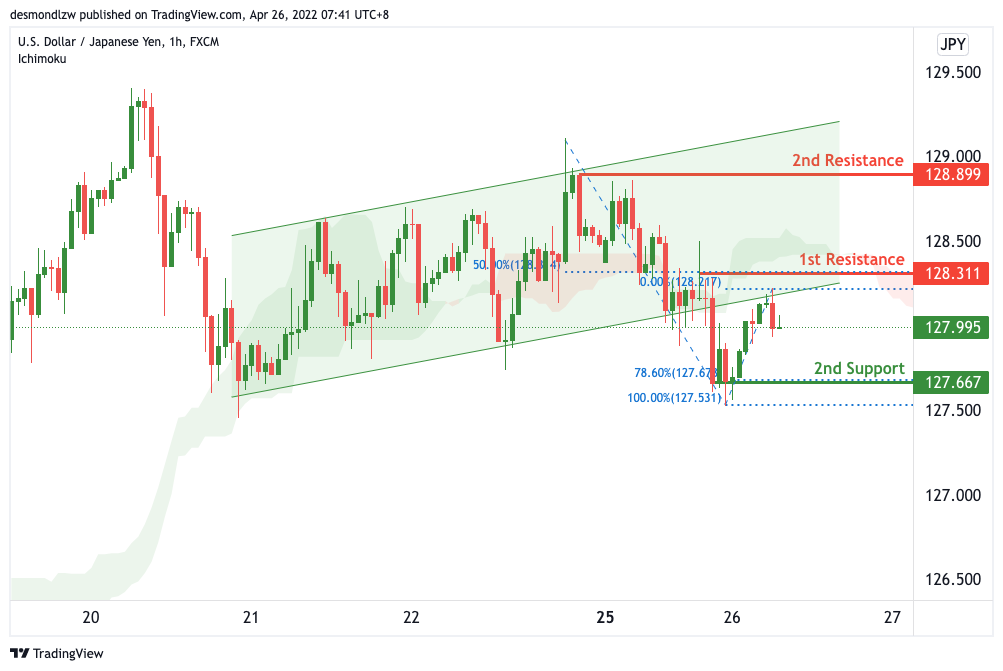
On the H4, with price moving below the ichimoku cloud indicator, we have a bearish bias that price will drop from our 1st resistance at 128.331 where the 50% Fibonacci retracement is to our 1st support at 127.667 in line with the horizontal swing low support and 61.8% Fibonacci retracement. Alternatively, price may break 1st resistance structure and head for 2nd resistance where the horizontal swing high resistance is at 108.889.
Areas of consideration:
- H4 time frame, 1st resistance at 128.331
- H4 time frame, 1st support at 127.667
AUD/USD:
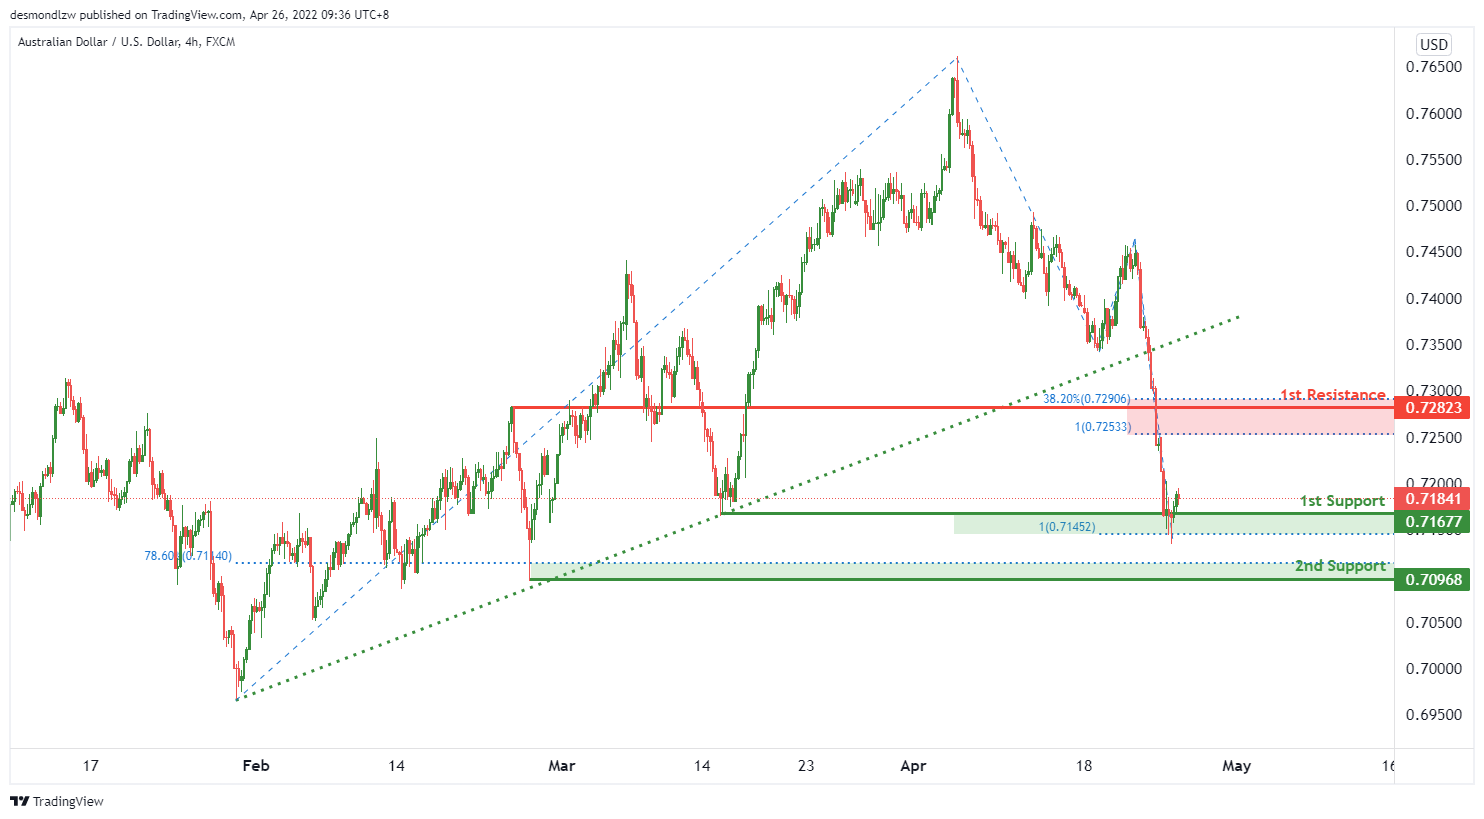
On the H4 timeframe, price is near the key support level, We see the potential of a bullish bounce from 1st support level of 0.71677 in line with 100% fibonacci projection towards the 1st resistance level of 0.72823 in line with 38.2% fibonacci retracement and 100% fibonacci projection. Otherwise, price might break the key support level to trigger a dip towards the 2nd support of 0.70968 which is in line with 78.6% fibonacci retracement.
Areas of consideration
- H4 1st resistance at 0.72823
- H4 1st support at 0.71677
- H4 2nd support at 0.70968
NZD/USD:
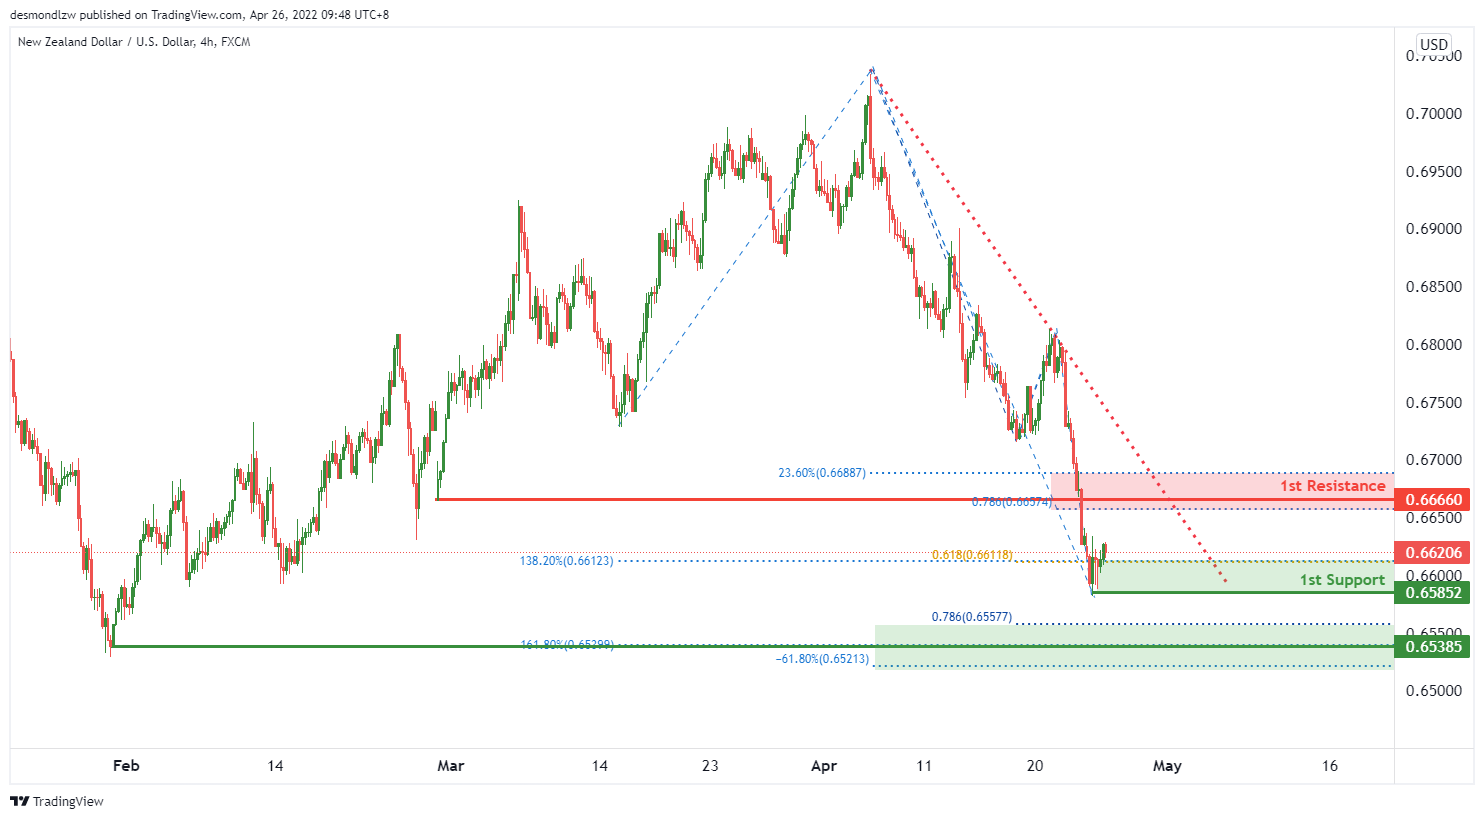
On the H4, we see the potential of bullish bounce from 1st support level of 0.65852 in line up with 138.2% fibonacci extension and 61.8% fibonacci retracement towards the 1st resistance level of 0.66660 in line with 23.6% fibonacci retracement and 78.6% fibonacci projection.
Areas of consideration:
- H4 time frame, 1st support at 0.65852
- H4 time frame, 1st resistance at 0.66660
- H4 time frame, 2nd support at 0.65385
USD/CAD:
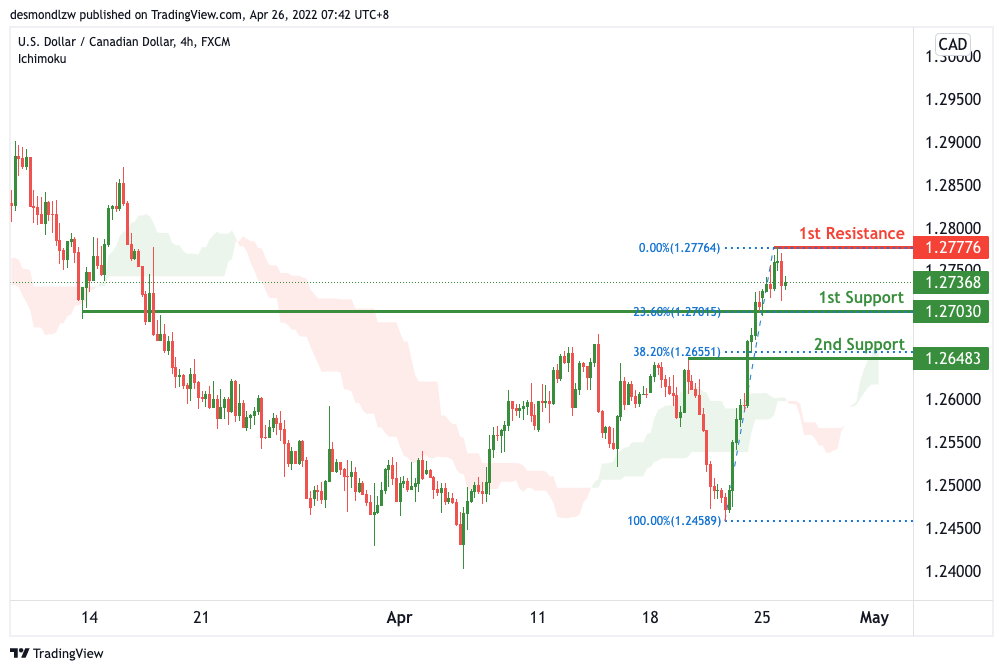
On the H4, with price moving above the ichimoku cloud, we have a bullish bias that price will rise to our 1st resistance at 1.27776 where the swing high resistance is from our 1st support at 1.27030 in line with the horizontal pullback support and 23.6% Fibonacci retracement. Alternatively, price may break 1st support structure and head for 2nd support where the horizontal pullback support and 38.2% Fibonacci retracement is.
Areas of consideration:
- H4 time frame, 1st resistance at 1.27776
- H4 time frame, 1st support at 1.27030
OIL:
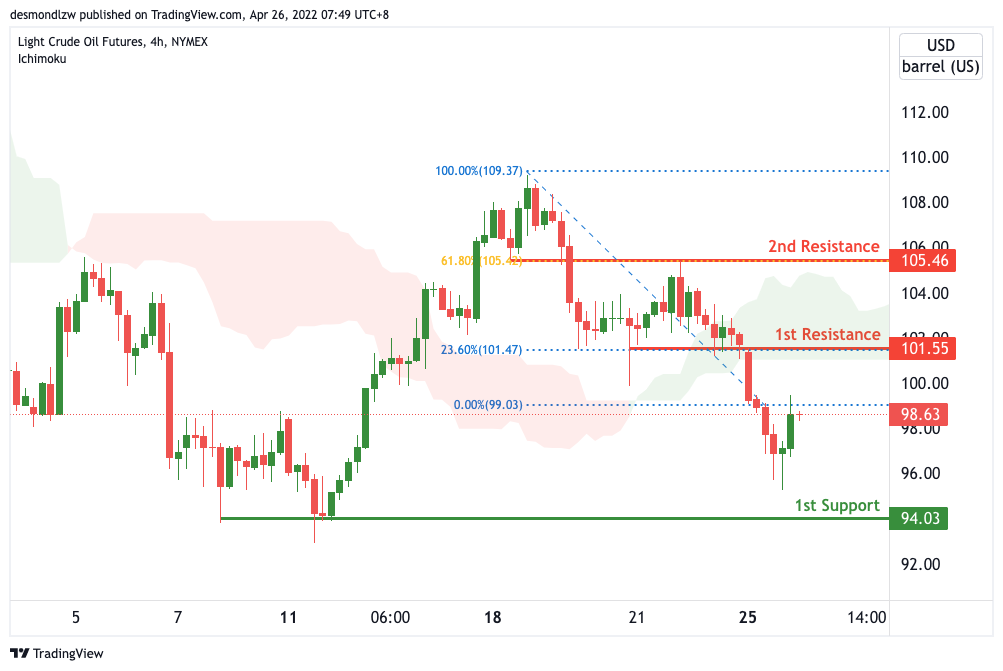
On the H4, with price moving below the ichimoku cloud, we have a bearish bias that price will drop from our 1st resistance at 101.55 where the pullback resistance and 23.6% Fibonacci retracement is to our 1st support at 94.03 in line with the horizontal swing low support. Alternatively, price may break 1st resistance structure and head for 2nd resistance where the horizontal pullback support and 61.8% Fibonacci retracement at 105.46.
Areas of consideration:
- H4 time frame, 1st resistance of 101.55
- H4 time frame, 1st support of 94.03
Dow Jones Industrial Average:
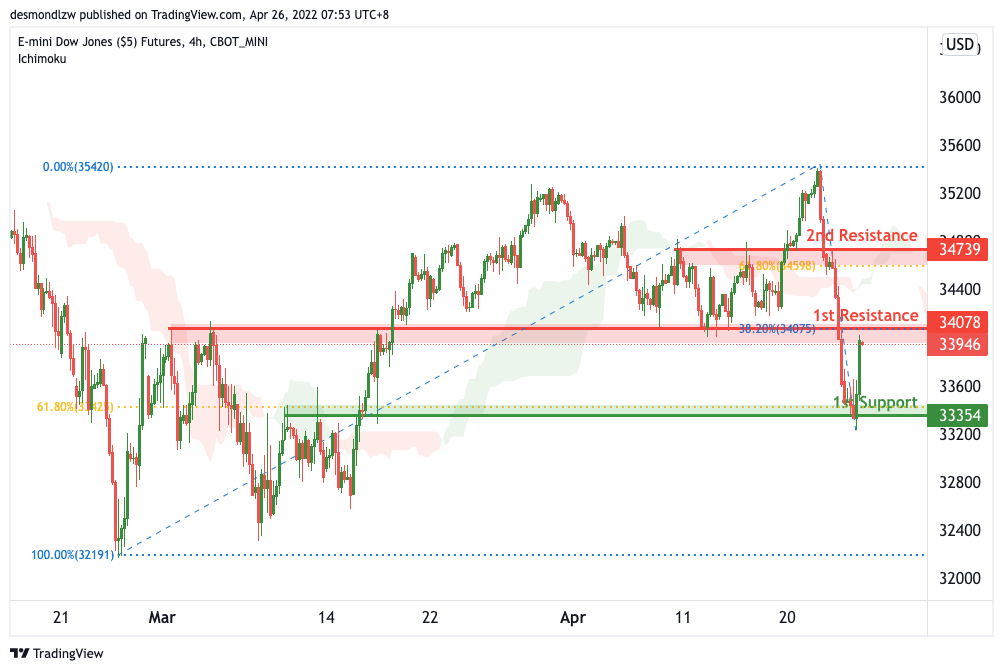
On the H4, with price moving below the ichimoku cloud, we have a bearish bias that price will drop from our 1st resistance at 34078 where the 161.8% Fibonacci retracement is to our 1st support at 33354 in line with the horizontal swing low support and 61.8% Fibonacci retracement. Alternatively, price may break 1st resistance structure and head for 2nd resistance where the 61.8% Fibonacci retracement is at 34739.
Areas of consideration :
- H4 time frame, 1st resistance at 34078
- H4 time frame, 1st support at 33354
GBP/USD Tumbles Below Key Support, Dollar Gains
Key Highlights
GBP/USD started a major decline below the 1.2980 support.
It is down over 250 pips and remains at a risk of more losses.
EUR/USD extended decline below the 1.0750 support zone.
The US Durable Goods Orders could increase 1% in March 2022.
GBP/USD Technical Analysis
The British Pound failed to stay above 1.3000 against the US Dollar. GBP/USD settled below the 1.2980 support zone to move into a bearish zone.
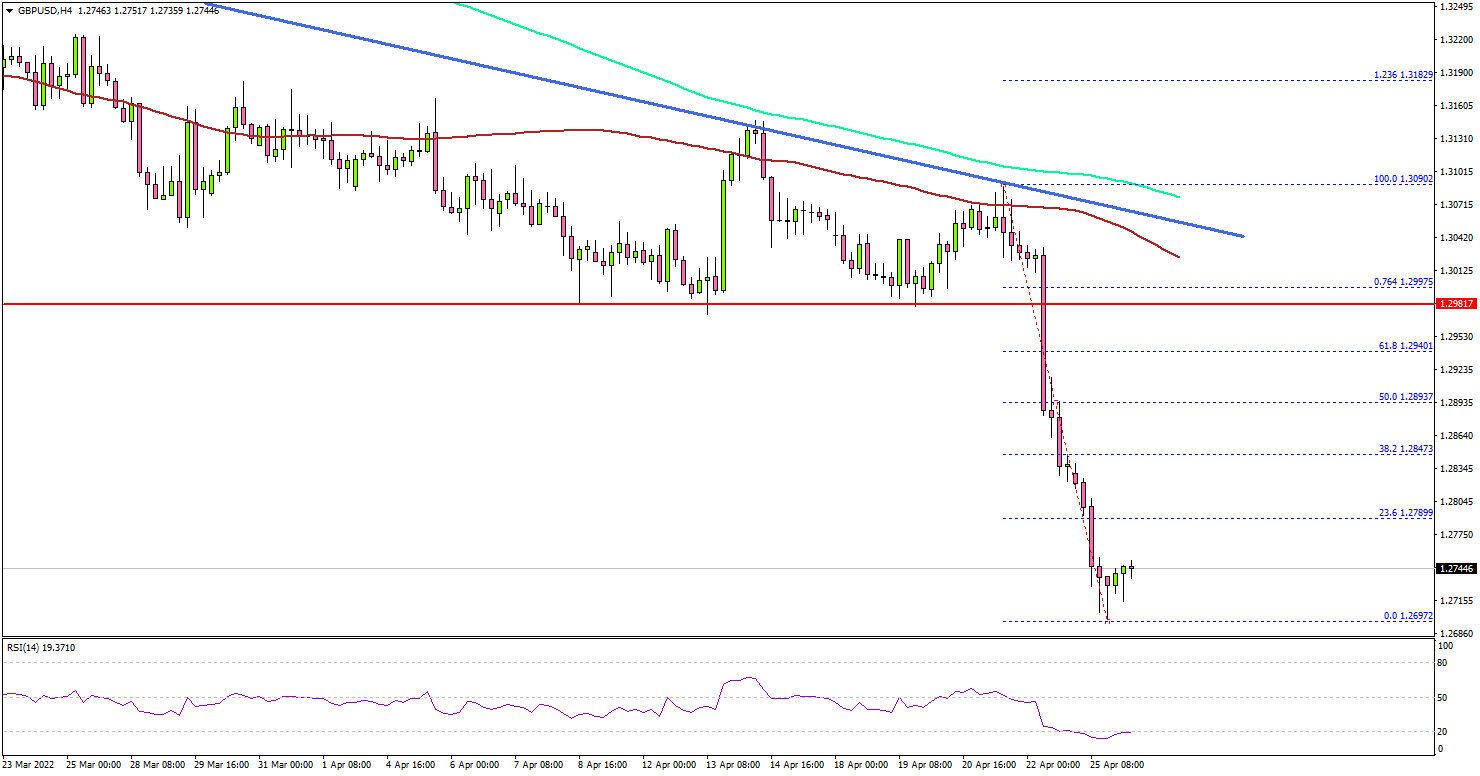
Looking at the 4-hours chart, the pair declined heavily below 1.2900, the 200 simple moving average (green, 4-hours), and the 100 simple moving average (red, 4-hours).
The pair even broke the 1.2800 support zone and traded close to 1.2700. A low is formed near 1.2697 and it is now consolidating losses. The next major support is near the 1.2650 level. Any more losses may perhaps open the doors for a move towards the 1.2580 level.
On the upside, the pair might face resistance near the 1.2780 level. The next major resistance is seen near the 1.2850 level, above which the pair could start a steady increase. In the stated case, GBP/USD may possibly face a strong selling interest near the last breakdown zone at 1.2980.
There is also a key barrier forming near the 1.3050 level, the 100 simple moving average (red, 4-hours), and a connecting bearish trend line on the same chart.
Looking at EUR/USD, the pair failed to recover losses and extended its decline below the key 1.0750 support zone.
Economic Releases
- US Durable Goods Orders for March 2022 – Forecast +1% versus -2.1% previous.
- US Durable Goods Orders ex Defense for March 2022 – Forecast 0% versus -2.6% previous.
- US Durable Goods Orders ex Transportation for March 2022 – Forecast +0.6% versus -0.6% previous.