Sample Category Title
Fed Evans expects interest rate at 2.25-2.50% by year end
Chicago Fed President Charles Evans said yesterday that he expected interest rate to be above neutral at 2.25-2.50% by the end of the year.
"That's my expectation, when I see that, taking out special factors, I'm still left with 3 to 3.5% inflation" by the end of 2022, he said. "That's not what we want. If we're at a 2.5% inflation rate, I think we have more things to ponder there."
"By December, we're going to get more data on the micro aspects of the high inflation, price increases, how much is it broadening out," Evans said. "By that time, we're at neutral, and to the extent we don't see it coming down, we're going beyond neutral, absolutely."
Technical Outlook and Review
DXY:
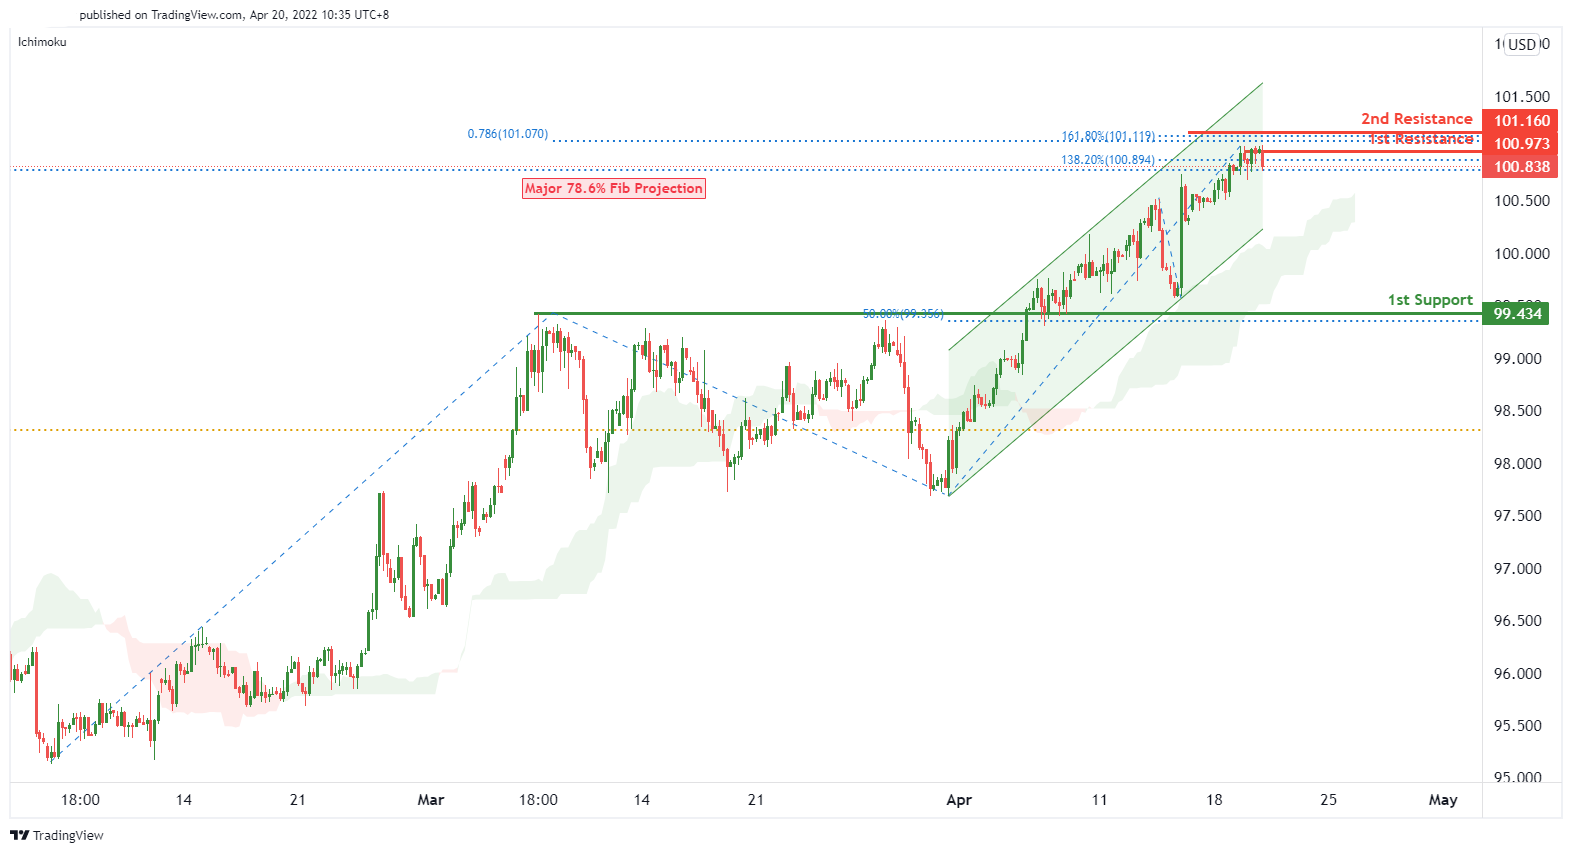
We see a potential for bearish dip from 1st resistance level of 100.973 in line with 138.2% Fibonacci extension and 78.6% Fibonacci projection towards the 1st support level of 99.434 in line with 50% Fibonacci retracement, along with a graphical pullback support. Alternatively, price might continue to rise to 2nd resistance level of 101.160 in line with 161.8% Fibonacci extension and 78.6% Fibonacci projection.
Areas of consideration:
- H4 time frame, 1st resistance at 100.973
- H4 time frame, 2nd resistance at 101.160
- H4 time frame, 1st support at 99.434
XAU/USD (GOLD):
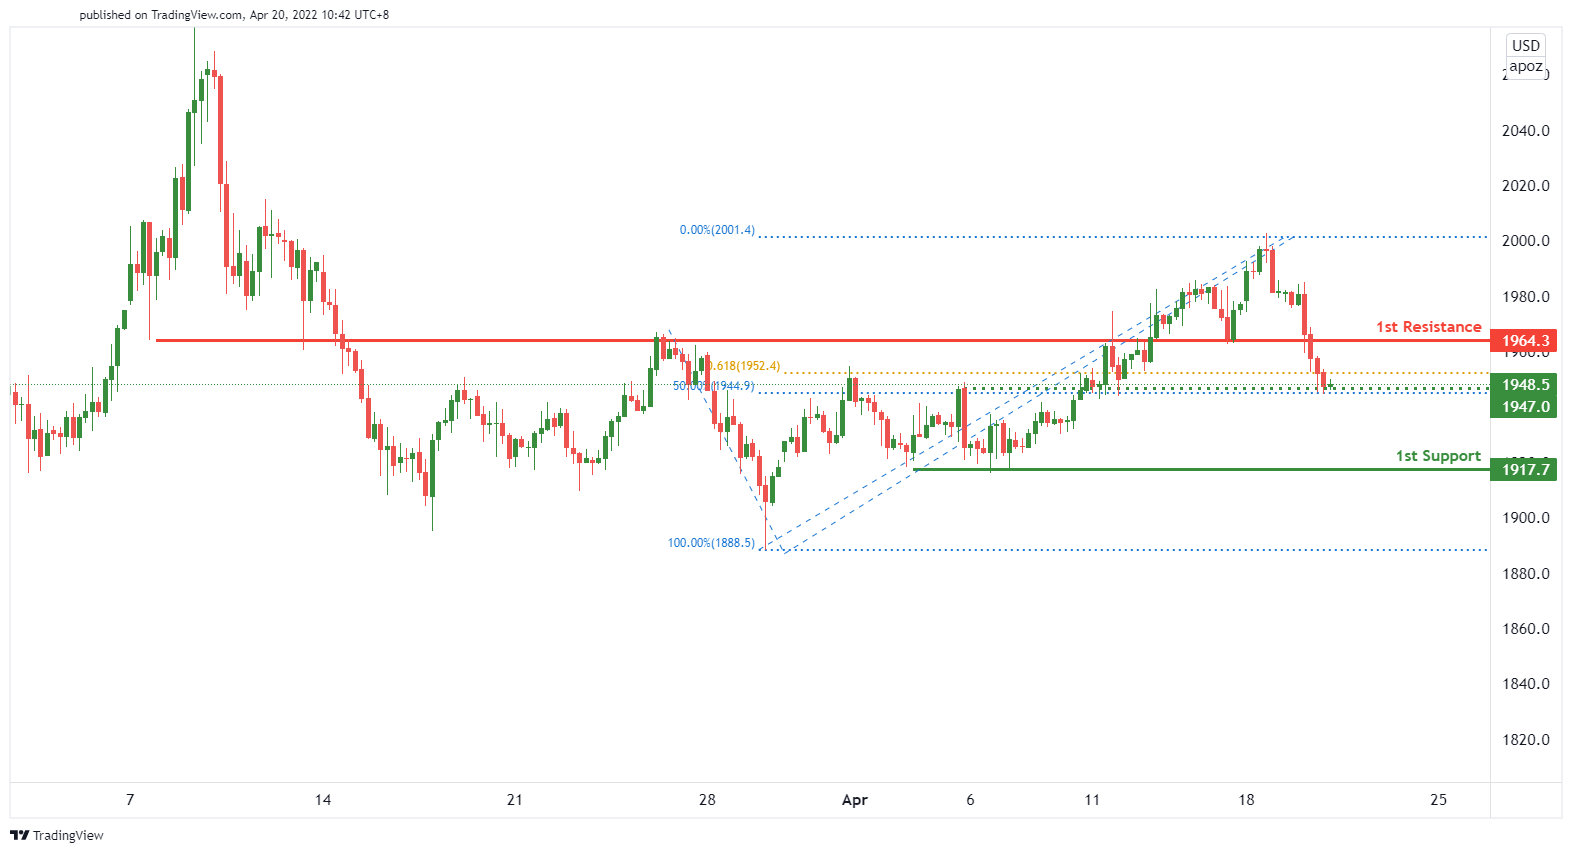
We see that price is on a bearish momentum. Price can potentially dip from 1st resistance level of 1964.3 along with a graphical overlap resistance towards the 1st support level of 1917.7 in line with a horizontal swing low support.
Areas of consideration:
- H4 time frame, 1st Resistance at 1964.3
- H4 time frame, 1st Support at 1917.7
GBP/USD:
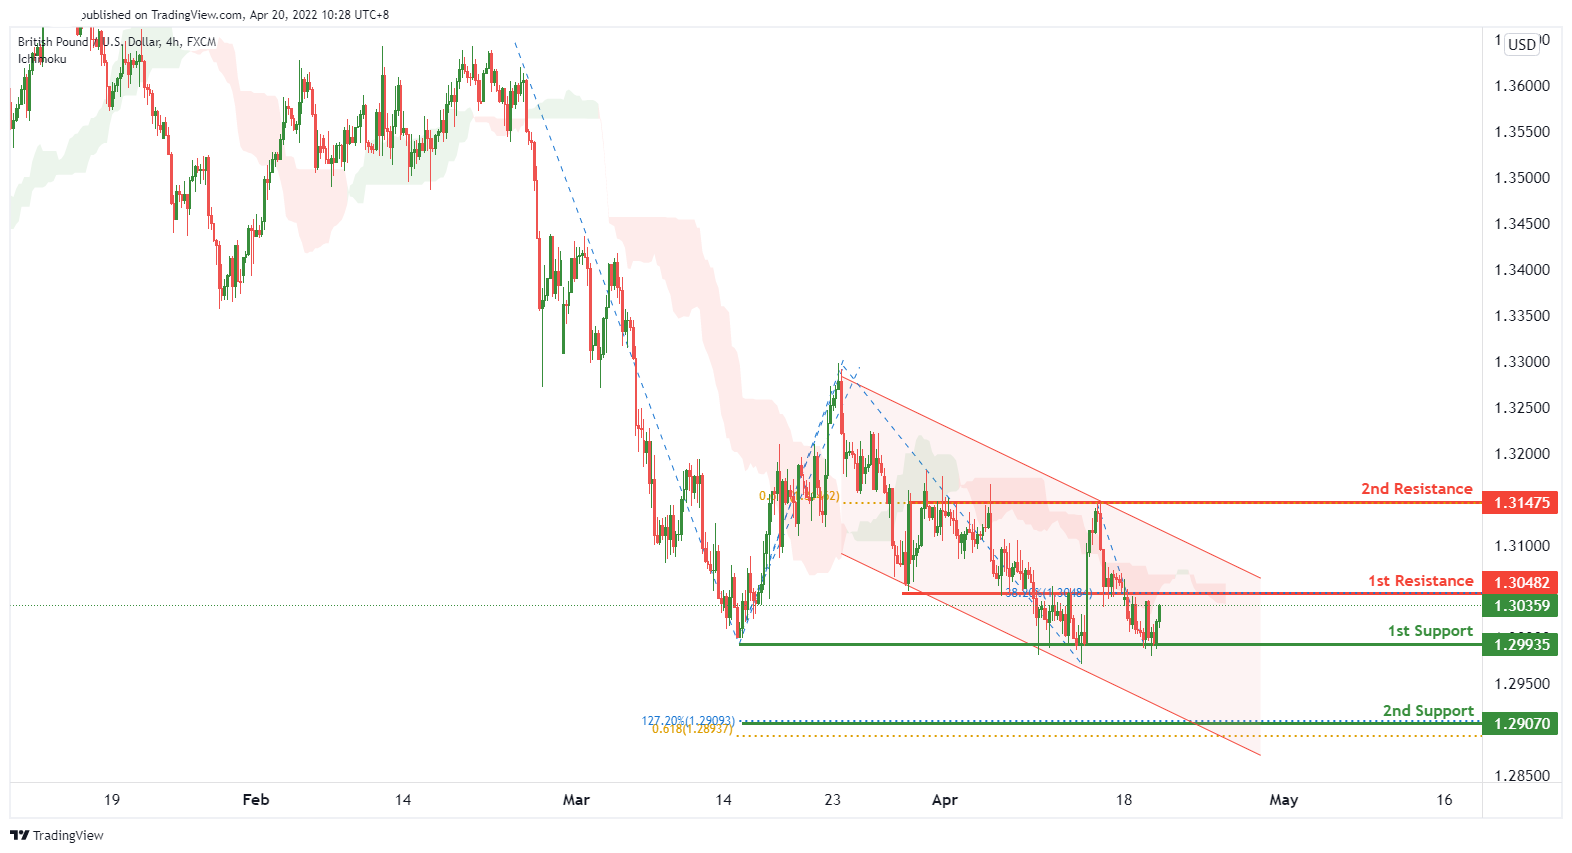
On the H4 timeframe, we have a neutral bias. Price is abiding to the descending channel and trading below the ichimoku cloud. Therefore, price can potentially break through the 1st support level of 1.29935 along with a graphical swing low support to trigger a dip towards the 2nd support level of 1.29070 which is in line with 61.8% Fibonacci projection and 127.2% Fibonacci extension. Otherwise, price might break through the 1st resistance level of 1.30482 which is in line with 38.2% Fibonacci retracement and a pullback resistance to trigger a rise towards the 2nd resistance level of 1.31475 which is in line with 61.8% Fibonacci projection.
Areas of consideration:
- H4 1st resistance at 1.30482
- H4 2nd resistance at 1.31475
- H4 1st support at 1.29935
- H4 2nd support level at 1.29070
USD/CHF:
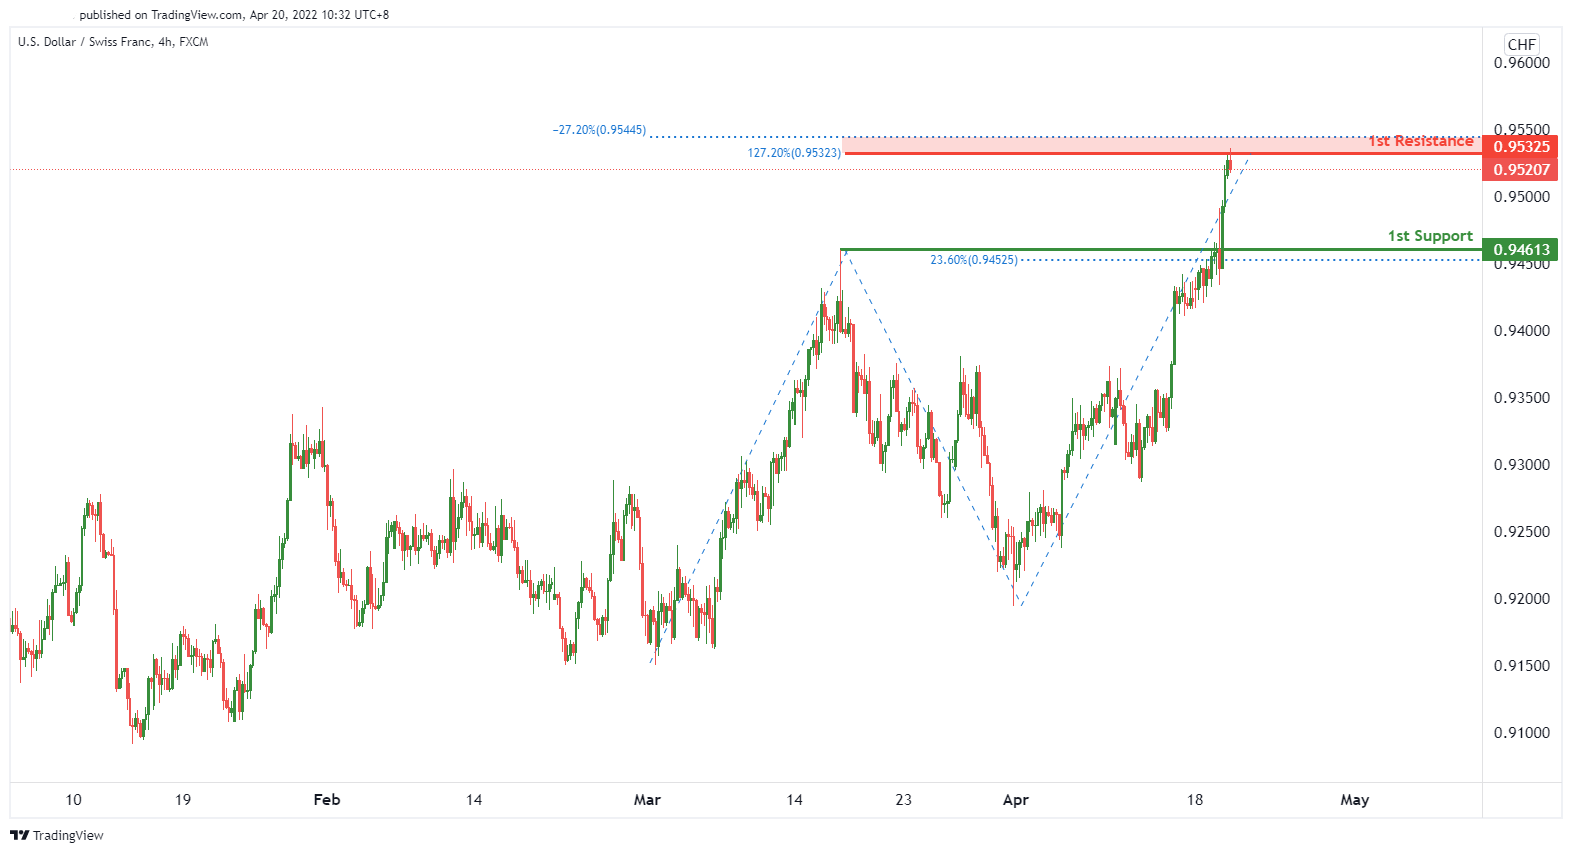
On the H4, we see the potential for bearish reversal from our 1st resistance at 0.95325 in line with 100% FIbonacci projection and 127.2% Fibonacci extension and -27.2% Fibonacci expansion towards our 1st support at 0.94613 which is in line with 23.6% Fibonacci retracement and a graphical pullback support.
Areas of consideration
- 1st support level at 0.94613
- 1st resistance level at 0.95325
EUR/USD :
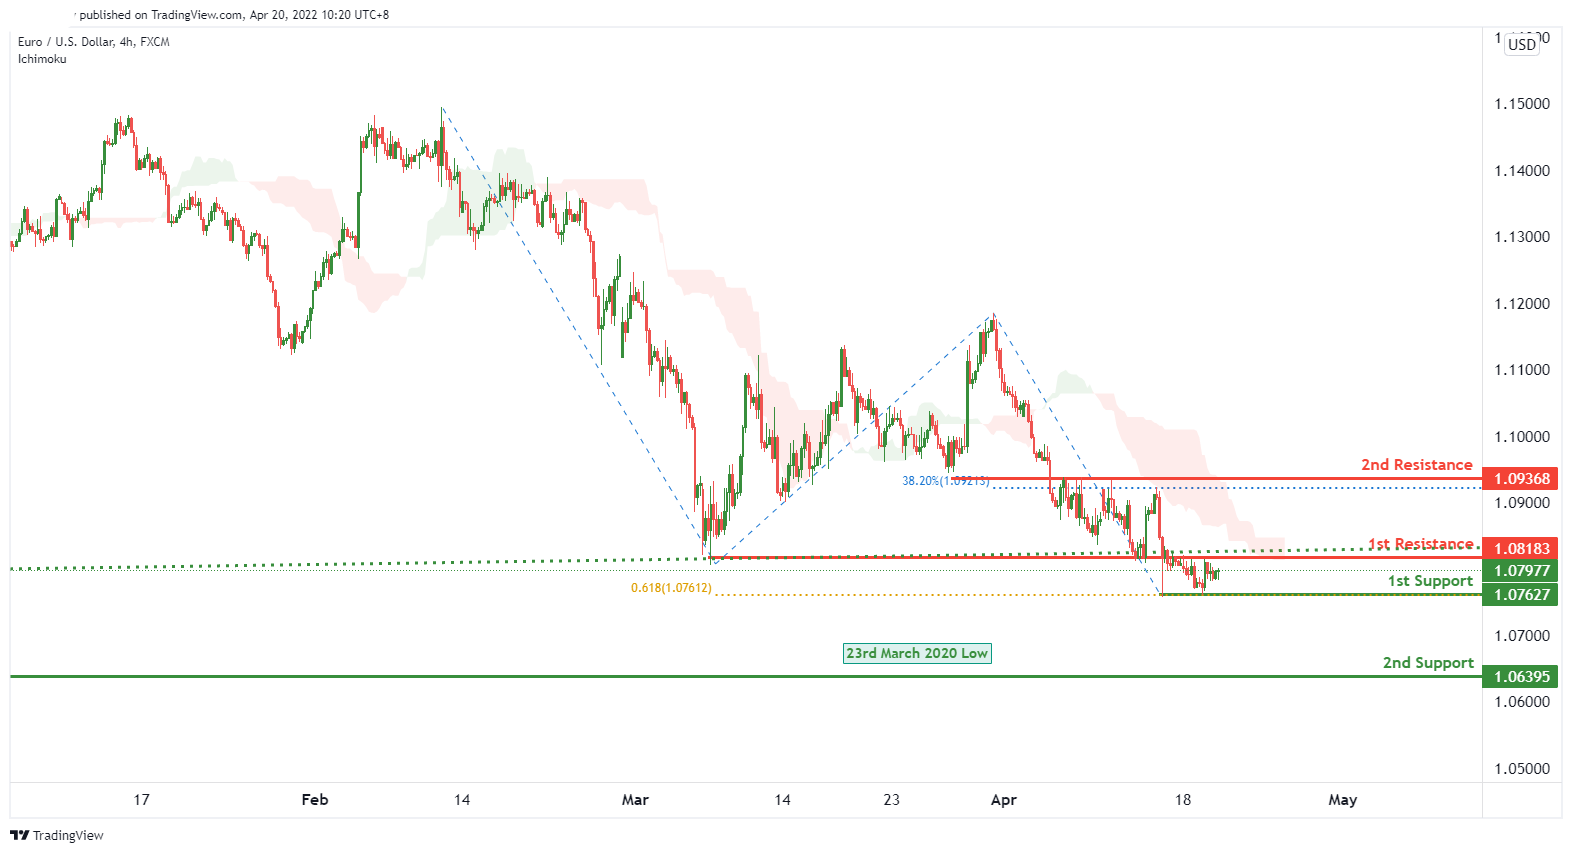
On the H4 timeframe, we have a neutral bias. Price is trading below the ichimoku cloud and thus, price can potentially break through the 1st support level of 1.07627 which is in line with 61.8% Fibonacci projection to trigger a dip towards the 2nd support level of 1.06395 along with a major horizontal swing low support. Otherwise, price might break through the 1st resistance level of 1.08183 which is in line with a pullback resistance to trigger a rise towards the 2nd resistance level of 1.09368 which is in line with 38.2% Fibonacci retracement.
Areas of consideration :
- H4 1st resistance at 1.08183
- H4 2nd resistance at 1.09368
- H4 1st support at 1.07627
- H4 2nd support at 1.06395
USD/JPY:
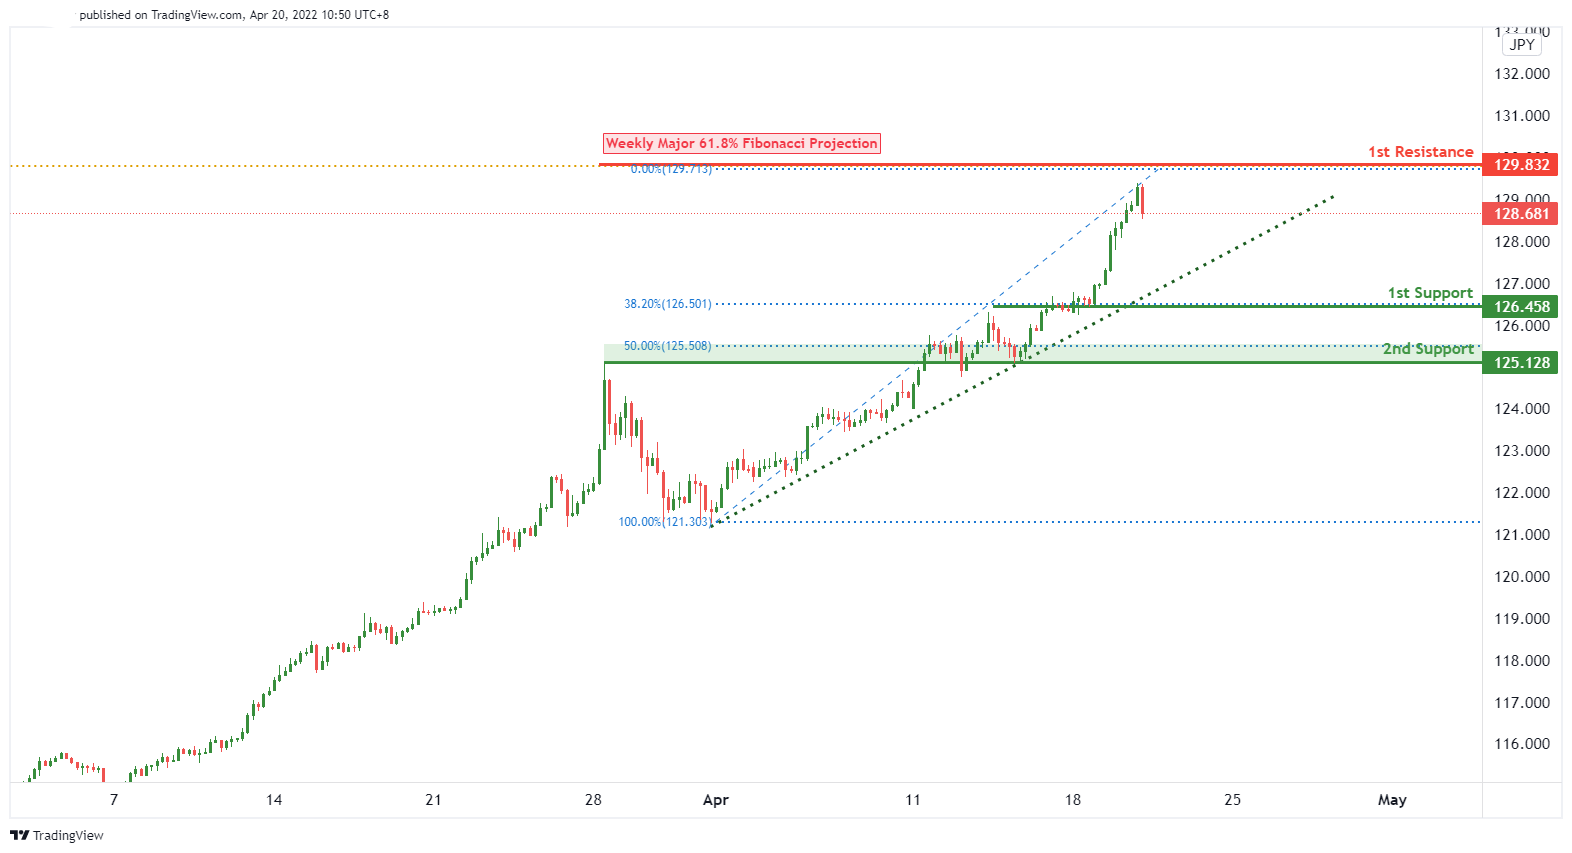
We expect price to have a bearish reversal from 1st resistance level of 129.832 in line with weekly major 61.8% Fibonacci projection towards the 1st support level of 126.458 in line with 38.2% Fibonacci retracement. If price breaks through the 1st support level, it will trigger a dip towards the 2nd support level of 125.128 which is in line with 50% Fibonacci retracement.
Areas of consideration:
- H4 time frame, 1st resistance at 129.832
- H4 time frame, 1st support at 126.458
- H4 time frame, 2nd support at 125.128
AUD/USD:
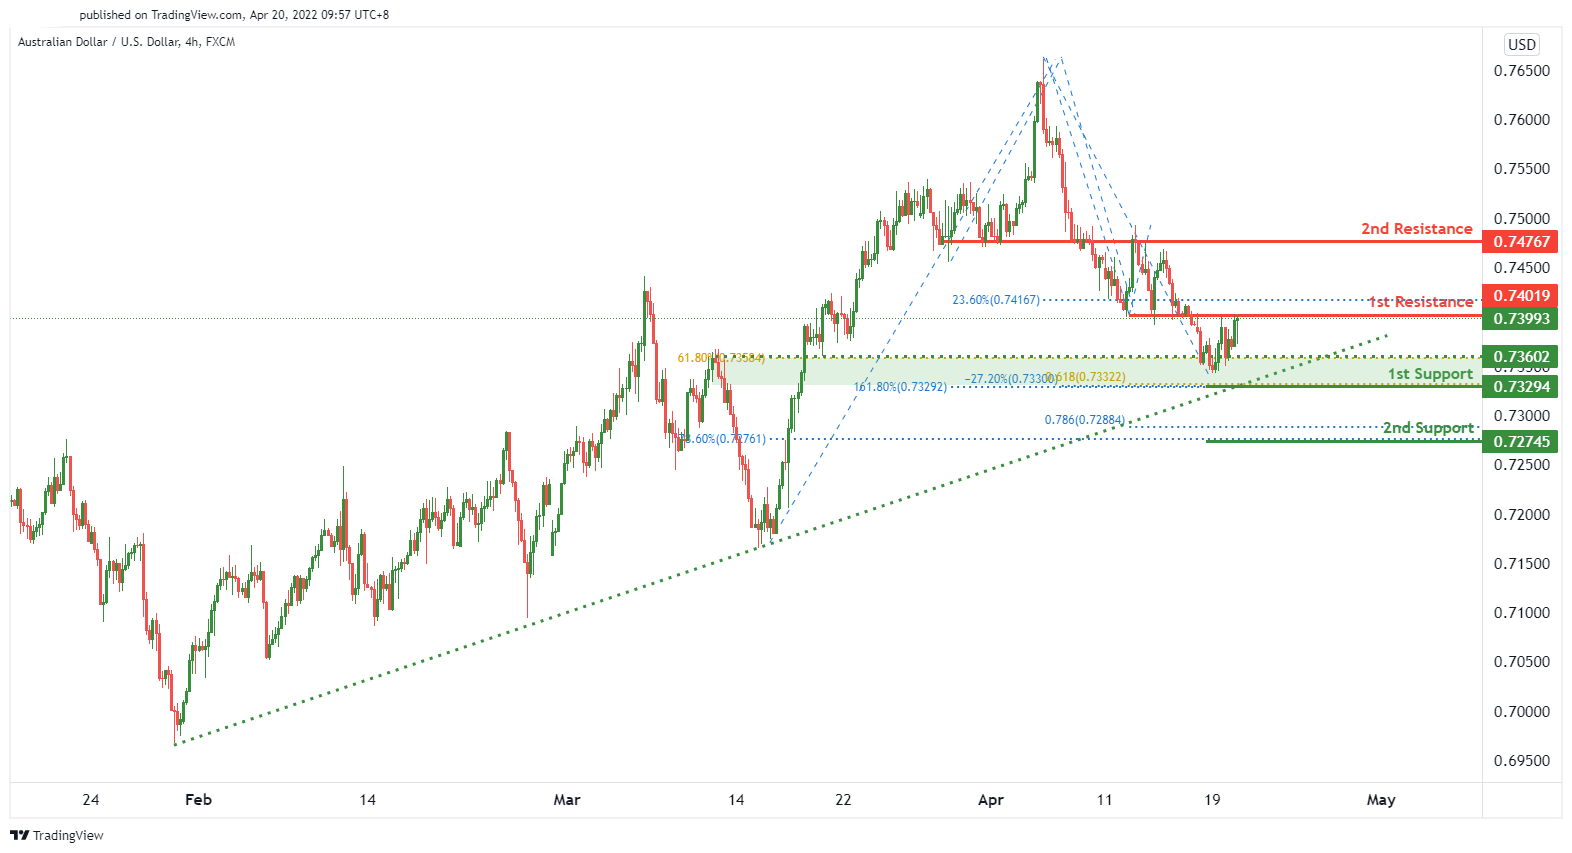
On the H4 timeframe, price is abiding by the ascending trendline. We see the potential for a bearish reversal from 1st resistance at 0.74019 in line with 23.6% Fibonacci retracement towards the 1st support level at 0.73294 in line with 61.8% Fibonacci projection, 161.8% Fibonacci extension and -27.2% Fibonacci expansion. However, price might break through 1st resistance level to trigger to move towards 2nd resistance level at 0.74767 in line with a horizontal pullback resistance.
Areas of consideration
- H4 1st resistance at 0.74019
- H4 2nd resistance at 0.74767
- H4 1st support at 0.73294
- H4 2nd support at 0.72745
NZD/USD:
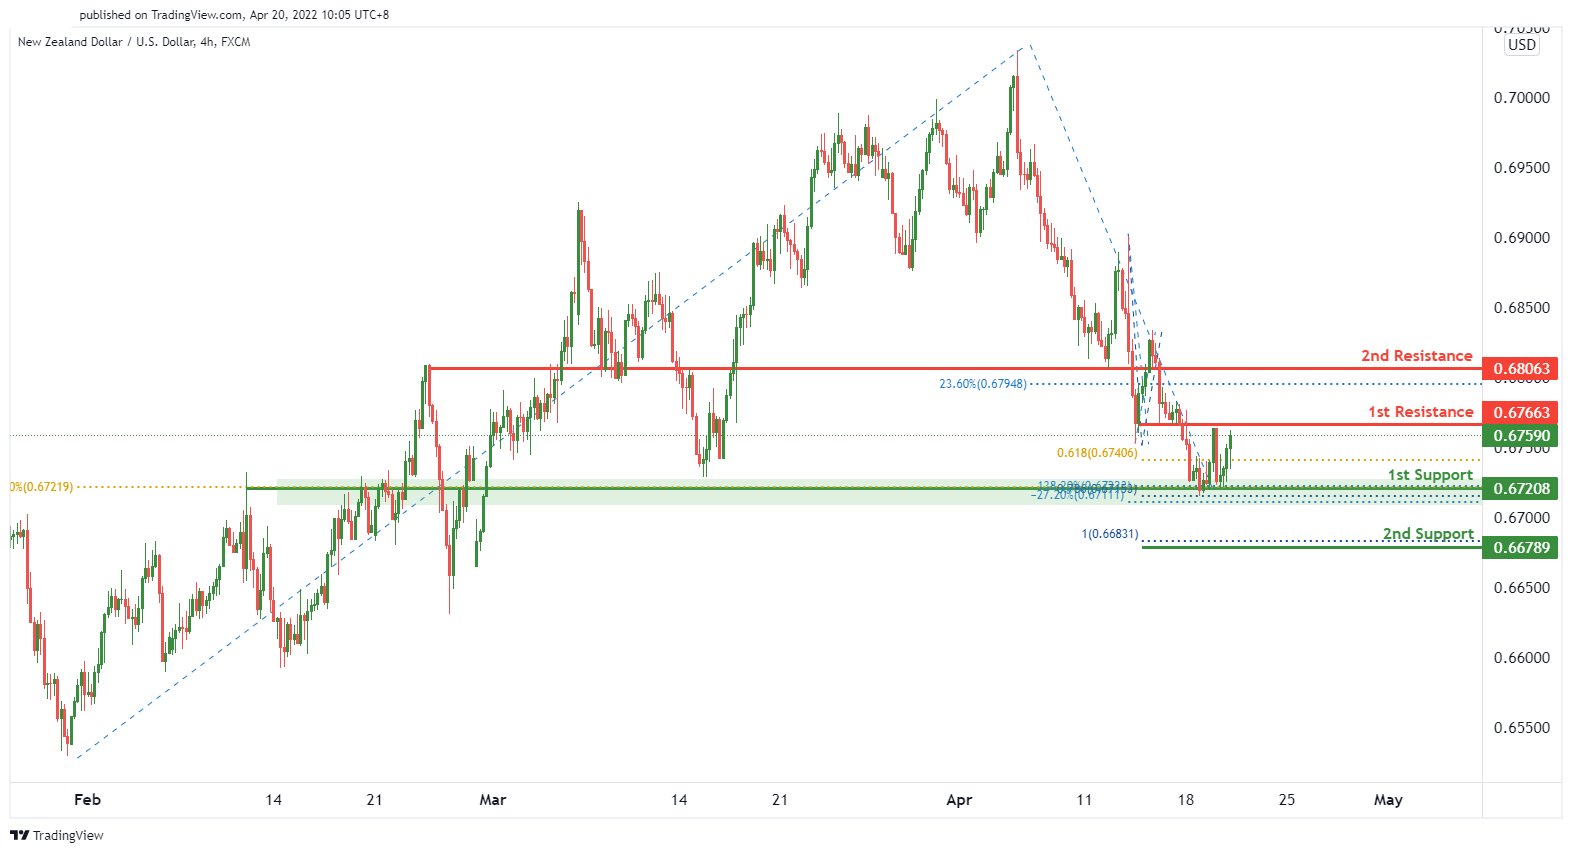
On the H4, we expect to see a potential for a bearish reversal from our 1st resistance level of 0.67663 in line with a minor pullback resistance towards our 1st support level of 0.67208 in line with 61.8% Fibonacci retracement, 138.2% Fibonacci extension and -27.2% Fibonacci expansion. Alternatively, price might break through the 1st resistance level and trigger to rise towards the 2nd resistance level of 0.68063 in line with 23.6% Fibonacci retracement.
Areas of consideration:
- H4 time frame, 1st support at 0.67208
- H4 time frame, 2nd support at 0.66789
- H4 time frame, 1st resistance at 0.67663
- H4 time frame, 2nd resistance at 0.68063
USD/CAD:
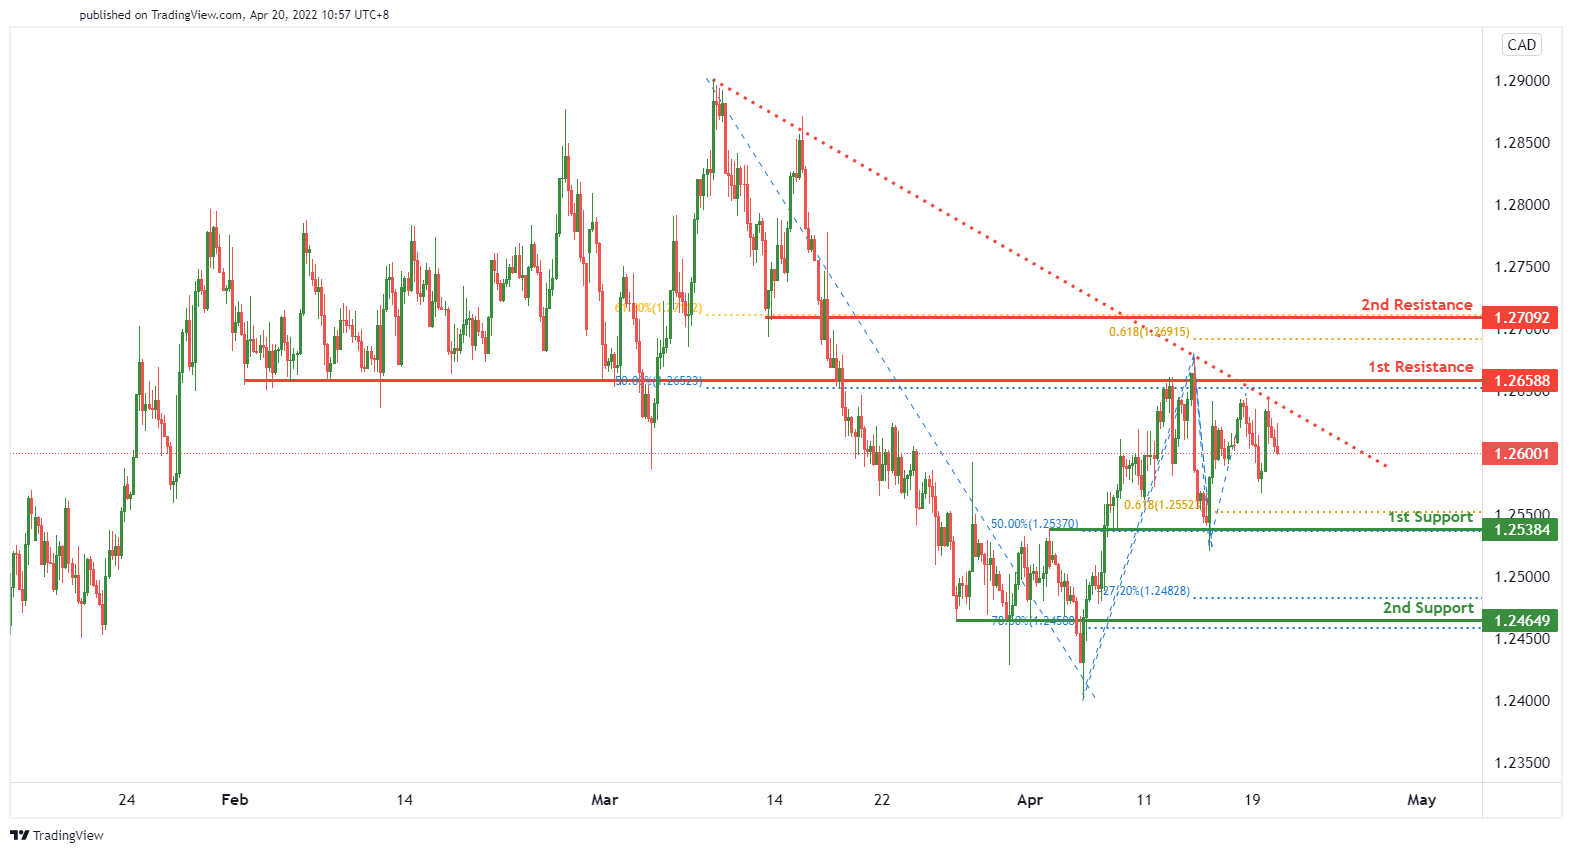
Price is abiding by the descending trendline. We are expecting a bearish dip to occur from 1st resistance level of 1.26588 in line with 50% Fibonacci retracement towards the 1st support level of 1.25384 in line with 50% Fibonacci retracement and 61.8% Fibonacci projection. Alternatively, price might break through the key resistance level and rise to the 2nd resistance level of 1.27092 in line with 61.8% Fibonacci retracement and 61.8% Fibonacci projection.
Areas of consideration:
- H4 time frame, 1st resistance at 1.26588
- H4 time frame, 2nd resistance at 1.27092
- H4 time frame, 1st support at 1.25384
- H4 time frame, 2nd support at 1.24649
OIL:
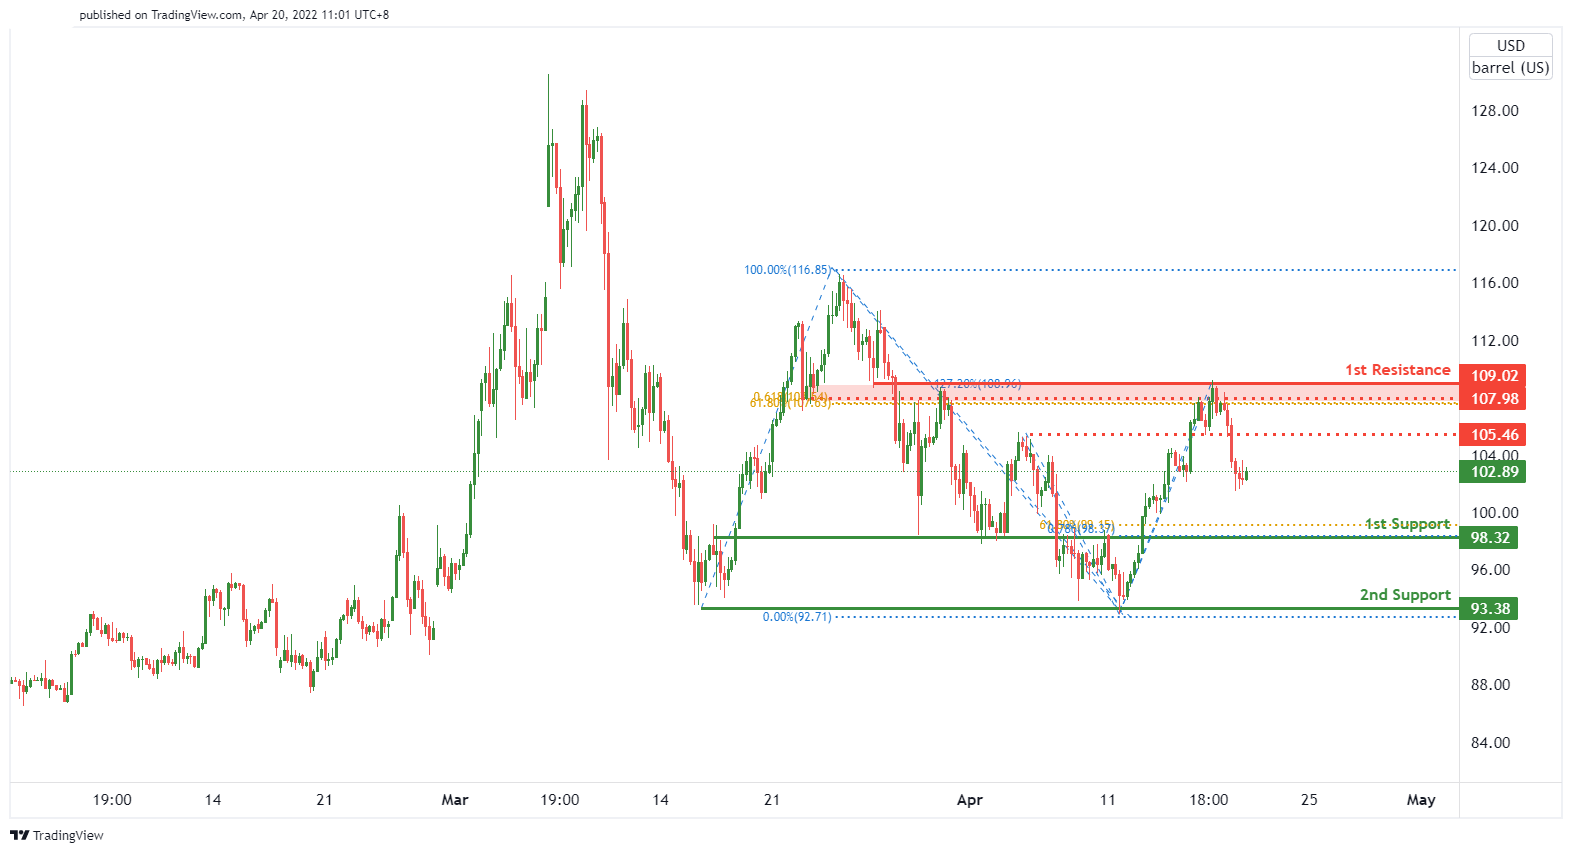
We are expecting for a potential bullish bounce from 1st support level of 98.32 lines up with 61.8% Fibonacci retracement and 78.6% Fibonacci projection towards the 1st resistance level of 109.02 lines up with 61.8% retracement, 61.8% Fibonacci projection and 127.2% Fibonacci extension. Alternatively, price might break the key support level and continue to drop to the 2nd support level of 93.38 along with a horizontal swing low support.
Areas of consideration:
- H4 time frame, 1st resistance of 109.02
- H4 time frame, 1st support of 98.32
- H4 time frame, 2nd support of 93.38
Dow Jones Industrial Average:
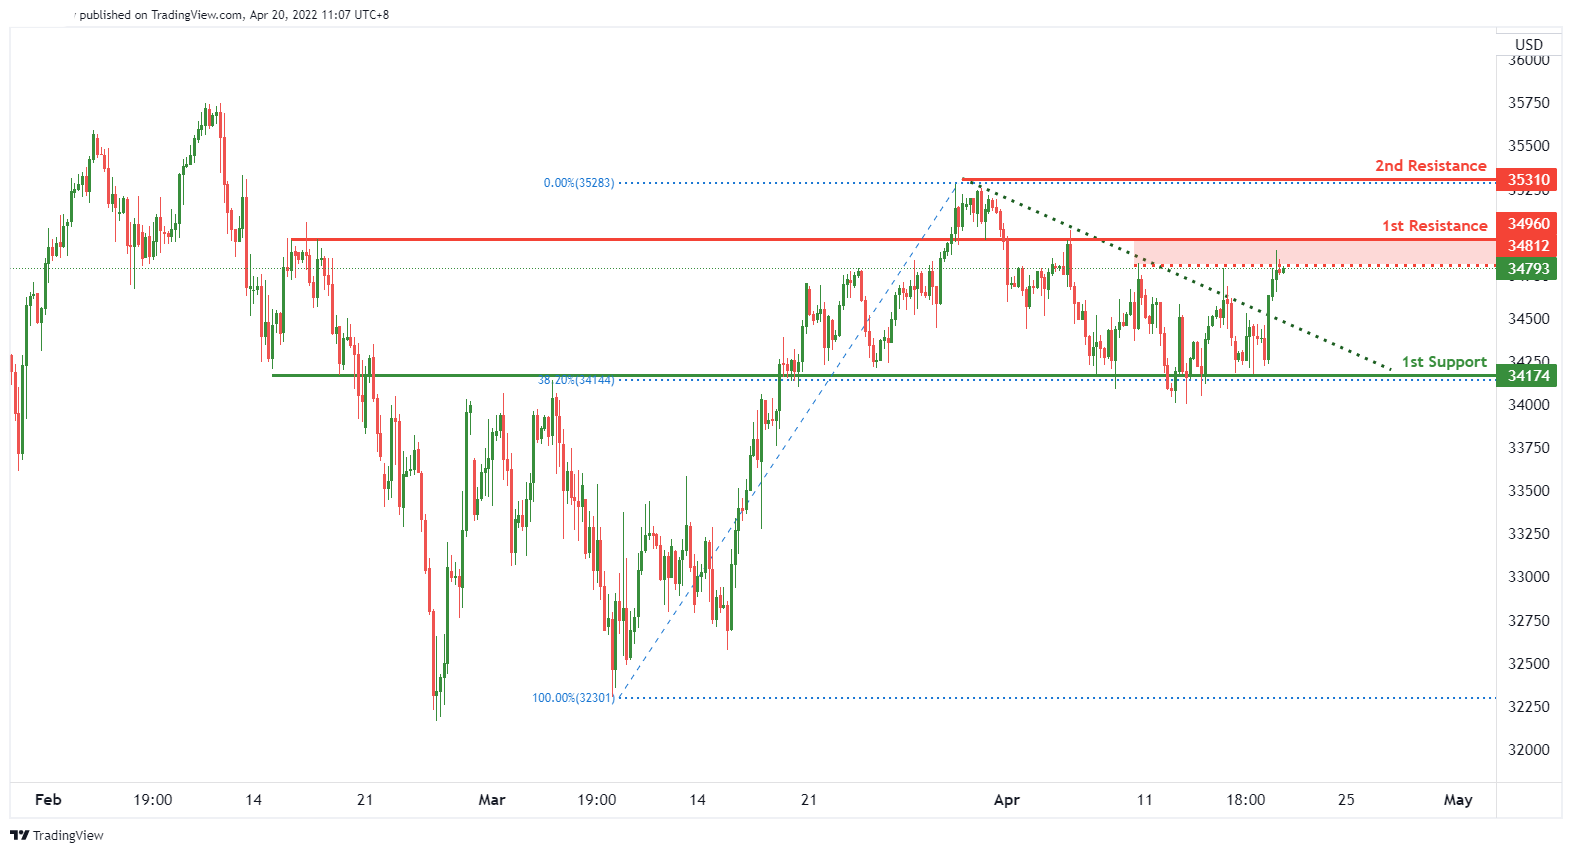
Price is near to the pivot level. We can see a potential for a bearish reversal from 1st resistance level of 34960 along with previous graphical swing high resistance towards the 1st support level of 34174 which lines up with 38.2% Fibonacci retracement. Alternatively, price might break the key resistance level and rise towards the 2nd resistance level of 35310 in line with graphical swing high resistance.
Areas of consideration :
- H4 time frame, 1st resistance at 34960
- H4 time frame, 2nd resistance at 35310
- H4 time frame, 1st support at 34174
AUD/USD Could Extend Losses To 0.7300
Key Highlights
- AUD/USD started a fresh decline from the 0.7650 resistance.
- It traded below a major bullish trend line at 0.7530 on the 4-hours chart.
- EUR/USD is consolidating below 1.0850, and GBP/USD is struggling below 1.3080.
- The Canadian CPI could increase 6.1% in March 2022 (YoY).
AUD/USD Technical Analysis
The Aussie Dollar faced a strong resistance near 0.7650 against the US Dollar. AUD/USD traded below the 0.7550 support level to enter a negative zone.
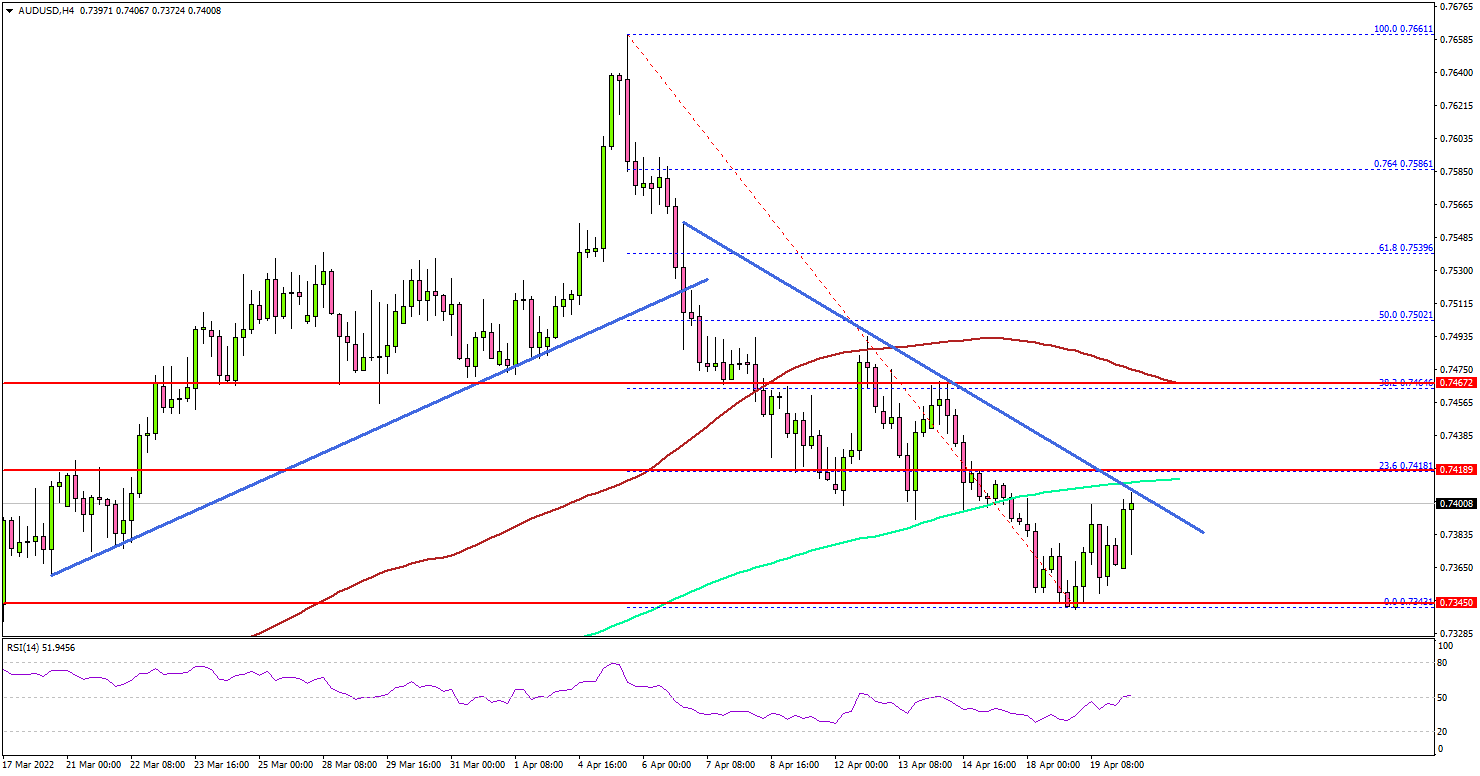
Looking at the 4-hours chart, the pair even traded below a major bullish trend line at 0.7530. There was a close below the 0.7500 level, the 200 simple moving average (green, 4-hours), and the 100 simple moving average (red, 4-hours).
The pair even declined below 0.7400 and tested 0.7340. If the bears remain in action, the pair could extend losses to 0.7300.
The next major support is near the 0.7280 level. Any more losses may perhaps open the doors for a move towards the 0.7220 level.
On the upside, AUD/USD might face resistance near the 0.7400 level and connecting bearish trend line on the same chart. The next major resistance is seen near the 0.7460 level and the 100 simple moving average (red, 4-hours).
Looking at EUR/USD, the pair is showing a lot of bearish signs below 1.0850 and 1.0920. Similarly, GBP/USD is at a risk of more losses below 1.3000.
Economic Releases
- Euro Zone Industrial Production for Feb 2022 (MoM) - Forecast +0.7%, versus 0% previous.
- Canadian Consumer Price Index for March 2022 (MoM) – Forecast +1%, versus +1% previous.
- Canadian Consumer Price Index for March 2022 (YoY) – Forecast +6.1%, versus +5.7% previous.
Elliott Wave View: Silver Looking to Correct Further
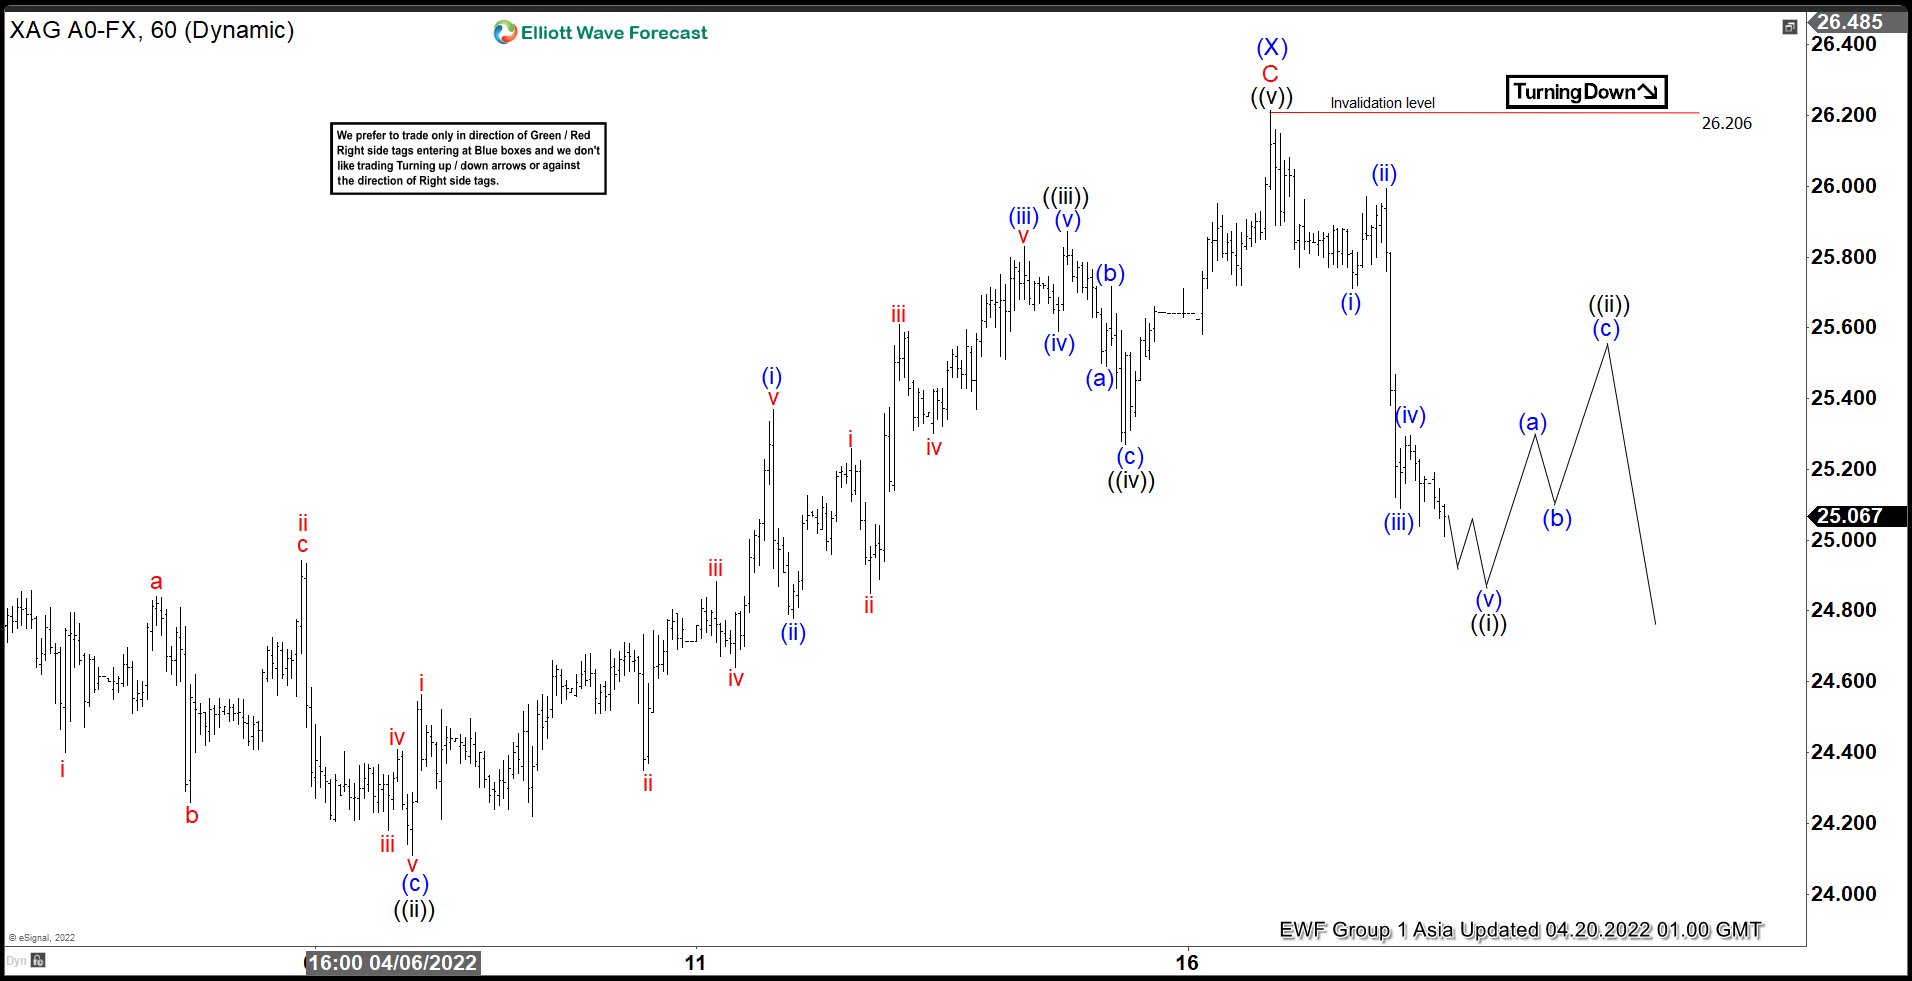
Short term Elliott Wave view in Silver suggests the decline from March 8 high is unfolding as a double three Elliott Wave structure. Down from March 8 peak, wave (W) ended at 24.47 and rally in wave (X) ended at 26.2. Internal subdivision of wave (X) unfolded as an expanded flat where wave A ended at 25.84, pullback in wave B ended at 23.98, and wave C ended at 26.2. The metal has turned lower in wave (Y) with internal subdivision as a zigzag ABC.
Currently Silver is in the process of ending wave ((i)) of A of (Y). Down from wave (X) at 26.2, wave (i) ended at 25.71 and wave (ii) ended at 26. The metal then resumes lower in wave (iii) towards 25.09 and wave (iv) bounce ended at 25.29. Expect wave (v) to end soon which should also complete wave ((i)) in higher degree. The metal should then rally in wave ((ii)) to correct cycle from April 18 high before the decline resumes. Near term, as far as pivot at 26.2 high stays intact, expect rally to fail in 3, 7, or 11 swing for further downside.
XAGUSD 60 Minutes Elliott Wave Chart
XAUUSD Surged to a New Monthly High Price
Gold continued to move higher in the past two consecutive weeks, while it has already reached to a new monthly high in the past days. Gold’s upward momentum so far in April seems to be much steadier and more controlled compared to the previous month which may be a sign that some traders are using a more methodical approach to fundamental developments. In this report, we aim to present clearly the most significant topics surrounding the Gold market and provide a brief technical analysis with specific levels and trends identified.
Very evident is the positive correlation between the USD Index and Gold prices. More specifically, for the past weeks including the current, the correlation between the two instruments remains upwards. However, on a daily basis, the correlation becomes tricky to follow and traders are advised to be mindful of the risks involved. For example, positive US economic data on the 14th of April sent Gold prices lower and favored the greenback. Yet on the 18th of April during the early US session Gold prices climbed to a new monthly high and headed lower thereafter, while the USDIndex surged to a new multiyear high level during the same time. The US economy is currently facing the red-hot rising inflationary pressures which could be good for both Gold and the USD. Some comments by James Bullard the President of the Federal Reserve Bank of St. Louis on Monday seem to highlight the current concerns of mitigating inflationary pressures in the US, with an aggressive interest rate hike and reduction of the Fed’s Balance Sheet. Bullard’s comments even though very hawkish, are not be taken lightly from our point of view, as the current growth the US economy is undergoing with Employment, Industrial Production and Retail Sales as confirmed in the past week, are expected to continue to improve in 2022. Gold traders are aware that this economic expansion can force the Fed to take extraordinary action in the upcoming meeting in May. However, because the Fed is currently facing circumstances that have not been encountered in the past, some doubt whether the central bank will actually solve challenges or bring stabilization to the economy, are present. In this case economic risk which tends to support Gold prices could be elevated and may act as motivation to Gold traders.
On a different front we cannot ignore headlines coming in from the Russian war in Ukraine, where the situation could be possibly worsening. Russia is currently launching new campaigns in different parts of Ukraine, while the catastrophic circumstances are constantly displayed through media. The economic impact however on the Eurozone and the world is equally important as the risks seem to be spreading globally. Oil and Natural Gas prices have remained at very high levels pushing good prices higher for consumers. The sanctions imposed from most of the world on Russia have also led to some Financial institutions believing Russia maybe heading to an economic default. This subject remains key for the global economy and Gold traders are advised to keep an eye on the developments on this front.
As a preparation, for the days that follow we would like to highlight the most important economic releases from the US as they could create volatility for the Gold market. On the 21st of April, we get the weekly Initial Jobless claims and the April Philly Fed Business Index figures. A very interesting day unfolds on Friday the 22nd with the Flash PMI figures for April from various parts of the world including the US. Finally, on Tuesday the 26th of April we get the US Consumer Confidence figure for April.
Technical Analysis
XAUUSD H4 chart
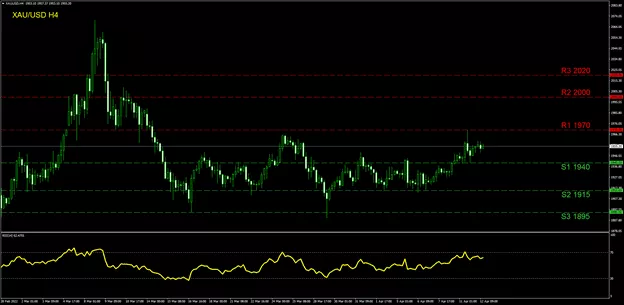
In the most recent 4-hour sessions Gold had surged towards the (R1) 2000 resistance level but was unable to clearly test or breach it. The price action in the following sessions moved lower where Gold is trading currently, just above the (S1) 1970 support level. Since Gold has broken outside the range it had been moving within since mid-March from our point of view the trend has turned upwards. If the trend breaches the (R1) 2000 level, we could be seeing the momentum reaching higher for the (R2) 2020 resistance barrier. In the scenario of an intense bullish trend we could see traders turning their attention to the (R3) 2050 line which is an all-time high level tested briefly in March. On the contrary a possible return of the price action to the (S1) 1970 support level can signal some stabilization. However, if the price action falls below the (S1) we would be crossing into territory seen in previous weeks and a possible movement to the (S2) 1945 support level may be imminent. Our lowest level for this report is currently noted at the (S3) 1915 support hurdle which is the lowest level Gold has tested in April. Please note the RSI indicator below our chart is currently running across the 53-level implying some stabilization has formed in the most recent sessions. As noted, our personal view is for an upward bias for Gold’s trend.
NZD/USD: No Post-Easter Resurrection
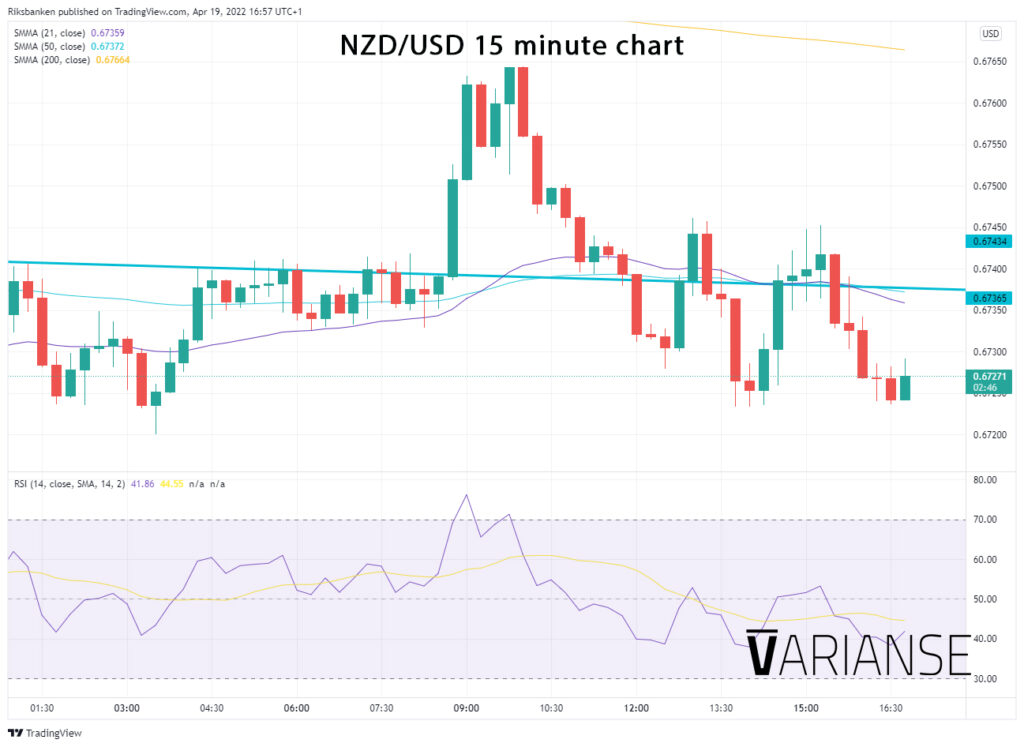
Trades entered the market without any major epiphanies about which direction NZD/USD should head on Tuesday. Buyers early in the London session failed in their attempt to sustain prices above the prior 13 April swing low 0.67654. Sellers, quick to jump on the resulting failed head under shoulders patterns, reasserted their control over the kiwi. At the time of writing, the kiwi was heading toward its fifth consecutive day of losses.
More aggressive policy tightening from the Reserve Bank of New Zealand (RBNZ) on the 12 April has done little, if anything, to support the NZD/USD. Traders are clearly unconvinced the RBNZ will be able to raise interest rates by 50 bps on an ongoing basis as it had done in April. Aggressive Fed tightening, on the other hand, carries greater credibility now. Exactly how long that narrative will play out is up for question. The Fed is due to meet on May 4 and the RBNZD with a fresh set of projections on May 25.
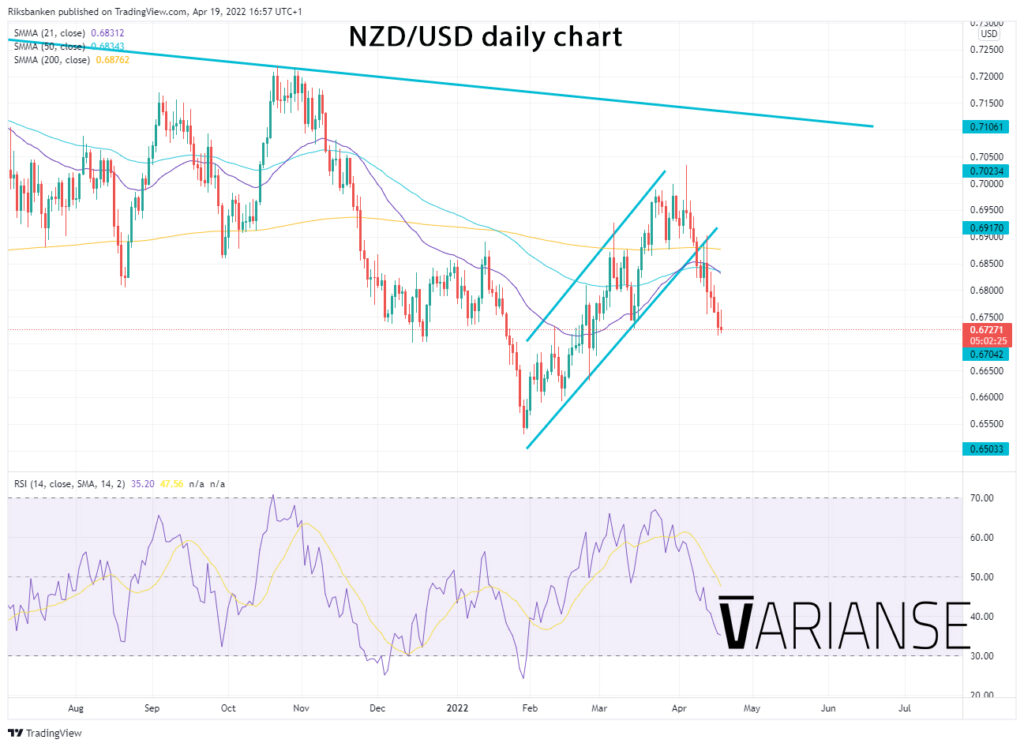
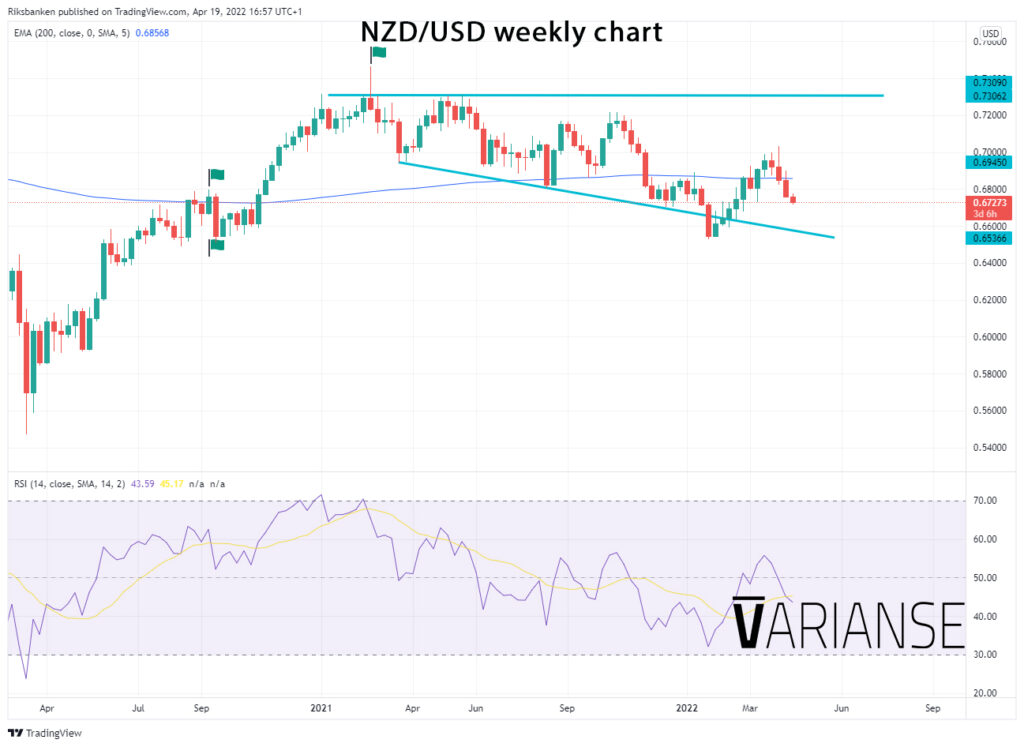
Until then, on a technical basis there is certainly scope for further declines. The daily chart, which exhibits an ascending flag pattern that has broken to the downside and the descending right-angled broadening formation on the weekly time frame, open the possibility of even lower prices. Both 0.65884 and 0.65120 are both important levels for the pair to test. A break below the latter would mark the potential for more protracted losses. Meanwhile, near-term confidence is unlikely to be restored unless the pair can break above 0.68340.
Eco Data 4/20/22
[php_everywhere instance="1"]
Dow Jones Wave Analysis
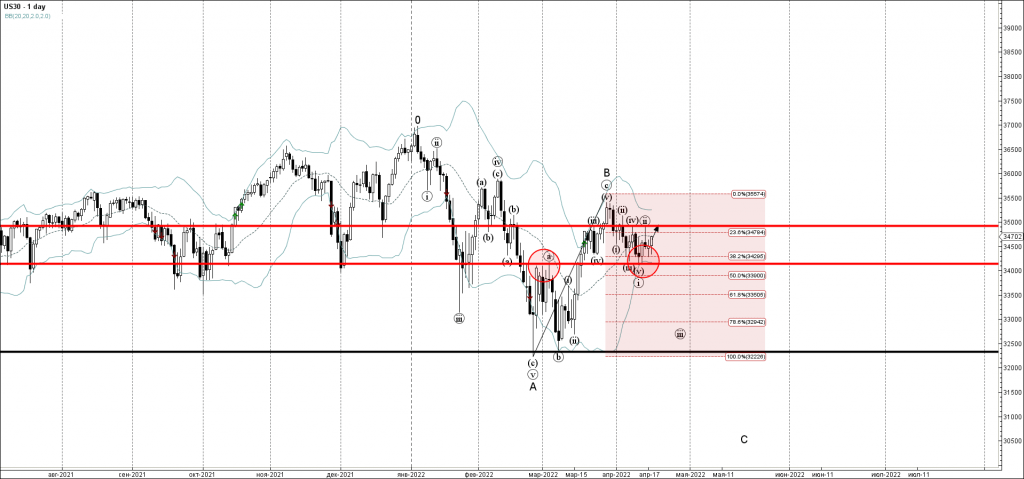
- Dow Jones reversed from support level 34140.00
- Likely to rise to resistance level 34920.00
Dow Jones recently reversed up from the support level 34140.00 (former resistance from March) intersecting with the 38.2% Fibonacci correction of the upward wave B from February.
The support zone near the support level 34140.00 was further strengthened by the lower daily Bollinger Band.
Dow Jones can be expected to rise further toward the next resistance level 34920.00 (top of the previous waves (iv) and (ii)).
GBPJPY Wave Analysis
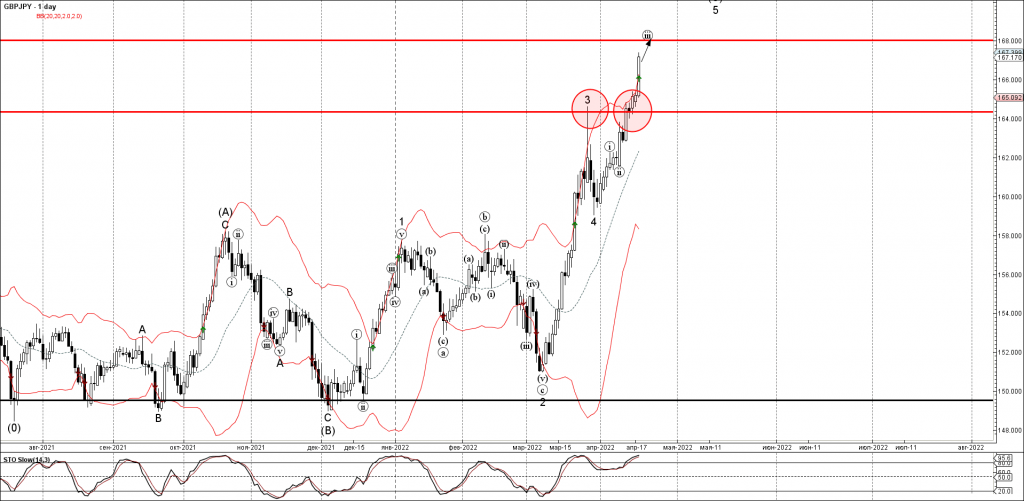
- GBPJPY broke resistance level 164.35
- Likely to rise to resistance level 168.00
GBPJPY is under the bullish pressure after the price broke above the key resistance level 164.35 (which stopped wave 3 at the end of March).
The breakout of the resistance level 164.35 accelerated the active impulse waves 5 and (C).
GBPJPY can be expected to rise further toward the next resistance level 168.00 (target price for the completion of the active impulse wave (iii)).
Australian Dollar Rebounds on Hawkish RBA
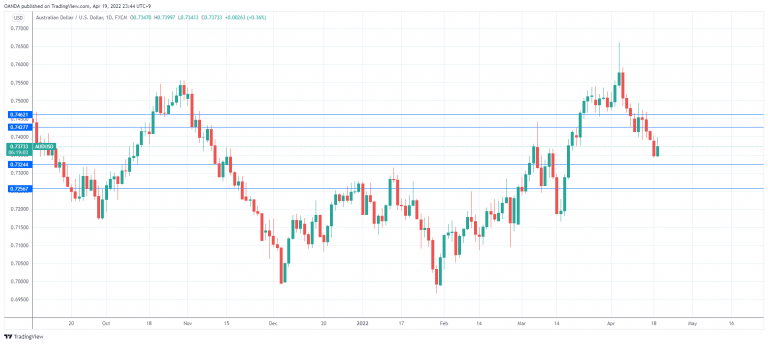
The Australian dollar is back in positive territory on Tuesday, after four straight losing sessions. In the North American session, AUD/USD is trading at 0.7384, up 0.51% on the day.
RBA hints at an earlier rate hike
The RBA sent a hawkish message to the markets, as the minutes from the April meeting provided a strong hint that a rate hike is coming sooner than had been expected. The minutes cited rising inflation and a tightening labor markets as developments that have “brought forward the likely timing of the first increase in interest rates”.
The last time the RBA raised rates was back in 2010, so the markets are eagerly awaiting the lift-off of what is expected to be a rate-hike cycle. All four of Australia’s major banks are predicting that the RBA will hit the rate trigger in June. With Australians going to the voting booths on May 21st, the RBA would prefer to stay quietly on the sidelines in the middle of an election campaign. Still, the May meeting should be considered live, at least until the April inflation report comes out on April 27th. A sharp gain in CPI could force the RBA to respond with a rate hike in May, with a strong possibility of a large hike of 0.40%.
Things appear much simpler for the Federal Reserve, which is widely expected to increase rates by 0.50% at its meeting in early May. Fed members, including the more dovish ones, have been sending out the message that the Fed must take aggressive action in order to contain soaring inflation, which hit 8.5% in March. On Monday, Fed member Bullard, a hawk, said that the Fed rate might need to rise to a “neutral” rate of 3.50% and suggested that a 0.75% hike was a possibility. Bullard’s stance isn’t a reflection of Fed policy, but the very suggestion of a 0.75% hike illustrates that the Fed plans to come out swinging come May.
AUD/USD Technical
- There is resistance at 0.7427, followed closely at 0.7462
- There is support at 0.7324 and 0.7256