

Sample Category Title
GBP/USD Outlook: Bears Continue to Struggle at 1.30 Support but Remain in Play
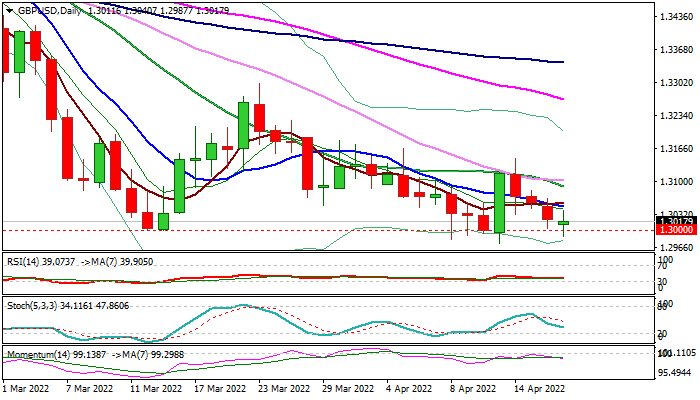
Cable remains biased lower, but bears continue to struggle at psychological 1.30 support and unable to clearly break lower for over one month.
Technical studies on daily and weekly charts show strong negative momentum, with bearish signals being reinforced by 5/200WMA death-cross and likely repeated monthly close below pivotal Fibo support at 1.3164 (38.2% of 1.1409/1.4249 rally).
However, the pair needs firm break of 1.30 pivot to signal continuation of larger downtrend from 1.4249 (June 2021 peak) and end a month-long sideways mode.
Upticks should stay capped under 1.3050 (10DMA) to keep bears intact and guard an upper pivots at 1.3100 zone (Fibo 38.2% of 1.3298/1.2972 bear-leg / 20/30 DMA’s) violation of which would sideline bears and open way for stronger rebound.
Res: 1.3050; 1.3089; 1.3100; 1.3135.
Sup: 1.3000; 1.2972; 1.2900; 1.2855.
EUR/USD outlook: Bears May Extend Towards 2020 Low as Environment Remains Very Negative for Euro
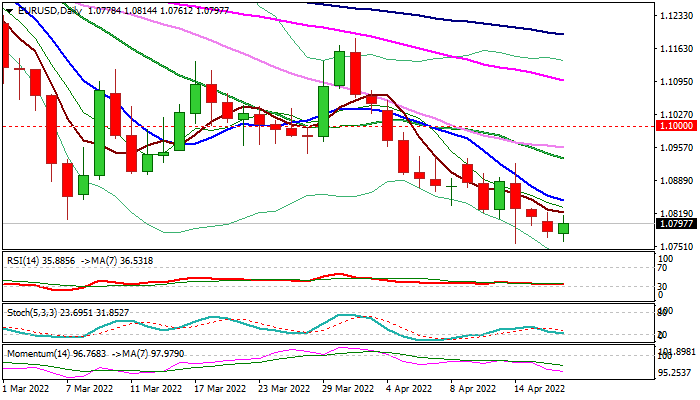
Bears are taking a brief breather on Tuesday, facing a headwinds from new two-year low (1.0757, posted on Apr 14) but remain fully in play and threatening of further losses.
Narrow consolidation is likely to precede push through 1.0757 and 1.0727 (Apr 2020 low) towards key longer-term support at 1.0635 (2020 low).
Dovish stance that the ECB presented in its last policy meeting, despite record inflation in the EU and growing fears of reverse impact of the sanctions imposed to Russia to the union’s economy, continue to strongly weaken the sentiment and prompting traders to sell the Euro.
Daily moving averages in strong bearish setup and rising negative momentum support the notion, with upticks expected to stay below falling 10 DMA (1.0846).
Res: 1.0821; 1.0846; 1.0858; 1.0900.
Sup: 1.0757; 1.0727; 1.0700; 1.0635.
Dollar is Only Halfway Through the ‘Hawkish Fed’ Rally
The dollar index passed 101, which we last saw for just over a week at the height of the lockdowns. But history suggests that this rally has roughly passed the halfway point.
Except for a brief period of stock market panic in March 2020, the last time the dollar was at this level against a basket of the six most popular currencies was in April 2017. The Dollar Index peaked in the 103-104 area in both cases and has not traded consistently higher for the past 20 years.
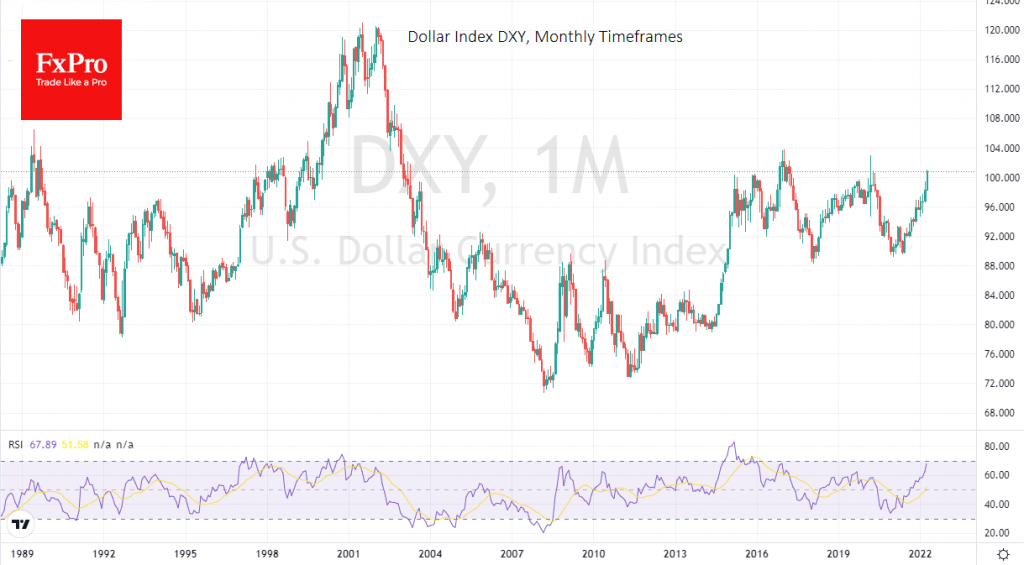
The past two times, the dollar’s rise has been halted by the Fed, easing its policy or tone of commentary, as we have seen stock and commodity markets crash along with the USD rally. That is not the case this time, so the DXY is unlikely to stop near 103-104 as it has done in the last six years.
We are now seeing a rise in the dollar, mainly on the Fed’s switch to monetary tightening mode. We saw that the last three such impulses of dollar growth, which started in 2014, 1998, and 1992 caused the DXY to appreciate by about 25%.
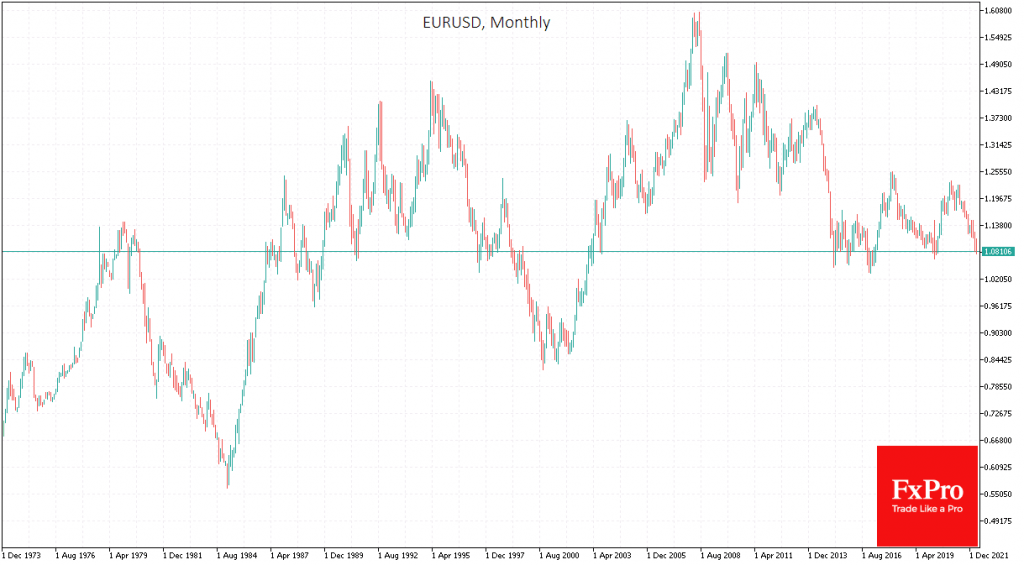
Applying this pattern to the current case, we get that the dollar has exhausted just over half of its upside potential and could strengthen as much as 110-112 on the DXY in the next few months.
For EURUSD, this scenario sets up a plunge towards parity, the lows of the last 20 years. For USDJPY, it could spike to 140, which has not been seen since 1998. And for GBPUSD, a return to 1.2000, the lows of the Brexit-fear era.
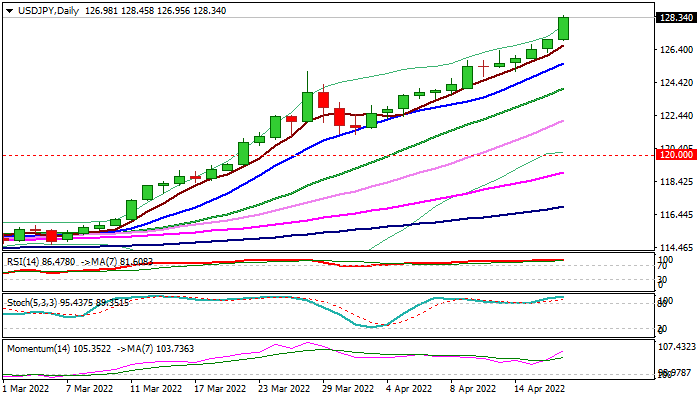
USD/JPY Outlook: Bulls Accelerate after Holiday Pause and Eye Psychological 130 Barrier
The USDJPY accelerated in Tuesday morning, as activities gain pace after traders returned from an Easter break.
Fresh strength is exploring levels above 128 mark and trading at the highest in 20 years, with targets at 129.07 (May 2002 high) and 130 (psychological) being in focus.
The dollar remains well supported by policy divergence between the Fed and BOJ and ECB, while rising safe-haven demand on uncertainty over Ukraine crisis adds to greenback’s bullish sentiment.
The pair is on track for the second consecutive monthly rally (March advance was 5.8% and currently is over 5% in April), with signals that gains may extend further, as indicators on larger timeframes are in overbought territory but continuing to head north, keeping so far in play scenario of attacking 130 barrier. Some headwinds could be expected here, but dips in the current situation are likely to be shallow and offer better levels to re-enter strong bullish market.
Rising 10 DMA (125.60) and former top at 125.10 (Mar 28) offer solid supports which should contain extended dips and keep bulls intact.
Res: 128.45; 129.07; 130.00; 130.40.
Sup: 127.96; 127.24; 126.31; 125.96.
GBPUSD’s Bearish Bias Struggling at 1.30 Handle
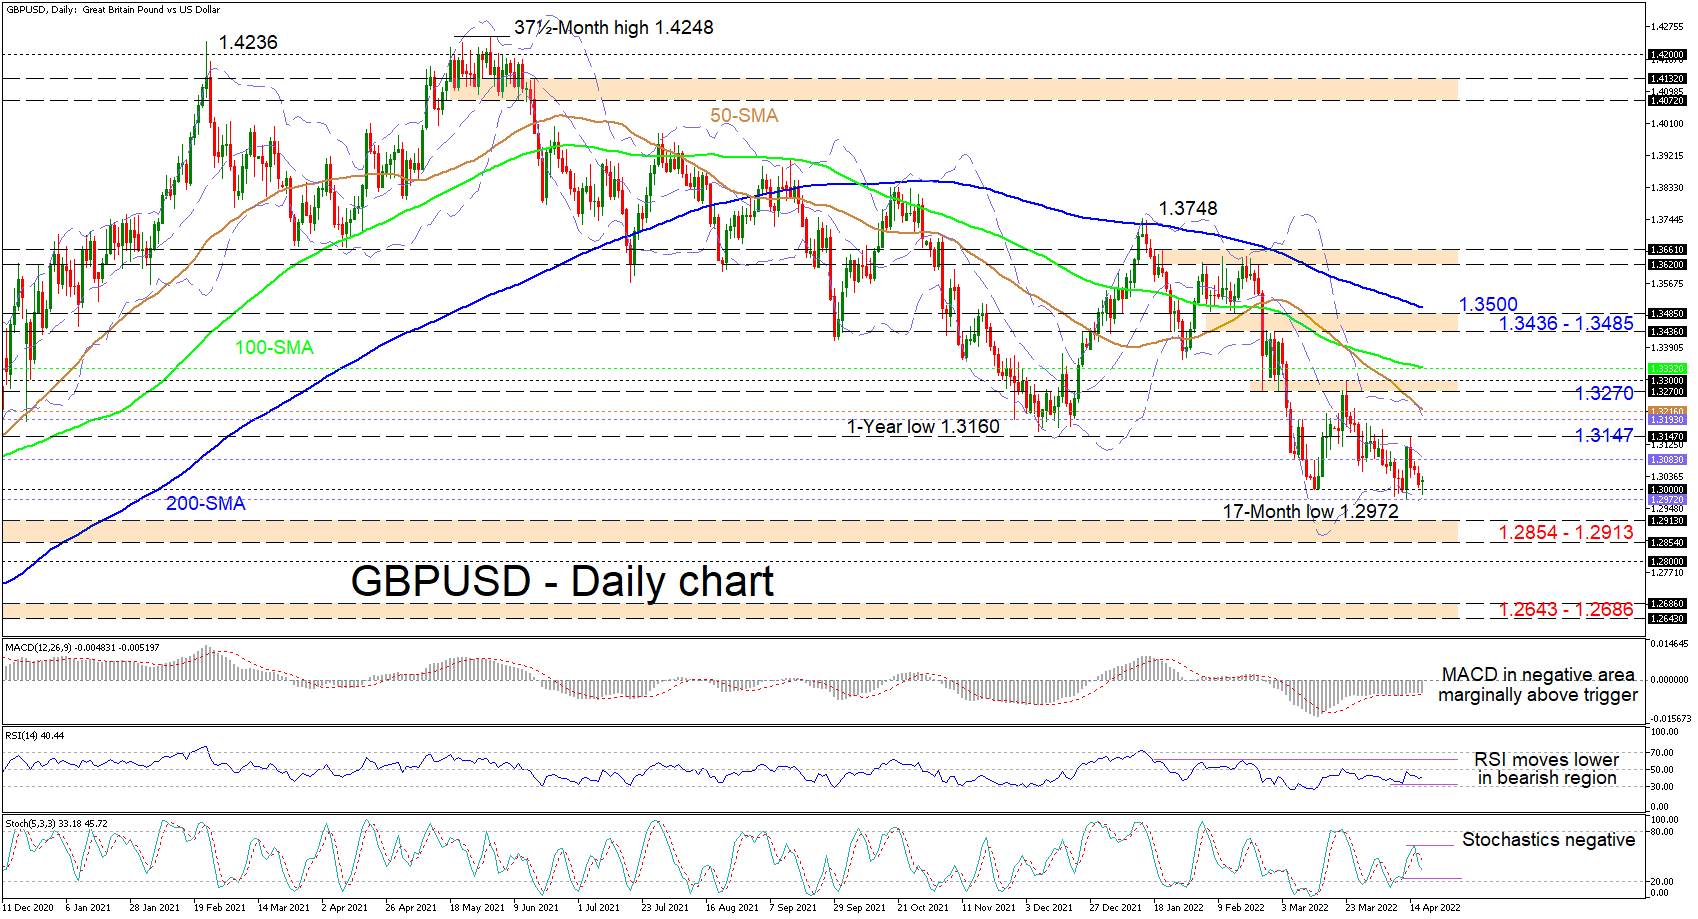
GBPUSD continues to tackle the 1.3000 barrier, which has proven to be more durable, holding strong since mid-March. That said, the falling simple moving averages (SMAs) are endorsing the descent, and appear to be reinforcing bearish defences, which are dampening bullish prospects in the pair.
Moreover, negative momentum has yet to show signs of significant waning, something also being reflected in the short-term oscillators, which are skewed to the downside. The uptick in the RSI, which is in the bearish region has yet to become convincing, while the stochastic oscillator is exhibiting a strong negative charge. The MACD, is in the negative region and a tad above its red trigger line but is showing no dwindling in bearish impetus.
For the descent to resume, sellers would need to drive the price below the 1.3000 mark as well as the 17-month low of 1.2972 and the adjoining lower Bollinger band in its vicinity. Subsequently, the bears could then meet the next downward limitations at the 1.2854-1.2913 support border, moulded by the troughs from October until early November 2020. Successfully diving past this too, the 1.2800 handle may try to delay a deeper drop aimed at the critical 1.2643-1.2686 support border, which extends back to mid-June 2020.
Alternatively, if sellers fail to overwhelm the 1.3000 level, upside impetus could face initial resistance at the mid-Bollinger band at 1.3083 ahead of the 1.3147 high. Another leg higher, the upper Bollinger band at 1.3193, coupled with the descending 50-day SMA at 1.3216, could prevent buyers from stretching towards the 1.3270-1.3300 resistance band. However, if buying interest endures and overpowers the neighbouring 100-day SMA at 1.3332, the bulls may then propel for the 1.3436-1.3485 boundary.
Summarizing, GBPUSD is sustaining a bearish bias below the SMAs and the 1.3270-1.3300 barrier. A dive in the price extending beyond the 1.2854-1.2913 support band could reinforce negative pressures. Yet, for significant optimism to return in the pair, the price would need to lift past the 1.3436-1.3485 obstacle.
Crude Oil and Natural Gas Prices Rally as Supply Concerns Remain
US stocks rose slightly on Monday as investors reflected on the ongoing earnings season. Results published on Monday were mixed. Bank of America, one of the US megabanks, said that its total revenue increased by 2% to $23.2 billion in the first quarter. This increase was helped by a 13% increase in net interest income as loans grew by 8%. These results were in line with what most analysts were expecting. Meanwhile, Schwab said that its net income declined by 6% to $1.4 billion while its adjusted earnings per share declined by 8% to 77 cents. The company attributed the weak results to a challenging environment. Last week, Citigroup and JP Morgan published weak results as well.
The US dollar index maintained its bullish trend even after the weak homebuilder confidence. According to the National Association of Home Builders, the housing market index declined by 2 points to 77 in April. The index sits slightly higher than where it was before the pandemic started. Most homebuilders complained about the rising mortgage rates, which recently hit 5%, the highest point in a decade. The ongoing supply chain issues have also dragged production costs in the past few months. The US dollar will react to the latest US building permits and housing starts data.
The price of crude oil rose on Monday and Tuesday morning even after mixed economic data from China. According to the National Bureau of Statistics (NBS), the country’s economy expanded by 1.3% on a quarter-on-quarter basis and by 4.8% in a year-on-year basis. These numbers were better than the median estimates of 0.6% and 4.4%. However, there are signs that the country’s Covid strategy was hurting growth. For example, retail sales declined by 3.5% in March. Therefore, investors expect that oil demand will slow in the coming months since China is the biggest consumer of oil.
XBRUSD
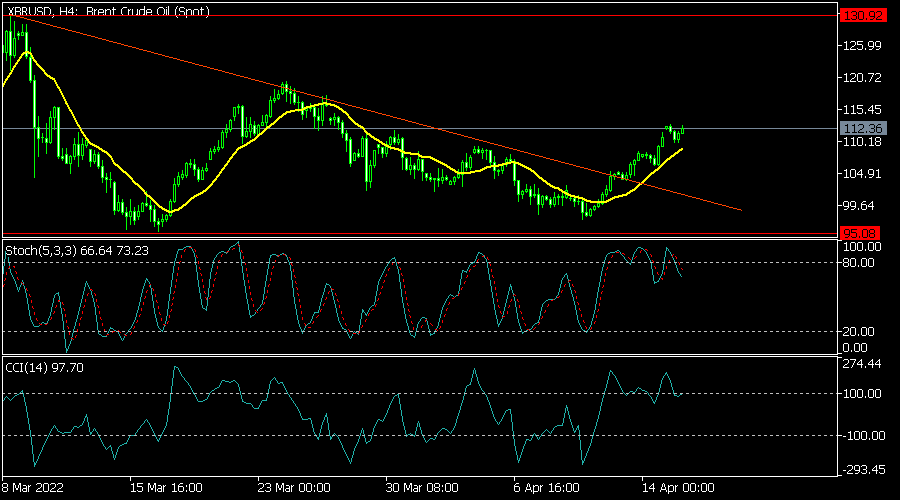
The XBRUSD pair rose to a high of 112.27, which was the highest level since Friday. On the four-hour chart, the pair moved above the descending trendline shown in red. The pair has also invalidated the descending triangle pattern shown in red. It also moved slightly above the 25-day and 50-day moving averages while the Commodity Channel Index (CCI) has been rising. Therefore, there is a likelihood that the pair will keep rising as the EU considers banning Russian oil.
EURUSD
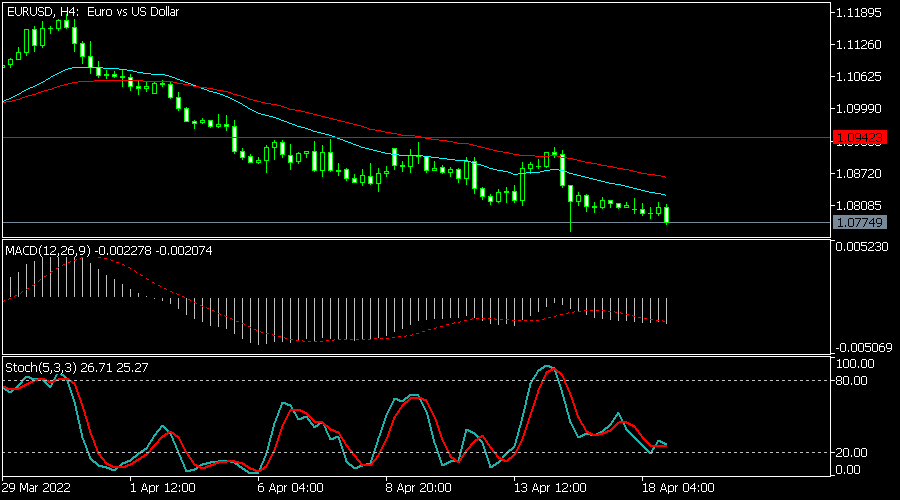
The EURUSD pair continued its bearish trend as the euro sell-off continued. The pair declined to a low of 1.0775, which was the lowest level since Thursday last week. It has moved slightly below the 25-day and 50-day moving averages while the MACD has moved below the neutral level. The Stochastic oscillator moved below the oversold level. Therefore, the pair will likely keep falling as bears target the support at 1.0700.
XNGUSD
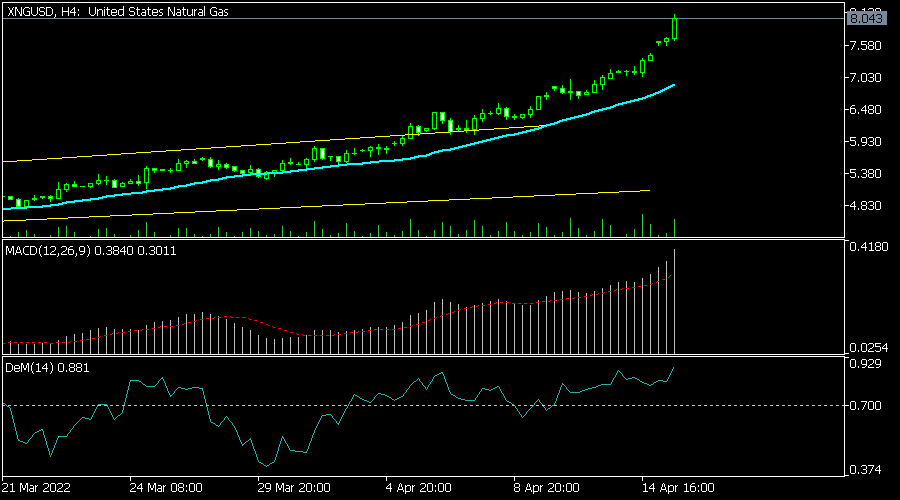
The XNGUSD pair jumped to a high of 8.04, which was substantially higher than the lowest level this year. It has moved above the short and long-term moving averages while the DeMarker and MACD have kept rising. Therefore, the pair will likely keep rising as bulls target the resistance at 8.50.
A Volatile Week ahead for Financial Markets?
Stocks in Asia traded cautiously on Tuesday, following a negative close on Wall Street overnight as growth concerns, inflation worries and geopolitical tensions hit risk sentiment. European markets opened lower this morning due to the deepening crisis in Ukraine, with the caution likely to find its way back to US markets this afternoon. In the currency space, the mighty dollar rose to a fresh two-year high during early trade, supported by rising treasury yields and Fed hike bets. Gold slipped after almost kissing $2000 in the previous session, while oil benchmarks steadied after jumping on Monday.
Despite the public holiday in most of Europe yesterday, this is shaping up to be another volatile and eventful week for global markets. The latest comments from the World Bank have added to the cocktail of caution that will most likely influence sentiment over the next few sessions. The bank cut its global growth forecast for 2022 by nearly a full percentage point to 3.2% from its previous estimate of 4.1%, thanks to the war in Ukraine, soaring inflation, and the lingering effects of Covid-19. Later today, the International Monetary Fund (IMF) will release its updated global economic outlook with markets expecting a downgrade for growth this year. Such a development may hit investor confidence, sweetening appetite for safe-haven assets.
On the earnings front, Johnson & Johnson and insurance company, Travelers will report their latest results before the opening bell. Streaming giant Netflix will release its earnings after the market close. Traders will also focus on speeches from financial heavyweights Fed Chair Jerome Powell and ECB President Christine Lagarde later this week.
Dollar flexes muscles across the FX space
The dollar tightened its grip on its throne this morning by rising to a fresh two-year high as investors braced for more aggressive U.S rate hikes. Markets have fully priced in a 50bp rate hike at the Fed’s May meeting, with the odds of another half-point rate hike in June very high. Given how the dollar has appreciated against every single G10 currency this month, bulls are certainly in a position of power to drive prices higher.
When considering how the week ahead will be filled with more speeches from Fed officials, this could fuel upside gains if they all sing a hawkish tune. Indeed, we heard from arch-hawk Bullard overnight who signaled an openness to a 75bp hike. The dollar index (DXY) has the potential to challenge 103.00 if a solid daily close above 101.00 is secured.
Commodity spotlight: Gold
After rallying within a hair’s length of $2000 in the previous session, gold is trading back around $1974 as of writing. With numerous competing themes likely to influence market sentiment this week, gold may find itself pulled and tugged by conflicting forces. Heightened geopolitical risks and global growth concerns could trigger risk aversion, sending investors rushing towards gold’s safe embrace. However, an appreciating dollar, rising Treasury yields, and Fed hike expectations may create multiple obstacles down the road.
Looking at the technical picture, gold has the potential to trend higher, but prices seem to be forming another range. Support can be found at around $1960 and resistance at $2000. A move back below $1960 could trigger a selloff towards $1920. Alternatively, a solid breakout above $2000 may open the doors towards $2009, $2015, and $2050, respectively.
EURJPY Bulls Get Back on Track; Next Goal 138.90
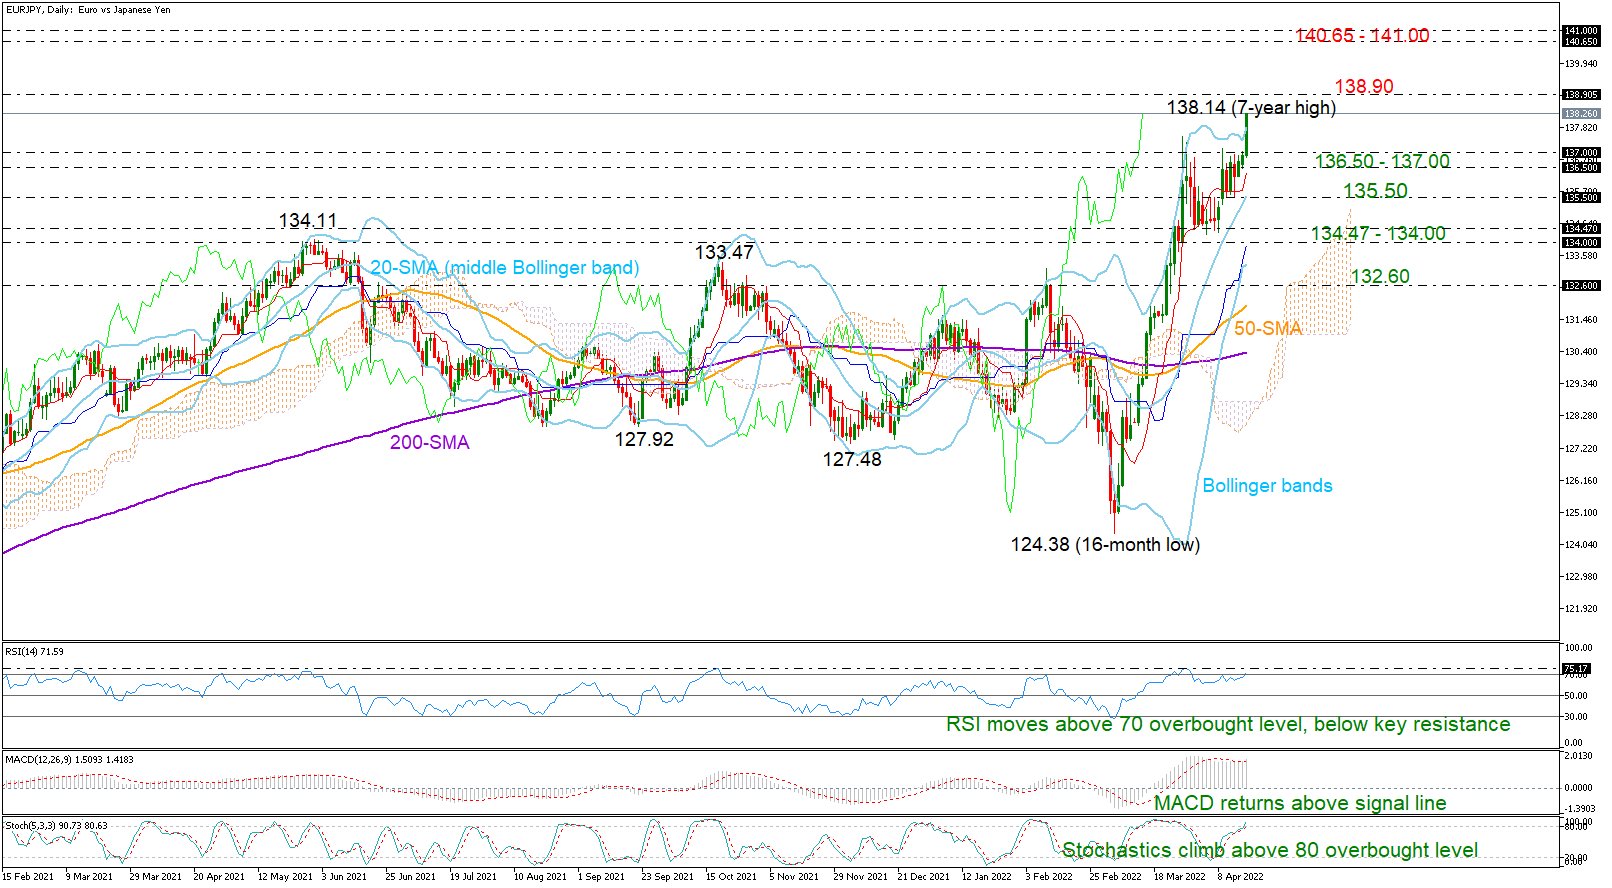
EURJPY violently cracked the 136.50 – 137.00 boundary after more than two weeks of consolidation to advance to a new seven-year high of 138.14 on Tuesday.
The door has now opened for the 138.90 resistance from August 2015, with the momentum indicators favoring additional bullish actions, though with some conservatism. Specifically, the MACD is trying to resume its positive direction above its red signal line, but the rising RSI and the fast Stochastics are entering the overbought region, warning that any further improvement could be constrained. Note that the price is currently looking for a close above the upper Bollinger band, making a slowdown likely in the coming sessions as well.
In the event the rally successfully overcomes the limits around 138.90, the next obstacle could pop up within the 140.65 – 141.00 zone from June 2015. Higher, the pair may push for a close above the 142.00 round-level with scope to reach the 143.30 barrier.
Otherwise, if the price erases its latest pickup, sinking back below 136.50, it may initially seek shelter near the 20-day simple moving average (middle Bollinger band) at 135.50 before heading for the 134.47 – 134.00 support area. A decisive step below the latter would downgrade the positive outlook to neutral, bringing the 132.60 on the radar.
In brief, EURJPY is expected to haunt fresh gains in the coming sessions, though whether the bulls will successfully knock down the wall at 138.90 remains to be seen.
Daily Technical Analysis
EUR/USD
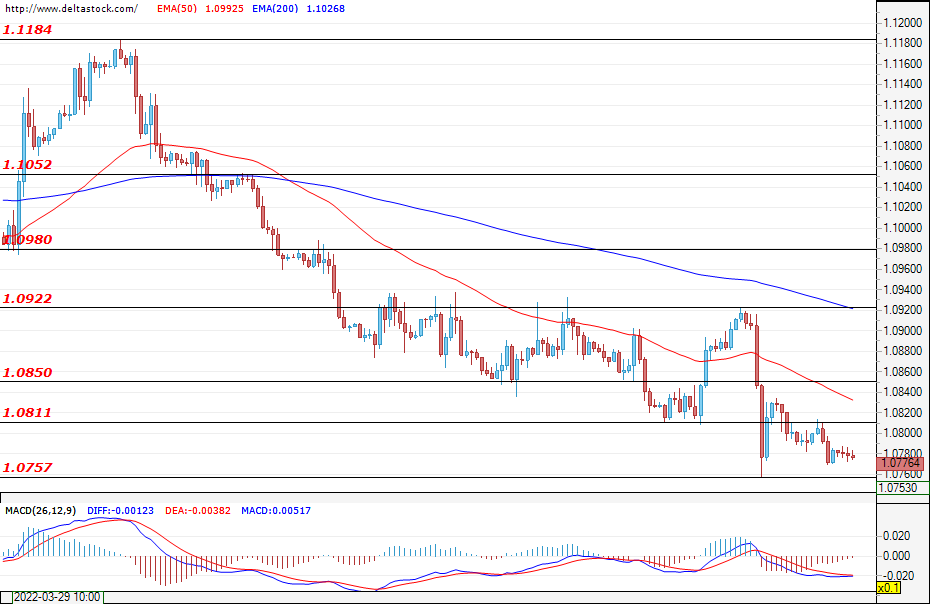
The euro started the week with a loss at low trading volumes. The breach of the 1.0810 zone is currently limiting the buyers, and it is possible that with the opening of the European markets after the holidays, the zone could be tested again. Expectations remain negative, with the daily support for the pair being 1.0757. A potential breach of this level would create the likelihood of the price declining towards 1.0640. A full recovery from the losses at the moment seems unlikely and forecasts are for an acceleration of the downtrend. Given the upcoming holidays, the bulls could attempt to fill in the imbalances after the drop from 1.0922, but all their attempts are expected to be limited to the zone of 1.0840 – 1.0850.
USD/JPY
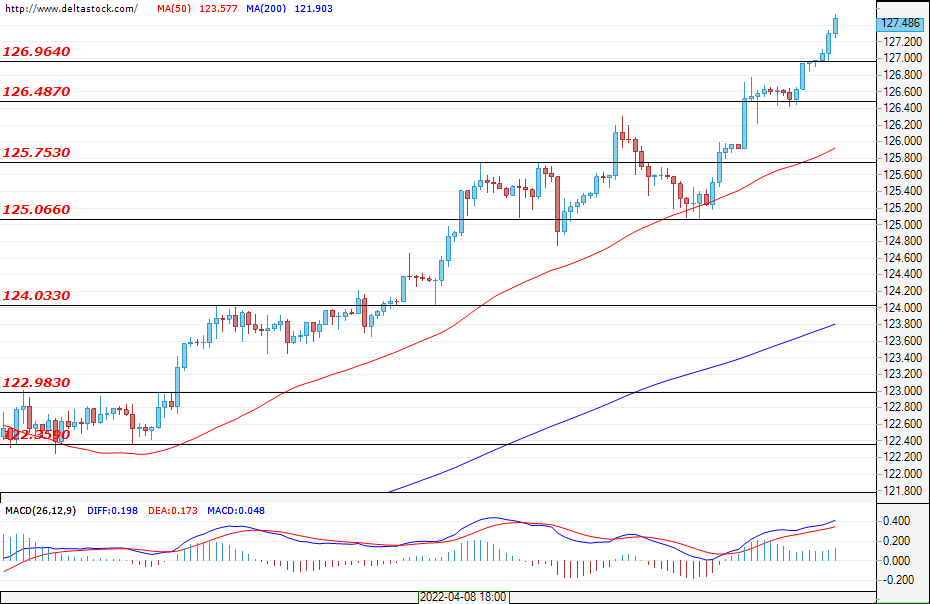
The uptrend continues in full force and it is about to become parabolic. The opinion that the move is caused by the highest time frames and by significant changes in the macro environment has been confirmed and 149.80 can be determined as a potential target of the impulse. The last significant resistance at 125.75 failed to hold the bulls for long, and this week prices quickly moved away from the zone. The first support zone for the bulls is 126.96, followed by 126.48. In the early hours of today, the rally continues and minor pullbacks can be expected, however the growth is expected to continue in the next sessions as well.
GBP/USD
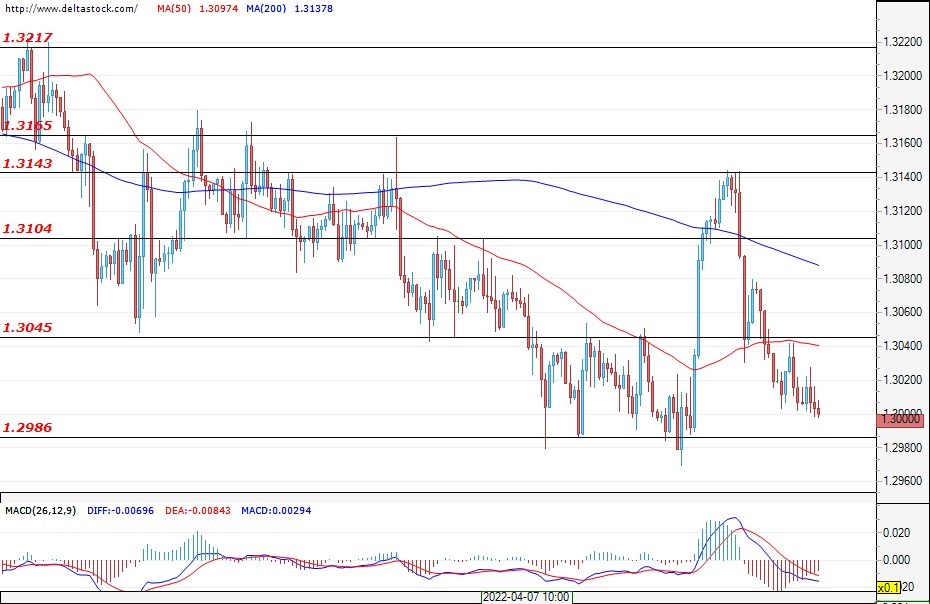
The Cable is also experiencing serious difficulties against the U.S. dollar, and in the early hours of today, prices turned lower to test the support at 1.2986. A breach of the zone would provoke a decline towards 1.2850 and 1.2660. It is expected that the downward movement will gain momentum and that any possible bullish corrections would remain limited by the resistance at 1.3045.
EUGERMANY40
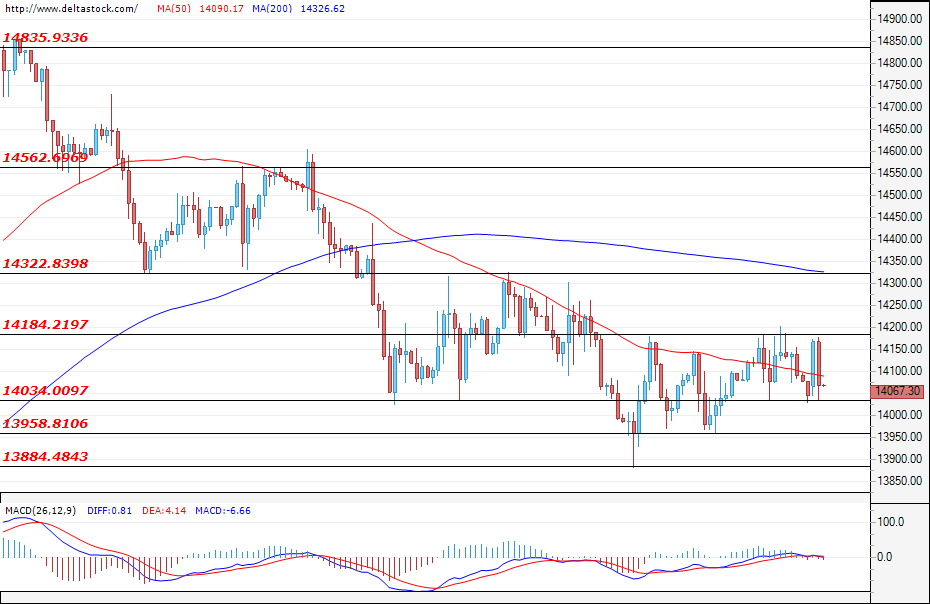
The German index continues to trade without a clear direction and so far prices have remained above the support at 13960. The first significant resistance can be noted at around 14180, followed by 14320. The war in Ukraine continues to weigh on the European stock markets and investors seem to be waiting for the quarterly earnings releases before making any more serious moves. The sentiment is mixed and a confirmed breach of the consolidation would be a telling sign of the future market developments.
US30
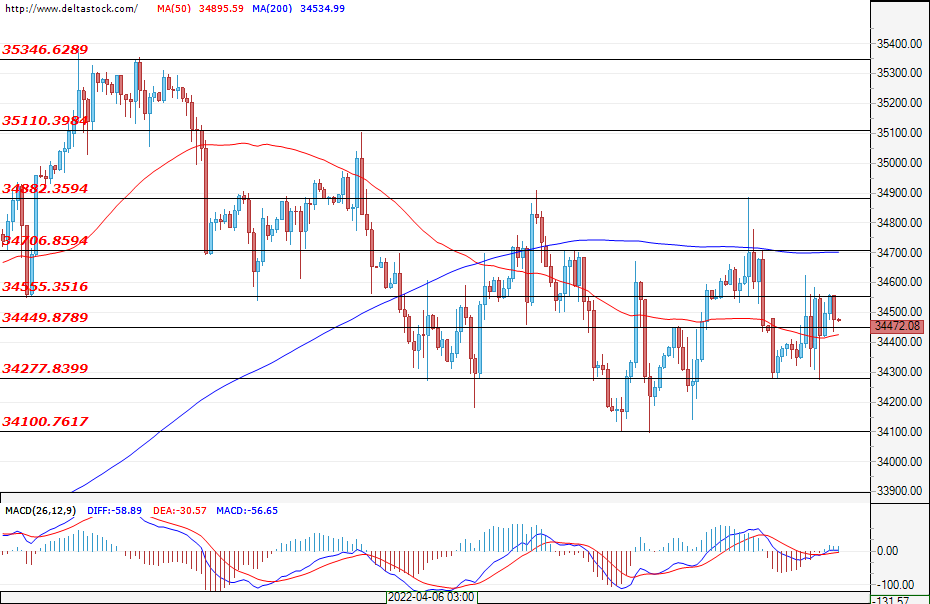
The US30 narrowed the losses and the lack of new lows showed the first signs of a reversal. The first support for the bulls is the area at 34280, while at around 34450 we can see the accumulation of positions. With the kick-off of the corporate earnings season, an increase in activity is expected, while a more tightened monetary policy by the Fed does not necessarily mean that we should expect a negative market performance. A breach of 34555 would open the possibility for a test of the larger structure at 34882, and if it is overtaken, then a new test of 35346 could also be expected.
Yield Dynamics Put EUR/USD Weakness into Perspective
Markets
The ECB on Thursday last week disappointed euro bulls as they went into a four-day weekend. They hoped for something more than an almost unchanged assessment, especially after inflation in March again surprised to the upside. Between the lines we still read that a July rate lift-off is certainly possible, but the euro required a clearer signal. EUR/USD fell from an intraday high of 1.0923 to below 1.08 but managed to close above still (1.0828). That was just postponing the inevitable though. The pair in the days thereafter, admittedly in low-volume trading, eased further.
As of this morning, EUR/USD is trading in the 1.077 area; a support zone marked by the February-May 2020 correction lows. In case of a break we’re eying a return to the pandemic low of 1.0636. This looks increasingly likely, especially with Fed governors now starting to talk about 75 bps rate hikes. The governor in case, Bullard, said it was not his base case today but remember how 50 bps moves was no-one’s either, until recently.
Moves in EUR/GBP were similar yet less dramatic from a technical point of view. The duo forfeited 0.83 but steered clear from the 2022 low. It even staged a minor rebound after hitting support at the lower bound from the downward sloping trend channel into the high 0.82 zone currently.
Interest rate markets behaved interestingly. The European front-end eased a few bps in the wake of the ECB leaving markets still a bit in the dark with respect to the timing of a first hike. The German 2y yield neared 0% but a return into negative territory was never really an option (0.05%). Europe’s 2y swap finished at 0.70%, down 3 bps. The long end, however, underperformed heavily. The steepening (8 bps rise in the German 10y yield or 9-10 bps in swaps) came as inflation expectations remain on the rise. Markets judge the ECB as being too slow to react. Depending in the gauge, indicators melt up to cycle/multi-year highs or even series highs.
Reports (from the NYT) that the EU is moving towards adopting a phased-in ban on Russian oil obviously add to such moves. In just five days, Brent jumped from $100 to $113/b currently.
Yield dynamics also put EUR/USD weakness into perspective since inflation expectations in the US have plateaued. Real yields are the driving force there. The 2-y yield stabilized near but below 2.50%. The 10y yield however just yesterday hit a new cycle high of 2.85% and the 30y is within 6 bps of the 3% landmark.
It is also what is crushing the Japanese yen: USD/JPY soars past 128 this morning to a 20-year high. We see few reasons for the current yield trends to dramatically reverse course for the time being. As such, there’s no stopping king dollar either.
News Headlines
In the Minutes of the April policy meeting, the Reserve Bank of Australia indicated that time is coming closer for conditions to be fulfilled to raise its policy rate. The RBA sees core inflation rising above the 2%-3% inflation target band in the Q1 and further upward pressure is likely. The RBA also sees wage growth picking up, however this develops still at a pace that is likely below rates that are consistent with inflation being sustainably at target. The Bank will closely monitor important additional evidence on both inflation and the evolution of labour costs. Markets are discounting a rate hike first rate hike for the June 7 policy meeting. The Australian 2-y yield rose 7.8 bps to 2.11% this morning. The Aussie dollar rebounded slightly after recent correction to trade near 0.7370. Economic data for the first quarter published in China yesterday painted a mixed picture. GDP growth unexpectedly rose from 4.0% Y/Y to 4.8% Y/Y YTD. Industrial production eased to 6.5% YTD Y/Y, retail sales growth slowed from 6.7% YTD Y/Y tot 3.3%. The March figure even declined to -3.5% Y/Y. The surveyed jobless rate also unexpectedly jumped from 5.5% to 5.8%. The property sector faces ongoing headwinds (residential property sales YTD declining to -25.6%). In a statement, the PBOC announced a series of 23 selective measures to support the economy. Amongst others, the package includes relending programs making funds available for banks to continue to finance sectors that are hit by lockdowns/the consequences of the pandemic. The Bank also advocates banks to continue to support financing to local governments’ projects and other major investment projects. For now, the bank didn’t signal any RRR cut or broader rate reduction.