

Sample Category Title
Bitcoin ( BTCUSD ) Forecasting The Decline After Elliott Wave Double Three Pattern
Hello fellow traders. In this technical article we’re going to take a look at the Elliott Wave charts charts of BTCUSD published in members area of the website. Recently Bitcoin made recovery against the 69097.5 peak that has unfolded as Elliott Wave Double Three Pattern. It made clear 7 swings from the lows and complete at the extreme zone. In further text we’re going to explain the Elliott Wave pattern and forecast
Before we take a look at the real market example, let’s explain Elliott Wave Double Three pattern.
Elliott Wave Double Three Pattern
Double three is the common pattern in the market , also known as 7 swing structure. It’s a reliable pattern which is giving us good trading entries with clearly defined invalidation levels.
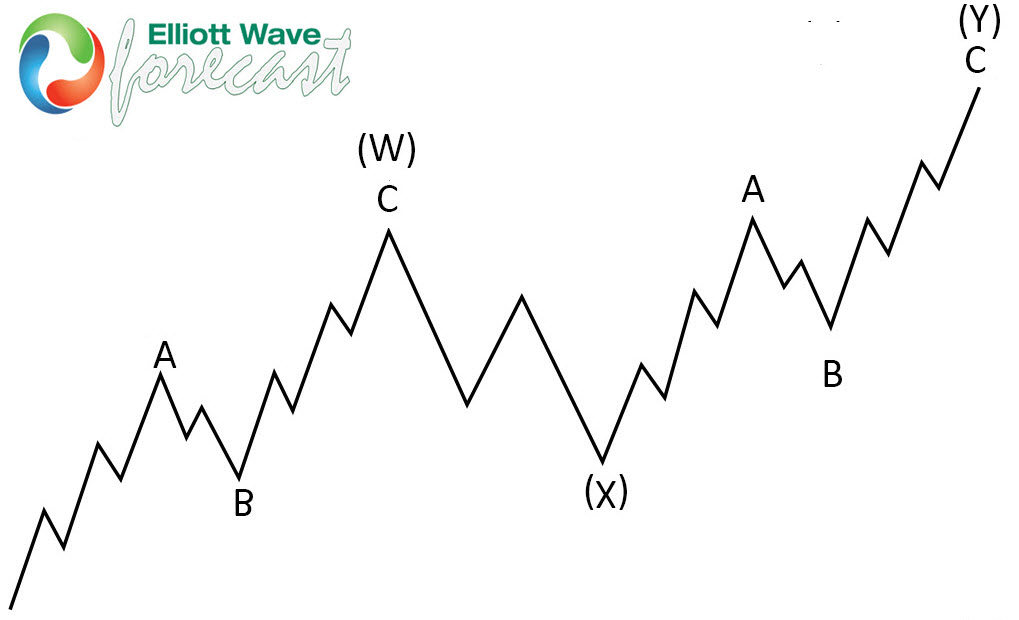
The picture below presents what Elliott Wave Double Three pattern looks like. It has (W),(X),(Y) labeling and 3,3,3 inner structure, which means all of these 3 legs are corrective sequences. Each (W) and (Y) are made of 3 swings , they’re having A,B,C structure in lower degree, or alternatively they can have W,X,Y labeling.
BTCUSD 4h Hour Elliott Wave Analysis 03.28.2022
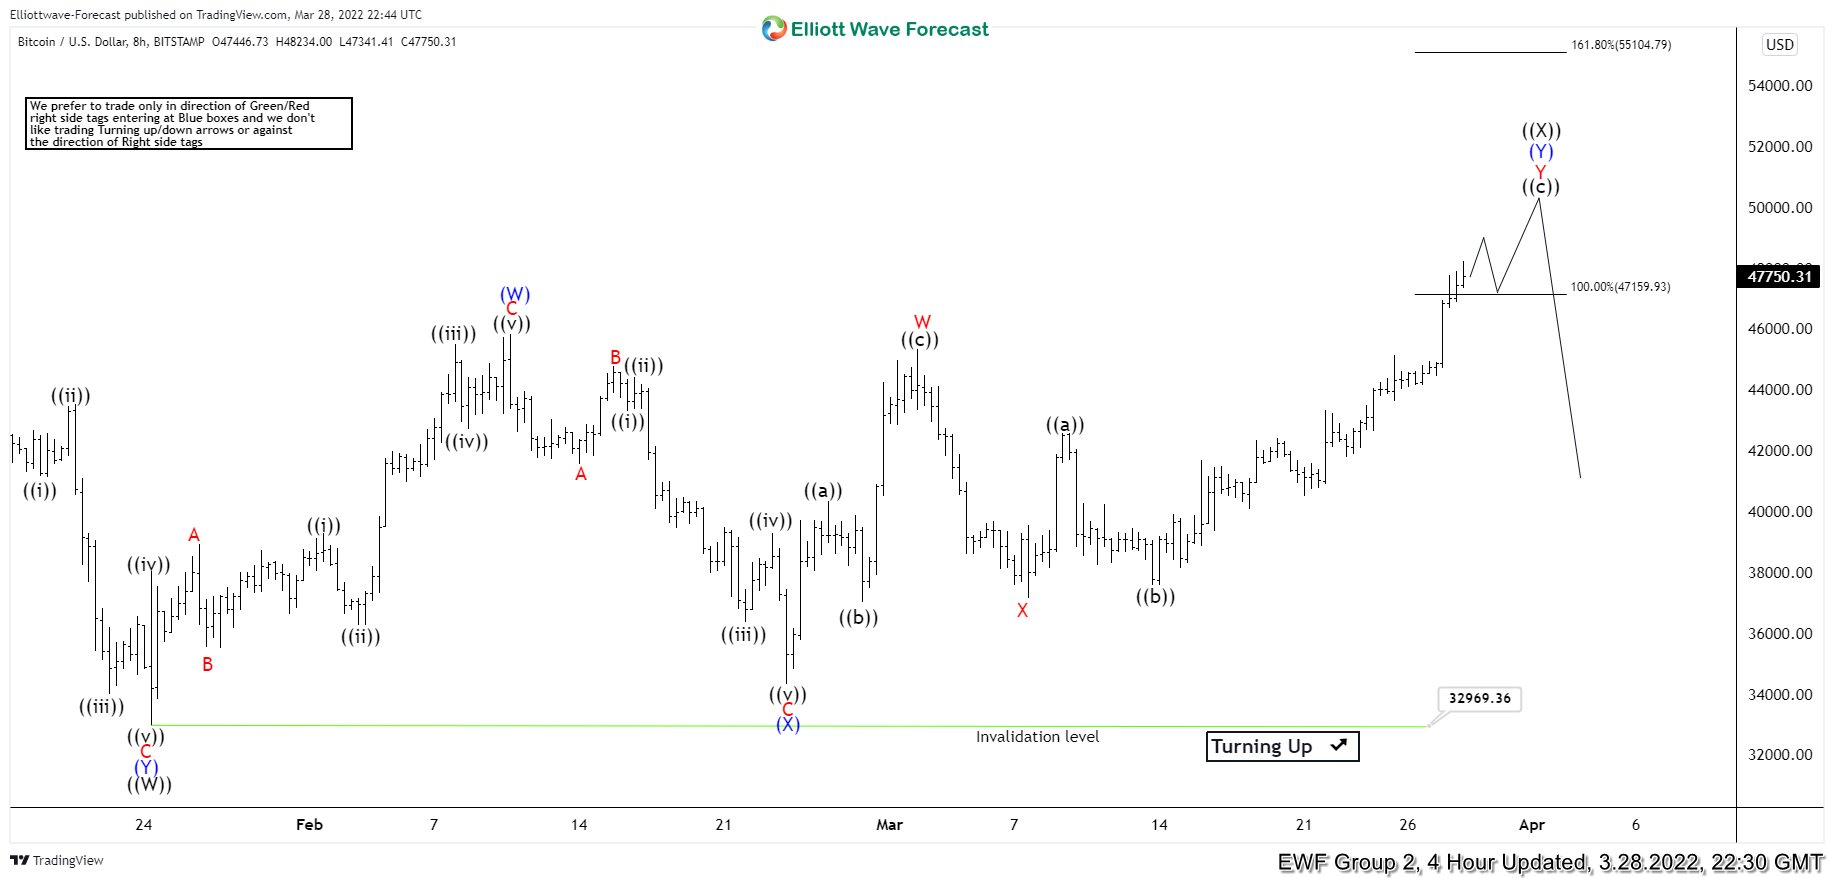
Bitcoin is giving us ((X)) black recovery that is unfolding as Elliott Wave Double Three Pattern, with (X)(X)(Y) blue inner labeling. The price is correcting cycle from the all-time high: 69097.5 . If we take a close look , we can count clear 7 swings up from the 32969.3 low. All 3 waves have corrective subdivisions. Bitcoin has already reached extreme zone from the lows at 47159.9-55104.7. At that zone buyers should be ideally taking profits and sellers can appear again. Consequently , we expect to see reaction from the that area. From there we can get either decline toward new lows or larger 3 waves pull back at least.
BTCUSD 4h Hour Elliott Wave Analysis 04.19.2022
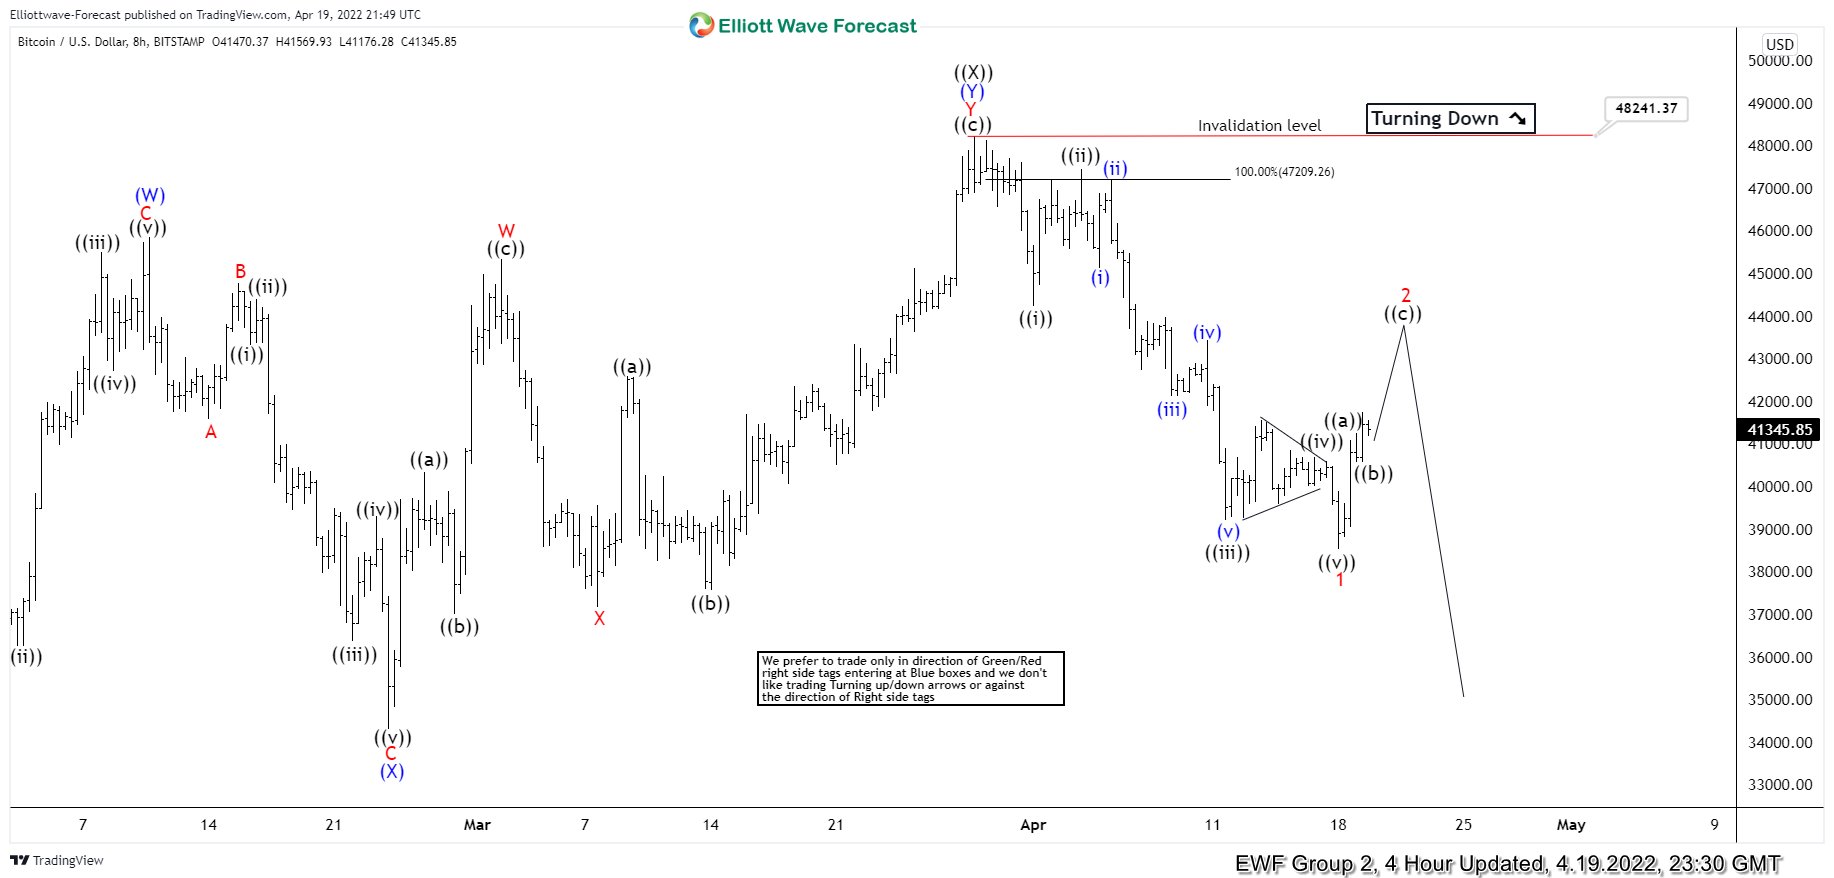
Sellers appeared right at the marked extreme zone : 47159.9-55104.7 and we got good reaction. ((X)) connector completed at 48241.3 high.The decline from that peak has a form of 5 waves- 1 red which increases chances of further extension down once 3 waves bounce in 2 red completes. Wave 2 recovery can see approximately 43460.5-44544.2 area before Bitcoin turns lower again in next leg down. Key pivot for presented short term view comes at 48241.3 high. If that pivot gets broken, it will invalidate the count.
USDCHF Heads South after Peaking at 22-Month High
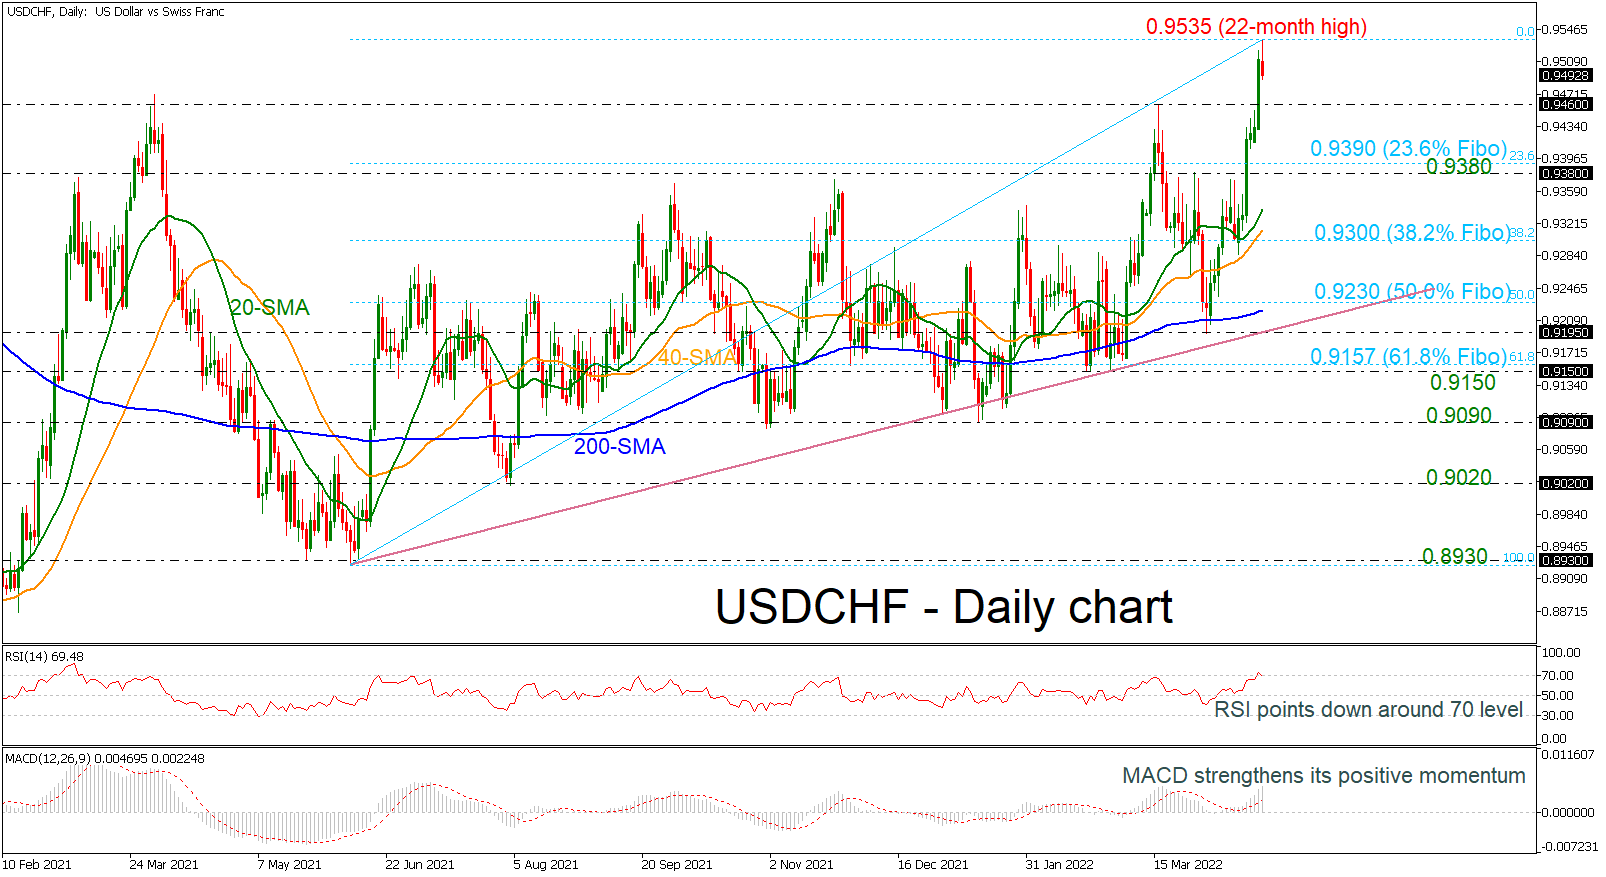
USDCHF has been underperforming today, returning below the key 22-month high of 0.9535 that was reached on Tuesday. When looking at the bigger picture, the pair has been developing within an uptrend since June 2020.
The RSI’s momentum is too weak to provide a sustained move higher as it is showing some overbought signs. However, the MACD is stretching its positive move above its trigger and zero lines.
If price action remains above 0.9460 (immediate support), there is scope to test the latest high of 0.9535. Clearing this key level would see additional gains towards April’s 2020 inside swing low at 0.9585. Rising above it would see prices re-test the 0.9760 resistance, taken from the peak on May 2020.
If the 0.9460 support fails, then the focus would shift to the downside towards the 23.6% Fibonacci retracement level of the upward move from 0.8930 at 0.9535 at 0.9390, which if breached, would meet the 0.9380 support. From here, USDCHF would be on path towards the 20- and 40-day simple moving averages (SMAs) at 0.9340 and 0.9315 respectively, ahead of the 38.2% Fibonacci at 0.9300.
Overall, USDCHF has been positive but near-term weakness is expected to remain as long as the market is looking overstretched.
Can British Pound Cope With Obstacles?
Economists say that the Bank of England won’t raise interest rates after May as the UK economy looks set to contract in the second quarter.
Meanwhile, the economic slowdown and a renewed sense of caution at the Bank of England could weigh on the pound’s value, which is already under pressure against the dollar but resilient against the euro. The UK economy grew just 0.1% in February, and obstacles from rising inflation, global uncertainty due to the war in Ukraine, and lockdowns in China make the economic outlook particularly challenging.
A subsequent quarterly decline in Q3 would mean the UK is back in recession just two years after the Covid recession in 2022.
The rise came despite the latest UK GDP data showing a sharper-than-expected economic slowdown in February. The UK GDP was 0.1% compared to 0.8% in January and below forecasts of 0.3%. The pound was supported, however, by rising UK government bond yields, which is often an indicator of rate hikes. The UK 10-year bonds rose 0.09%, outperforming many of their peers, to hit a new six-year high.
Sterling expanded its upside potential on April 12 despite mixed employment data. The UK unemployment rate fell from 3.9% to 3.8%, the lowest level since December 2019. Importantly, the number of vacancies rose to a new record of 1,288,000 from January to March 2022, which should ensure a robust job market even if the rate of job growth continues to slow. However, economic inactivity continued to rise, and wage growth still lags far behind inflation.
Inflation data on April 13 pushed the pound even higher against the euro. The UK CPI was 7%, a huge jump from the previous 6.2% and above the consensus forecast of 6.7%. As a result, the UK government bond yield rose again, hitting a six-year high.
While the Bank of England has been more dovish in recent weeks, markets are betting that rising inflation will force the bank to continue tightening monetary policy.
Protection against a fall in the pound is the Bank of England, which economists expect will raise interest rates again on its May policy meeting. However, the economic downturn makes it look like the Bank will back down from further rate hikes. It will greatly disappoint markets, which expect interest rates to rise to 130 basis points during the rest of the year.
For those hoping for a stronger pound in the coming days and weeks, any resistance to expectations of a BOE rate hike could be disappointing. It would mean a mechanical depreciation of the British currency, all other things being equal.
On April 20, the EURGBP was 0.83000. The support is at 0.82500, the higher resistance level is 0.85130.
The GBP has recovered from the fall in the beginning of the month and now it’s continuing to strengthen.
The situation with GBPUSD is different, after plummeting in February, the GBP hasn’t increased higher than 1.33000.
What are perspectives?
While the outlook looks bleak, as shown above, there are some signs of resilience that could mean some positive surprises in the future cannot be ruled out. The British pound is likely to trade depending on where the data goes: a slowdown in the economy is inevitable, but if the economy avoids recession by recovering to growth in the third quarter, the currency could potentially end the year stronger. If the Bank of England justifies the increased expectations of the market regarding the interest rate hike, the pound sterling may maintain support.
UK data is sparse for most of the week, so domestic economic and political news could affect the pound's exchange rate. However, Friday will bring important data. UK retail sales are forecast to contract by 0.3% for the second month in a row, which could hurt the pound sterling.
In addition, instant PMIs for the UK and Eurozone have not been released, which could lead to a significant move if the results surprise the markets. Meanwhile, any news about the Russian-Ukrainian war is likely to also play a role in the GBP/EUR pair. Ukrainian security forces are preparing for new assaults in the Donbass.
USDJPY advances curbed by 129 handle, but bullish tone holds
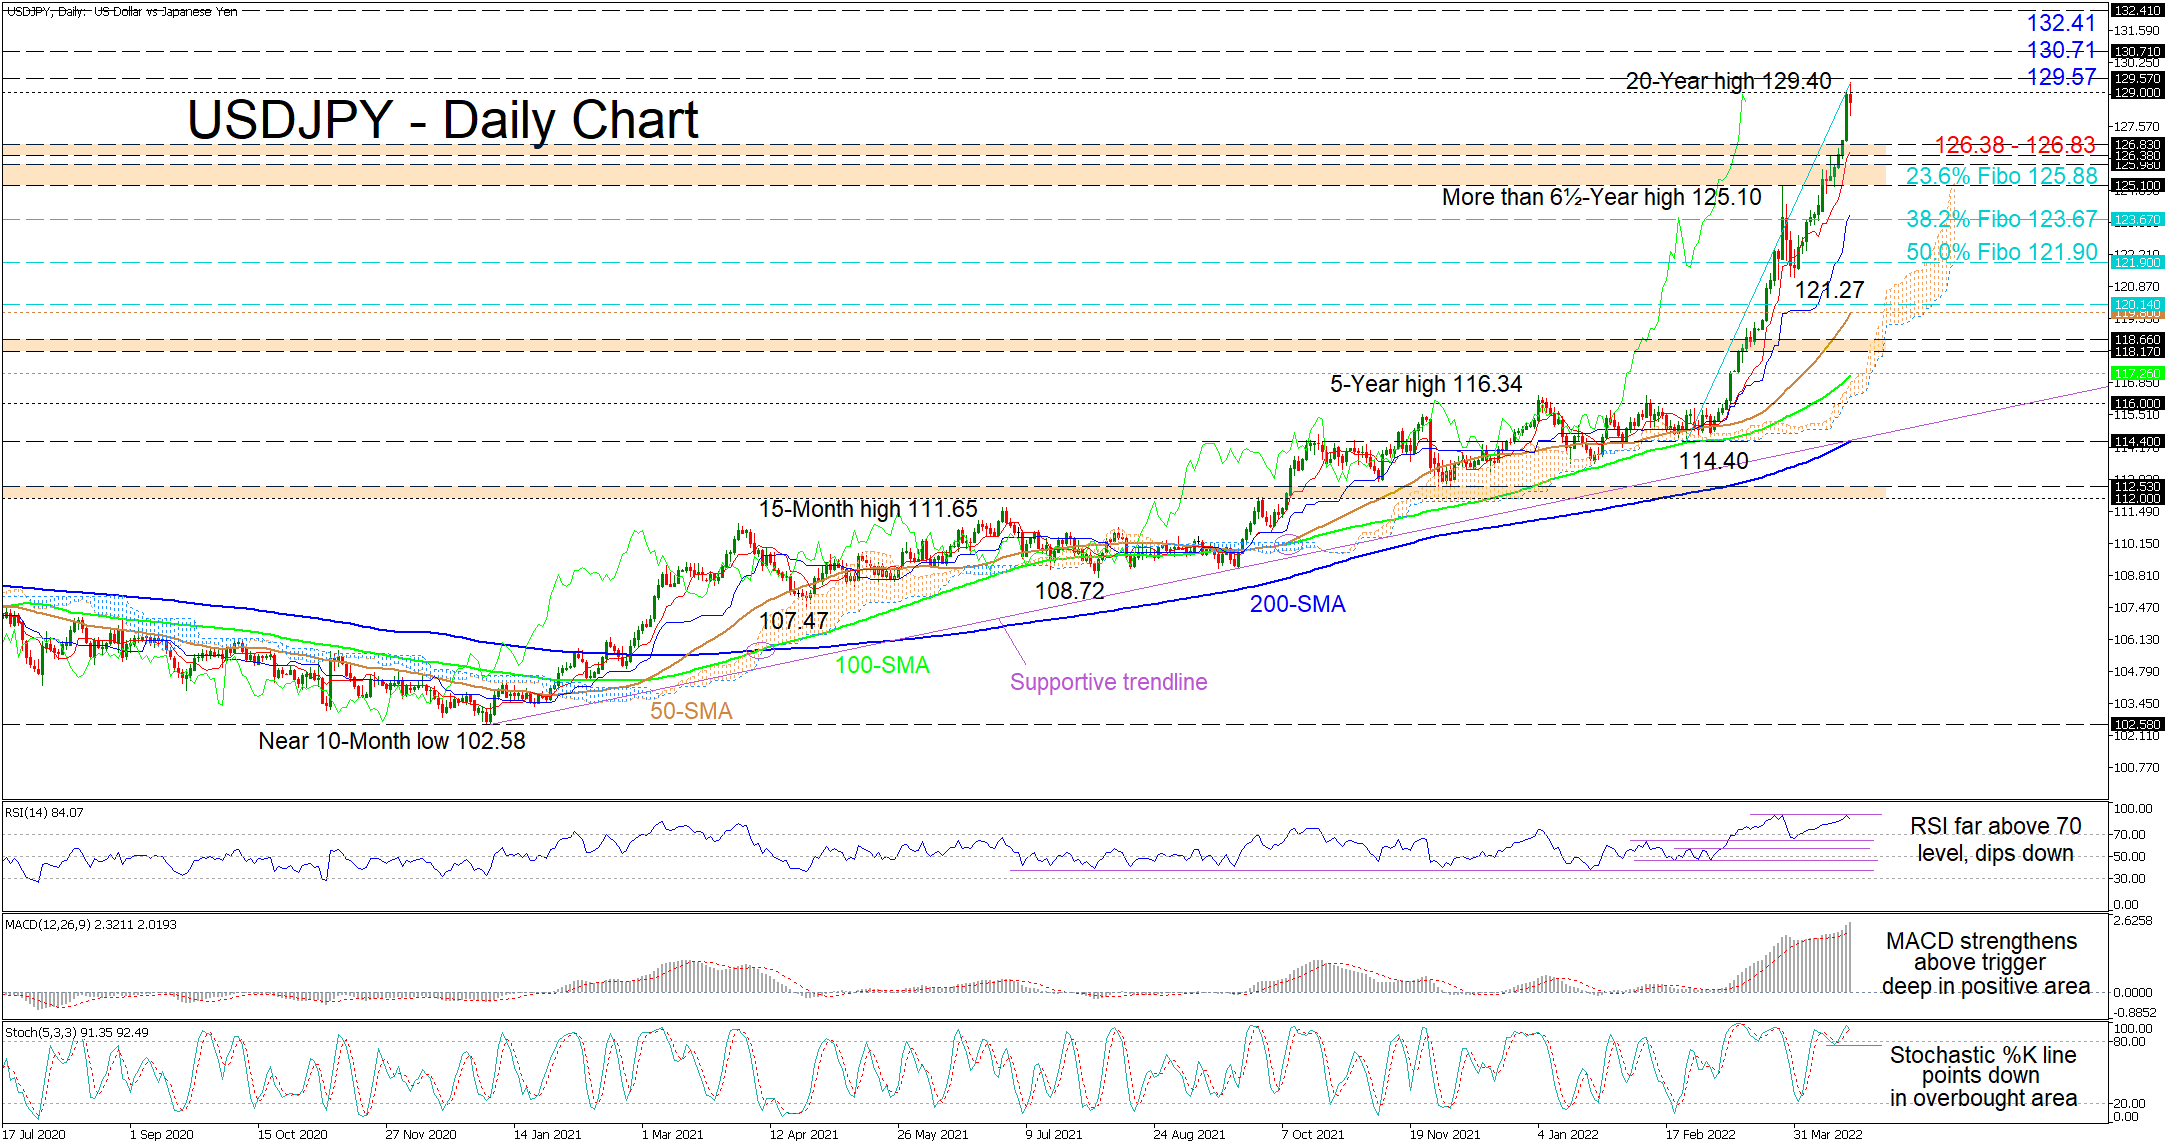
USDJPY has recorded a 20-year high of 129.40 within the 129.00-129.57 resistance area, shaped by the highs from the first half of May 2002 and the latter being the inside swing low from mid-April 2002. Currently, the pair is exhibiting a pause in its near two-month rally from 114.40 but the climbing simple moving averages (SMAs) continue to sponsor the sturdy bullish trend.
Furthermore, the rising Ichimoku lines are endorsing persisting upside forces, while the short-term oscillators are reflecting the fresh snag in the uptrend of the pair. The MACD, far north of the zero mark, is holding firm above its red trigger line, reflecting no weakness in positive momentum. However, the dip in the RSI and the %K line in their respective overbought territories, is hinting that the ascent is struggling a tad, but they have yet to confirm that bullish drive is clearly fading.
For additional positive developments to unfold, the pair would need to overcome the immediate 129.00-129.57 resistance band that extends back to mid-April 2002, and simultaneously its newly plotted intraday high of 20 years. Reviving the uptrend, the bulls could then jump for the 130.71 barrier and the 132.41 high, both recorded in April of 2002.
Otherwise, if positive pressures remain frail, and the 129.00-129.57 deterrent drives the price down, hardened congested support barricades could arise at the 126.38-126.83 zone and at the 125.10-125.98 region. The former stretches back to inside swing lows over the March until May period of 2002, while the latter’s outer frontiers encapsulate multiple rally peaks over June 2002 until August 2015. The latter is also reinforced by the 125.88 level, which is the 23.6% Fibonacci retracement of the 114.40-129.40 rally. In the event the price corrects below these critical support borders, the bears may then dive for the 38.2% and 50.0% Fibos of 123.67 and 121.90 before challenging the March low of 121.27.
Summarizing, USDJPY is sustaining a bullish bias above the soaring Ichimoku lines, the 125.10 barrier and the 121.27 trough. That said, for negative tendencies to gain a greater advantage, the price would need to sink beneath the 126.38-126.83 and the 125.10-125.98 support borders.
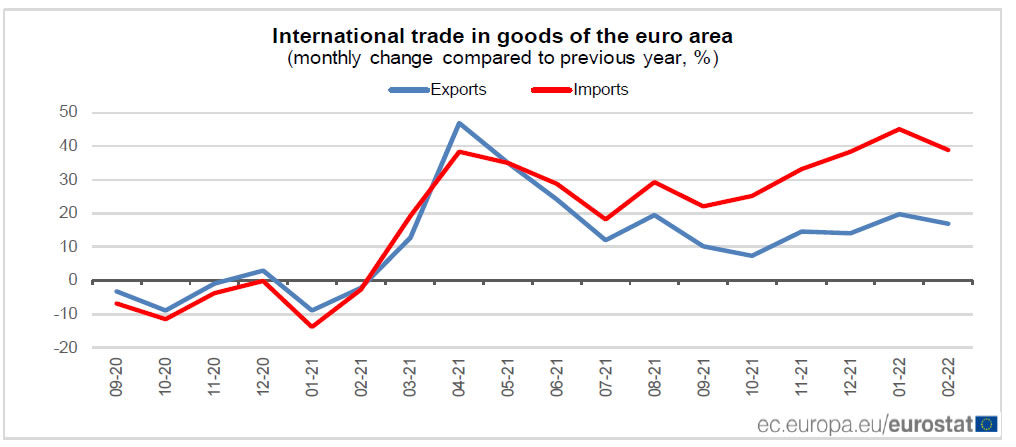
Eurozone exports rose 17.0% yoy in Feb, imports rose 38.8% yoy
Eurozone goods exports rose 17.0% yoy to EUR 215.8B in February. Imports rose 38.8% yoy to EUR 223.4B. Trade deficit came in at EUR -7.6B. Intra-Eurozone trade rose 25.6% yoy to EUR 202.5B.
In seasonally adjusted term, Eurozone exports rose 0.8% mom to EUR 223.6B. Imports rose 1.5% mom to EUR 233.1B. trade deficit widened from EUR -7.7B to EUR -9.4B, larger than expectation of EUR -6.5B. Intra-Eurozone trade rose from EUR 202.7B to EUR 205.8B.
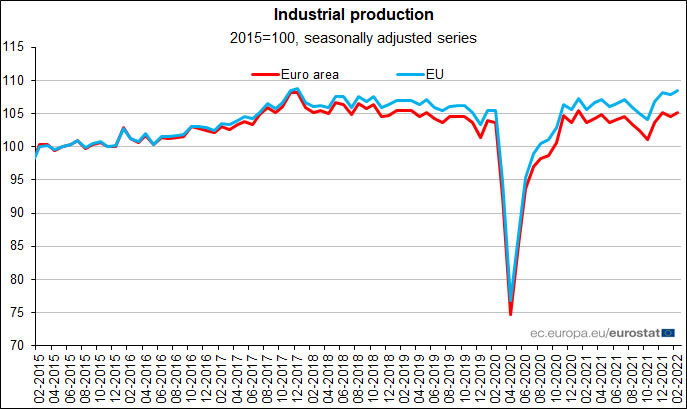
Eurozone industrial production rose 0.7% mom in Feb, EU up 0.6% mom
Eurozone industrial production rose 0.7% mom in February, below expectation of 0.8% mom. Production of durable consumer goods rose by 2.7%, non-durable consumer goods by 1.9% and intermediate goods by 0.9%, while production of capital goods fell by -0.1% and energy by -1.1%.
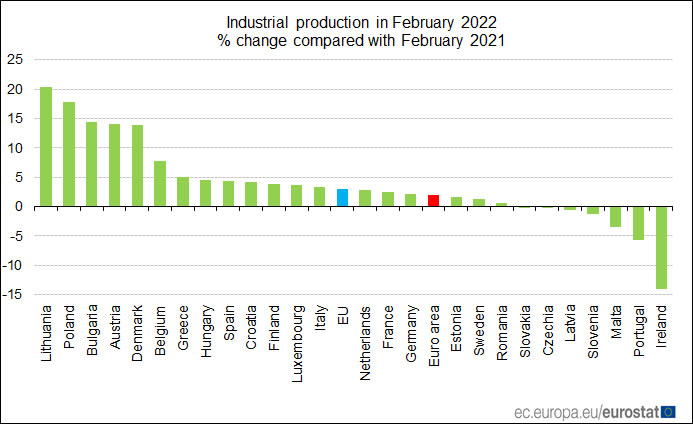
EU industrial production rose 0.6% mom. Among Member States for which data are available, the highest monthly increases were registered in Italy (+4.0%), Croatia (+2.7%) and Ireland (+2.4%). The largest decreases were observed in Slovenia (-8.3%), Lithuania (-3.8%) and Malta (-2.7%).
NZDUSD Minimizes Weekly Loss But Bears Still Present
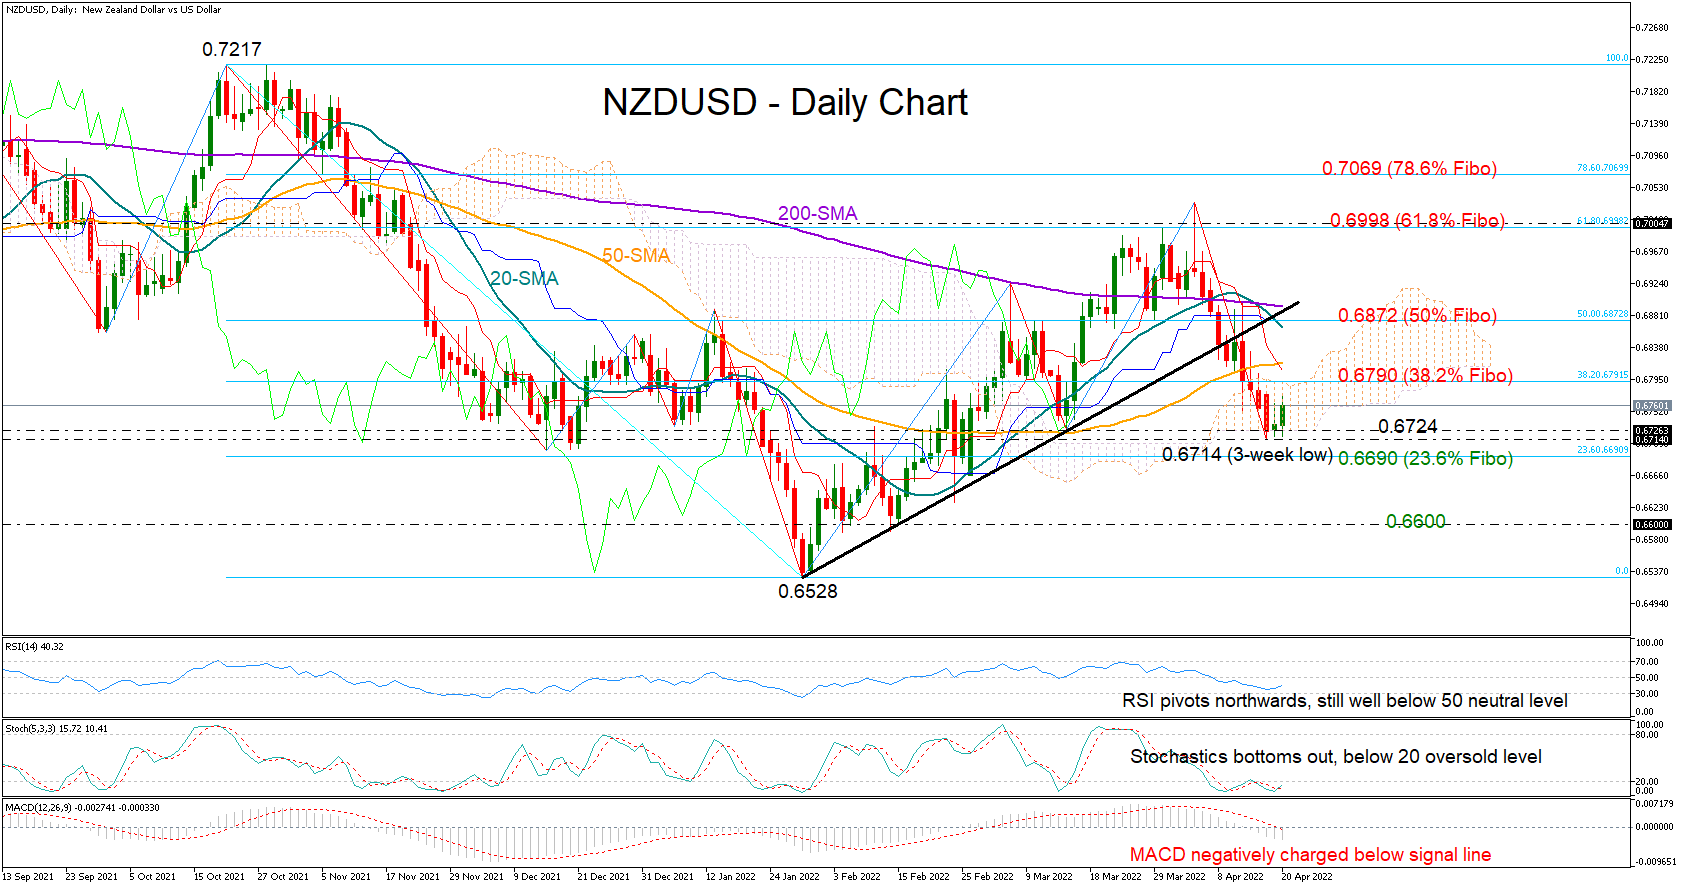
NZDUSD switched to a recovery operation on Wednesday after halting its downleg near a three-week low of 0.6714 and around the bottom of the Ichimoku cloud.
Despite its latest deceleration, the pair maintains a neutral structure in the medium-term picture. Yet, the negative reversal in the 20-day simple moving average (SMA), which immediately pulled below the 200-day SMA, is feeding some trend skepticism.
Meanwhile in the short-term picture, the current bullish action is also not convincing yet. Even though the Stochastics seem to be creating a double bottom below their 20 oversold level, the lines have yet to confirm the bullish pattern. Moreover, the RSI has pivoted, though it is still well dipped in the bearish area, while the MACD has displayed no signs of progress.
Given the above questioning technical signals, the focus will be on the nearby 38.2% Fibonacci retracement of the 0.7217 – 0.6528 downleg at 0.6790 and the 50-day SMA at 0.6817. Should the price cross that constraining zone, buying pressures are expected to intensify towards the 50% Fibonacci of 0.6872 and the 200-day SMA. Perhaps the broken supportive trendline coming from the low of 0.6528 may cement that wall as well. Further up, the rally could stage another acceleration towards the 61.8% Fibonacci of 0.6998.
In the bearish scenario, where the price entirely ruins its 2022 uptrend below the cloud at 0.6724, and more importantly, beneath the 23.6% Fibonacci of 0.6690, sellers could aggressively drive towards the 0.6600 mark. If the latter fails to add footing, all attention will turn to the 0.6528 bottom.
Summarizing, while NZDUSD is trying to minimize its weekly losses, short-term technical signals suggest a bullish attitude has not successfully developed yet. A step above 0.6790 could give the green light for more progress, whereas a plunge below 0.6724 would cause an outlook deterioration.
Dollar Index: Bulls Pausing on Overbought Conditions
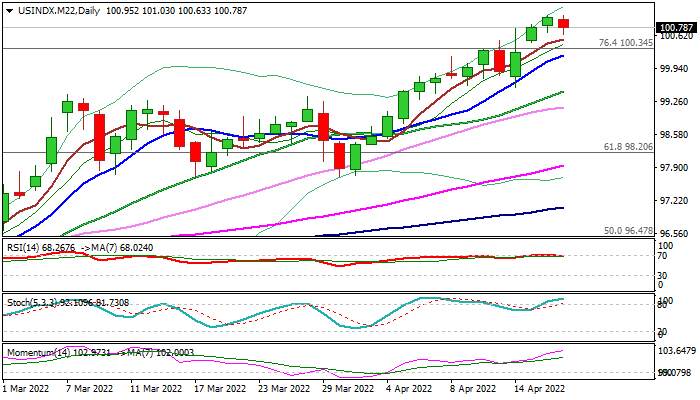
The dollar index eases from new two-year high in early Wednesday, with the action seen as technical correction on overbought studies, as the greenback remains well supported by safe-haven buying on rising uncertainty over Ukraine crisis and expectations for more aggressive Fed in coming months.
The larger dollar’s uptrend accelerated strongly in past two months and is on track for over 2% advance in April, the biggest monthly gain since November 2016.
Rising positive momentum and MA’s in bullish setup on daily chart, point to strong underlying uptrend, while overbought conditions suggest bulls are taking a breather before resuming.
Solid supports lay at 100.34/20 (broken Fibo 76.4% of 103.80/89.15 / rising 10DMA) and psychological 100 level, where dips are expected to find ground and keep bulls intact.
Caution on extension below 99.54/45 (Apr 14 trough / 20DMA) that would signal deeper correction.
Res: 101.01; 101.50; 102.00; 102.26
Sup: 100.54; 100.34; 100.00; 99.54
Nasdaq 100 Index Rebounds Even as Bond Yield Surge Continues
American stocks rose as the earnings season continued. The Dow Jones, S&P 500, and Nasdaq 100 indices rose by more than 1% on Tuesday. Johnson & Johnson published mixed quarterly results as its EPS beating and revenue missing analysts' forecasts. It also lowered its forward guidance for the year. Meanwhile, Hasbro published weaker-than-expected profits as the cost of doing business rose, Travelers Companies and Lockheed published mixed results as well. The most notable name was Netflix, whose shares crashed by 25% after its earnings. The firm lost customers for the first time in a decade. The stocks jumped even as US bond yields rose to the highest level in years.
The euro declined slightly against the US dollar after the IMF downgraded the global economic outlook. The agency expects that the global economy will grow at about 3.6% this year. It also warned that the European Union will have a worse performance because of the ongoing crisis in Ukraine. The euro will react to the latest industrial production data from the Eurozone. Economists expect the data to show that the production rose by 1.5% in February. Eurostat will also publish the latest trade balance data.
The US dollar continued its bullish trend on Wednesday morning as US bond yields continued rising. It also rose as investors reacted to strong housing data from the US. Housing starts rose from 1.788 million in February to 1.79 million in March. This increase was better than the median estimate of 1.745 million. Further, building permits rose from 1.865 million to 1.873 million in the same period. These numbers mean that the economy is doing well. The US will publish the latest existing-home sales data later today.
USDCHF
The USDCHF pair rose to a high of 0.9495 as the dollar strength continued. It has been in a strong bullish trend in the past few weeks. As a result, it is along the upper side of the Bollinger Bands. It has also moved above the 25-day and 50-day moving averages while oscillators like the Relative Strength Index and the MACD continued rising. The pair will likely keep rising in the coming days.

EURUSD
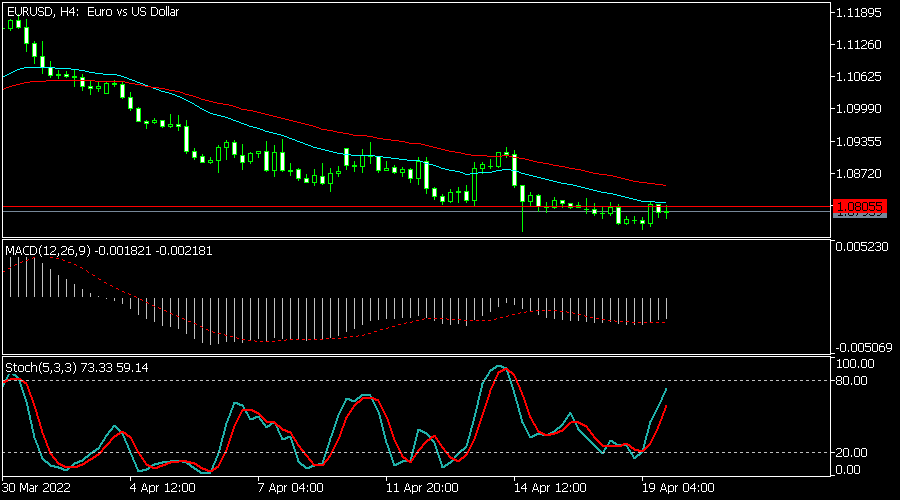
The EURUSD pair remained under pressure as US bond yields continued rising. It is trading at 1.0795, which is slightly above this week’s low of 1.0760. It has moved below the 25-day and 50-day moving averages while the Stochastic Oscillator has pointed upwards. The MACD is below the neutral level while the pair has declined below the support at 1.0800. Therefore, the pair will likely continue its bearish trend.
NAS100
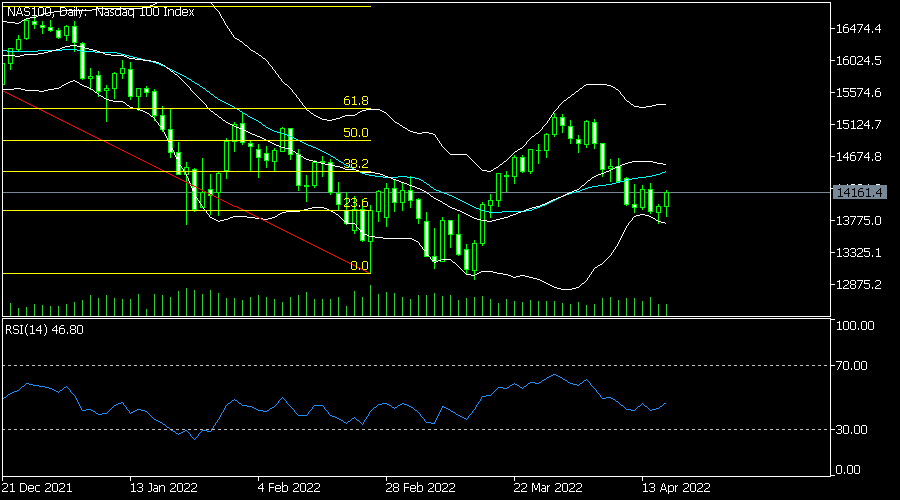
The Nasdaq 100 index rose as investors reacted to the ongoing earnings season. It rose to a high of $14,157, which is higher than this month’s low of $13,730. On the daily chart, the pair has moved between the lower and middle lines of the Bollinger Bands. It is also between the 23.6% and 38.2% Fibonacci retracement levels. The index will likely retreat today as some investors take profits.
US 10y Yield Nearing 3% Level While 30 year Tested psychological Landmark
Markets
Markets shifted into higher gear yesterday after a false start on Monday with European markets still closed and lower-volume trading in the US. Core bonds again took center stage. US Treasuries underperformed Bunds, especially at the front-end of the curve.
Hawkish comments from Fed governors including Bullard (doesn’t rule out a 75 bps hike) and Evans (rates will probably exceed the neutral level) hurled the two-year rate almost 15 bps higher. Recent resistance around the 2.50% area got crushed. Peak policy rate expectations have surged well beyond 3% over the past week.
Yields further down the curve added 5.4 (30 year) to 8.3 bps (10 year). 10-year real yields closed on the verge of positive territory (-0.008%) for the first time since March 2020.
German/European (swap) rates rose a little less than 7 bps at the long end. The move higher was also aided by the constructive risk climate, supposedly on quotes from Russian Foreign Minister Lavrov. He basically took the use of nuclear weapons in the Ukraine war off the table, easing fears for all-out atomic conflict.
European stocks finished well off their intraday lows (-0.50%), Wall Street squeezed out a nice gain up to 2.15% (Nasdaq). This helps explain the USD’s lackluster performance despite soaring (real) yield support. EUR/USD finished marginally higher to close but below 1.08. The Japanese yen fell off a cliff, ignoring verbal warnings from Japanese Finance Minister Suzuki. USD/JPY closed at a 20-year high of 128.91. EUR/JPY (139) hit the strongest levels in seven years. The Swiss franc traded on the back foot too. EUR/CHF bounced from sub 1.02 to 1.0273. Sterling lost out against most G10 peers in an orderly decline. EUR/GBP tried to overcome 0.83 but failed eventually. Asian-Pacific markets draw some comfort from yesterday’s US performance. Most indices trade in the green. The Bank of Japan offered another round of unlimited bond buying as the 10y yield over the past days reached the 0.25% upper bound once again. The yen strengthens (very) slightly nevertheless in what is probably more of a technical move after a 13-day decline against the dollar. USD/JPY eases to 128.72.
China’s yuan gapped lower to USD/CNY 6.41 at the open but recovered in the hours thereafter to 6.40 (support zone) currently. Chinese loan prime rates were kept unchanged, a decision that shouldn’t come as a big surprise after the PBOC yesterday made no references for such a move happening at short notice. Core bonds trade near yesterday’s closing levels.
The economic calendar won’t inspire markets to anything today. The avalanche of Fed speeches continues. Eyes may slowly turn to the next policy meeting scheduled on May 4. The release of the Fed’s Beige Book later today formally kicks off the process.
(US) yields already took a big advance on policy normalization but to call off the upward trend now is premature to us. The US 10y yield is nearing the 3% level while the 30 year tested that psychological landmark already yesterday and today. For the 2-y yield we’re looking for a sustained move above the shoulder top in the head-and-shoulder pattern of 2018-2019 (2.58-2.60%).
Germany’s 10y yield (0.91%) made another step yesterday towards the 1%, while the European 10y swap is attacking the 2012 correction lows between 1.60-1.65%.
EUR/USD recaptures a first, minor resistance of 1.0806 (March low) but it’s technical relevance is negligible. The downside remains vulnerable, especially within the trend of higher US real yields. EUR/GBP struggles with the 0.83 barrier. In a broader perspective, the pair remains trapped within a downward sloping trend channel.
News Headlines
At an online debate organized by Echo magazine Czech central bank member Thomas Holub said the Czech national Bank probably will have keep tightening policy in order to prevent inflation from getting entrenched, Bloomberg reports. A stronger koruna helps to mitigate inflationary pressures, but Holub kept a cautious tone on using the CNB’s huge FX reserves as a policy tool to address inflationary pressures. He prefers to raise interest rates further and ‘downplayed the firepower’ of the CNB reserves in this context.
In Poland, Monetary Policy council member Henryk Wnorowski yesterday also advocated that the Polish policy rate could be raised as high as 7.5%. Wnorowski in this respect indicated that the central bank is operating in a context where no limits or boundaries can be imposed. He also envisaged a scenario where inflation would only return within the deviation band from the target (2.5% +/- 1.0%) in 2024, especially if the war in Ukraine would last rather long. At the same time he also assumed a scenario where the zloty is likely to appreciate.