Sample Category Title
USD/CAD Trims Gains, Key Support Nearby
Key Highlights
- USD/CAD started a downside correction from 1.2675.
- It traded below a major bullish trend line at 1.2580 on the 4-hours chart.
- EUR/USD could attempt a move above 1.0900, and GBP/USD is facing hurdles near 1.3080.
- The Canadian CPI increased 6.7% in March 2022 (YoY), up from 5.7%.
USD/CAD Technical Analysis
The US Dollar attempted an upside break above 1.2700 against the Canadian Dollar. However, USD/CAD failed near 1.2675 and started a downside correction.
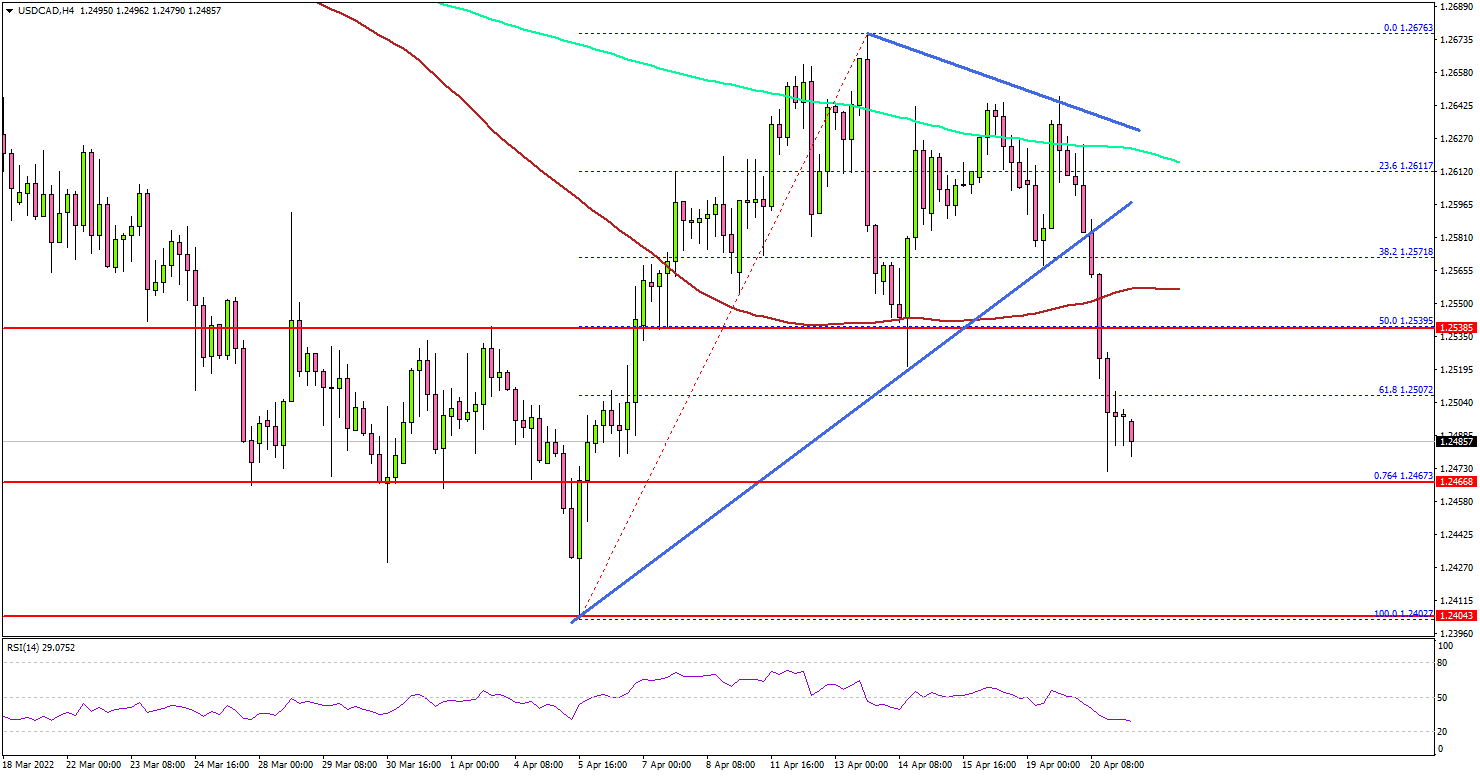
Looking at the 4-hours chart, the pair traded the 1.2620 support level and the 200 simple moving average (green, 4-hours). There was a break below a major bullish trend line at 1.2580.
The pair declined below the 50% Fib retracement level of the upward move from the 1.2402 swing low to 1.2676 high. It settled below the 1.2560 support and the 100 simple moving average (red, 4-hours).
The next major support is near the 1.2465 level. It is near the 76.4% Fib retracement level of the upward move from the 1.2402 swing low to 1.2676 high. Any more losses may perhaps open the doors for a move towards the 1.2400 level.
On the upside, USD/CAD might face resistance near the 1.2565 level and the 100 simple moving average (red, 4-hours). The next major resistance is seen near the 1.2620 level.
Fundamentally, the Canadian Consumer Price Index (CPI) for March 2022 was released yesterday by the Statistics Canada. The market was looking for an increase of 6.1%, compared with the same month a year ago.
The actual result was above the market forecast, as the Canadian Consumer Price Index increased 6.7%. The monthly change was 1.4%, up from the last 1%.
Looking at EUR/USD, the pair could attempt a recovery wave above the 1.0900 and 1.0920 resistance levels. Similarly, GBP/USD must clear 1.3080 for a steady increase.
Economic Releases
- US Initial Jobless Claims - Forecast 180K, versus 185K previous.
- Fed's Chair Powell speech.
USDCAD Falls on Strong Inflation and Could Go Lower
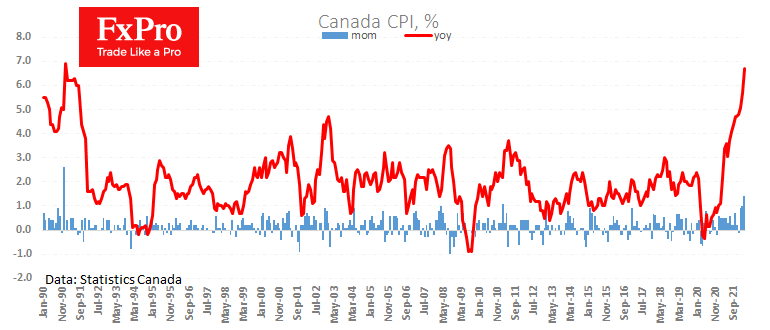
Canadian consumer inflation rose stronger than expected, adding 1.4% for March and accelerating to 6.7% y/y from 5.7% a month earlier and the forecasted 6.1%.
The Bank of Canada last week raised its key rate by 50 points and announced a quantitative tightening in response to accelerating price growth. The fresh batch of data has triggered a new buying spurt in CAD against USD as it opens the door for even more tightening of monetary policy.
Canada is benefitting from a boom in commodity and energy prices, which allows the central bank to pursue a more aggressive policy normalisation than countries that are net importers of these commodities. In this situation, the CAD is getting support from three sides: more money coming into the country, more business activity, and a potentially stricter monetary policy.
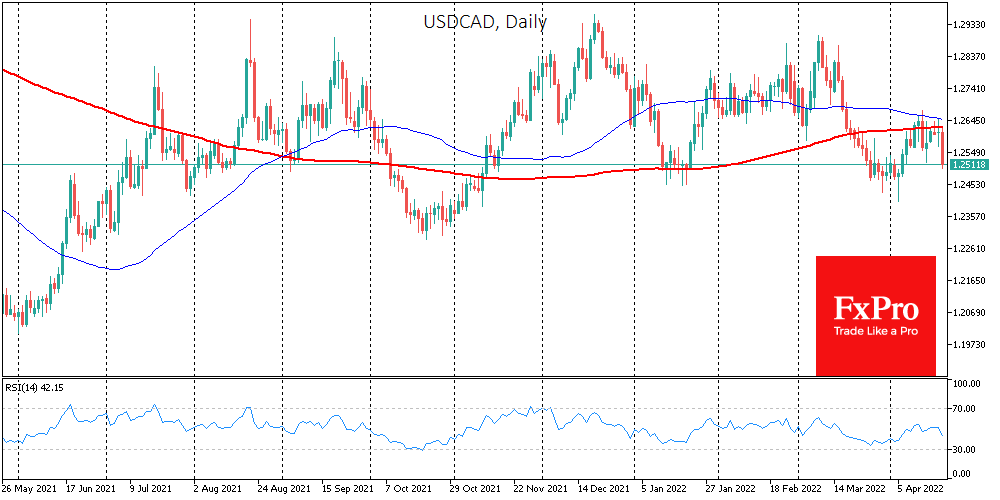
The USDCAD is losing 0.75% to 1.2510, and it is trying to break the tie with 200-day MA, which has been resistant for the last two weeks. The important close frontier is 1.2475, where the pair got support in April and January. A consolidation below that might be the first signal to end the corrective bounce of the USDCAD and clear the way to 1.2000, which is the low of May 2021.
Eco Data 4/21/22
[php_everywhere instance="1"]
NZDUSD Wave Analysis
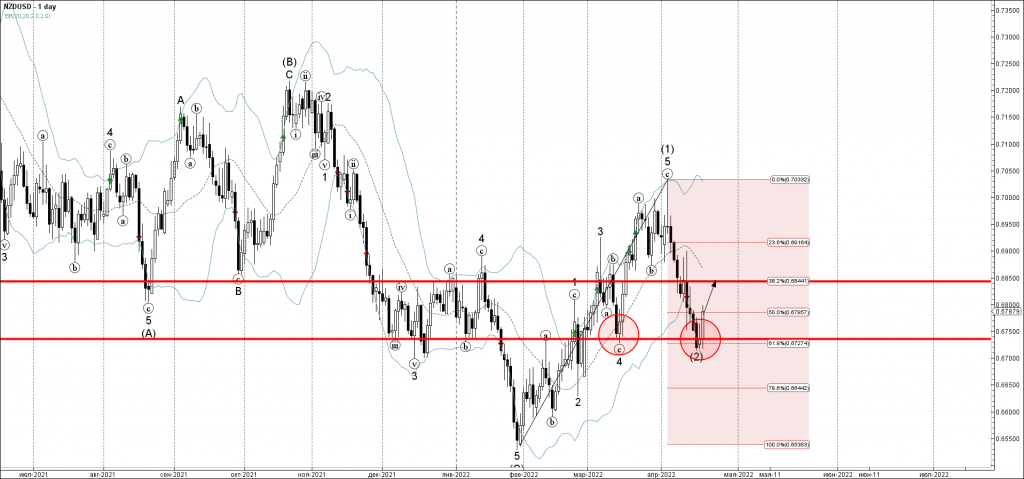
- NZDUSD reversed from support level 0.6735
- Likely to rise to resistance level 0.6850
NZDUSD currency pair recently reversed up from the key support level 0.6735 (the former monthly low from March), strengthened by the lower daily Bollinger Band and the 61.8% Fibonacci correction of the upward impulse from February.
The upward reversal from the support level 0.6735 will , most likely, form the daily Morning Star – a strong bullish signal for NZDUSD.
NZDUSD can be expected to rise further in the active impulse wave (3) toward the next resistance level 0.6850.
S&P 500 Wave Analysis
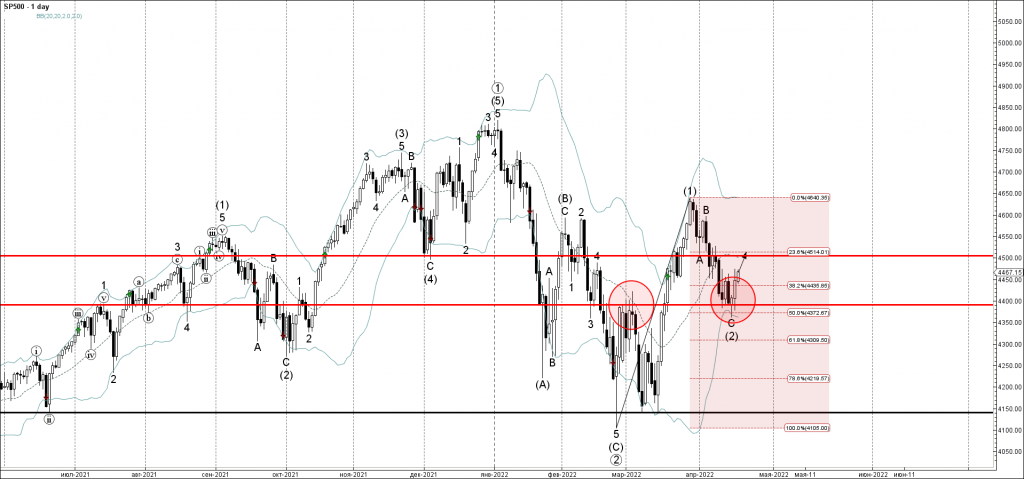
- S&P 500 reversed from support level 4400.00
- Likely to rise to resistance level 4500.00
S&P 500 index recently reversed up from the support level 4400.00 (the former monthly low from March) intersecting with the 61.8% Fibonacci correction of the upward impulse (1) from January.
The upward reversal from the support level 4400.00 created the daily Morning Star – which stopped the previous correction (2).
S&P 500 index can be expected to rise further toward the next resistance level 4500.00 (former low of wave A).
AUDJPY Upside Intact Despite Pullback off 138.2% Fibo Extension
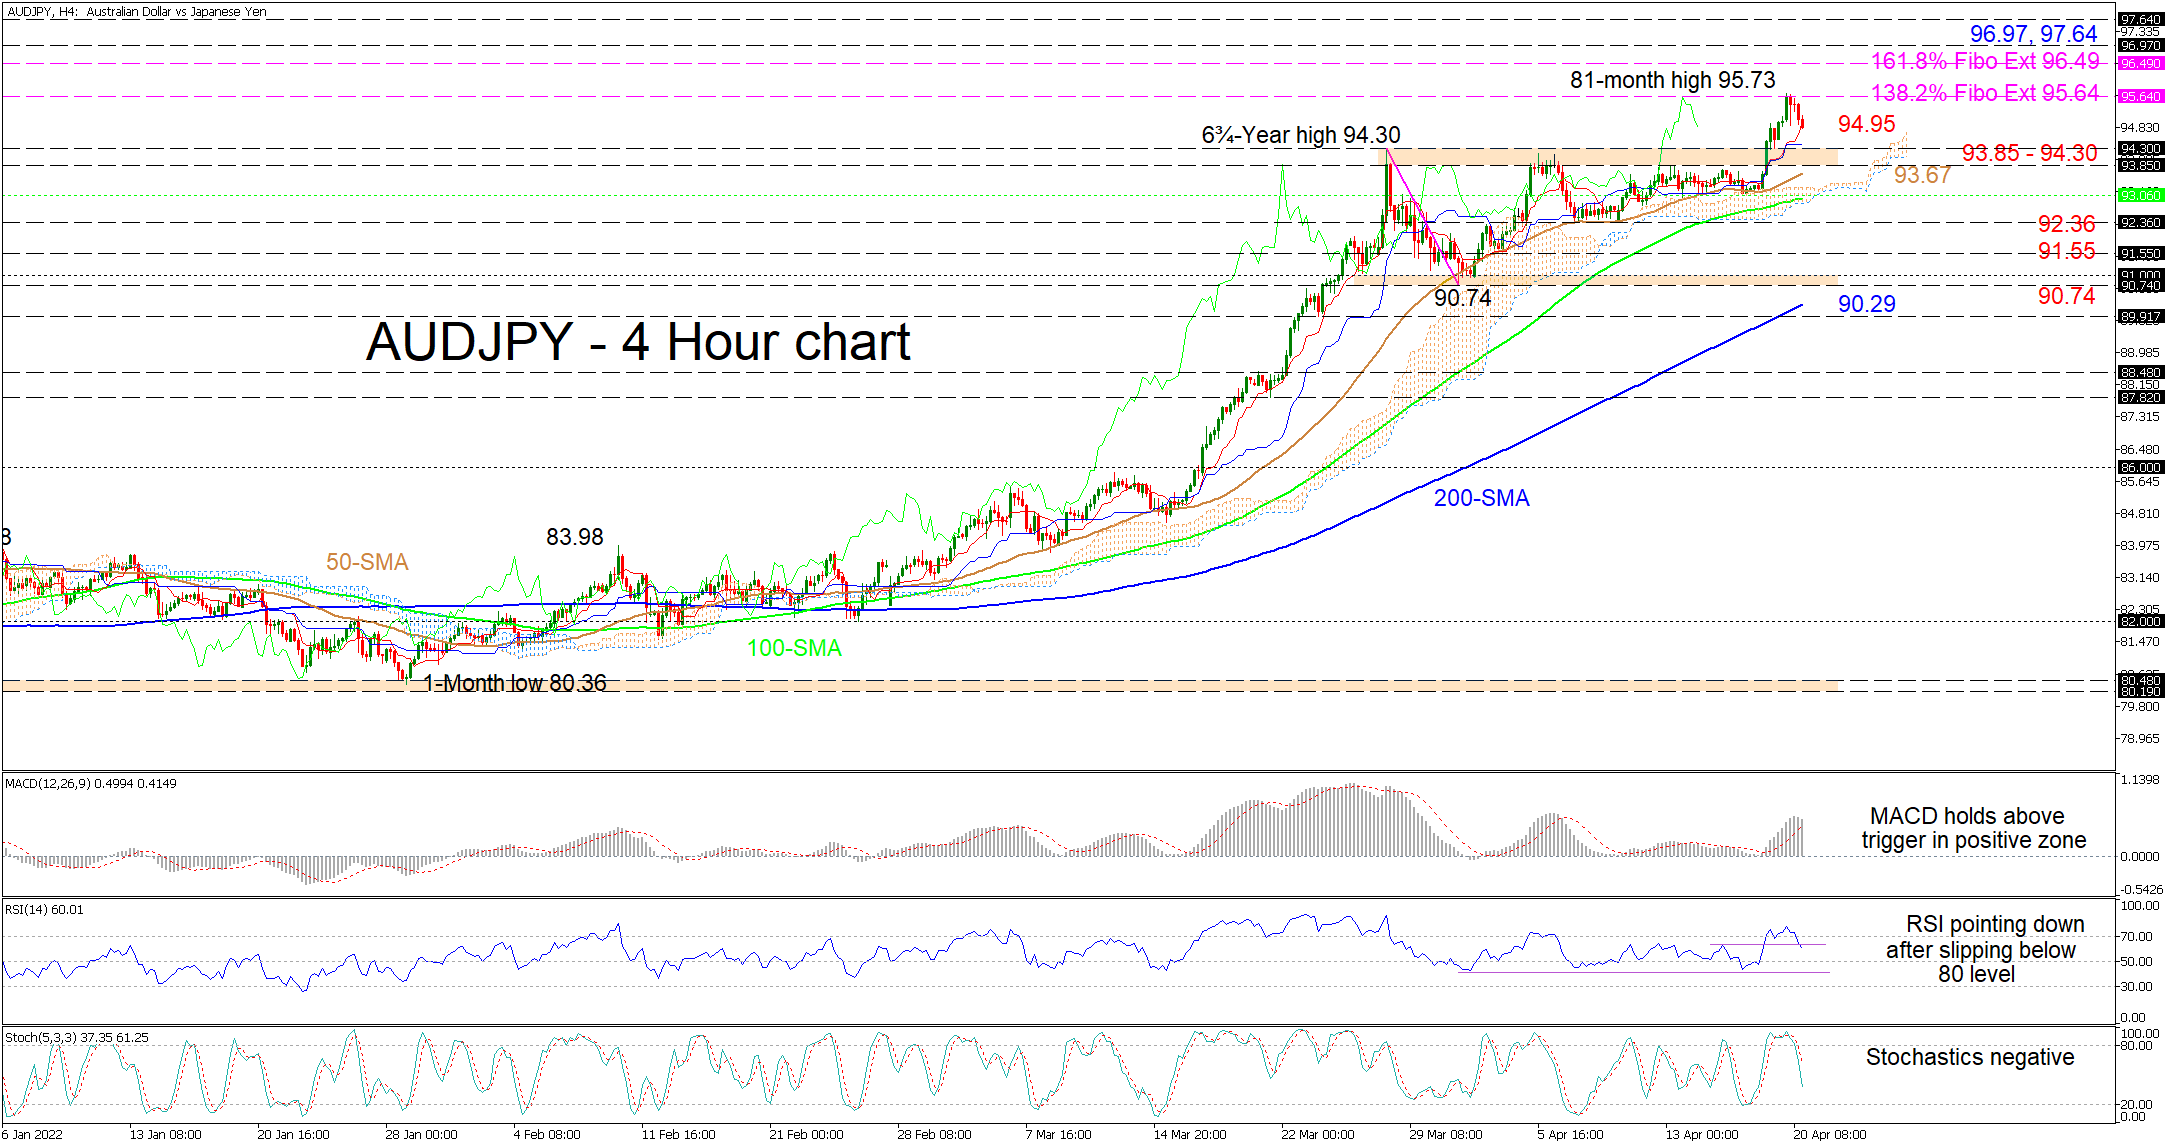
AUDJPY is residing at the red Tenkan-sen line at 94.95 after retreating from the 95.73 mark, which is a level two months short of being a seven-year high, and in the vicinity of the 138.2% Fibonacci extension of the down leg from 94.30 until 90.74. The climbing simple moving averages (SMAs) are defending the broader positive structure.
Meanwhile, the Ichimoku lines are reflecting a stall in bullish forces, while the short-term oscillators are indicating an increase in negative momentum. The MACD, some distance north of the zero barrier, is easing towards its red trigger line, while the RSI is sliding in the bullish region. Moreover, the negatively charged stochastic oscillator is promoting a deeper price pullback in the pair.
For now, if sellers remain in control, an initial support base could transpire linking the 94.30 and the 93.85 levels. If this support section fails to provide buyers with positive traction, the zone between the rising 50- and 100-period SMAs at 93.67 and 93.06 respectively, could deter the price from gaining a stronger downward pace. In the event that this area, which contains the Ichimoku cloud too, is unsuccessful in muting bearish pressures, the price may then test the 92.36 low before sinking for the 91.55 obstacle.
Otherwise, if buyers re-emerge around the red Tenkan-sen line, growing positive impetus could revisit the 138.2% Fibo extension of 95.64. Overrunning this and the freshly recorded multi-year peak of 95.73, the price may then propel for the 161.8% Fibo extension of 96.49 prior to challenging the space between the 96.97 and the 97.64 borders, which encompass multiple highs over the early January until early June 2015 period.
Summarizing, AUDJPY is revealing minor weakness in its efforts to push past the 138.2% Fibo extension of 95.64. For negative tendencies to intensify, the price would need to slip beyond the 50- and 100-period SMAs, while a retracement diving past the March trough of 90.74 could ignite worries about the broader bullish uptrend.
Sunset Market Commentary
Markets
Dollar correction today. It’s only the second time since March 31 that the greenback (trade-weighted DXY) loses over 0.5% in a single session. DXY returns below 100.50 after failing to take out the 101-mark yesterday. There’s no strong driver, though yesterday’s inability to outperform when short term US yields add 14 bps was already telling. The US 10-yr real yield simultaneously tested 0% for the first time since early 2020 whereas the German 10-yr real yield remains stubbornly low around -2%. Equity sentiment improves today, perhaps related to Russian foreign minister Lavrov’s ruling out using atomic weapons. The EuroStoxx50 in any case gains 1.8% today. From a technical point of view, the index is testing the incoming downtrend line which connects highs from January, February and March (see graph). Regaining 3900 or even 4000 is necessary to turn the picture more neutral again. Returning to the dollar, the greenback loses out against all other majors. USD/JPY traded briefly above 129 (multi-decade high) before sliding to the low 128-area. EUR/USD set an intraday top at 1.0860, but the single currency still lacks the momentum to add some gains. Comments by Latvian ECB governor Kazaks are interesting, but ignored by markets. He is the first one to openly put a rate hike as soon as July on the table. He says that the ECB doesn’t have to wait to see stronger wage growth and that a gradual (normalization) approach isn’t the same as a slow response. Once the normalization process starts, 0% isn’t the cap for the deposit rate. That’s a clear hint towards a genuine tightening cycle rather than to removing ultra-accommodative settings. Bundesbank president Nagel joined the early breakaway by warning that it is becoming increasingly unlikely that inflation will return to the central bank’s 2% goal. He says that the ECB may be able to stop asset purchases at the end of Q2 so that the ECB could raise rates early Q3. This second shot by an ECB governor did have an intraday effect on markets. Front end European yields erased intraday losses. The German yield curve flattens with daily changes varying between +1.3 bps (2-yr) and -7.7 bps (30-yr). The US yield curve bull flattens with yields sliding by 0.8 bps (2-yr) to 6.5 bps (30-yr).
News Headlines
Riksbank governor Ingves made the April meeting a live one. In an interview held last week, before a consensus-beating inflation release (6.1% y/y in March), but only published today, Ingves said the central bank cannot sit idle if inflation remains above the 2% target. It would “risk losing the anchor on price increases in the Swedish economy”. Neither did he push back against markets pricing in about ten rate hikes by early 2024. This implies a lift-off at the June 30 or even the April policy meeting next week. Several Riksbank officials have been preparing markets for a policy shift in recent weeks, burying longstanding guidance of zero policy rates at least until 2024. The Swedish krona strengthened as a result and breaches through recent resistance levels of EUR/SEK 10.25/27 (previous EUR/SEK April lows/200dMA) today.
Canadian inflation quickened to a 6.7% y/y in March (5.7% in February), driven by a strong monthly increase of 1.4%. Consensus expected 6.1% y/y (0.9% m/m). Inflation averaged 5.8% in Q1, more than the 5.6% the Bank of Canada estimated. Core measures varied between 2.8%-4.7% to come in at an average 3.77% vs 3.53% in February. Details revealed large price jumps in transportation (3.5% m/m on soaring gasoline prices) and recreation & education (1.8% m/m). Shelter (1% m/m) also surged exceptionally strong. Today’s reading reinforces speculation for a continuation of double-sized rate increases by the BoC. The central bank started doing so at the meeting last week. Canadian money markets are just shy of fully pricing in another such move in June. The Canadian dollar extended earlier gains after the release. USD/CAD weakens from >1.26 to 1.252 currently. EUR/CAD is testing the 2022/multi-year lows at 1.355.
Canadian Dollar Surges as CPI Surges
Canada’s inflation outperforms
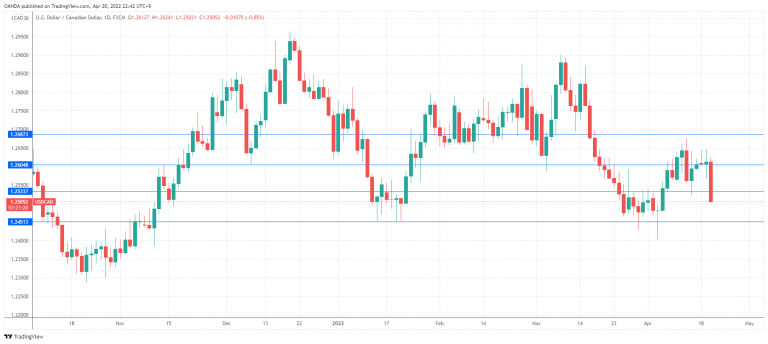
The Canadian dollar is up sharply on Wednesday, as Canada’s inflation report was hotter than expected. In the North American session, USD/CAD is trading at 1.2519, down 0.74% on the day.
Canada’s CPI for March jumped 6.7% YoY, a full percentage point higher than the 5.7% gain in February. On a monthly basis, inflation rose 1.4%, up from 1.0% prior. Both the annual and monthly figures were the highest since January 1991. Inflationary pressures are not just increasing, but are widespread across economic sectors. Fuel, food, durable goods, restaurants, air travel – you name it and prices are moving in one direction – up.
The upswing in inflation is a worrying trend for the BoC, and given the tight labor market and solid growth in the economy, we could be treated to a second straight 0.50% rate increase at the June meeting. At last week’s meeting, the central bank raised rates from 0.50% to 1.00%. The Canadian dollar moved higher, as investors liked the oversize rate hike as well as the BoC’s announcement that it would scale back its balance sheet. The BoC appears to be in sync with the Federal Reserve, as the BoC’s rate-tightening cycle could see rates rise as high as 3% but the end of the year. This should help the Canadian dollar keep pace with a Fed-powered US dollar, at least with regard to monetary policy.
We saw 0.50% rate hikes from the BoC and RBNZ last week and the Fed is likely to follow suit at its May meeting, given that US inflation is galloping along at a 40-year high. FOMC member Bullard is even suggesting that a massive 0.75% hike is a possibility. This stance is not Fed policy, but with talk of a 0.75% increase, a 0.50% move is looking less dramatic, and might not shake up the markets, which have been fed a steady diet of hawkish statements from Fed members over the past few weeks.
USD/CAD Technical
- USD/CAD has broken below resistance at 1.2533. Below, there is support at 1.2451
- There is resistance at 1.2605 and 1.2687
Canadian Inflation Hotter than Expected at 6.7% in March
Consumer price inflation accelerated to 6.7% year-on-year (y/y) in March, up from 5.7% in February. That was well above the consensus forecast for 6.1% and the highest rate since 1991.
Energy price growth accelerated to 27.8% (from 24.1% in February), as gasoline price growth hit 39.8% year-on-year (up from 32.3% in February). Food price inflation also moved higher, to 7.7% (from 7.4% in February) – the highest in over a decade.
The acceleration in price growth was not just a food and energy story. Excluding these categories, inflation was up 4.6% y/y (from 3.9% in February).
Prices for durable goods were particularly strong, up 7.3% year-on-year in March, driven by higher prices for cars and furniture, as supply chain issues and higher input costs contributed to the increases.
Services prices also accelerated, up 4.3% year-on-year versus 3.8% in February. As health restrictions continued to ease across the country, higher prices for close-contact services contributed to the gain.
Seasonally adjusted, month-on-month prices were up a robust 0.9% following a 0.6% gain in February. March's increase matched the largest one-month increase on record.
All three of the Bank of Canada's core inflation metrics picked up steam in March. CPI-trim rose 0.3 percentage points to 4.7%, CPI-common by 0.1 percentage points to 2.8%, and CPI-median by 0.3 percentage points to 3.8%. At 3.8%, the average of the three measures was up from 3.5% in February.
Key Implications
Inflation was expected to be hot in March – but it was even hotter than expected. No surprise to anyone who has filled up their tanks in March, higher gasoline prices drove an outsized gain in consumer prices. Due to the war in Ukraine, the forecast for oil prices is more uncertain than usual. However, we expect that energy costs will provide less lift to inflation going forward.
However, price pressures across other areas of the economy are showing more heat both for goods and services. Inflation is likely to remain above the Bank of Canada's target range until 2023, crimping consumer purchasing power and driving interest rates higher.
The Bank of Canada has already responded to the rapid pace of inflation by upping the ante on rate increases, hiking 50 basis points last week. We believe this inflation report supports the case for another 50-pointer in June.
EUR/USD Mid-Day Outlook
Daily Pivots: (S1) 1.0763; (P) 1.0788 (R1) 1.0816; More...
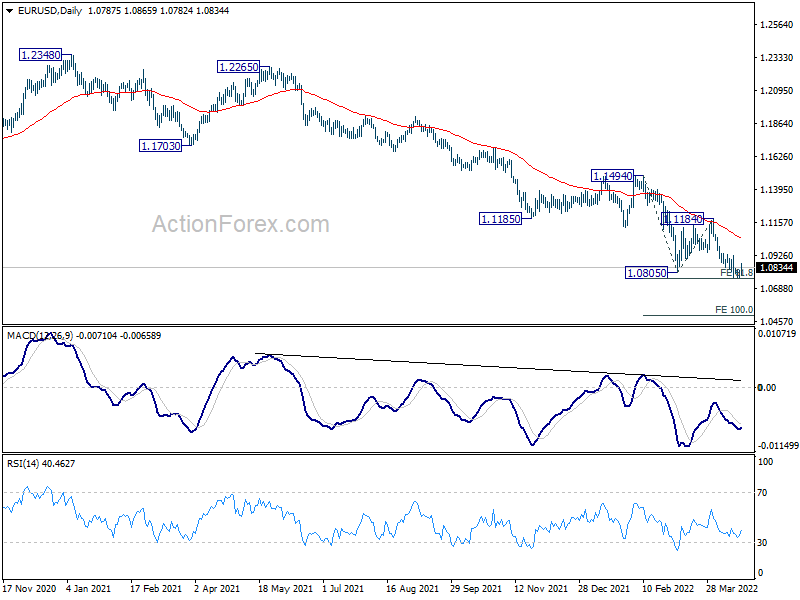
Range trading continues in EUR/USD and intraday bias remains neutral first. Further decline is expected with 1.0922 resistance intact. On the downside, firm break of 1.0756 will resume larger down trend to 100% projection of 1.1494 to 1.0805 from 1.1184 at 1.0495. However, break of 1.0922 will turn bias back to the upside for stronger rebound towards 1.1184 resistance instead.
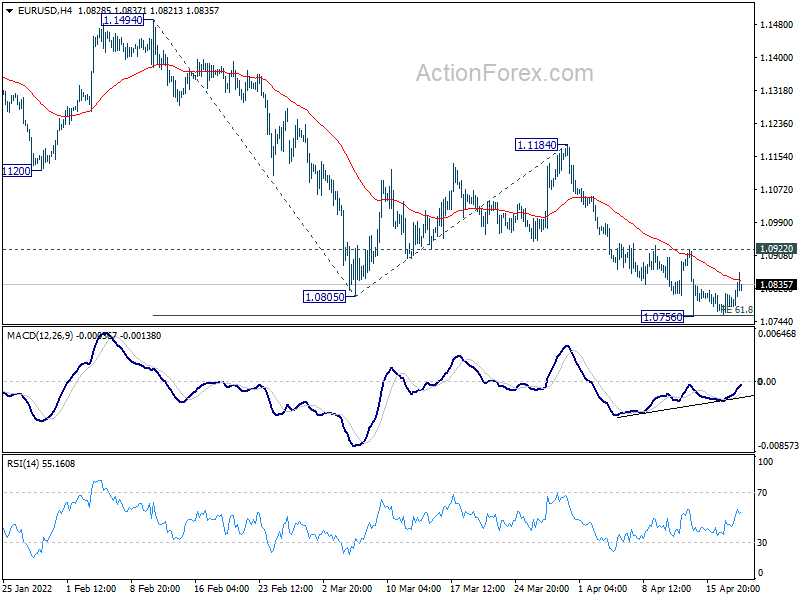
In the bigger picture, the decline from 1.2348 (2021 high) is expected to continue as long as 1.1494 resistance holds. Firm break of 1.0635 (2020 low) will raise the chance of long term down trend resumption and target a retest on 1.0339 (2017 low) next. Nevertheless, break of 1.1494 will maintain medium term neutral outlook, and extending term range trading first.