

Sample Category Title
GBP/USD Mid-Day Outlook
Daily Pivots: (S1) 1.2973; (P) 1.3007; (R1) 1.3033; More...
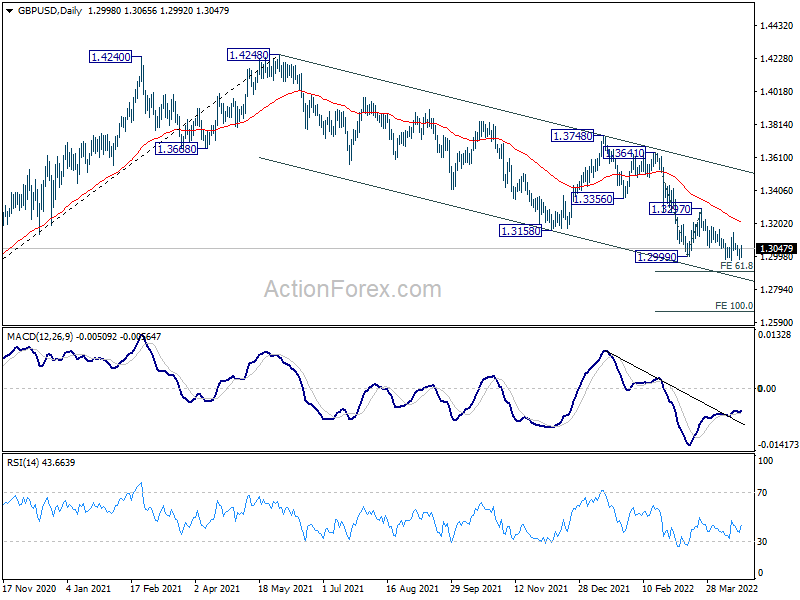
Intraday bias in GBP/USD remains neutral as sideway trading continues. With 1.3165 resistance intact, further decline is expected. On the downside, break of 1.2971 will resume larger down trend from 1.4248. Next target is 61.8% projection of 1.3641 to 1.2999 from 1.3297 at 1.2900. On the upside, firm break of 1.3165 will confirm short term bottoming, and turn bias back to the upside for 1.3297 resistance and above.
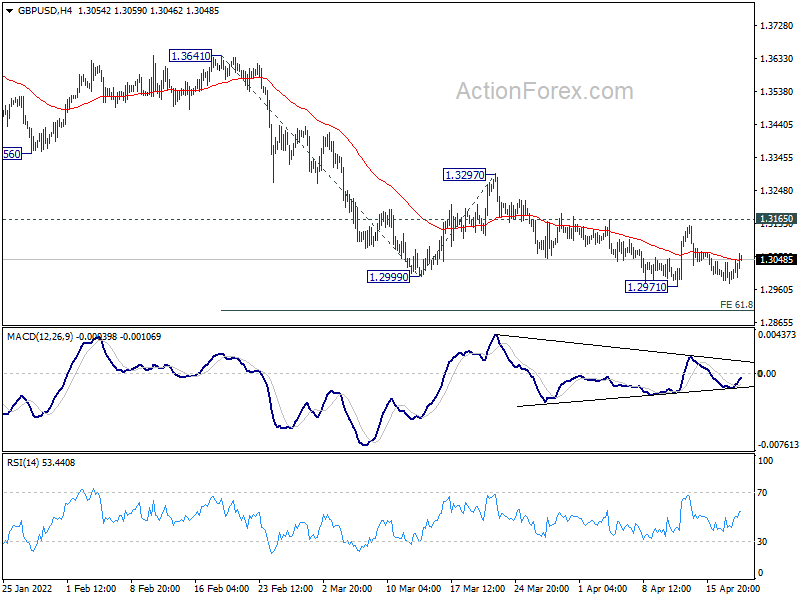
In the bigger picture, rise from 1.1409 (2020 low) has completed at 1.4248. Decline from 1.4248 could still be a corrective move, or it could be the start of a long term down trend. In either case, deeper decline would be seen back to 61.8% retracement of 2.1161 to 1.1409 at 1.2493. In any case, break of 1.3748 resistance is needed confirm completion of the fall from 1.4248, or outlook will stay bearish.
USD/CHF Mid-Day Outlook
Daily Pivots: (S1) 0.9462; (P) 0.9493; (R1) 0.9554; More....
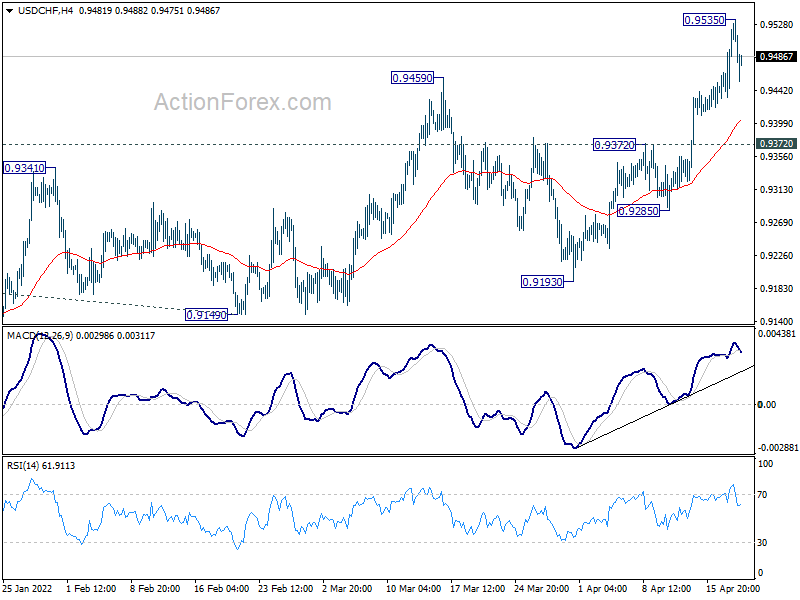
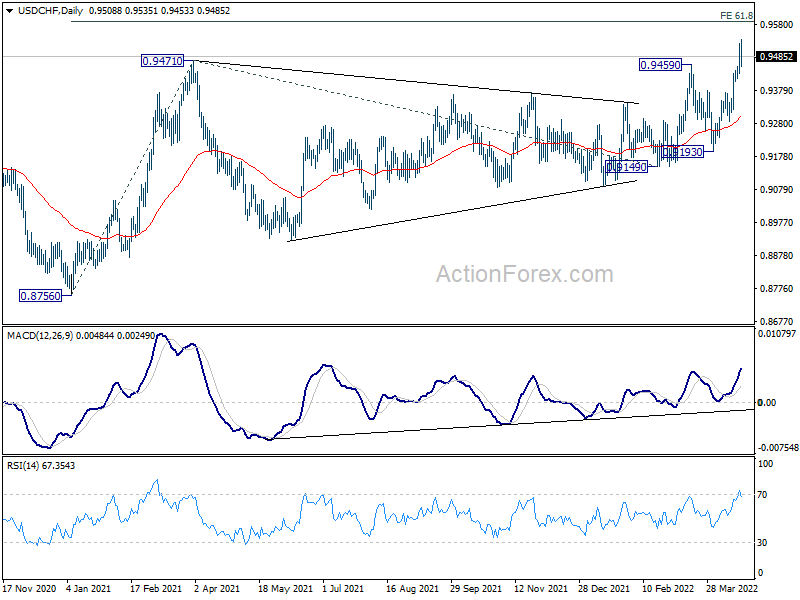
A temporary top is formed at 0.9535 in USD/CHF with current retreat. Intraday bias is turned neutral first. Downside of retreat should be contained by 0.9372 resistance turned support to bring another rally. On the upside, above 0.9535 will target 0.9591 medium term projection level.
In the bigger picture, down trend from 1.0342 (2016 high) could have completed with three waves down to 0.8756 (2021 low) already. Rise from 0.8756 is likely a medium term up trend of its own. Next target is 61.8% projection of 0.8756 to 0.9471 from 0.9149 at 0.9591. Sustained break there will pave the way to 100% projection at 0.9864. This will now remain the favored case as long as 0.9149 support holds.
USD/JPY Mid-Day Outlook
Daily Pivots: (S1) 127.58; (P) 128.28; (R1) 129.58; More...
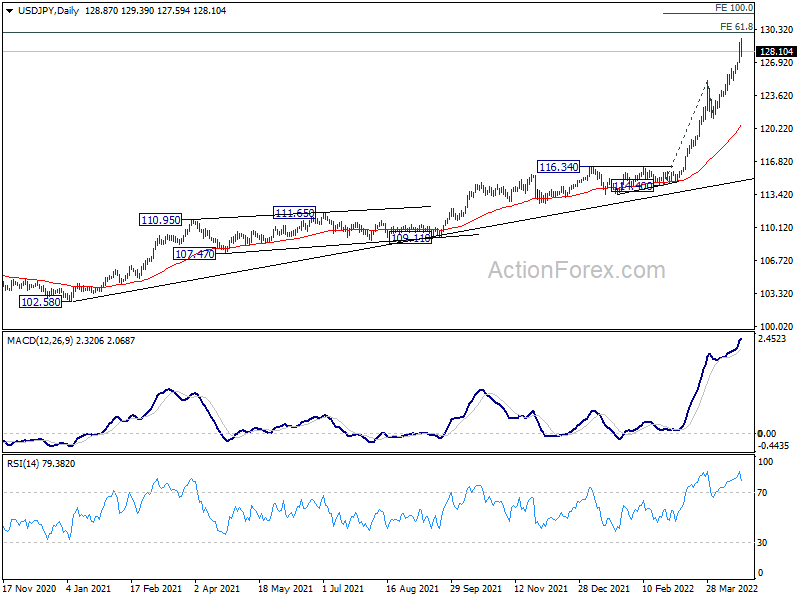
Intraday bias in USD/JPY is turned neutral with breach of 127.76 minor support. Deeper pull back could be seen. But downside should be contained by 125.09 resistance turned support to bring another rally. On the upside, above 129.39 will resume larger up trend to 130.04 long term projection level next.
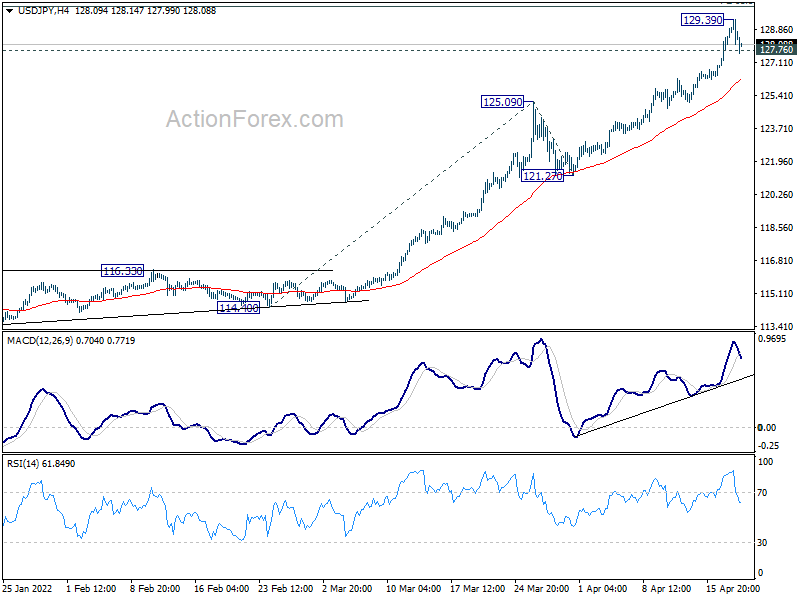
In the bigger picture, the break of 125.85 resistance (2015 high) suggests that whole up trend from 75.56 (2011 low) is resuming. Further rise should be seen to 61.8% projection of 75.56 (2011 low) to 125.85 (2015 high) from 98.97 at 130.04. Sustained break there wave the way to 147.68 (1998 high). For now, this will remain the favored case as long as 121.27 support holds.
USD/CAD Mid-Day Outlook
Daily Pivots: (S1) 1.2578; (P) 1.2612; (R1) 1.2656; More...
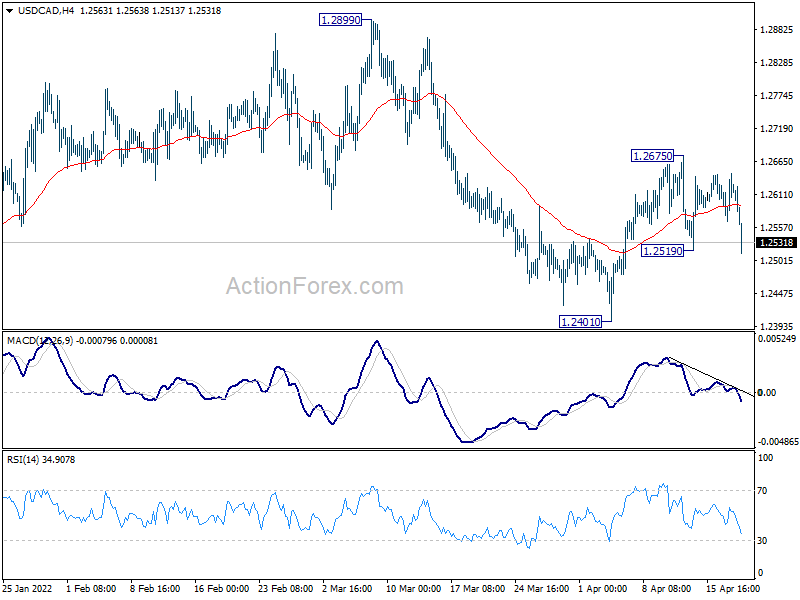
Immediate focus is on 1.2519 minor support in USD/CAD. Break there will target 1.2401 support first. Firm break there will resume larger decline from 1.2899 to retest 1.2005 low. On the upside, though, break of 1.2675 will flip bias back to the upside for 1.2899 resistance instead.
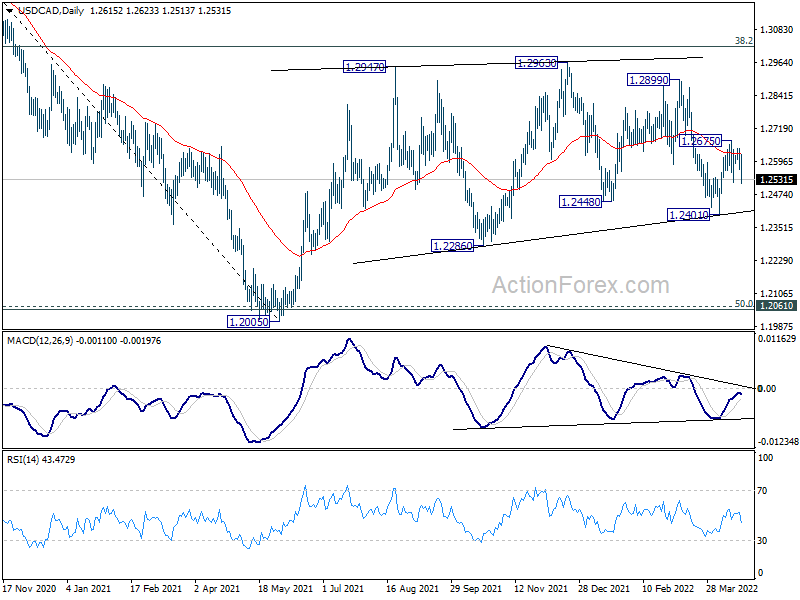
In the bigger picture, focus stays on 38.2% retracement of 1.4667 (2020 high) to 1.2005 (2021 low) at 1.3022. Sustained break there should confirm that the down trend from 1.4667 has completed after defending 1.2061 long term cluster support. Further rise would then be seen towards 61.8% retracement at 1.3650. However, rejection by 1.3022 will maintain medium term bearishness. Break of 1.2005 will resume the down trend from 1.4667 and that carries larger bearish implications too.
CAD Surges after CPI Beat Expectations, Dollar Corrects Lower
Canadian Dollar surges in early US session after much stronger than expected consumer inflation data, which supports more aggressive tightening by BoC. Other commodity currencies are also strong. On the other hand, Dollar is trading broadly lower as recent rally lost momentum, in particular against Yen. Euro is also soft, together with Sterling and Swiss Franc. In other markets, European stocks are trading mildly higher while US futures point to higher open. Global benchmark treasury yields are paring recent sharp gains.
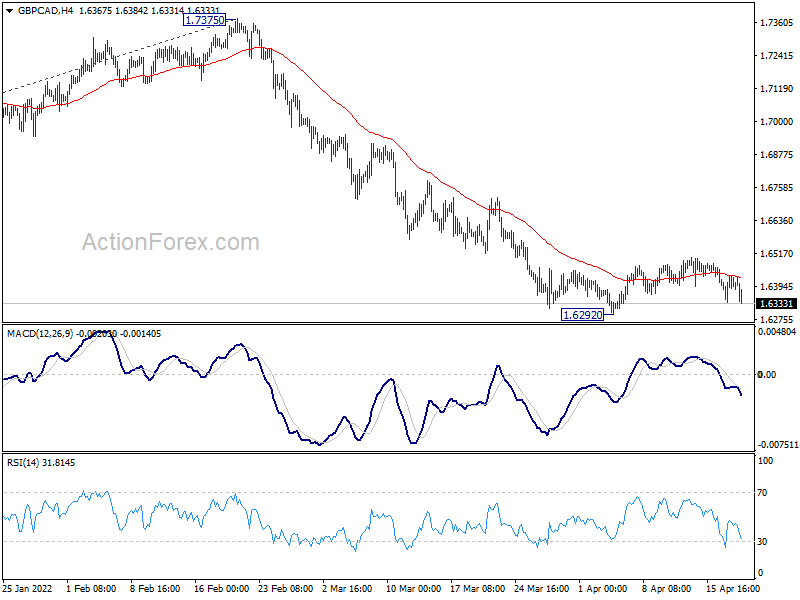
Technically, a focus for the rest of the day would be on whether Canadian Dollar could extend the post CPI rise. As for USD/CAD, it will need to break through 1.2519 minor support. EUR/CAD will need to break through 1.3541 temporary low to resume recent down trend. Similarly, GBP/CAD will also break through 1.6292 temporary low to resume down trend.
In Europe, at the time of the writing, FTSE is up 0.21%. DAX is up 1.22%. CAC is up 1.44%. Germany 10-year yield is down -0.045 at 0.868. Earlier in Asia, Nikkei rose 0.86%. Hong Kong HSI dropped -0.40%. China Shanghai SSE dropped -1.35%. Singapore Strait Times rose 0.85%. Japan 10-year JGB yield rose 0.0069 to 0.248.
Canada CPI rose to 6.7% yoy in Mar, highest since 1991
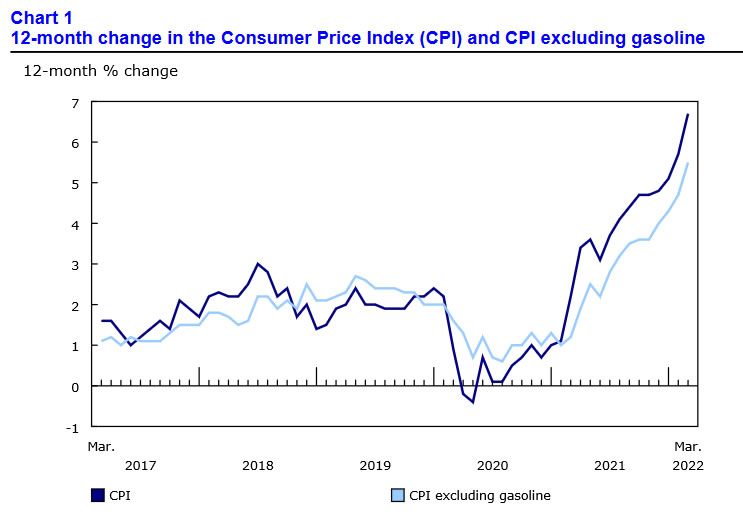
Canada CPI rose 1.4% mom in March, above expectation of 0.9% mom. That's the largest monthly increase since January 1991. For the 12-month period, CPI accelerated from 5.7% yoy to 6.7% yoy, well above expectation of 6.1% yoy. That's also the largest annual rise since January 1991.
CPI common rose from 2.7% yoy to 2.8% yoy, above expectation of 2.7% yoy. CPI median rose from 3.5% yoy to 3.8% yoy, above expectation of 3.5% yoy. CPI trimmed rose from 4.4% yoy to 4.7% yoy, above expectation of 4.3% yoy.
Statistics Canada said: "Inflationary pressure remained widespread in March, as prices rose across all eight major components. Prices increased against the backdrop of sustained price pressure in Canadian housing markets, substantial supply constraints and geopolitical conflict, which has affected energy, commodity, and agriculture markets."
ECB Kazaks: A rate increase in July is possible
ECB Governing Council member Martins Kazaks said in a Bloomberg interview, that it's possible to hike interest rate in July. Meanwhile, QE could end at the end of June but the policy members will have to discuss it with new economic forecasts on hand.
"A rate increase in July is possible, and I have no reason to disagree with what markets are pricing for the second half of the year," he said. "We are on a solid path of policy normalization" where "we step-by-step gradually get to zero and then above".
"Gradual doesn't mean slow," added Kazaks. "It doesn't mean being consciously behind the curve. No, it just means checking if taken policy measures are appropriate."
"We haven't seen any major elements of stress in financial markets, which makes me think that ending QE early in the third quarter is possible and appropriate," Kazaks said. "Whether it could already happen at the end of June, we'll have to discuss when we get new forecasts."
Eurozone industrial production rose 0.7% mom in Feb, EU up 0.6% mom
Eurozone industrial production rose 0.7% mom in February, below expectation of 0.8% mom. Production of durable consumer goods rose by 2.7%, non-durable consumer goods by 1.9% and intermediate goods by 0.9%, while production of capital goods fell by -0.1% and energy by -1.1%.
EU industrial production rose 0.6% mom. Among Member States for which data are available, the highest monthly increases were registered in Italy (+4.0%), Croatia (+2.7%) and Ireland (+2.4%). The largest decreases were observed in Slovenia (-8.3%), Lithuania (-3.8%) and Malta (-2.7%).
Eurozone exports rose 17.0% yoy in Feb, imports rose 38.8% yoy
Eurozone goods exports rose 17.0% yoy to EUR 215.8B in February. Imports rose 38.8% yoy to EUR 223.4B. Trade deficit came in at EUR -7.6B. Intra-Eurozone trade rose 25.6% yoy to EUR 202.5B.
In seasonally adjusted term, Eurozone exports rose 0.8% mom to EUR 223.6B. Imports rose 1.5% mom to EUR 233.1B. trade deficit widened from EUR -7.7B to EUR -9.4B, larger than expectation of EUR -6.5B. Intra-Eurozone trade rose from EUR 202.7B to EUR 205.8B.
Australia Westpac leading index rose to 1.71, highest since last May
Australia Westpac-MI leading index rose from 1.02% to 1.71% in March. That's the fastest growth rate since May 2021. The data are consistent with Westpac's expectation of around 5.5% GDP growth in 2022, with more than 70% of that being concentrated in Q2 and Q3.
Westpac expects RBA to be on hold at May 3 meeting, but be prepared to move interest rate at June 7 meeting. It expects a hike of 15bps in June, with 25bps hikes at most subsequent meetings to reach 1.25% at the end of 2022. In 2023, it expects three further 25bps hikes with interest rate peaking at 2% in June.
Japan exports rose 14.7% yoy in Mar, imports surged 31.2% yoy
Japan exports rose 14.7% yoy to JPY 8461B in March. That's the 13th straight month of rise, reflecting robust demand for semiconductor manufacturing devices in Taiwan and steel product shipments to Vietnam. Imports rose 31.2% yoy to JPY 8873B. Petroleum imports jumped 69.7% yoy, the 12th straight month of rise. Trade deficit came in as JPY -412B, the 8th straight month of deficit, longest streak since 2015.
In seasonally adjusted term, exports rose 1.7% mom to JPY 7570B. Imports dropped -0.5% mom to JPY 8470B. Trade deficit came in at JPY -900B.
USD/CAD Mid-Day Outlook
Daily Pivots: (S1) 1.2578; (P) 1.2612; (R1) 1.2656; More...
Immediate focus is on 1.2519 minor support in USD/CAD. Break there will target 1.2401 support first. Firm break there will resume larger decline from 1.2899 to retest 1.2005 low. On the upside, though, break of 1.2675 will flip bias back to the upside for 1.2899 resistance instead.
In the bigger picture, focus stays on 38.2% retracement of 1.4667 (2020 high) to 1.2005 (2021 low) at 1.3022. Sustained break there should confirm that the down trend from 1.4667 has completed after defending 1.2061 long term cluster support. Further rise would then be seen towards 61.8% retracement at 1.3650. However, rejection by 1.3022 will maintain medium term bearishness. Break of 1.2005 will resume the down trend from 1.4667 and that carries larger bearish implications too.
Economic Indicators Update
| GMT | Ccy | Events | Actual | Forecast | Previous | Revised |
|---|---|---|---|---|---|---|
| 23:50 | JPY | Trade Balance (JPY) Mar | -0.90T | -0.48T | -1.03T | -1.07T |
| 00:30 | AUD | Westpac Leading Index M/M Mar | 0.30% | -0.20% | 0.40% | |
| 04:30 | JPY | Tertiary Industry Index M/M Feb | -1.30% | 0.30% | -0.70% | -0.20% |
| 06:00 | EUR | Germany PPI M/M Mar | 4.90% | 3.40% | 1.40% | |
| 06:00 | EUR | Germany PPI Y/Y Mar | 30.90% | 26.60% | 25.90% | |
| 08:00 | EUR | Italy Trade Balance (EUR) Feb | -1.66B | -4.23B | -5.05B | |
| 09:00 | EUR | Eurozone Trade Balance (EUR) Feb | -9.4B | -6.5B | -7.7B | |
| 09:00 | EUR | Eurozone Industrial Production M/M Feb | 0.70% | 0.80% | 0.00% | -0.70% |
| 12:30 | CAD | CPI M/M Mar | 1.40% | 0.90% | 1.00% | |
| 12:30 | CAD | CPI Y/Y Mar | 6.70% | 6.10% | 5.70% | |
| 12:30 | CAD | CPI Common Y/Y Mar | 2.80% | 2.70% | 2.60% | 2.70% |
| 12:30 | CAD | CPI Median Y/Y Mar | 3.80% | 3.50% | 3.50% | |
| 12:30 | CAD | CPI Trimmed Y/Y Mar | 4.70% | 4.30% | 4.30% | 4.40% |
| 13:30 | CAD | New Housing Price Index M/M Mar | 1.20% | 0.70% | 1.10% | |
| 14:00 | USD | Existing Home Sales Mar | 5.80M | 6.02M | ||
| 14:30 | USD | Crude Oil Inventories | 3.0M | 9.4M | ||
| 18:00 | USD | Fed's Beige Book |
Canada CPI rose to 6.7% yoy in Mar, highest since 1991
Canada CPI rose 1.4% mom in March, above expectation of 0.9% mom. That's the largest monthly increase since January 1991. For the 12-month period, CPI accelerated from 5.7% yoy to 6.7% yoy, well above expectation of 6.1% yoy. That's also the largest annual rise since January 1991.
CPI common rose from 2.7% yoy to 2.8% yoy, above expectation of 2.7% yoy. CPI median rose from 3.5% yoy to 3.8% yoy, above expectation of 3.5% yoy. CPI trimmed rose from 4.4% yoy to 4.7% yoy, above expectation of 4.3% yoy.
Statistics Canada said: "Inflationary pressure remained widespread in March, as prices rose across all eight major components. Prices increased against the backdrop of sustained price pressure in Canadian housing markets, substantial supply constraints and geopolitical conflict, which has affected energy, commodity, and agriculture markets."
Japanese Yen Rebounds on BoJ
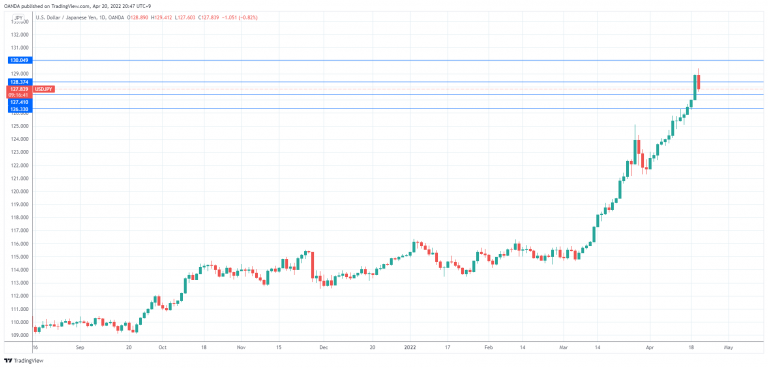
It has been a busy day for the Japanese yen. The currency came tantalizingly close to the symbolic 130 level earlier today, but then reversed directions. After touching a 20-year high of 129.41, USD/JPY has dropped to 127.93, down 0.71% on the day.
Yen gets some relief from BoJ
The yen finally got a break after a dreadful slide and is in positive territory today. The BoJ came to the rescue, although the central bank wasn’t looking to prop up the yen, but rather to defend its yield curve by capping the 10-year JGB at 0.25%. The yen’s rebound is likely to be temporary, as the main driver for the yen is the US/Japan rate differential, which continues to widen. On Tuesday, the 10-year Treasury yield rose to 2.94%, a new four-year high. Treasury yields are rising while the BoJ is keeping JGBs at low levels, and that is a proven recipe for a USD/JPY upswing. This means that the USD/JPY uptrend should resume and put the 130 line under strong pressure.
The BoJ is determined to keep the 1o-year JGB target in check and has intervened for the second time in just three weeks. The central bank is committed to its ultra-loose policy in order to kick-start the weak economy and is willing to pay the price of a weak yen. But will the BoJ be singing the same tune if USD/JPY barrels above 130? Traditionally, the BoJ has shied away from directly intervening in the currency markets and buying yen, so that scenario is an unlikely one. There’s no question that the BoJ is uneasy about the sharp drop in the yen and officials have been trotting out their usual jawboning about the exchange rate. Still, there may be a USD/JPY ‘line in the sand’ which triggers a move by the central bank, which means that investors should tread carefully with the yen.
USD/JPY Technical
- There are resistance lines at 1.2837 and 1.3005
- USD/JPY has support at 1.2740. Below, there is 126.32 is a monthly support line
ECB Kazaks: A rate increase in July is possible
ECB Governing Council member Martins Kazaks said in a Bloomberg interview, that it's possible to hike interest rate in July. Meanwhile, QE could end at the end of June but the policy members will have to discuss it with new economic forecasts on hand.
"A rate increase in July is possible, and I have no reason to disagree with what markets are pricing for the second half of the year," he said. "We are on a solid path of policy normalization" where "we step-by-step gradually get to zero and then above".
"Gradual doesn't mean slow," added Kazaks. "It doesn't mean being consciously behind the curve. No, it just means checking if taken policy measures are appropriate."
"We haven't seen any major elements of stress in financial markets, which makes me think that ending QE early in the third quarter is possible and appropriate," Kazaks said. "Whether it could already happen at the end of June, we'll have to discuss when we get new forecasts."
Gold’s Cup-and-Handle Pattern?
Gold is falling fast, having lost about 3% to $1940 from Monday’s peak. On Monday, the bulls are locally capitulating after an unsuccessful attempt to push the price above $2000.
It would be a mistake to attribute gold’s fall to an expensive dollar. Since the start of the year, the dollar index and gold have had a more than 80% correlation versus -0.34% in 2021, reflecting that investors see gold and the dollar as defensive assets amid the Russia-Ukraine conflict.
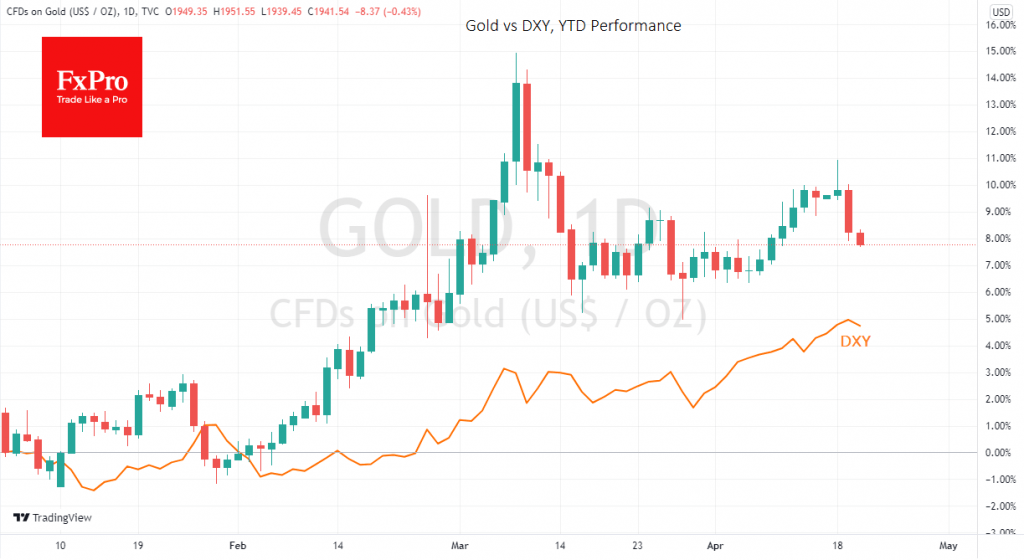
Yesterday the dollar index slowed its rise towards the end of the day. It reversed to a decline on Wednesday morning, while gold has been actively declining since the beginning of the week, reinforcing their close correlation.
Gold’s recent retreat could be a sign of hope for a détente in the European conflict and a desire to lock in profits from the powerful movement of recent days. As it is difficult to find signs of de-escalation in the news, we are leaning towards the second option.
With EURUSD near 1.08, GBPUSD near 1.30 and USDJPY one step away from 130, the dollar is near historical extremes. The same can be seen in the Dollar Index, which since last week has been trading above 100, a psychologically crucial round level.
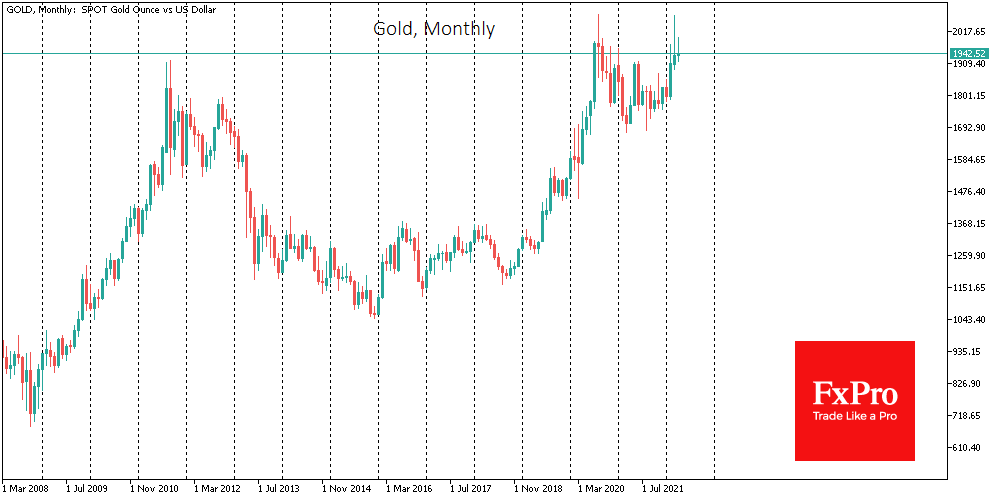
Since the beginning of February, gold has found support on the declines toward its 50-day moving average in the last rally. If a test of this level in the coming days also confirms the resilience of this support, we could see a new high soon.
On the long-term gold chart, the pullback from the highs in 2020 and the subsequent smooth recovery is a handle in a “cup-and-handle” pattern, whereby a cup has formed over eight years since 2012. This pattern will gain strength should gold consolidate above $2000 with a final target near $3000.
Bitcoin’s Rise Following Markets; Altcoins’ Progress
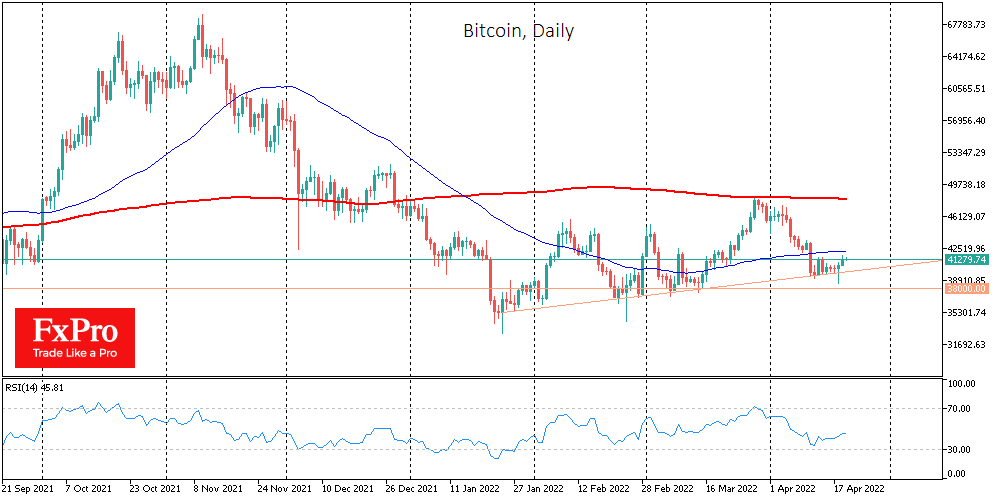
Bitcoin rose 1.4% on Tuesday, ending the day around $41,300 and remaining near that mark on Wednesday morning. Ethereum added 1.3% to $3080 in the last 24 hours, XRP corrected 0.9% to 0.766, and other top ten altcoins gained 0.7% (BNB) to 4.9% (Terra).
Total crypto market capitalisation, according to CoinMarketCap, rose 1.3% overnight to $1.92 trillion. Bitcoin’s dominance index was little changed, remaining at 41.0%.
By Wednesday, the Cryptocurrency Fear and Greed Index remained at 27 points (fear).
Bitcoin on Tuesday tested 8-day highs above $41,700 on the back of rising US stock indices, which strengthened for a second straight day.
According to Arcane Research, the correlation between BTC and the Nasdaq Composite Index has been highest since July 2020.
Terra (LUNA) gained 5.5 per cent as Terra USD (UST) moved up to third place in terms of capitalisation among stablecoins.
Chamath Palihapitiya, CEO of Social Capital and Virgin Galactic, said Solana (SOL) could capture market share in traditional financial services by challenging Visa and Mastercard. SOL is up 4.6%.
The creators of the largest anonymous cryptocurrency, Monero, have confirmed that a 15th network hardfork is set for July 16.
Jack Mallers, CEO of payment service Strike, said that bitcoin as a payment method is superior to all other systems. Nevertheless, it is better not to spend BTC but invest in it long-term.
The US Secret Service’s Office of Investigations (USSS) has disclosed that since 2015 the service has seized more than $102 million in digital assets from criminals.
The Financial Action Task Force (FATF) believes that nearly half of the world’s countries are not complying with anti-money laundering and counter-terrorist financing (AML) regulations. FATF has pledged to monitor member countries, including the US, China and the European Union.