Sample Category Title
Stocks Jump as Crude Oil and Gold Prices Retreat
Global stocks jumped on Tuesday after Russia sent mixed signals about its strategy on Ukraine. The country’s defense minister announced that it will pull some of its troops from the Ukrainian border. It also noted that large-scale military training in its territory would continue. The announcement came at a time when Western countries are attempting to solve the crisis in a diplomatic way. Yesterday, Putin held a meeting with Olaf Scholz and insisted that he does not want war with Europe. The Dow Jones, S&P 500, and Nasdaq 100 indices rose by more than 2% on Tuesday.
The price of crude oil declined sharply as investors reacted to the happenings in Ukraine. Brent, the global benchmark, declined by more than 3% to $93 while West Texas Intermediate (WTI) declined by almost 4% to $91.8. The main reason why oil prices dropped is that analysts were expecting Russia’s supply to be cut off by sanctions if it invaded Ukraine. As a result, the world would be short by about 5 million barrels of oil per day. That deficit would be difficult to fill by other OPEC and non-OPEC members. Later today, the Energy Information Agency (EIA) will publish the latest inventory data.
The US dollar declined slightly as investors embraced a risk-on sentiment. The currency declined even after the US published the relatively strong producer price index (PPI) data. The numbers revealed that the country’s PPI increased from 0.4% in December to 1.0% in January. On a year-on-year basis, the PPI declined slightly from 9.8% to 9.7%. Later today, the US will publish the latest retail sales numbers. Other key economic numbers to watch will be the latest Canadian and UK consumer inflation data. The Eurozone will publish the latest industrial production data.
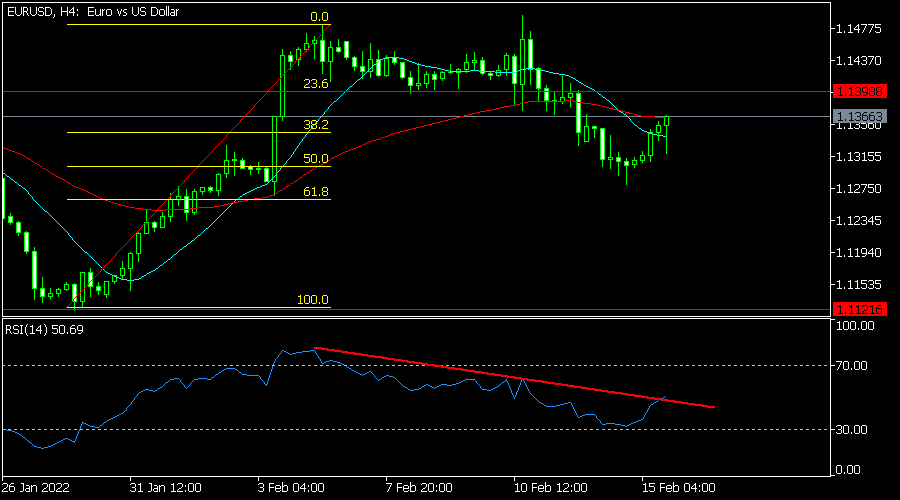
EURUSD
The EURUSD pair rose to a high of 1.1365 as Ukrainian risks eased. On the four-hour chart, the pair managed to move above the 38.2% Fibonacci retracement level. It also moved slightly above the 14-day and 25-day moving averages while the RSI crossed the descending trendline shown in red. It has also formed a small inverted head and shoulders pattern. Therefore, there is a possibility that the pair will keep rising as bulls target the next key resistance at 1.1400.
EURCHF
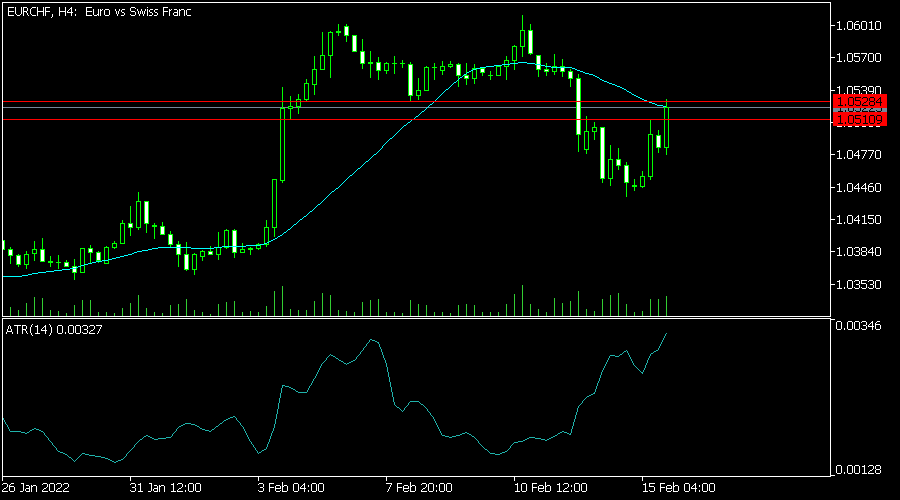
The EURCHF pair rose to a high of 1.0522, which was the highest level since February 11. On the four-hour chart, the pair moved above the key resistance at 1.0510, which was the highest level in January. It also moved above the 25-day moving average while the Average True Range (ATR) has been in a strong bullish trend. The pair has also retested the chin of the double-top pattern. Therefore, since a break and retest pattern is usually bearish, there is a possibility that it will resume the bearish trend.
XAUUSD
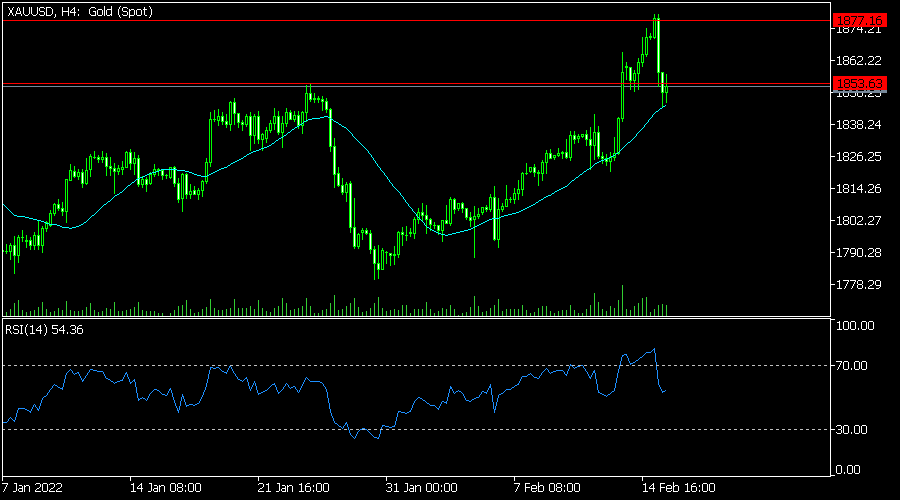
The XAUUSD pair erased some of the gains it made this week as demand for safe havens declined. The pair rose to a high of 1,875, which was an important resistance level since it was the highest level on November 16. It also managed to move below the key support level at 1,853, which was the highest point on January 27. Therefore, the pair will likely keep falling today.
The Crypto Market Has Pushed Up from Support
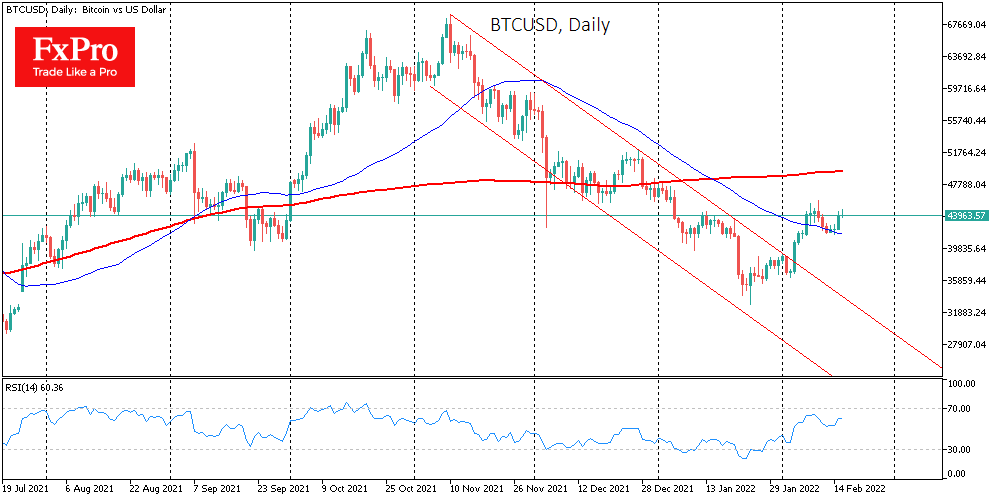
Cryptocurrencies rose on Tuesday on the back of strengthening stock indices and falling protective assets like gold, the yen, and treasuries. Bitcoin started its rise before the news about Russia and Ukraine hit the wires and sparked risk-on sentiments. Technical factors may have influenced the first cryptocurrency’s strengthening, with BTC pushing back from its 50-day moving average, which has been acting as a support level for the past week.
Russia has proposed allowing cryptocurrency mining in specific regions and imposing taxes on the conversion of crypto assets into fiat and is making progress in testing the digital rouble with the first interbank transfers.
Bitcoin rose on Tuesday to its highest level in the past week (+4.4%), ending the day around $44,100, where it is trading on Wednesday morning. Ethereum jumped 7.3% on Tuesday, settling at $3100, while other leading altcoins from the top 10 also added: from 1.7% (XRP) to 12% (Avalanche).
Overnight, crypto market capitalisation rose 2% to $1.98 trillion, according to CoinMarketCap estimates. Since early January, the market has not been consistently above the 2 trillion mark, and consolidation above could be an essential signal for bulls to move from observation to active buying. Since the end of January, there has been a notable uptrend support line that can be drawn through the local lows, which sets up optimism in the short term.
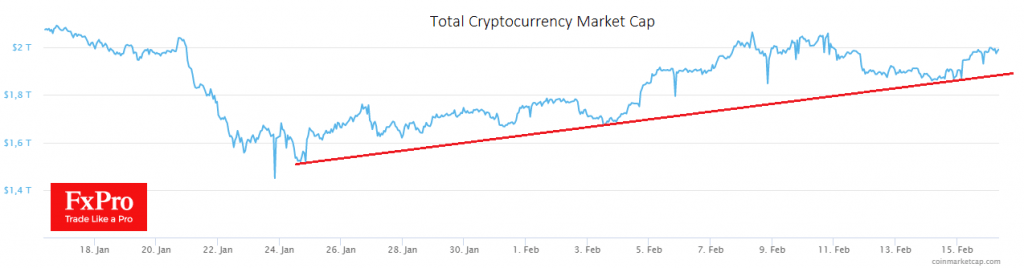
The two largest cryptocurrencies, BTC and ETH, are attempting to consolidate above their 50-day averages, which previously signalled the end of a bearish phase. This was primarily made possible by optimism on Wall Street, where investors continue to buy out drawdowns. Altcoins showed outperformance, which led to a 0.3 percentage point decline in the Bitcoin Dominance Index to 40.4%. The Fear & Greed Index climbed from 46 to 51, moving into the Neutral from the Fear territory.
XAU/USD Seeks Support
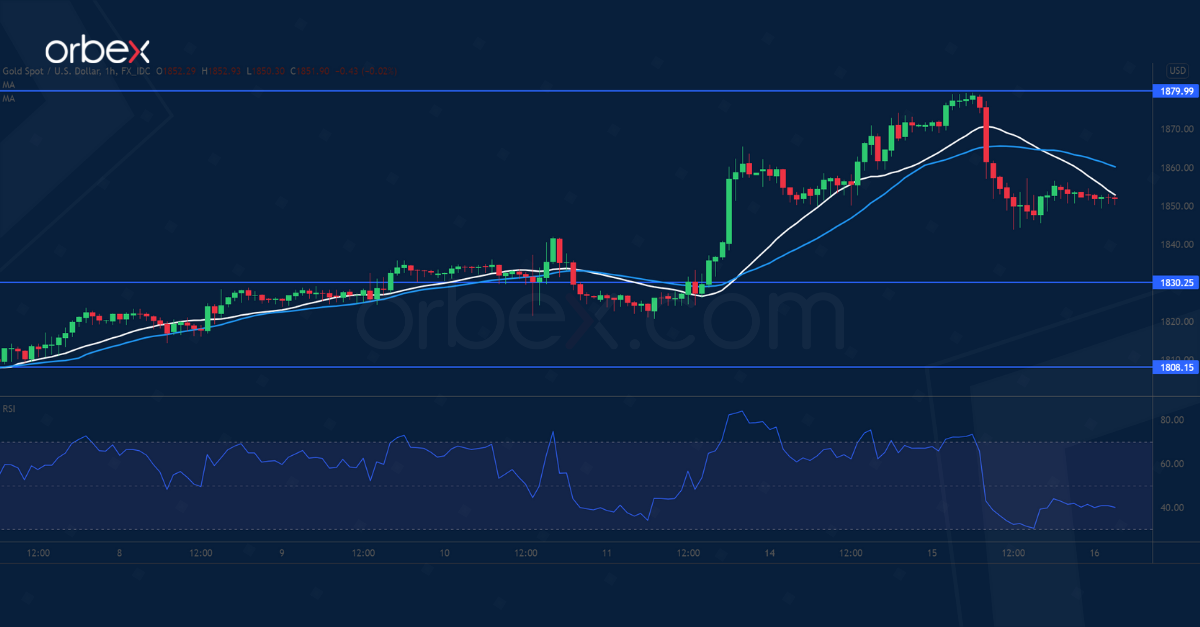
Gold drifts lower on signs of de-escalation in Ukraine. A break above last November’s high at 1875 may have put the precious metal back on track.
However, the rally ran out of steam in the short term with the RSI shooting into the overbought territory. The price is taking a breather and buyers may see a pullback as an opportunity to stake in.
A drop below 1852 may wash out weak hands and deepen the correction towards 1830. 1880 is now a fresh resistance and its breach could propel bullion to last June’s high at 1910.
GBP/USD Awaits Breakout
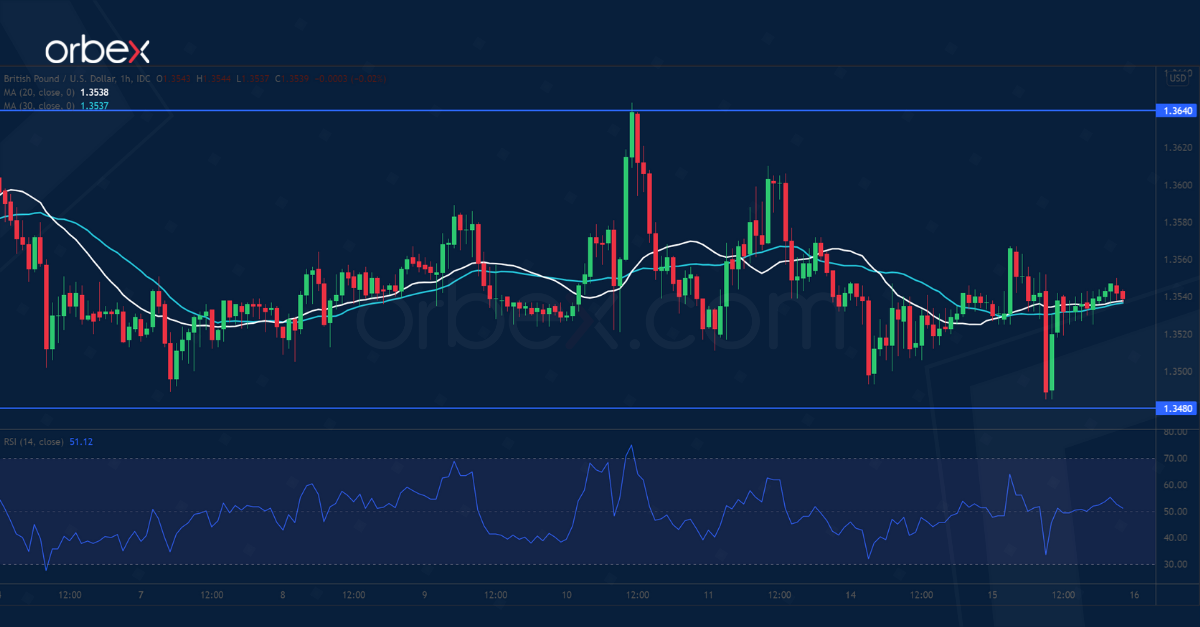
The sterling holds well as Britain’s wage growth beats expectations in December. The current rebound came under pressure in the supply zone around 1.3660 which was the origin of a sharp drop in late January.
An overbought RSI led to some profit-taking but the pound has found support above 1.3480. The bears’ failed attempts to push lower indicates strong demand.
A bullish close above 1.3640 would lift offers towards last month’s high at 1.3750. The daily support at 1.3370 is a key floor in keeping the rally intact.
EUR/USD Bounces Off Support
The US dollar retreats as the Fed’s half-point hike in March remains uncertain.
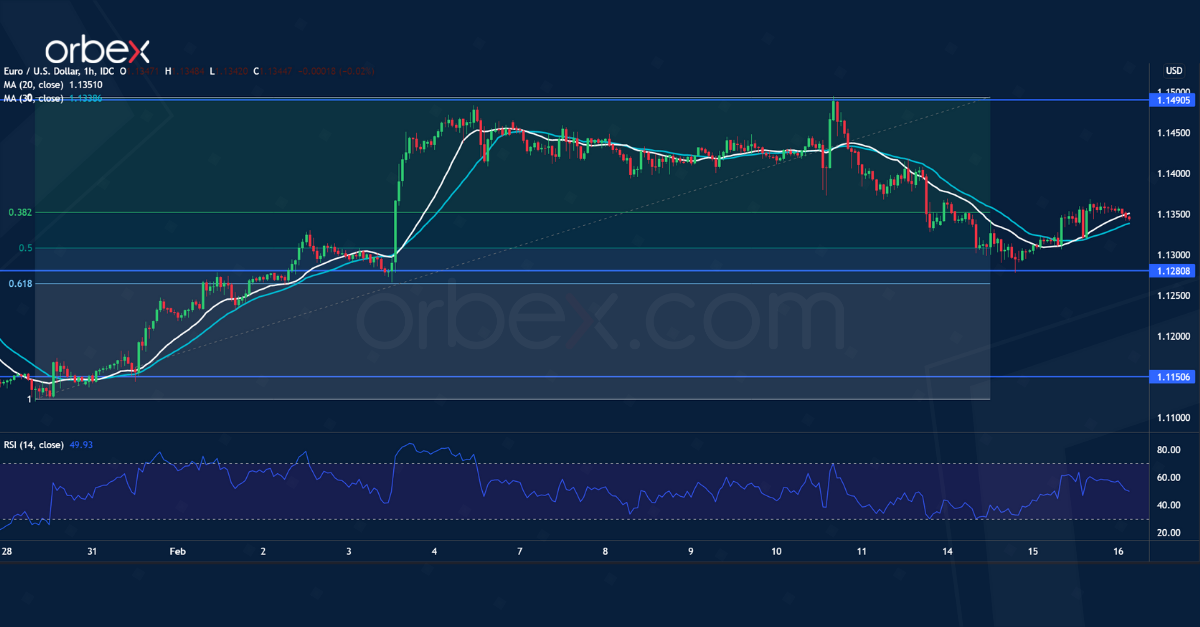
The euro’s break above the daily resistance at 1.1480 boosted buyers’ confidence after a sell-off in January. It bounced off 1.1280 at the base of the recent bullish breakout. The support also is right next to the 61.8% Fibonacci retracement level (1.1265) making it an area of congestion.
A close above the intermediate resistance (1.1370) would attract more buying interest. Then an extension above 1.1490 may fuel a rally towards 1.1600.
Markets Will Look for Clues on a Potential 50 bps Kickstart in March
Markets
News on the geopolitical front trumped second tier data as the dominant trading factor yesterday. Russian president Putin indicated he is still open for a diplomatic solution. He announced several thousands of troops that were amassed near the Ukrainian border would return to base. While parties involved, including NATO, remained cautious, stock markets yesterday went full force. European equities bounced up to 2%, Wall Street finished more than 2.5% (Nasdaq) higher.
Yield curves bear steepened. US yields added 0.2 bps to 7.2 bps (30y) with the 10y tenor closing north of 2% again. German yields rose 1.6 bps (2y) over 2.5 bps (10y) to 5.6 (30y). Both the 10y and 30y hit new cycle highs with the latter piercing through the 0.50% resistance area (March/May19 interim low, May21 previous recovery high).
ECB’s Villeroy delivered a first concrete timeline for policy normalization this year, saying APP bond buying could end in Q3. Reductions could follow a bi-monthly or even monthly pace instead of a quarterly one. The French governor did suggest there could be more time between ending net bond buying and a first rate hike by adjusting current forward guidance. His comments came after the European close thus left no traces on cash trading.
We do note some Bund weakness going into early European dealings today. US yields leave intraday lows behind as well. Asian-Pacific stocks take comfort from yesterday’s WS performance. Japan (+2.3%) outperforms. EUR/USD eked out a gain from the low 1.13 to 1.136 and sticks near those closing levels this morning. Safe haven currencies including JPY and CHF lose out (marginally) for a second day. EUR/GBP followed the road paved by EUR/USD. The pair ventured into the high 0.83(8) area yesterday and doesn’t go very far away this morning even as UK January CPI came in slightly higher than expected. Headline inflation accelerated to 5.5%, core inflation sped up to 4.4%.
Having had Chinese (see below) and UK price data, focus turns to US retail sales and the Fed meeting minutes. The former are expected at a solid 2% for the headline series in January and 1.2% for the most narrow gauge. Impact on markets may be limited ahead of the minutes though.
Fed chair Powell was very clear at the last policy gathering about starting policy normalization and doing it at a faster pace than previously. Markets will look for clues on a potential 50 bps kickstart in March. Hints about the pace of the balance sheet roll-off would be welcomed since the Fed remained pretty vague on that last time. We’re keen to see whether it will suffice to keep core bond/US yields on track. Some short-term range trading could be in store with the occasional geopolitical headlines still causing some volatility. We look out for the US 10y yield to hold the 2% today and for the remainder of the week. Provided that sentiment doesn’t derail, EUR/USD may continue recovering. 1.1386 is a first resistance.
News Headlines
Prices pressures in China continued to ease in January. Chinese PPI eased from 10.3% to 9.1%, faster than analysists had expected and the slowest pace since July. According to comments from the NBS, prices of coal, steel and other industrial products eased. At least now, higher producer prices hardly translate in higher CPI consumer prices. CPI inflation printed at 0.4% M/M to be up 0.9% Y/Y (down from 1.5% Y/Y in December). Non-food prices rose 2.0% Y/Y. Food prices even declined 3.8% Y/Y, mainly due to a sharp drop in pork prices. Soft inflationary pressures give the PBOC the room to maintain a supportive monetary policy stance with room for further (targeted) easing. This was confirmed by PBOC governor YI Gang even as he expects the economy to return to potential growth this year. The expected monetary policy support for now doesn’t hurt the yuan. The currency maintains this week’s rebound trading near USD/CNY 6.3390.
January labour market data in South Korean printed really strong. The unemployment rate declined faster than expected from 3.8% to 3.6%. The economy added 1 135 000 jobs on a non-seasonally adjusted basis compared to the same period last year, the fastest growth since March 2000. Growth was also supported by strong fiscal support. Jobs were mostly added in healthcare and social services and services like accommodation and restaurants. However, other sectors (wholesale and retail) continue to suffer from measures to contain rising Covid-19 cases.
Peace and Inflation
Investors loved the sound of peace and the risk appetite came back yesterday as Russians started pulling a part of their troops back from the Ukrainian border. Although, news of a cyber-attack on some Ukrainian banks and some government websites including the defense ministry’s website raised a couple of eyebrows again, and turned all eyes to the Russians. But there is no report suggesting that Russia is behind the cyber-attack just yet.
Oil fell as much as 4% yesterday on de-escalation news. The barrel of US crude fell below the $91 mark and rebounded back above the $92. This was the most expected kneejerk reaction to the latest news, yet it’s important to keep in mind that oil prices have been surging due to a lack of supply and decreasing global reserves. The Russian crisis certainly added an extra pressure on an already-bullish setting, but explained only a part of the gains. Therefore, the end of the Ukrainian worries won’t be the end of the rally in oil. OPEC+ countries are still struggling to meet their current production targets and the post-pandemic activity is increasingly energy hungry. Yesterday’s API data showed another weekly decline in the US crude inventories. The stockpiles decreased by about a million barrels last week, lower than nearly 1.8 million barrel decline expected by analysts. Today’s more official EIA data is expected to confirm a 2.2-million-barrel decline. A larger decline could revive the bulls, while a softer figure will certainly not do much to the actual positive trend. Oil bulls have still their eyes set at the $100 per barrel level, and are poised to take advantage of any price pullbacks to strengthen their long positions.
Gold, on the other hand, dropped 35 dollars yesterday, as the safe haven money poured into the risk assets. We could expect a further easing and a return to and below the $1800 if the risk appetite is fully restored. The rising US yields are not necessarily supportive of a stronger gold, and the yields are set to rise higher, especially with the US inflation that proves to be much more resilient than what analysts think.
Released yesterday, the US producer inflation data came in as a bad surprise, yet again. The factory-gate prices in the US rose 9.7% in January, significantly higher than 9.1% penciled in by analysts. The market reaction remained subdued as investors only saw the Ukraine de-escalation news. Nasdaq rallied 2.50%, while the S&P500 gained a bit more than 1.50%. Let’s see if today’s FOMC minutes will kill that joy.
FOMC minutes
The latest Fed decision was more hawkish than expected, and the minutes could smooth out a part of the extra hawkishness.
Even though the market was pricing in an almost certain 50-bp hike from the Fed in the March meeting after the US CPI data, the probability of a 50-bp hike fell to near 60%.
So the game is not over yet for the Mach meeting: a more dovish than expected tone from the FOMC minutes could get the market re-focus on a 25-bp hike.
Rushing to the exit won’t necessarily do good to the economy nor to the financial markets, especially knowing that the rising rates won’t bring the energy prices lower, or ease the chip and other supply shortages that are mostly responsible for the rising global inflation.
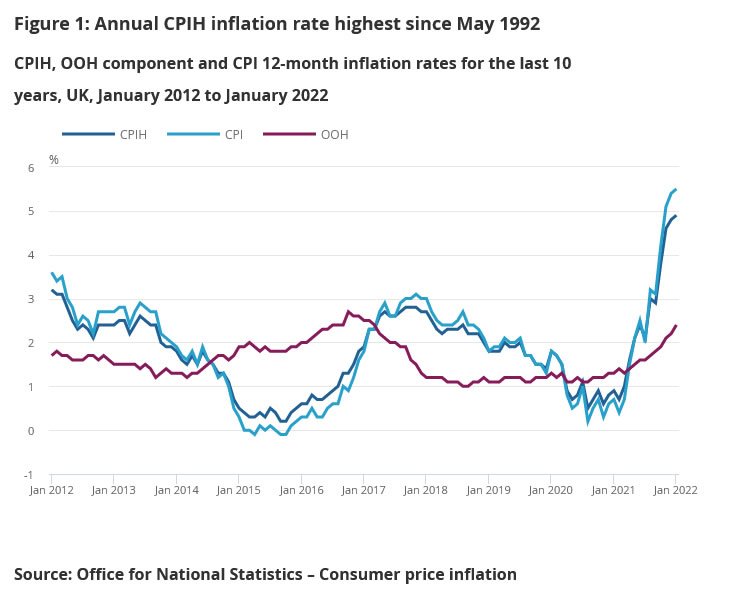
UK CPI rose to 5.5% yoy in Jan, highest since 1992
UK CPI rose further from 5.4% yoy to 5.5% yoy in January, matched expectations. That's the highest level in the National Statistics series since January 1997. It was last higher in the historical modelled series in March 1992, which as at 7.1%. CPI core rose from 4.2% yoy to 4.3% yoy, above expectation of 4.3% yoy.
Also released, PPI input came in at 0.9% mom, 13.6% yoy, versus expectation of 0.7% mom, 14.2% yoy. PPI output was at 1.2% mom, 9.9% yoy, versus expectation of 0.6% mom, 9.4% yoy. PPI output core was at 1.1% mom, 0.7% yoy, versus expectation of 0.7% mom, 9.0% yoy.
GBP/JPY Daily Outlook
Daily Pivots: (S1) 156.09; (P) 156.45; (R1) 156.94; More...
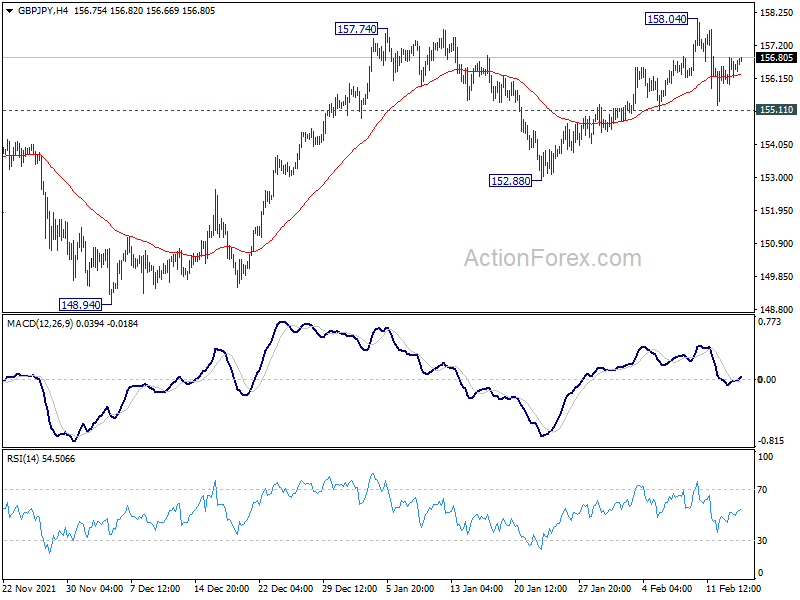
Intraday bias in GBP/JPY remains neutral and outlook is unchanged. On the downside, break of 155.11 resistance should confirm rejection by 158.19 resistance. Intraday bias will be turned to the downside for 152.88 support, to extend the corrective pattern from 158.19 with another falling leg. However, on the upside, sustained break of 158.19 will resume larger up trend.
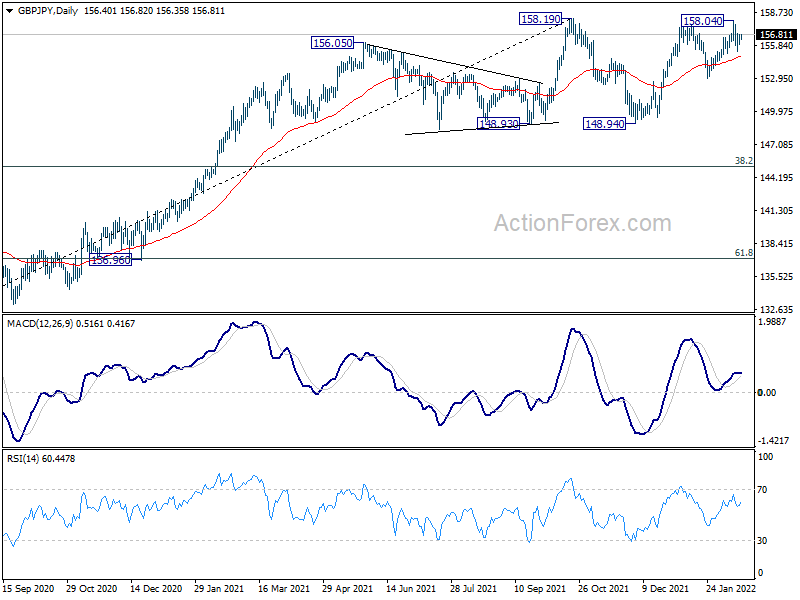
In the bigger picture, price actions from 158.19 are seen as developing into a consolidation pattern to up trend from 123.94 (2020 low). Downside should be contained by 123.94 to 158.19 at 145.10 to bring rebound. Firm break of 158.19 will resume the up trend to long term fibonacci level at 167.93. However, sustained break of 145.10 will raise the chance of trend reversal and target 61.8% retracement at 137.02.
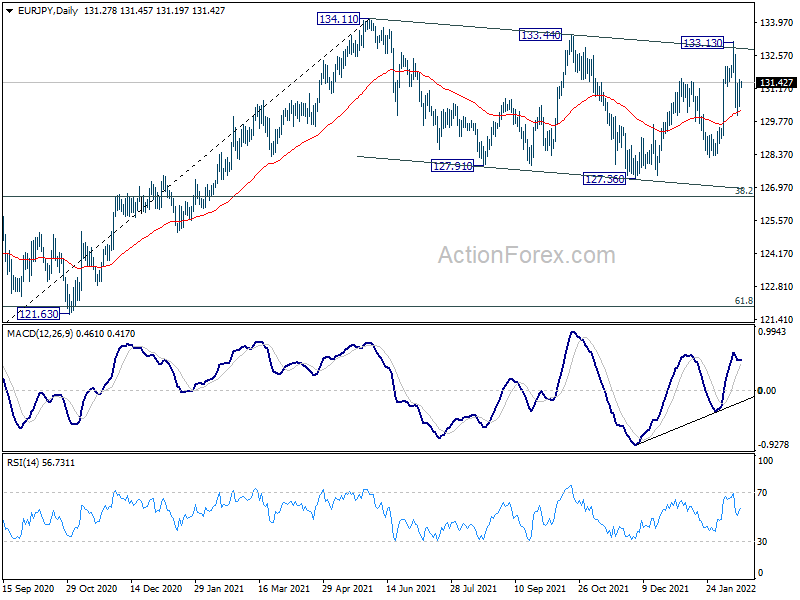
EUR/JPY Daily Outlook
Daily Pivots: (S1) 130.66; (P) 131.10; (R1) 131.76; More....
Intraday bias in EUR/JPY is turned neutral with current recovery. On the downside, break of 130.03 will resume the decline from 133.13, as another falling leg of the corrective pattern from 134.11. Deeper fall would then be seen to 128.23 support first. Break will target 127.36 support and below. On the upside break of 133.13 will bring retest of 134.11 high.
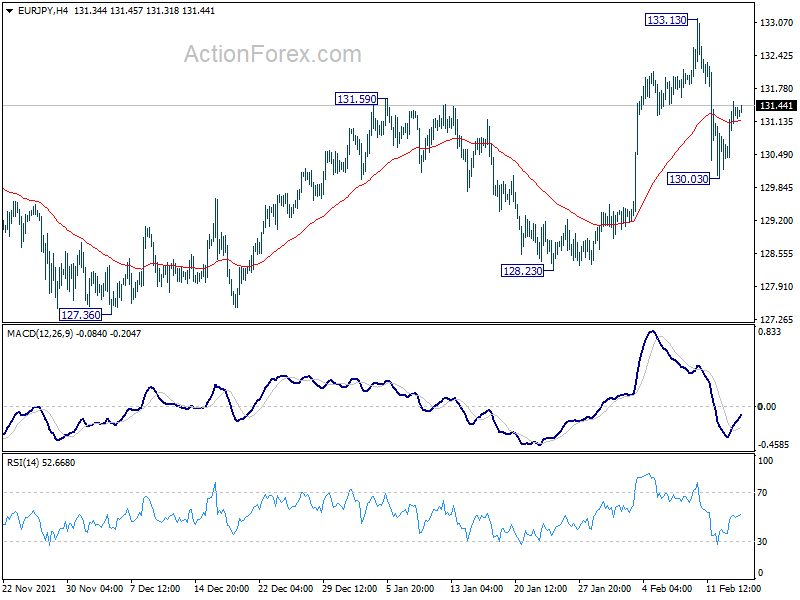
In the bigger picture, price actions from 134.11 are currently seen as a consolidation pattern only. As long as 38.2% retracement of 114.42 (2020 low) to 134.11 at 126.58 holds, up trend from 114.42 is still in favor to continue. Break of 134.11 will target long term resistance at 137.49 (2018 high). However, sustained break of 126.58 will raise the chance of bearish reversal. In this case, deeper decline would be seen to 61.8% retracement at 121.94, and possibly below.