Sample Category Title
Sunset Market Commentary
Markets
The European Commission’s Winter 2022 economic forecasts were today’s appetizer in the run-up to January US inflation numbers. The EC updated the 2021 growth figure to 5.3%, triggering mechanical revisions to the 2022 (4% from 4.3%) and a lesser extent 2023 (2.7% from 2.4%) predictions compared to the Autumn 2021 release. The balance of risks to the growth outlook is broadly even. The EC shifted its inflation path significantly higher: 2.6%-3.5%-1.7% for the 2021-2023 period, coming from 2.4%-2.2%-1.4%. The inflation projections are subject to upside risks if cost pressures are passed on from producer to consumer prices to a larger extent, increasing the likelihood of strong second-round effects. Risks to the growth and inflation outlook are aggravated by geopolitical tensions in Eastern Europe. Inflation forecasts probably remain on the lower side of the spectrum. The ECB in December projected 3.2% for 2022 and 1.8% for 2023 and last week labelled these as outdated. An internal debate is also ongoing about the accuracy of the inflation model given last year’s continuous underestimation of both inflation peak and period over which inflation would exceed the ECB’s 2% inflation target.
US inflation again beat forecasts, rising by 0.6% M/M for both headline and core inflation to 7.5% Y/Y and 6% Y/Y respectively. The price rise was broad-based with heavy-weight categories like housing (5.7% Y/Y), food & beverages (6.7% Y/Y) and transport (20.8% Y/Y) showing significant increases. The strong underlying momentum suggests that this isn’t the headline inflation peak yet (because of higher petrol prices in February). In spite of all downplaying efforts by Federal Reserve officials off late, the multi-decade high inflation print strengthens market conviction that the Fed’s rate lift-off will be a 50 bps one. Selling resumes in US Treasuries, bear flattening the curve. US yields add 10.7 bps (2-yr) to 3.1 bps (30-yr). The US 10-yr yield was a whisker away from piercing above the psychological 2% mark for the first time since July 2019. German Bunds followed US Treasuries lower though the curve steepened, adding up to 4 bps in the 5-yr to 10-yr bucket. The US dollar profits from the beneficial relative yield dynamics with EUR/USD sliding back below the 1.14-handle for the first time since the ECB pivot. USD-gains could have been bigger though. USD/JPY tests the cycle and multi-year high at 116.35. The trade-weighted dollar tries to regain the 96-handle. US stocks sell-off in lockstep with bonds (-1.5%).
News Headlines
The Swedish Riksbank (RB) left the policy rate unchanged at 0%. It didn’t signal any imminent recalibration of its accommodative policy stance. The RB wants to keep the holdings of its asset portfolio to remain approximately unchanged in 2022 and before decreasing them gradually. Three governors preferred a faster reduction of asset purchases. The Riksbank expects a first rate increase only in H2 2024. Swedish CPIF inflation printed at 4.1% in December but this is entirely explained by electricity and fuel prices. Inflation should drop to just over 1% end 2022 and return to 2% mid next year. Inflation excluding energy prices is holding close to 2%. The risk of too low inflation has decreased but it still remains. The Krona lost modest ground to currently trade in the EUR/SEK 10.47 area.
The ECB announced that it won’t extend the capital and leverage relief for banks which was put in place in 2020 and 2021 in order to help them to continue lending to households and business. In this respect the ECB confirmed ‘the initially envisaged timeline for a return to a normal supervision of banks capital adequacy and leverage’. In concreto, banks are again expected to operate above the Pilar 2 guidance from January 2023. Banks also will have to reinclude central bank exposure in the leverage ratio from April 01 2022. The ECB assessed that banks, even considering the uncertainty regarding the impact of the pandemic, have ample headroom above their capital requirements and above the leverage ratio requirement. End of September 2021 the aggregate Common Equity Tier 1 ratio of banks under direct ECB supervision stood at 15.47%. Their aggregate leverage ratio stood at 5.88%.
US: Inflation Hotter than Expected in January
Consumer prices were up 0.6% month-on-month (m/m) in January, matching December's pace, and slightly higher than markets were expecting. The year-on-year (y/y) pace of inflation ticked higher to 7.5%.
Food and energy prices both rose 0.9% m/m, and are up 7% and 27% y/y respectively. Within energy a 4.2% m/m increase in electricity costs was the biggest contributor. Food prices continued to rise at a solid clip, up 0.5% m/m, and are up 6.3% y/y.
Core inflation (ex. food and energy) was also hotter than expected, jumping up 0.6% m/m. As a result, the year-on-year rate of core inflation picked up to 6.0%, from 5.5% in December, and the fastest pace in nearly 40 years.
Shelter costs were still a key contributor to monthly inflation, but increased less than they did in December (+0.3% m/m versus +0.4% m/m). Used vehicle prices also continue to rise (+1.5% m/m), although the price for new vehicles was unchanged. Price pressures for medical care accelerated, rising 0.7% m/m. The increase in core inflation over the past year has been fairly broad-based, with virtually all components seeing price increases over the past 12 months.
Overall within core inflation, goods price increases continue to bring the heat, rising 1.0% m/m. Core services were also up a solid 0.4% m/m. Perhaps surprisingly given the Omicron variant, transportation services costs accelerated in January (+1.0% m/m).
Key Implications
Inflation surprised to the upside once again in January. As discussed in our recent report, higher rates will be required to bring demand and supply back into balance and lower the temperature on inflation. The Fed is set to start raising rates in a few short weeks. With inflation continuing to surprise to the upside, the pace of rate hikes is likely to be faster than expected a few months ago.
We expect the year-on-year pace of inflation to slow from its current high level, as supply chains ease and the composition of demand shifts away from goods. Still, it is likely to take some time and base year effects will remain unfavorable over the next few months. In the meantime, elevated price growth is crimping purchasing power and may already be contributing to greater consumer caution.
EUR/USD Mid-Day Outlook
Daily Pivots: (S1) 1.1402; (P) 1.1425; (R1) 1.1447; More...
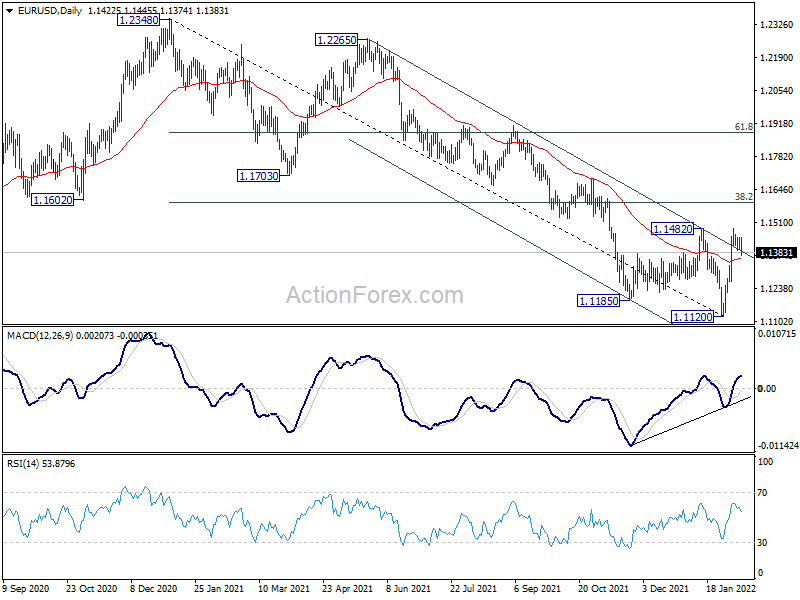
EUR/USD drops notably but stays well above 1.1265 support. Intraday bias remains neutral first and outlook is unchanged. A medium term bottom could be in place at 1.1120, on bullish convergence condition in daily MACD. Break of 1.1482 resistance will target 38.2% retracement of 1.2348 to 1.1120 at 1.1589 next. Sustained break there will argue that whole fall from 1.2348 has completed too and target 61.8% retracement at 1.1879. On the down, however, break of 1.1265 support will dampen this bullish view and bring retest of 1.1120 low instead.
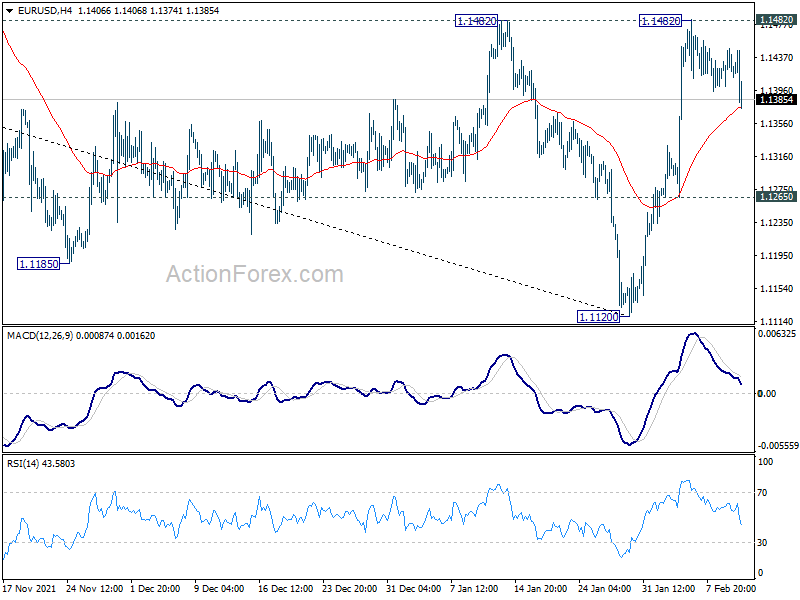
In the bigger picture, the decline from 1.2348 (2021 high) is seen as a leg inside the range pattern from 1.2555 (2018 high). Sustained trading above 55 week EMA (now at 1.1613) will argue that it has completed and stronger rise would be seen back towards top of the range between 1.2348 and 1.2555. However, firm break of 1.0635 (2020 low) will raise the chance of long term down trend resumption and target a retest on 1.0339 (2017 low) next.
GBP/USD Mid-Day Outlook
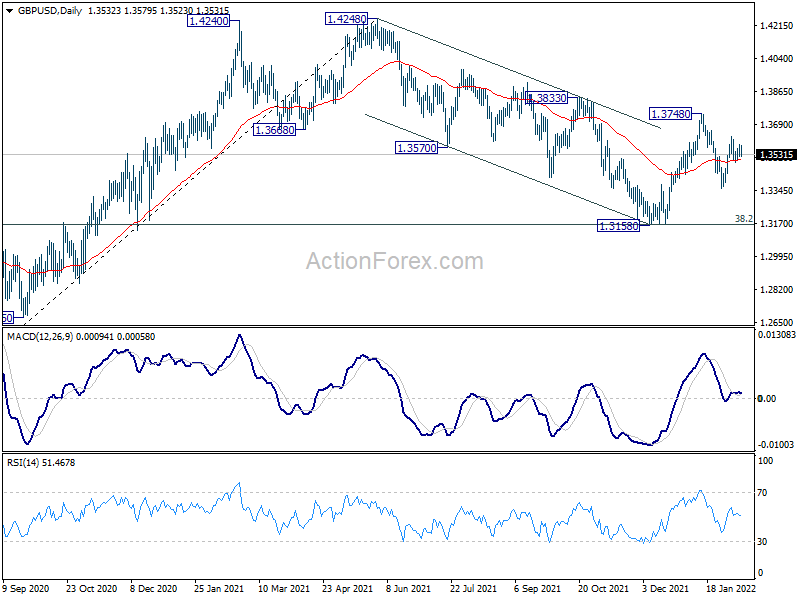
Daily Pivots: (S1) 1.3512; (P) 1.3550; (R1) 1.3574; More...
GBP/USD is still bounded in tight range below 1.3627 and intraday bias remains neutral first. On the upside, break of 1.3627 will resume the rebound to 1.3748 resistance. Firm break there will revive the bullish case that correction from 1.4248 has completed with three waves down to 1.3158. Further rally should then be seen to retest 1.4248 high. On the downside, however, break of 1.3356 will bring retest of 1.3158 low.
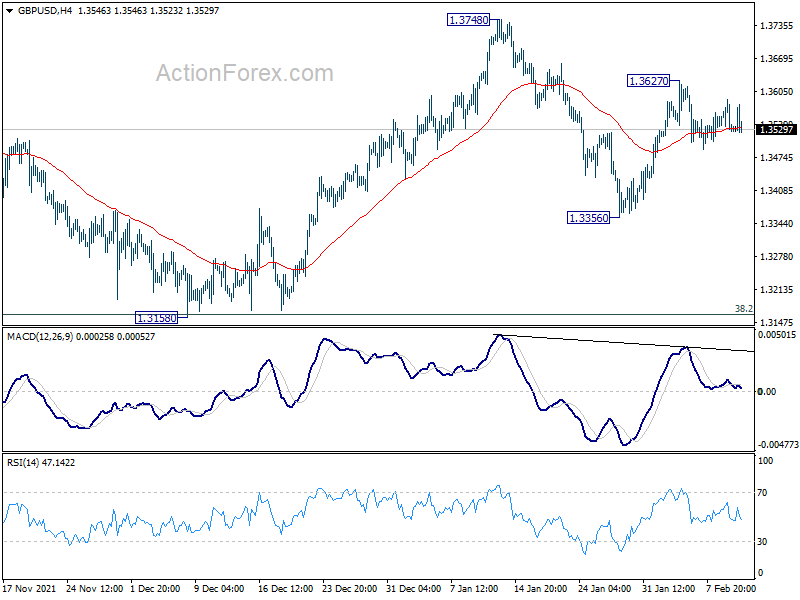
In the bigger picture, as long as 38.2% retracement of 1.1409 to 1.4248 at 1.3164 holds, up trend from 1.1409 (2020 low) is still in progress. On resumption, next target will be 38.2% retracement of 2.1161 to 1.1409 at 1.5134. Nevertheless sustained break of 1.3164 will argue that whole rise from 1.1409 has completed and bring deeper fall to 61.8% retracement at 1.2493.
USD/CHF Mid-Day Outlook
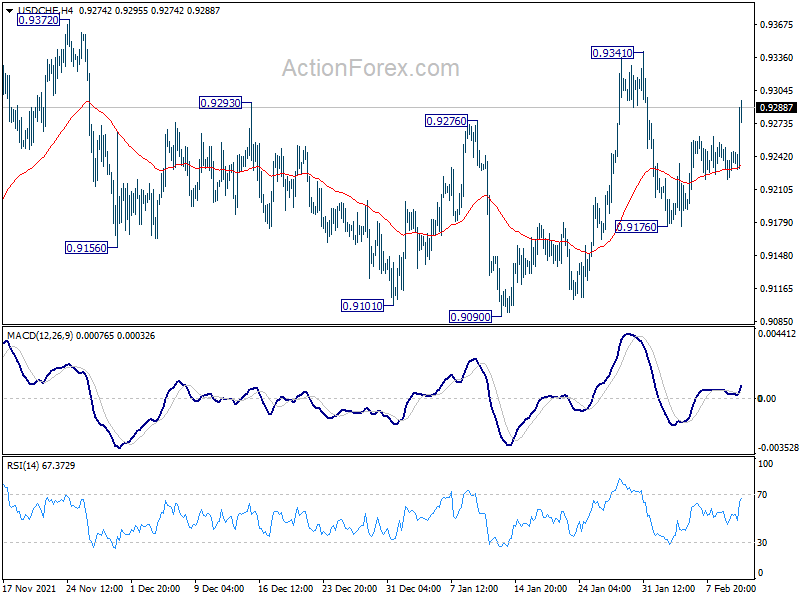
Daily Pivots: (S1) 0.9224; (P) 0.9240; (R1) 0.9257; More....
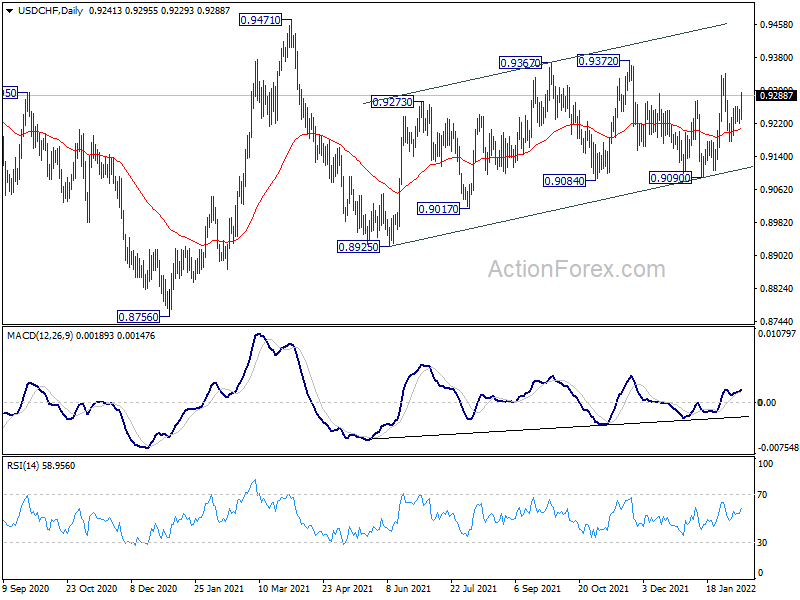
USD/CHF rebounds strongly today but stays in established range. Intraday bias remains neutral first. Further rise will remain mildly in favor as long as 0.9090 support holds. break of 0.9372 will resume the choppy rally from 0.8925 to 0.9471 high. However, break of 0.9090 will turn bias back to the downside for 0.8925 support instead.
In the bigger picture, medium term outlook will be neutral at best as long as 0.9471 resistance holds. Larger down trend could still extend through 0.8756 (2021 low). However, firm break of 0.9471 will argue that the trend has already reversed and rebound the rally from 0.8756 with another impulsive move.
US Inflation Much Hotter
Analysts have been ramping up their inflation expectations and not even one of them in Bloomberg economists’ survey had forecast a headline CPI print of below 7% ahead of the much-anticipated release today. You can understand why: expectations were beaten in 8 out of the past 10 occasions. As far as the latest inflation report for the month of January is concerned, well, they were right not to expect a sharp drop in price pressures. CPI has once again surprised to the upside, with prices accelerating for the fifth consecutive month.
CPI jumps to 7.5% annual pace
- Headline CPI printed +0.6% month-over-month or 7.5% year-over-year, compared with expectations of 0.5% and 7.3%, respectively. In December, CPI had risen 0.5% on the month and 7.0% on a year-over-year basis.
- Core CPI came in at +0.6% m/m and 6.0% y/y, versus expectations of 0.5% and 5.9%. In December, core CPI had risen 0.6% m/m and 5.5% y/y.
Markets react
The initial reaction of the market has been a swift one. As you would have expected, the dollar and bond yields rose, causing gold and Nasdaq futures to drop
What does it all mean for monetary policy?
The latest inflation figures come after prices consistently surprised to the upside throughout 2021. Alarm bells were raised when inflation climbed to 7.0% in December, raising speculation that the Fed would hasten its rate hiking cycle, with the Fed Chair Jerome Powell subsequently indicating that all FOMC meetings were live and refusing to rule out a 0.5% hike in March. Bets over a lager rate hike for the March meeting rose following an unexpectedly strong January non-farm payrolls report, which, along with the jump in wages, easily beat expectations.
Prior to today’s inflation report, bets had risen to one-in-three chance of a 50-basis-point hike, which would be the first since 2000. Well, you can safely assume that those bets have been ramped up even further now.
For what it is worth, I don’t think we will see the Fed hiking by half a percentage point, but today’s 7.5% CPI print does put a lot of pressure on the Fed to walk the walk in terms of tightening, having done the talking. I think 5 rate increases for 2022 is a real possibility now.
Small caps could fall further out of favour
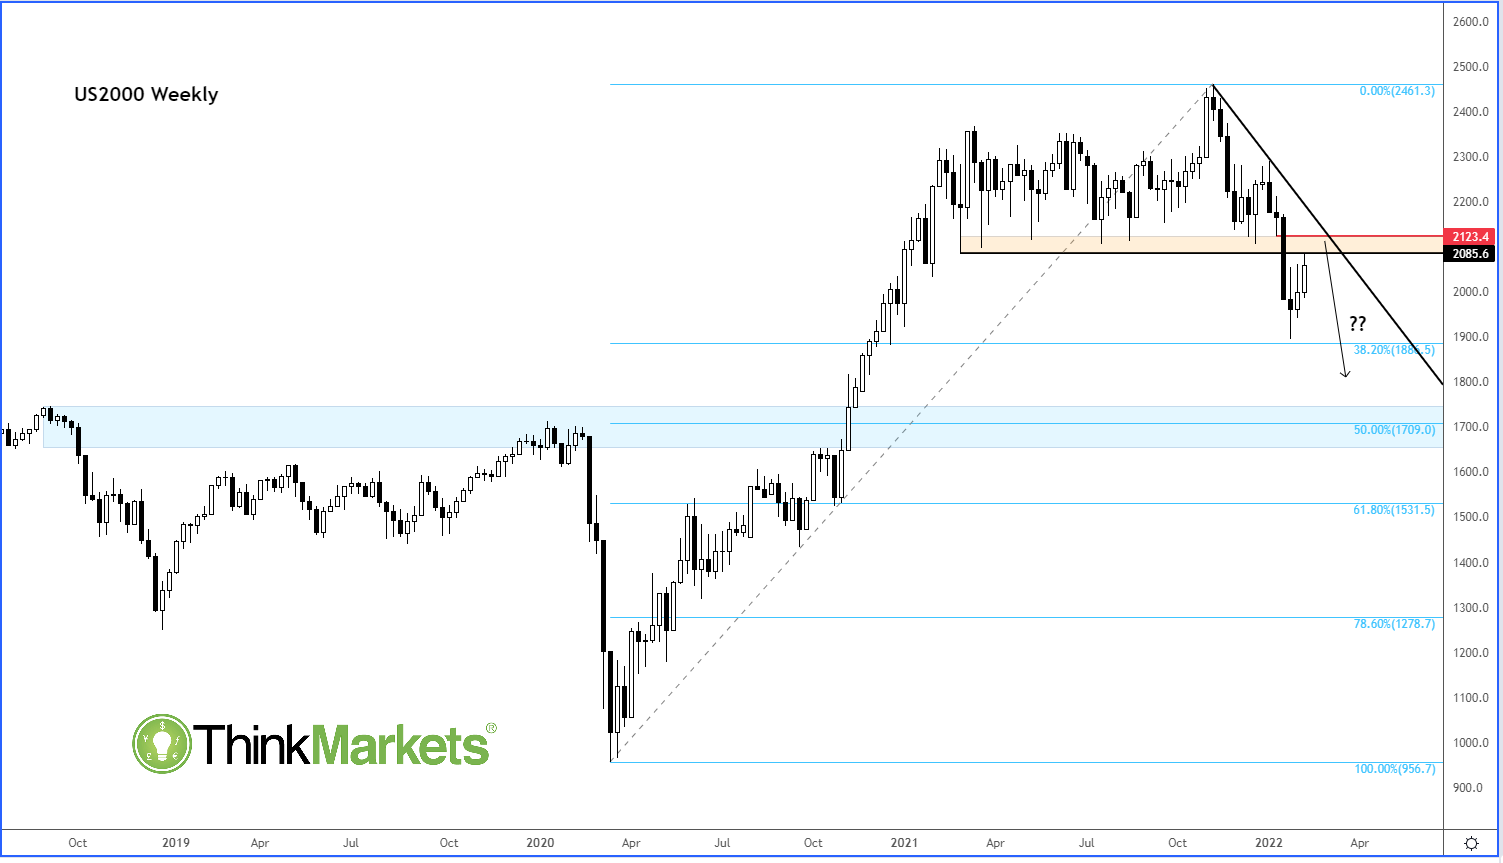
Small caps have significantly underperformed large caps, mainly due to the impact of a sudden rise in bond yields. Investors in small caps have become concerned that funding will cost more for smaller companies, which tend to rely more on borrowing than on issuing new equity to raise capital. In other words, they rely more on debt to fund operations. As debt costs increase, this is bad news for stocks in general, but more so far smaller companies.
Russell testing major resistance
Source: ThinkMarkets and TradingView.com
The small-cap Russell 2000 index is re-testing the underside of the broken support zone in the 2085-2123 region, as per the chart below. If resistance holds here, watch out for fresh weakness for this index, and potentially the Nasdaq 100.
USD/JPY Mid-Day Outlook
Daily Pivots: (S1) 115.35; (P) 115.52; (R1) 115.71; More...
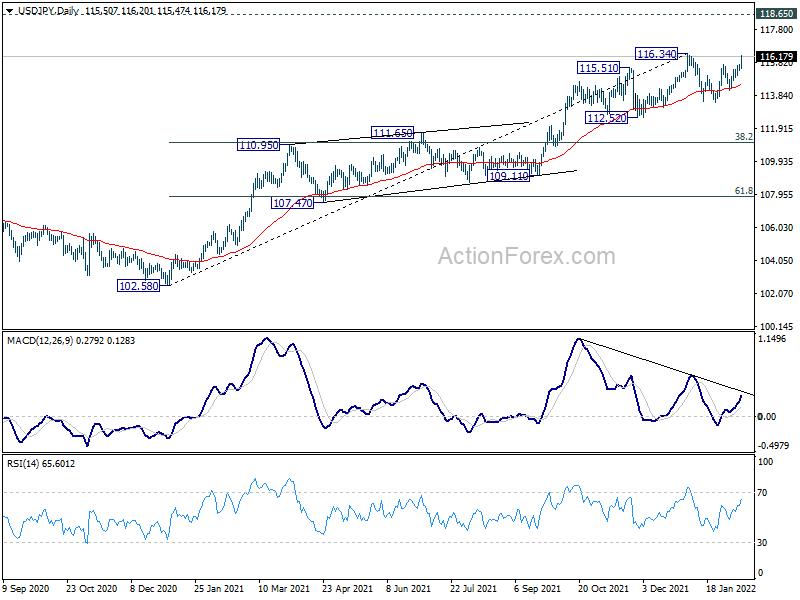
USD/JPY's rebound from 113.46 resumed by breaking 115.68 resistance. Intraday bias is back on the for 116.34 high. Firm break there will resume larger up trend from 102.58. Next target is 118.65 long term resistance. On the downside, though, break of 115.31 minor support will extend the corrective pattern from 116.34 with another falling leg, and turn bias back to the downside for 114.14 support and possibly below.
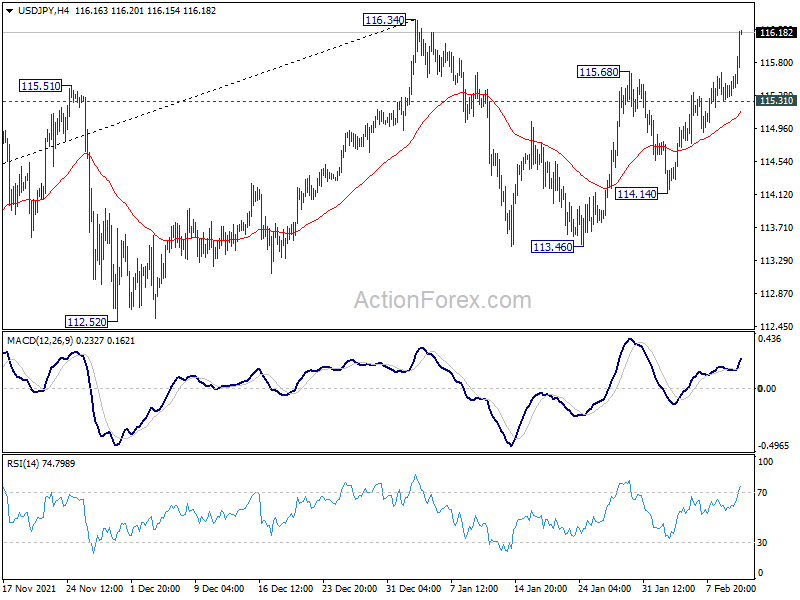
In the bigger picture, no change in the view that rise from 102.58 is the third leg of the up trend from 101.18 (2020 low). Such rally should target a test on 118.65 (2016 high). Sustained break there will pave the way to 120.85 (2015 high) and raise the chance of long term up trend resumption. This will remain the favored case as long as 55 week EMA (now at 111.21) holds.
Dollar and Yields Up, Stocks Down after Strong US CPI
Dollar rebounds broadly in early US session after stronger than expected CPI data. Treasury yields also surged with 10-year yield marching higher. 2% level for 10-year yield is getting closer. Stocks on the other hand, take some beating on concerns of a more aggressive Fed. For now, selloff is concentrating on Yen and Swiss Franc. But Europeans and commodity currencies are also weak.
Technically, a major focus is on whether USD/JPY would break through 116.34 high to resume the medium term up trend. At the same time, attention will also be on whether EUR/JPY and GBP/JPY are heading to 134.11 and 158.19 resistance levels respectively. Break of all these levels could add extra fuel to the rally in USD/JPY.
In Europe, at the time of writing, FTSE is up 0.06%. DAX is flat. CAC is down -0.45%. Germany 10-year yield is up 0.038 at 0.249. Earlier in Asia, Nikkei rose 0.42%. Hong Kong HSI rose 0.38%. China Shanghai SSE rose 0.17%. Singapore Strait Times rose 0.23%. Japan 10-year JGB yield closed up 0.0215 at 0.230.
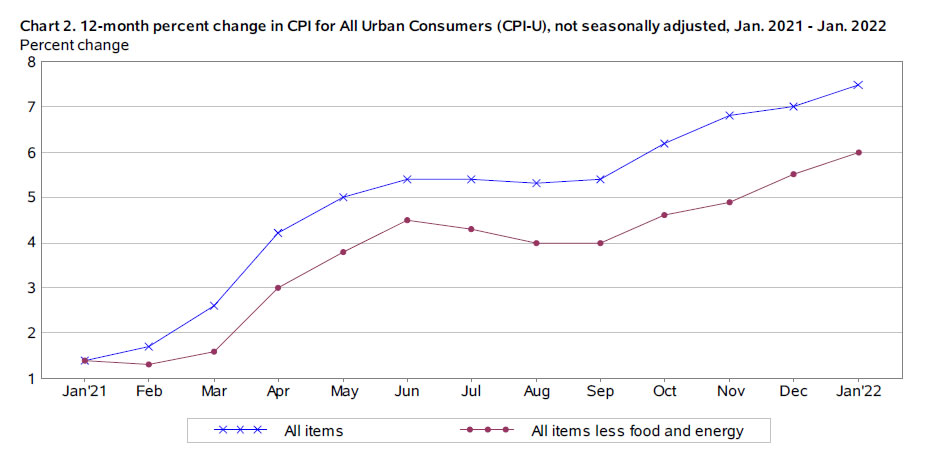
US CPI rose to 7.5% yoy, core CPI to 6.0% yoy, highest since 1982
Over the month, US CPI rose 0.6% mom in January, above expectation of 0.4% mom. CPI core rose 0.6% mom, above expectation of 0.5% mom.
Over the 12-month period, CPI accelerated from 7.0% yoy to 7.5% yoy, above expectation of 7.3% yoy. That's the highest level since February 1982. CPI core jumped from 5.5% yoy to 6.0% yoy, above expectation of 5.9% yoy. That's the highest level since August 1982.
Energy index rose 27.0% yoy while food index rose 7.0% yoy.
US initial jobless claims dropped -15k to 223k
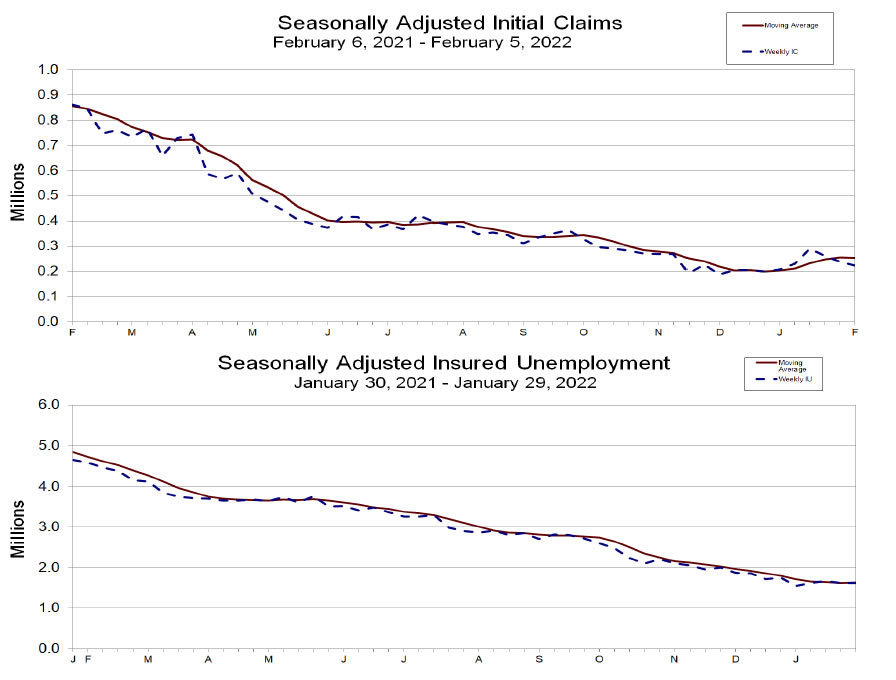
US initial jobless claims dropped -15k to 223k in the week ending February 5, better than expectation of 230k. Four-week moving average of initial claims dropped -2k to 253k.
Continuing claims was unchanged at 1621k in the week ending January 29. Four-week moving average of continuing claims rose 16.5k to 1645k.
ECB Lane: Hold-steady approach reinforced if bottlenecks are primarily external in nature
ECB Chief Economist Philip Lane said in a blog post, "in terms of inflation dynamics, the relative price dislocations associated with bottlenecks are intrinsically short-term rather than permanent in nature." Further, "initial increases in relative prices of categories that experienced high demand and/or low supply can be expected to level off or even reverse."
Additionally, " it should be acknowledged that bottlenecks are not the only factor influencing the overall inflation environment, with a comprehensive monetary policy assessment taking into account a wide range of factors."
"Since bottlenecks will eventually be resolved, price pressures should abate and inflation return to its trend without a need for a significant adjustment in monetary policy."
"The logic underpinning a hold-steady approach to monetary policy is reinforced if the bottlenecks are primarily external in nature, caused by global disruptions in supply or a surge in global demand".
ECB de Guindos: Inflation to decline in the course of this year
ECB Vice President Luis de Guindos said in a speech, "inflation is likely to remain elevated for longer than previously expected, but to decline in the course of this year."
"That is the central case, but there are upside risks to that outlook," he added. "Inflation could turn out to be higher if price pressures feed through into higher-than-anticipated wage rises, or if the economy returns to full capacity more quickly than foreseen.
"Some other central banks have either already raised rates or indicated that they will soon do so," he said. "In making comparisons, it's worth remembering that the euro area is at a different stage of the economic cycle, just as it was when the pandemic started. So it's natural that central banks around the globe won't necessarily start raising rates at the same time."
EU downgrades 2022 Eurozone GDP forecasts, upgrades inflation
In the Winter 2022 interim forecasts, EU downgrades 2022 Eurozone GDP growth forecasts from 4.3% to 4.0%. Nevertheless, 2023 GDP growth forecast was upgraded from 2.4% to 2.7%. Eurozone 2022 HICP inflation forecast was raised from 2.2% to 3.5%. 2023 HICP inflation forecast was also upgraded from 1.4% to 1.7%.
Valdis Dombrovskis, Executive Vice-President for an Economy that Works for People said: "The EU economy has now regained all the ground it lost during the height of the crisis, thanks to successful vaccination campaigns and coordinated economic policy support. Unemployment has reached a record low. These are major achievements. As the pandemic is still ongoing, our immediate challenge is to keep the recovery well on track. The significant rise in inflation and energy prices, along with supply chain and labour market bottlenecks, are holding back growth. Looking ahead, however, we expect to switch back into high gear later this year as some of these bottlenecks ease. The EU's fundamentals remain strong and will be boosted further as countries start to put their Recovery and Resilience Plans into full effect."
Paolo Gentiloni, Commissioner for Economy said: "Multiple headwinds have chilled Europe's economy this winter: the swift spread of Omicron, a further rise in inflation driven by soaring energy prices and persistent supply-chain disruptions. With these headwinds expected to fade progressively, we project growth to pick up speed again already this spring. Price pressures are likely to remain strong until the summer, after which inflation is projected to decline as growth in energy prices moderates and supply bottlenecks ease. However, uncertainty and risks remain high."
BoJ Kuroda: No chance to debate stimulus exit in my term
BoJ Governor Haruhiko Kuroda was quoted by Mainichi newspaper saying that "as long as our current price projection lives, there's no chance we will debate" stimulus exit before his term ends in April 2023. "We're not engaging in any debate of an exit. Doing so is inappropriate given Japan's price developments," he added.
"Japan's economic recovery is slower than that of the United States and European countries, and (consumer) inflation is just 0.5%," Kuroda said. "As such, there's no need to scale back monetary stimulus or shift toward policy tightening. Doing so is unlikely,"
The change of consumer inflation accelerating sharply was "very small" and "the key would be wage growth".
Japan CGPI rose 8.6% yoy in Jan, index at highest since 1985
Japan corporate goods price index rose 8.6% yoy in January, slowed slightly from December's 8.7% yoy, but beat expectation of 8.2% yoy. At 109.5, the index was at the highest level since September 1985.
Export prices jumped 12.5% yoy on Yen basis, 6.6% yoy on contract currency basis. Import prices surged a massive 37.5% yoy on Yen basis, and 28.0% yoy on contract currency basis.
However, consumer prices remained sluggish, with national CPI core at 0.5% yoy in December, which some economists expected to slow to 0.3% yoy in January.
BoJ officials, including Governor Haruhiko Kuroda, have indicated that it would be hard to see consumer inflation to sustainably reach 2% target without wages rise.
USD/JPY Mid-Day Outlook
Daily Pivots: (S1) 115.35; (P) 115.52; (R1) 115.71; More...
USD/JPY's rebound from 113.46 resumed by breaking 115.68 resistance. Intraday bias is back on the for 116.34 high. Firm break there will resume larger up trend from 102.58. Next target is 118.65 long term resistance. On the downside, though, break of 115.31 minor support will extend the corrective pattern from 116.34 with another falling leg, and turn bias back to the downside for 114.14 support and possibly below.
In the bigger picture, no change in the view that rise from 102.58 is the third leg of the up trend from 101.18 (2020 low). Such rally should target a test on 118.65 (2016 high). Sustained break there will pave the way to 120.85 (2015 high) and raise the chance of long term up trend resumption. This will remain the favored case as long as 55 week EMA (now at 111.21) holds.
Economic Indicators Update
| GMT | Ccy | Events | Actual | Forecast | Previous | Revised |
|---|---|---|---|---|---|---|
| 23:50 | JPY | PPI Y/Y Jan | 8.60% | 8.20% | 8.50% | 8.70% |
| 00:00 | AUD | Consumer Inflation Expectations Feb | 4.60% | 4.40% | ||
| 00:01 | GBP | RICS Housing Price Balance Jan | 74% | 72% | 69% | |
| 13:30 | USD | Initial Jobless Claims (Feb 4) | 223K | 230K | 238K | 239K |
| 13:30 | USD | CPI M/M Jan | 0.60% | 0.40% | 0.50% | 0.60% |
| 13:30 | USD | CPI Y/Y Jan | 7.50% | 7.30% | 7.00% | |
| 13:30 | USD | CPI Core M/M Jan | 0.60% | 0.50% | 0.60% | |
| 13:30 | USD | CPI Core Y/Y Jan | 6.00% | 5.90% | 5.50% |
US CPI rose to 7.5% yoy, core CPI to 6.0% yoy, highest since 1982
Over the month, US CPI rose 0.6% mom in January, above expectation of 0.4% mom. CPI core rose 0.6% mom, above expectation of 0.5% mom.
Over the 12-month period, CPI accelerated from 7.0% yoy to 7.5% yoy, above expectation of 7.3% yoy. That's the highest level since February 1982. CPI core jumped from 5.5% yoy to 6.0% yoy, above expectation of 5.9% yoy. That's the highest level since August 1982.
Energy index rose 27.0% yoy while food index rose 7.0% yoy.
US initial jobless claims dropped -15k to 223k
US initial jobless claims dropped -15k to 223k in the week ending February 5, better than expectation of 230k. Four-week moving average of initial claims dropped -2k to 253k.
Continuing claims was unchanged at 1621k in the week ending January 29. Four-week moving average of continuing claims rose 16.5k to 1645k.