

Sample Category Title
Global Inflation Watch – Inflation Keeps Surprising to the Upside
Overview: A combo of renewed increases in commodity prices, very tight labour markets and high consumer inflation expectations continues to keep upward pressure on inflation intact. On a positive note, electricity prices in Europe have come down. Freight rates are still at high levels and delivery times very long. We look for US core inflation to rise further and peak at 6.6% in March 2022 before easing to around 4.6% by end-2022. We expect euro core inflation to peak now and fall below 2% in Q4.
Inflation expectations: Market-based long-term inflation expectations still move sideways, but US household long-term inflation expectations are at a 10-year high. Euro household price expectations for next 12 months stayed elevated in December.
US: CPI inflation rose to 7.5% y/y in December and once again the increase was higher than anticipated, implying an even higher pressure on the Fed to tighten sooner and faster (markets are now pricing in six rate hikes from the Fed in 2022). Energy and food prices (and usual suspects like used car prices) are explaining a lot but price increases are broad-based. Around 50% of small businesses expect to hike output prices within three months and long-term consumer inflation expectations are now 3.1% y/y, which is indeed in the upper end of what the Fed can tolerate, in our view.
Euro: In contrast to expectations, HICP inflation rose to yet another all-time high of 5.1% in January, as soaring food prices and strengthening core inflation pressures more than made up for German VAT base effects falling out of the equation. 'Saved-up' price increases by companies likely also played a role at the turn of the year, leaving core inflation elevated at 2.3%. The continued inflation upside surprises were an important trigger for the communication shift from ECB at the February meeting and with inflation risks still seen on the upside, we now expect two 25bp hikes (read more in ECB Review: New call - ECB to hike in Dec22 and Mar23, 3 February).
China: Chinese PPI inflation dropped from 12.5% to 10.3%% in December. We look for a further moderation in coming months but recent increases in commodity prices will moderate the decline. CPI is running at 1.5% y/y, clearly below the 3% target.
USD/JPY Daily Outlook
Daily Pivots: (S1) 115.54; (P) 115.94; (R1) 116.40; More...
Intraday bias in USD/JPY remains on the upside with focus on 116.34 high. Firm break there will resume larger up trend from 102.58. Next target is 118.65 long term resistance. On the downside, though, break of 115.31 minor support will extend the corrective pattern from 116.34 with another falling leg, and turn bias back to the downside for 114.14 support and possibly below.
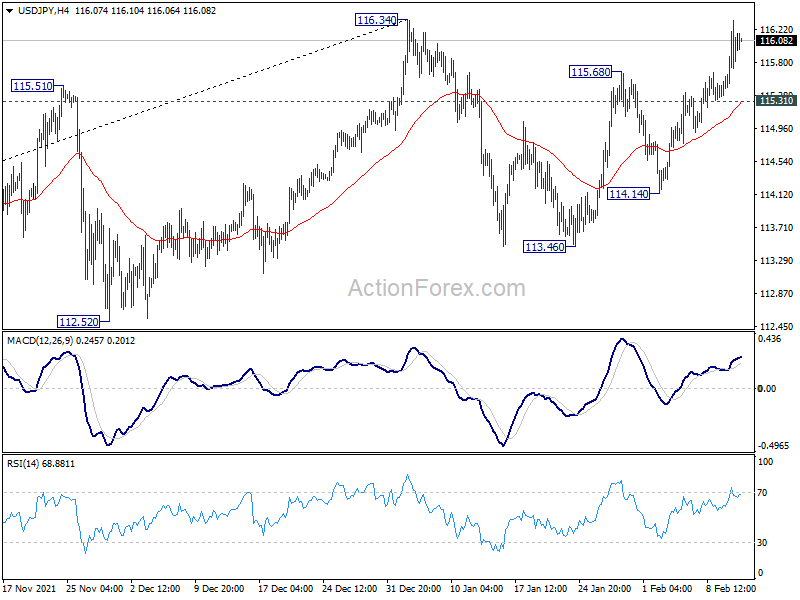
In the bigger picture, no change in the view that rise from 102.58 is the third leg of the up trend from 101.18 (2020 low). Such rally should target a test on 118.65 (2016 high). Sustained break there will pave the way to 120.85 (2015 high) and raise the chance of long term up trend resumption. This will remain the favored case as long as 55 week EMA (now at 111.21) holds.
Risk-off Sentiment Dominates as Expectation of 50bps Fed Hike Intensified
Much volatility was seen in the markets overnight, but as dusts settled, risk-off sentiment dominated. Fed funds futures are now pricing in 94.7% chance of a 50bps rate hike by Fed after the strong CPI reading, comparing to just 33.7% a week ago. Dollar is trading generally higher in Asia, followed by Yen. Aussie is the weakest followed by Kiwi and then Euro.
Technically, the outlook in many major pairs and crosses are mixed. EUR/USD struggled to break 1.1482 near term resistance firmly, but the retreat is held well above 1.1265 minor support. USD/JPY is still limited by 116.34 high despite yesterday's rally. USD/CHF is staying in established range of 0.9176/0.9341. USD/CAD is also stuck in range of 1.2648/2795. Currency traders are not committing to a direction yet.
In Asia, at the time of writing, Hong Kong HSI is down -0.60%. China Shanghai SSE is down -0.68%. Singapore Strait Times is down -0.14%. Japan is on holiday. Overnight, DOW dropped -1.47%. S&P 500 dropped -1.81%. NASDAQ dropped -2.10%. 10-year yield jumped sharpy by 0.102 to close at 2.031.
Fed Bullard wants to be nimble on rates, but Daly and Barkin may not
St Louis Fed President James Bullard said yesterday's inflation report "shows continued inflationary pressure in the US" and is "concerning for me and for the Fed." He added, "you have got the highest inflation in 40 years and I think we are going to have to be far more nimble and far more reactive to data."
"I'd like to see 100 basis points in the bag by July 1," Bullard added. "I was already more hawkish but I have pulled up dramatically what I think the committee should do."
However, San Francisco Fed President Mary Daly said a half-point rate hike "is not my preference. ""Markets have already priced in the withdrawal of accommodation, and that is them hearing what the Fed is clearly communicating."
Richmond Fed President Thomas Barkin said "I'm open to it conceptually", regarding a half point hike. "Do I think there's a screaming need to do it right now? I'd have to be convinced of that," he added.
ECB Lagarde: We don't want to choke off the recovery
ECB President Christine Lagarde said in an interview that raising interest rates "would not solve any of the current problems." Instead, "if we acted too hastily now, the recovery of our economies could be considerably weaker and jobs would be jeopardized."
"The U.S. economy is overheated, whereas our economy is far from being that," she said. "That's why we can -- and must -- proceed more cautiously. We don't want to choke off the recovery."
"Inflation may turn out to be higher than we projected in December," Lagarde said. "We will analyze that in March, and then take it from there." She also noted that inflation would exceed 2% target in medium term only if wages were to "significantly and persistently" break that level. "We are not seeing that at the moment at all," she said. "In most euro-area countries, including Germany, wage demands are very moderate."
RBA Lowe: We have scope to wait and see
RBA Governor Philip Lowe told a parliamentary committee that it is "too early" to conclude that inflation is "sustainably in the target range". He added, "in underlying terms, inflation has just reached the midpoint of the target band for the first time in over seven years".
The board is "prepared to be patient" and "we have scope to wait and see how the data develop and how some of the uncertainties are resolved. Countries with higher inflation rates have less scope here."
RBNZ survey: Another rate hike expected in Q1, 4-5 hikes in a year
In the latest Survey of Expectations of RBNZ, OCR expectations continued to rise in the short, medium and long term. OCR is expected to rise from current 0.75% to 1.05% by the end of Q1. Mean estimate for OCR for one year ahead was 2.11%, indicating four to five 25bps hikes. Mean two-year ahead OCR expectations were at 2.47%
One-year inflation expectations rose from 3.70% to 4.4%, highest since November 1900. Two-year ahead inflation expectations rose from 2.96% to 3.27%, highest since 1991. Five-year inflation expectations also rose slightly from 2.17% to 2.30%, highest since 20-17.
Looking ahead
UK GDP, production and trade balance will be released in European session. Germany will release CPI final while Swiss will also release CPI. Later in the Day, US will release U of Michigan consumer sentiment.
USD/JPY Daily Outlook
Daily Pivots: (S1) 115.54; (P) 115.94; (R1) 116.40; More...
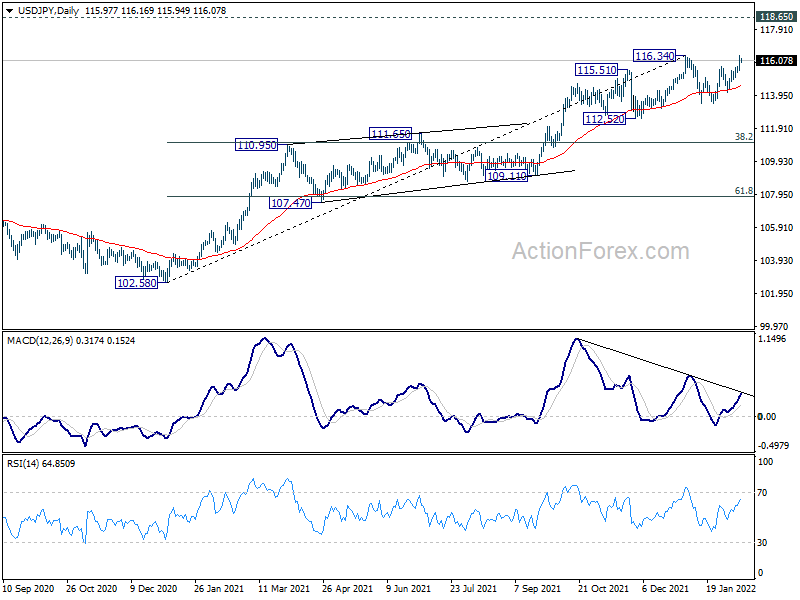
Intraday bias in USD/JPY remains on the upside with focus on 116.34 high. Firm break there will resume larger up trend from 102.58. Next target is 118.65 long term resistance. On the downside, though, break of 115.31 minor support will extend the corrective pattern from 116.34 with another falling leg, and turn bias back to the downside for 114.14 support and possibly below.
In the bigger picture, no change in the view that rise from 102.58 is the third leg of the up trend from 101.18 (2020 low). Such rally should target a test on 118.65 (2016 high). Sustained break there will pave the way to 120.85 (2015 high) and raise the chance of long term up trend resumption. This will remain the favored case as long as 55 week EMA (now at 111.21) holds.
Economic Indicators Update
| GMT | Ccy | Events | Actual | Forecast | Previous | Revised |
|---|---|---|---|---|---|---|
| 21:30 | NZD | Business NZ PMI Jan | 52.1 | 53.7 | 53.8 | |
| 02:00 | NZD | RBNZ Inflation Expectations Q1 | 3.27% | 2.96% | ||
| 07:00 | EUR | Germany CPI M/M Jan F | 0.40% | 0.40% | ||
| 07:00 | EUR | Germany CPI Y/Y Jan F | 4.90% | 4.90% | ||
| 07:00 | GBP | GDP M/M Dec | -0.50% | 0.90% | ||
| 07:00 | GBP | GDP Q/Q Q4 P | 1.10% | 1.10% | ||
| 07:00 | GBP | Index of Services 3M/3M Dec | 1.20% | 1.30% | ||
| 07:00 | GBP | Manufacturing Production M/M Dec | 0.20% | 1.10% | ||
| 07:00 | GBP | Manufacturing Production Y/Y Dec | 1.70% | 0.40% | ||
| 07:00 | GBP | Industrial Production M/M Dec | 0.10% | 1.00% | ||
| 07:00 | GBP | Industrial Production Y/Y Dec | 0.60% | 0.10% | ||
| 07:00 | GBP | Goods Trade Balance (GBP) Dec | -13.0B | -11.3B | ||
| 07:30 | CHF | CPI M/M Jan | 0.10% | -0.10% | ||
| 07:30 | CHF | CPI Y/Y Jan | 1.60% | 1.50% | ||
| 15:00 | USD | Michigan Consumer Sentiment Index Feb P | 67.6 | 67.2 |
RBNZ survey: Another rate hike expected in Q1, 4-5 hikes in a year
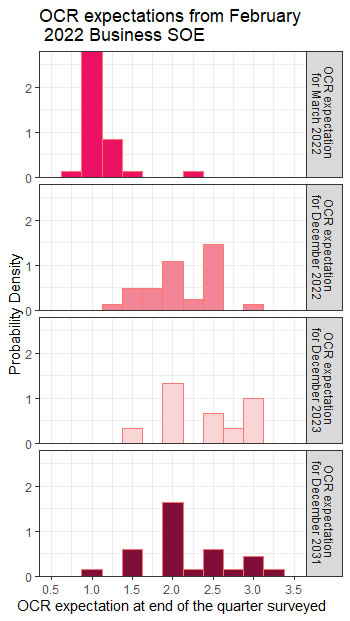
In the latest Survey of Expectations of RBNZ, OCR expectations continued to rise in the short, medium and long term. OCR is expected to rise from current 0.75% to 1.05% by the end of Q1. Mean estimate for OCR for one year ahead was 2.11%, indicating four to five 25bps hikes. Mean two-year ahead OCR expectations were at 2.47%
One-year inflation expectations rose from 3.70% to 4.4%, highest since November 1900. Two-year ahead inflation expectations rose from 2.96% to 3.27%, highest since 1991. Five-year inflation expectations also rose slightly from 2.17% to 2.30%, highest since 20-17.
RBA Lowe: We have scope to wait and see
RBA Governor Philip Lowe told a parliamentary committee that it is "too early" to conclude that inflation is "sustainably in the target range". He added, "in underlying terms, inflation has just reached the midpoint of the target band for the first time in over seven years".
The board is "prepared to be patient" and "we have scope to wait and see how the data develop and how some of the uncertainties are resolved. Countries with higher inflation rates have less scope here."
Fed Bullard wants to be nimble on rates, but Daly and Barkin may not
St Louis Fed President James Bullard said yesterday's inflation report "shows continued inflationary pressure in the US" and is "concerning for me and for the Fed." He added, "you have got the highest inflation in 40 years and I think we are going to have to be far more nimble and far more reactive to data."
"I'd like to see 100 basis points in the bag by July 1," Bullard added. "I was already more hawkish but I have pulled up dramatically what I think the committee should do."
However, San Francisco Fed President Mary Daly said a half-point rate hike "is not my preference. ""Markets have already priced in the withdrawal of accommodation, and that is them hearing what the Fed is clearly communicating."
Richmond Fed President Thomas Barkin said "I'm open to it conceptually", regarding a half point hike. "Do I think there's a screaming need to do it right now? I'd have to be convinced of that," he added.
ECB Lagarde: We don’t want to choke off the recovery
ECB President Christine Lagarde said in an interview that raising interest rates "would not solve any of the current problems." Instead, "if we acted too hastily now, the recovery of our economies could be considerably weaker and jobs would be jeopardized."
"The U.S. economy is overheated, whereas our economy is far from being that," she said. "That's why we can -- and must -- proceed more cautiously. We don't want to choke off the recovery."
"Inflation may turn out to be higher than we projected in December," Lagarde said. "We will analyze that in March, and then take it from there." She also noted that inflation would exceed 2% target in medium term only if wages were to "significantly and persistently" break that level. "We are not seeing that at the moment at all," she said. "In most euro-area countries, including Germany, wage demands are very moderate."
Cliff Notes: Financial Pressures Weigh on Sentiment
Key insights from the week that was.
The past week has had an intense focus on sentiment. In Australia, owing to the release of updates for both the consumer and business. And, in the US, as a result of another historic annual CPI print, testing the nerve of market participants and policy makers alike.
The NAB business survey lent clear support to the idea that the omicron wave Australia is experiencing will prove a transitory negative, with the abrupt deterioration in confidence seen in early January (when the December survey was in the field) reversed late in the month (when responses for the January survey were sought). In the latest update, 15pts of the 25pts lost in the December survey were recovered. While conditions deteriorated further in the January survey, from +8 to +3, this follows only a small decline in the December survey, from +11, so is arguably best characterised as full recognition of the shock experienced as omicron spread over December/ January. Consistent with the global backdrop, the January edition of the survey highlights that price pressures rather than activity are the major risk, the survey’s labour cost measure pointing to wage gains well in excess of the latest reading on the ABS Wage Price Index, while the quarterly pace of purchase costs accelerated from 2.8% in December to 3.4% in January.
Costs are also front of mind for Australian consumers. In February, the Westpac-MI consumer sentiment index reported a 1.3% fall to 100.8, a level at which the number of optimists equals pessimists. Success in containing omicron without a need for harsh restrictions proved favourable for views on the economy and the labour market. Expectations for the economy are currently materially above long-run average levels (circa +7% and +14% respectively for the 1 and 5-year views) while unemployment expectations are 21% below average.
Despite these very positive aggregate views, individual households remain under pressure, with family finances versus a year ago down 9pts in the month to a below average read, and perspectives for the year-ahead 1.5pts lower, also to a below-average read. After the release, Chief Economist Bill Evans detailed in depth the forces behind these developments, namely surging energy prices; higher interest rates; and Australian consumers’ recognition that they carry a significant debt burden. The second and third factors are also clearly at play in the housing market, with ‘time to buy a dwelling’ down 2.4% in February and 30% over the past year to be 28% below average despite house price expectations remaining strong, that index up 8.7% in February to be 25% above average.
For those interested in considering all the risks and opportunities ahead, following last Friday’s release of the February edition of Market Outlook, Tuesday saw the Westpac Economics team come together to discuss the key themes for Australia’s economy and global financial markets in our Market Outlook in conversation podcast. On the RBA, also note that Governor Lowe appeared before the House of Representatives Standing Committee on Economics today following last week’s release of the RBA’s latest Statement on Monetary Policy.
Offshore, US inflation and the consequences for FOMC policy remained the focus for market participants. Through the past week and a half (ahead of last night’s January CPI report), a number of FOMC members broadly affirmed the Committee’s 3-4 hikes in 2022 baseline from the December meeting. This group included regional Presidents George, Daly, Harker, Mester and Bostic. After the January CPI release, which was modestly above expectations at 0.6% in the month but primarily of concern as it left the annual rate at a new 40-year high of 7.5%, St Louis Fed President Bullard stated he had revised his preferred course to a 50bp hike at the March meeting to be followed by another 50bps of hikes by “July 1”.
We remain of the view that the best course of action for the FOMC is to raise rates at a modest pace, forecasting once per quarter from March 2022 to September 2023 to a peak of 1.875%. As discussed in the Market Outlook in conversation podcast, we hold this view for a number of reasons: (1) fed fund rate hikes are not the only form of tightening coming in 2022/23, with a material reduction in the Federal Reserve’s balance sheet also due; (2) for activity, it is term interest rates that matter not fed funds and these rates are already many multiples of fed funds’ 0.125%, with the 2-year yield at 1.58% and the 10-year yield circa 2.03%; and (3) real wages are currently going backwards at almost a 2%yr pace as at January. Coupled with the dramatic deterioration in housing affordability through the pandemic, (2) and (3) highlight that US household’s real purchasing power is currently under considerable pressure and likely will remain so. Surplus savings and wealth accrued during the pandemic can help to offset and keep consumption stronger that it would otherwise be, but only if confidence in the outlook remains intact. As household consumption is more than 70% of the US economy, as goes the consumer so goes the nation.
Before concluding, it is worth noting that, consistent with our expectations, it looks as though China’s economy is readying for a strong 2022. In our February Market Outlook, we noted that Q4 GDP pointed to momentum building into year end and outcomes coming in stronger than first estimated. This week we received further support for our 2022 thesis as the financing data came in well ahead of expectations. Roughing two-thirds of the near CNY6.2trn aggregate financing gain came from new loans by banks, with the rest funded through markets. The breadth of these gains argues in favour of broad-based strength in investment in 2022, with flow-on benefits to household income and consumption.
Technical Outlook and Review
DXY:
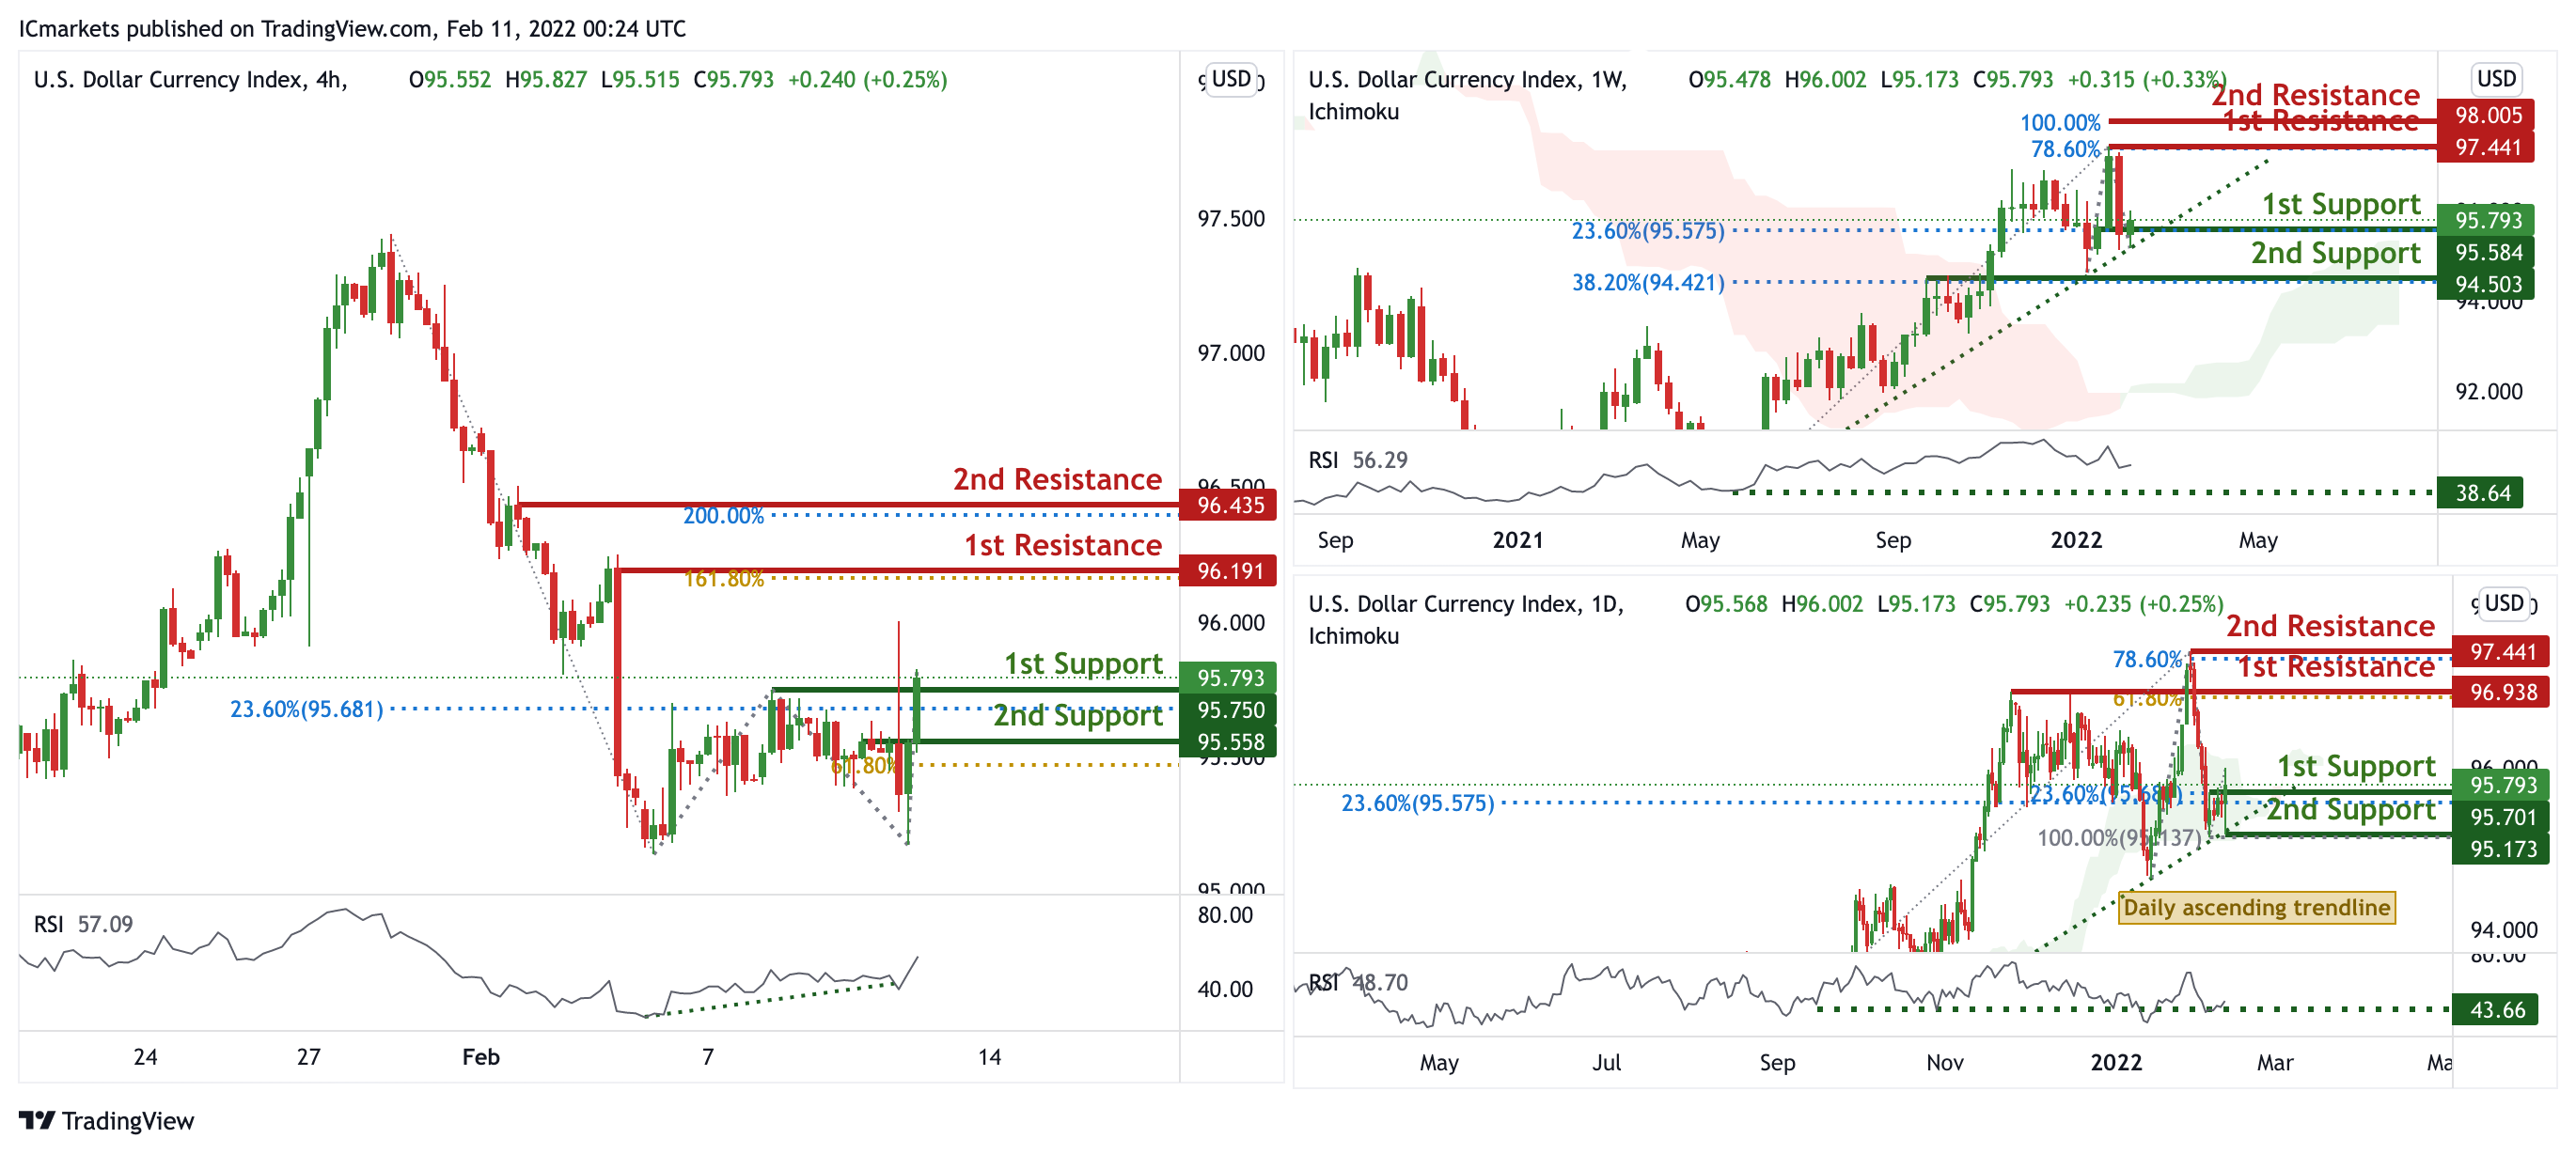
On the weekly, prices are on bullish momentum and abiding to an ascending trendline support. We see the potential for a bounce from our ascending trendline and 1st support at 95.793 in line with 23.6% Fibonacci retracement towards our 1st resistance at 97.441 in line with 78.6% Fibonacci extension. Prices are trading above our Ichimoku Cloud support and RSI are close to levels where bounces previously occurred, further supporting our bias. On the daily, prices have recently bounced off our ascending trendline support and abiding to our daily ascending trendline. We see the potential for further bullish continuation from our 1st support at 95.701 in line with 23.6% Fibonacci retracement towards our 1st resistance at 96.938 in line with 61.8% Fibonacci extension. RSI are at levels where bounces previously occurred and also prices trading above our ichimoku cloud support, backing our bullish bias. On the H4 timeframe, prices are on bullish momentum and have formed a potential double bottom. We see the potential for further bullish continuation from our 1st support at 95.793 in line with 50% Fibonacci retracement and graphical overlap towards our 1st resistance at 96.191 in line with 161.8% Fibonacci Projection. Our bullish bias is further supported by our RSI portraying bullish momentum.
Areas of consideration:
- H4 time frame, 1st resistance at 96.191
- H4 time frame, 1st support at 95.793
XAU/USD (GOLD):
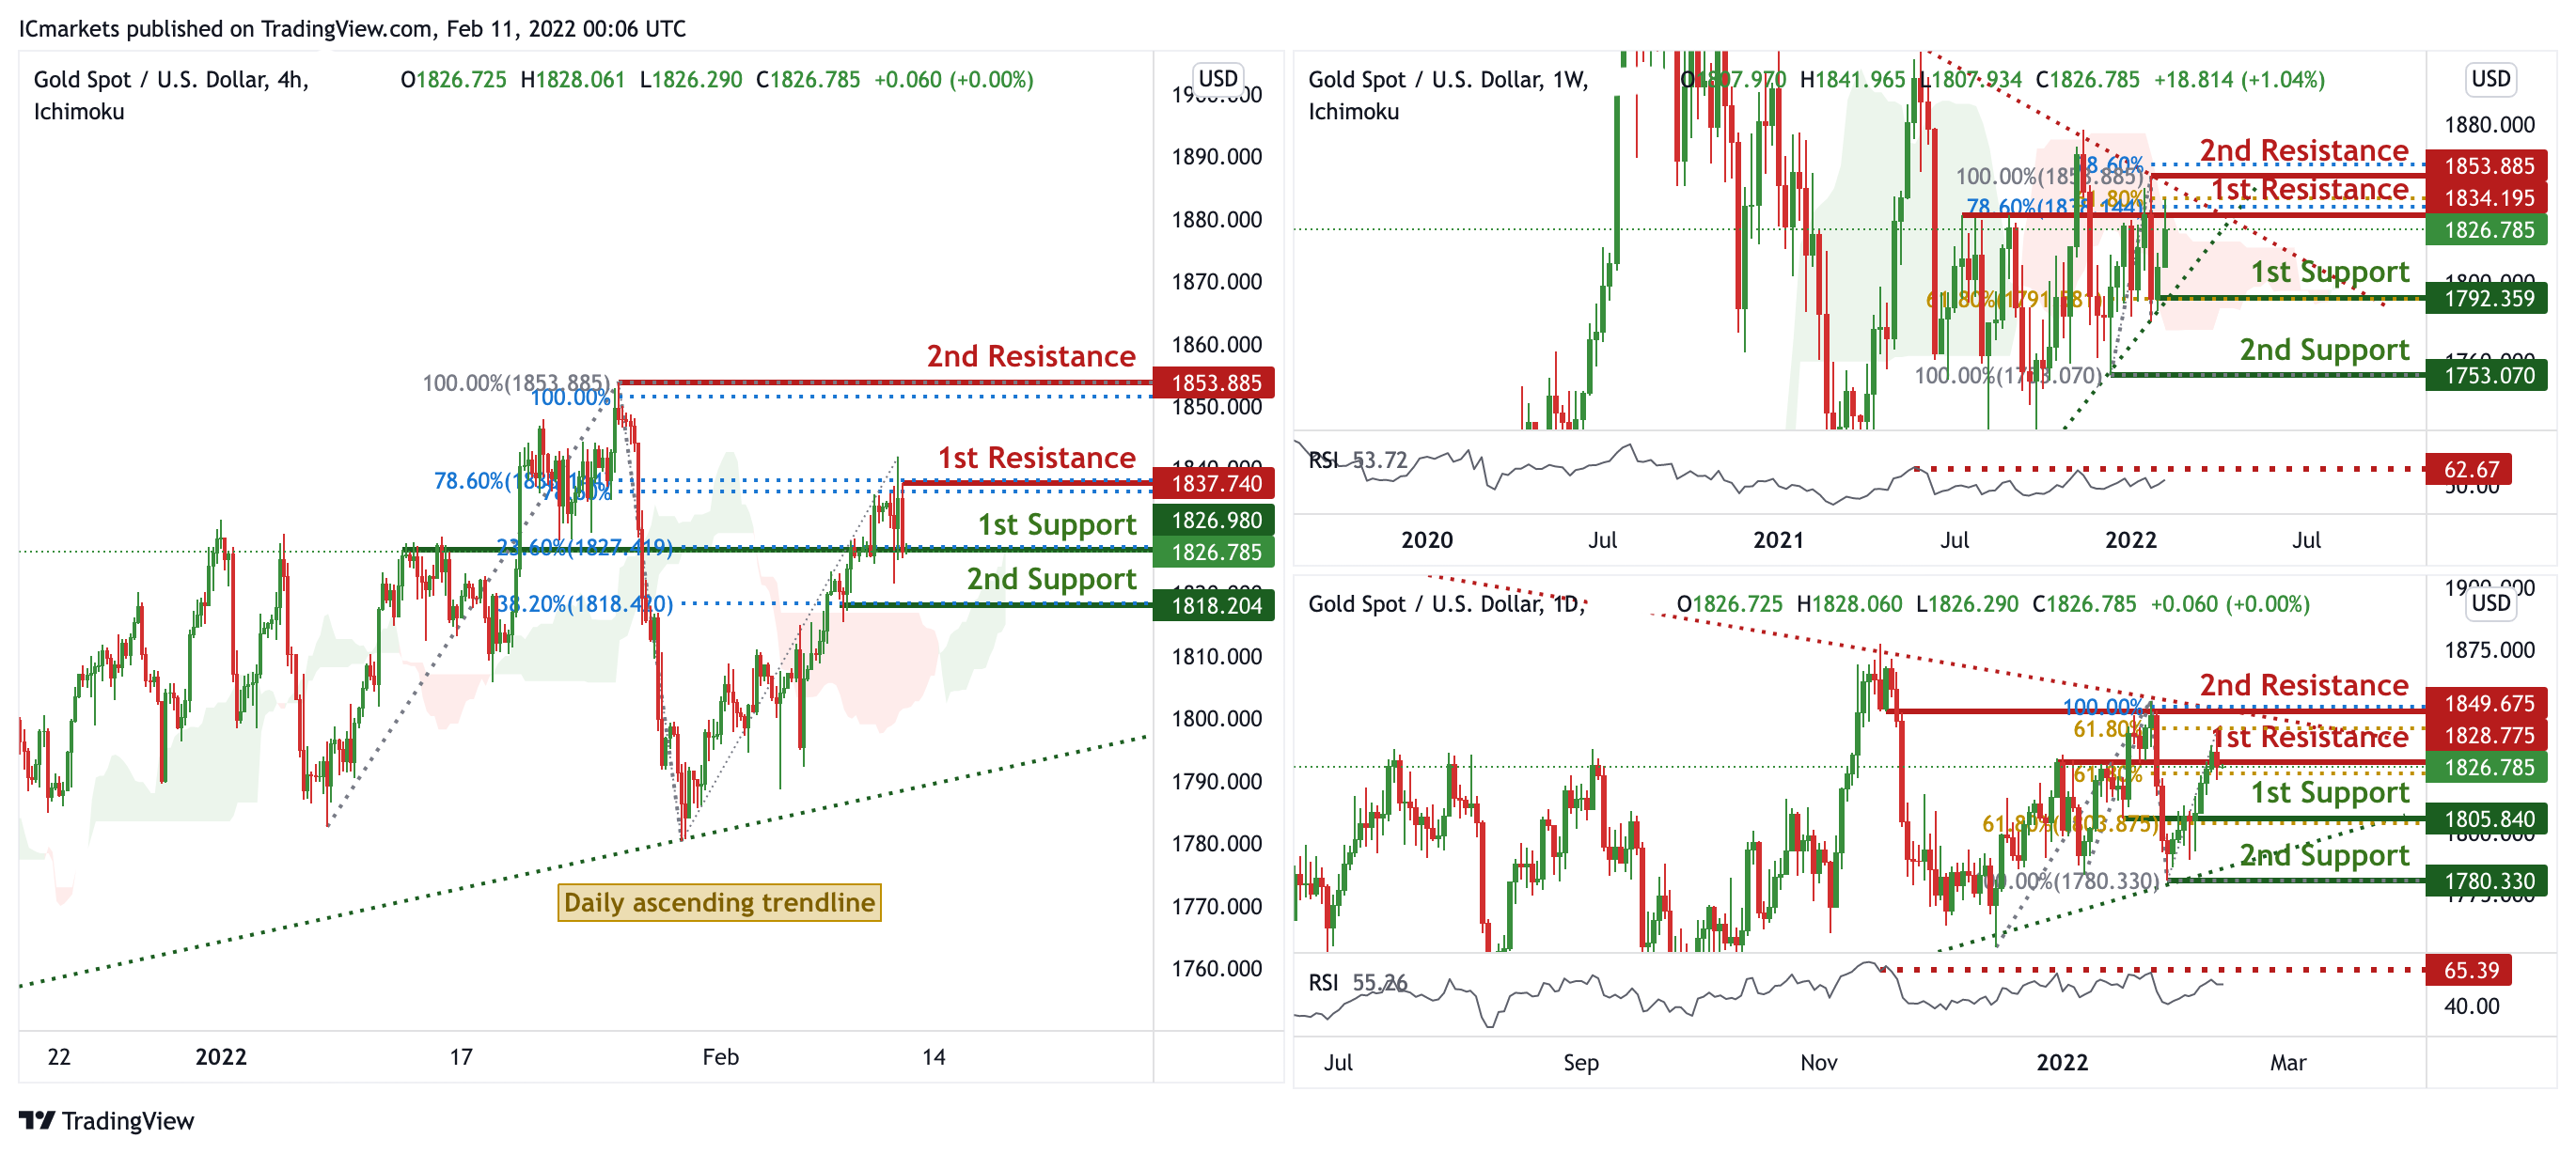
On the weekly, prices have approached a strong graphical overlap and resistance, and are also consolidating in a triangle. We see the potential for a dip from 1st resistance at 1834.195 in line with 61.8% Fibonacci extension and 78.6% Fibonacci retracement towards our 1st support at 1792.359 in line with 61.8% Fibonacci retracement. RSI are at levels where dips previously occurred and also prices are trading below our ichimoku cloud support, further supporting our bearish bias. On the daily, prices were on bullish momentum and currently at a strong graphical overlap and resistance. We see the potential for a dip from our 1st resistance at 1828.775 in line with 61.8% Fibonacci retracement towards our 1st support at 1805.840 in line with 61.8% Fibonacci retracement. RSI is at levels where dips previously occurred, backing our bearish bias.
On the H4 chart, prices are at a pivot and strong graphical overlap resistance. We see potential for a pullback from our 1st resistance at 1836.379 in line with 78.6% Fibonacci retracement and 78.6% Fibonacci extension towards our 1st support at 1824.397 in line with 23.6% Fibonacci retracement and 38.2% Fibonacci retracement. RSI are at levels where dips previously occurred.
Areas of consideration:
- 4h 1st support at 1826.785
- 4h 1st resistance at 1837.740
GBP/USD
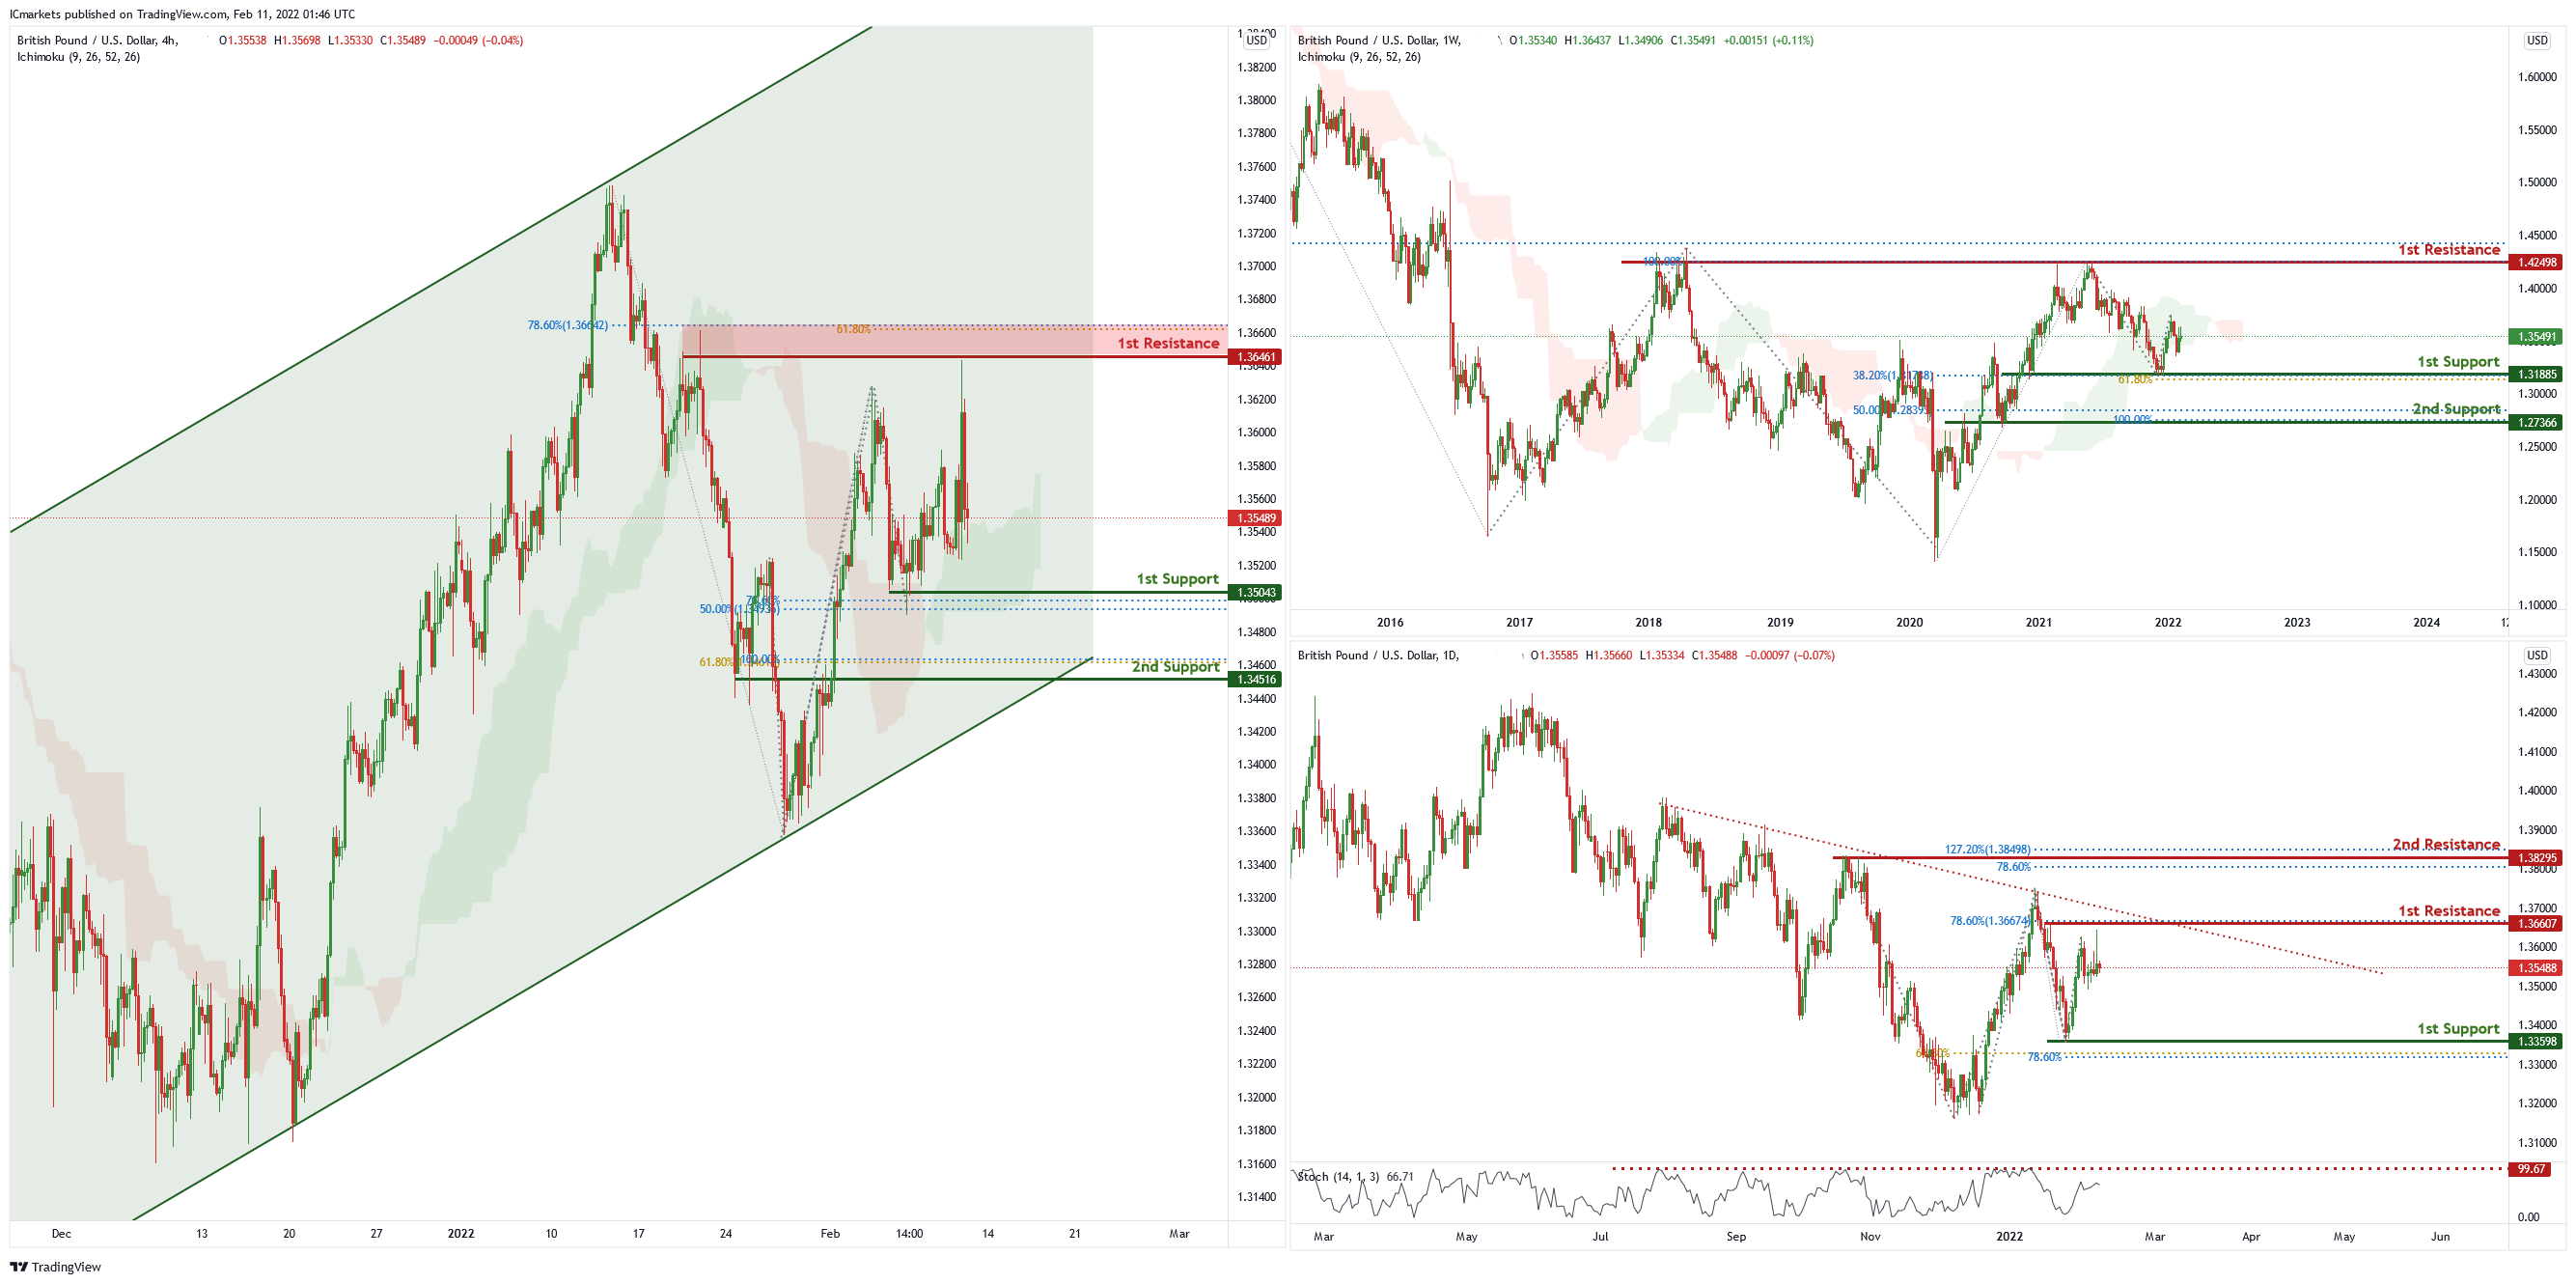
On the weekly chart , price has recently bounced off the 1st support level of 1.31885 which is also 38.2% Fibonacci retracement and 61.8% Fibonacci projection. Price can potentially go to the 1st resistance level of 1.42498 which is also 100% Fibonacci projection and 50% Fibonacci retracement. Our bullish bias is supported by the ichimoku cloud indicator.
On the daily chart , price is abiding by a descending trendline and near the 1st resistance level of 1.36607 which is 78.6% Fibonacci retracement. Price can potentially dip to the 1st support level of 1.33598 which is also 61.8% Fibonacci projection and 78.6% Fibonacci retracement. Our bearish bias is supported by the stochastic indicator as it is near resistance level.
In the H4 chart , price is trading in an ascending channel and near 1st support level of 1.35043 which is also 50% Fibonacci retracement and 78.6% Fibonacci projection. Price can potentially continue its bullish momentum to the 1st resistance level of 1.36461 in line with 61.8% Fibonacci projection and 78.6% Fibonacci retracement. Our bullish bias is supported by the ichimoku cloud indicator as price is trading above it.
Areas of consideration:
- H4 1st resistance 1.36461
- H4 1st support 1.35043
USD/CHF:
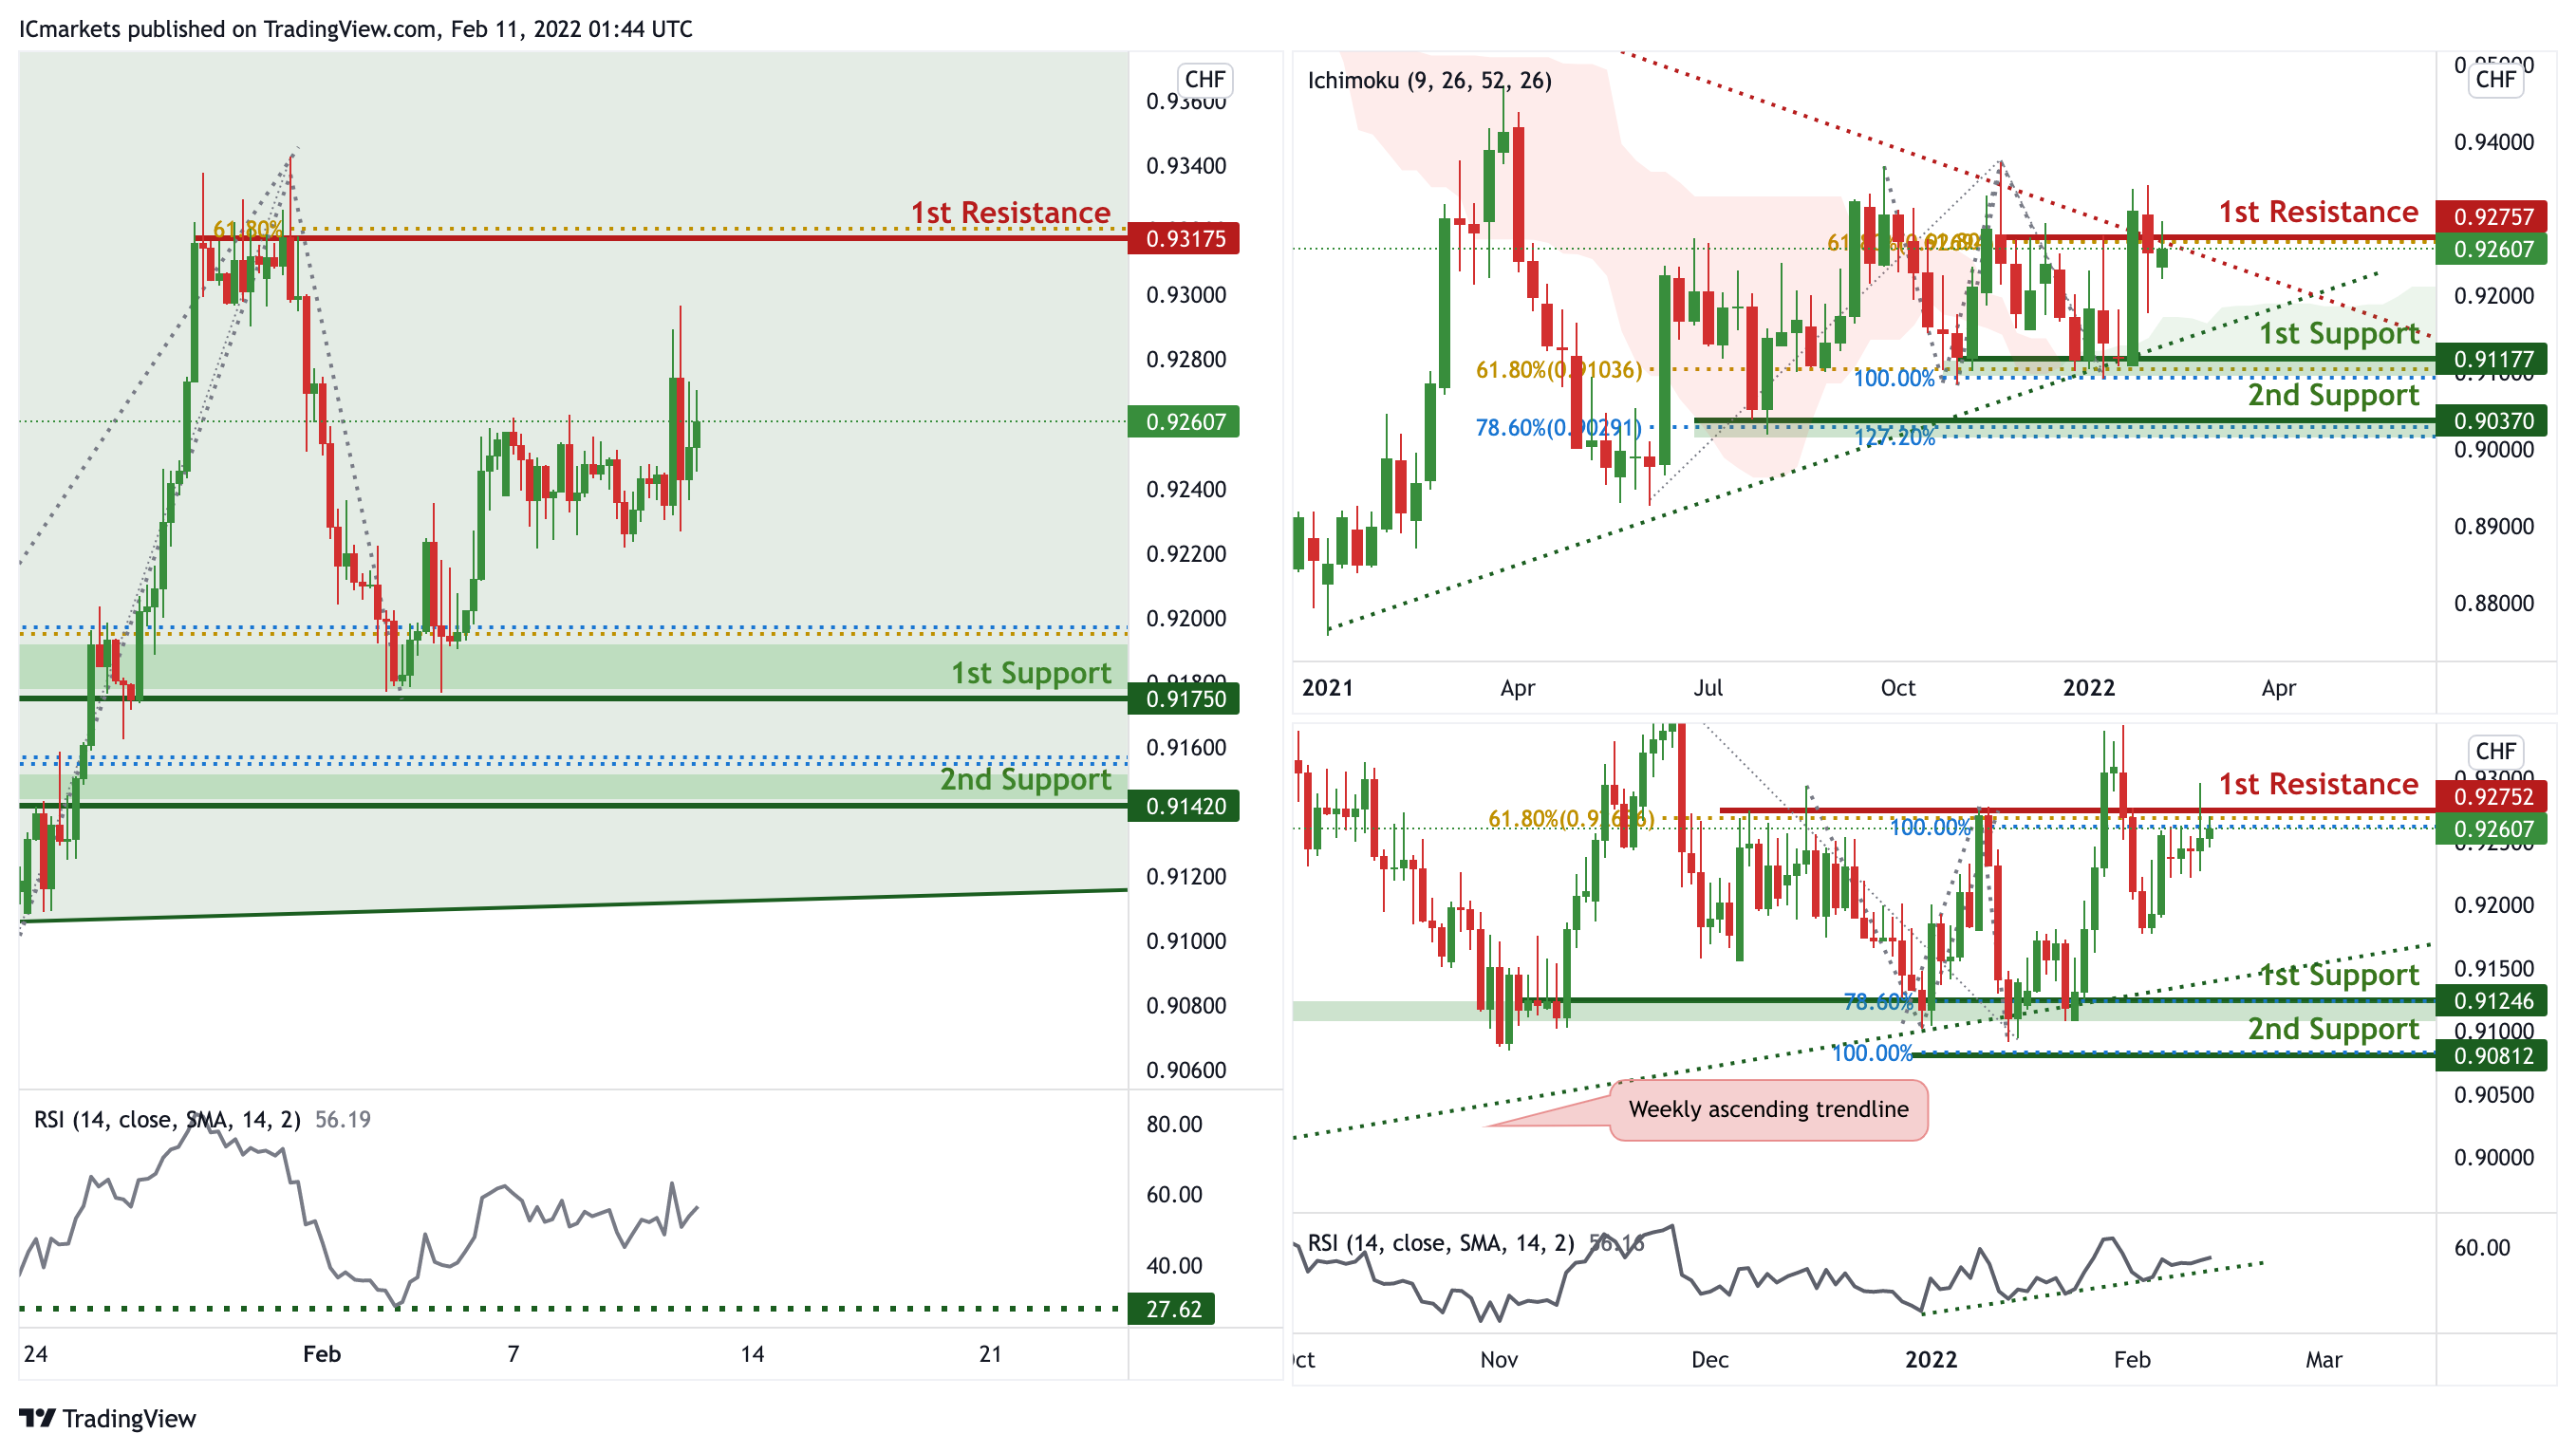
On the weekly, prices are on bearish momentum and abiding to our descending trendline. We see the potential for a dip from our 1st resistance at 0.93206 in line with 78.6% Fibonacci extension towards our 1st support at 0.91845 in line with 61.8% Fibonacci retracement. RSI is showing bearish momentum.
On the daily chart, prices are hovering in between 2 levels. We see the potential for a dip if prices approach our 1st resistance at 0.93720 in line with 100% Fibonacci extension towards our 1st support at 0.92713 which is a graphical overlap. RSI are at levels where dips previously occurred. Traders should wait for prices to swing higher or lower before entering.
On the H4 timeframe,in reference to last week’s analysis price indeed bounced at the 1st Support level. Price is abiding to the daily ascending channel signifying an overall bullish momentum. We can expect the price to bounce from 1st Support in line with 78.6% Fibonacci projection and 61.8% fibonacci retracement towards 1st Resistance in line with 61.8% Fibonacci projection and previous swing high. Our bullish bias is further supported by the RSI indicator where it is at the support level. Traders should wait for prices to swing higher or lower before entering.
Areas of consideration:
- Watch 1st Support at 0.91750
- Watch 1st Resistance at 0.93175
EUR/USD :
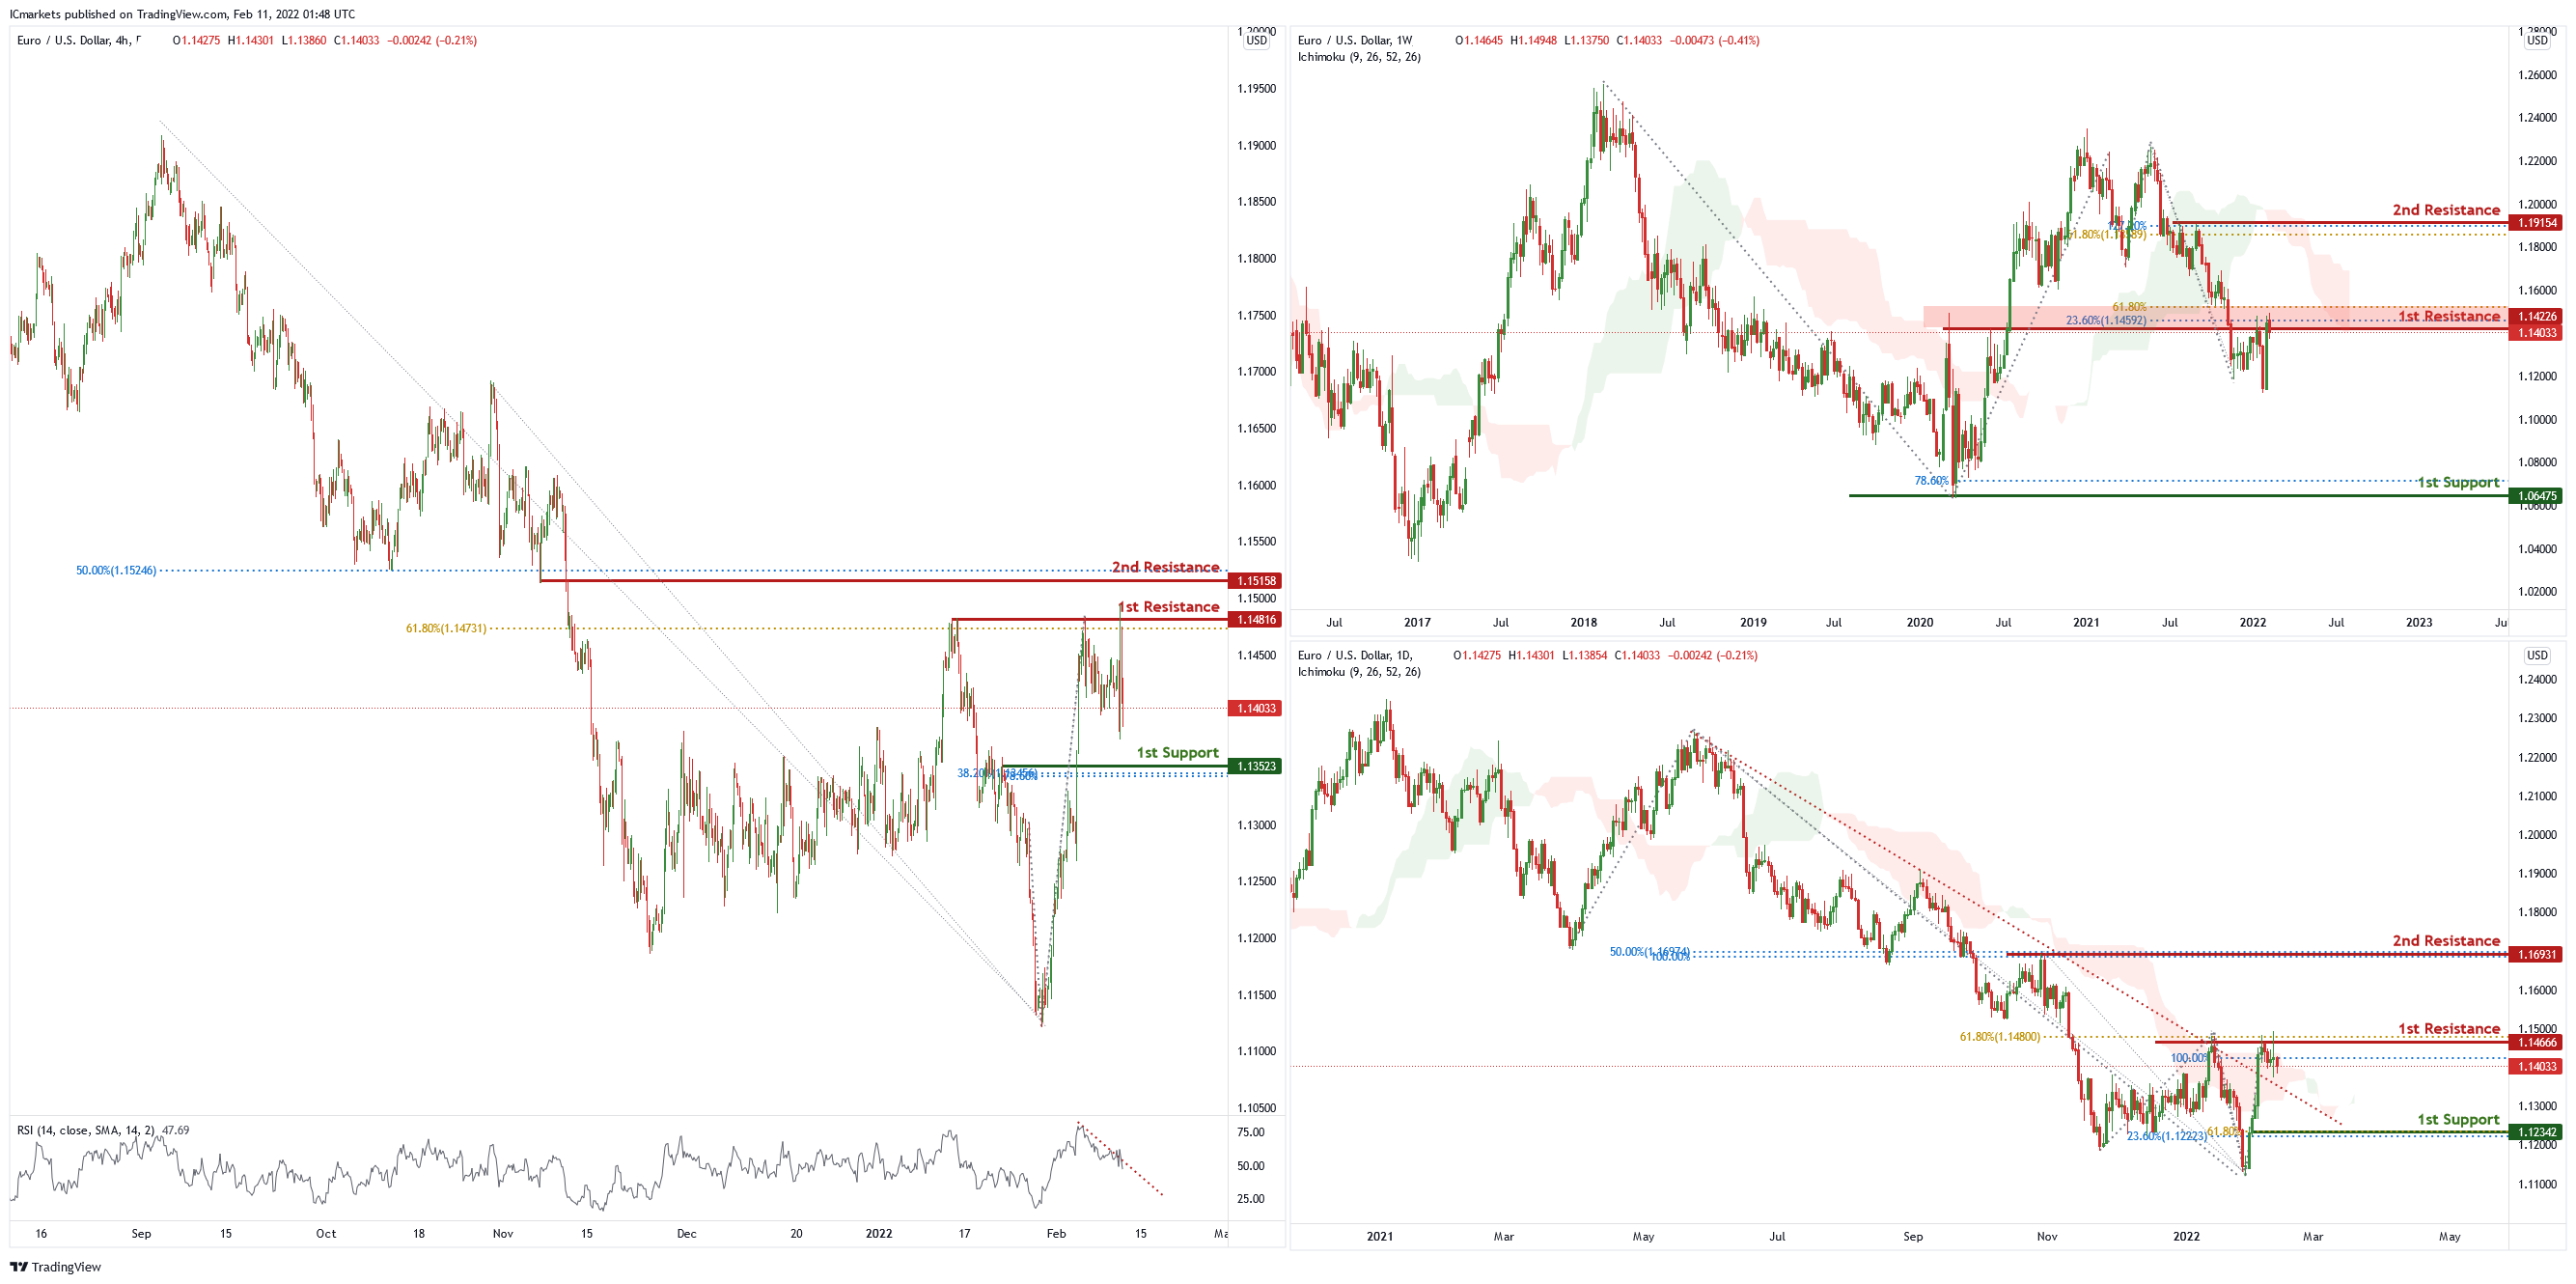
On the weekly chart, price is near 1st resistance level of 1.14226 which is also 61.8% Fibonacci projection and 23.6% Fibonacci retracement. Price can potentially dip to the 1st support level of 1.06475 which is 78.6% Fibonacci projection. Our bearish bias is supported by the ichimoku cloud indicator as price is trading below it.
On the daily chart, price has broken out of the descending trendline and is near 1st resistance level of 1.14666 which is also 100% Fibonacci projection and 61.8% Fibonacci retracement. Price can potentially go to the 2nd resistance level of 1.16931 which is 50% retracement and 100% projection. Our bullish bias is supported by the ichimoku cloud indicator as price is trading above the cloud.
On the H4 chart, price is near the 1st resistance level of 1.14816 which is also 61.8% Fibonacci retracement. Price can potentially dip to the 1st support level of 1.13523 in line with 38.2% Fibonacci retracement and 78.6% Fibonacci projection. Our bearish bias is supported by the RSI indicator as it is abiding by a descending trendline
Areas of consideration :
- H4 1st support at 1.13523
- H4 1st resistance at 1.14816
USD/JPY
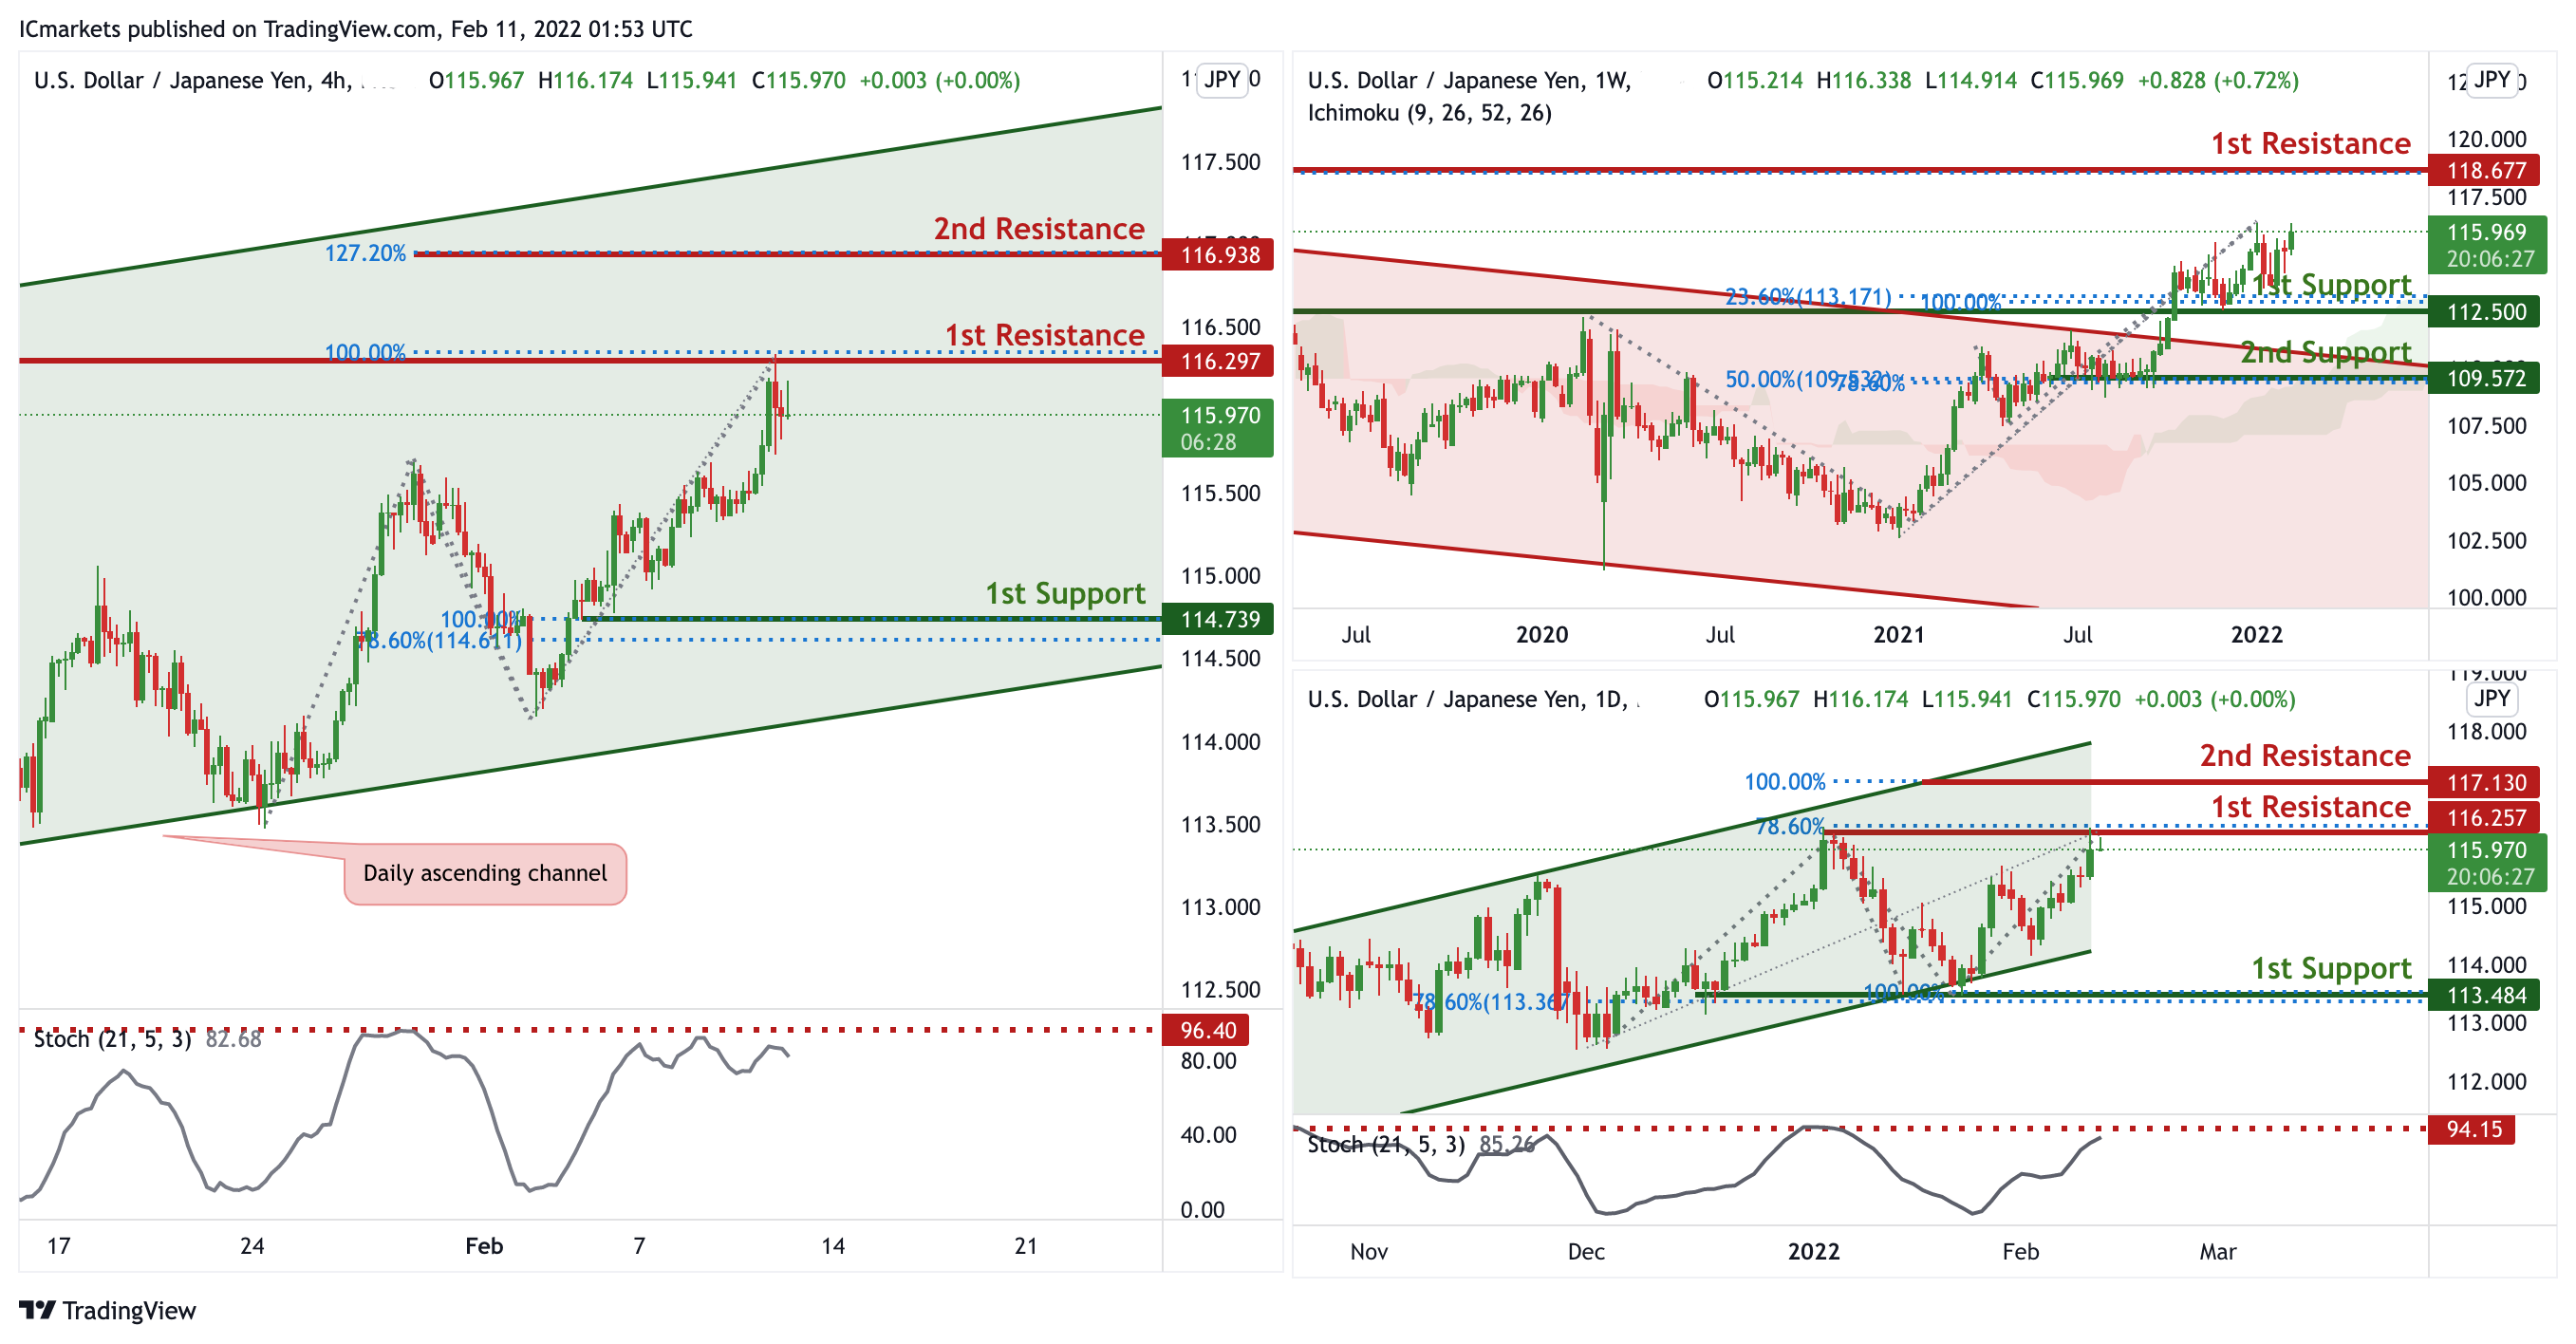
On the weekly chart, price has broken out of the descending channel and near support level of 112.500 which is also 23.6% Fibonacci retracement and 100% Fibonacci projection. Price can potentially go to the 1st resistance level of 118.677 which is also 78.6% Fibonacci retracement. Our bullish bias is supported by the ichimoku cloud indicator as price is trading above it.
In reference to last week’s analysis, price indeed touched the 1st Resistance at 116.25. On the daily chart price is trading in an ascending channel, signifying an overall bullish momentum. However, price is at a horizontal resistance, we can expect price to make a short-term bearish drop from 1st Resistance in line with 78.6% Fibonacci projection and previous swing high. Price could potentially drop to 1st Support in line with 100% Fibonacci projection and 78.6% Fibonacci retracement. Our short-term bearish bias is further supported by the stochastic indicator where the %K line is approaching the resistance level.
On the H4 chart,in reference to last week’s analysis, price indeed bounced at 1st Support and it is reaching our potential 1st Resistance level @ 115.598.
Price is trading in an ascending channel signifying an overall bullish momentum, however, we can expect a short-term bearish drop from 1st Resistance level in line with horizontal resistance and 100% Fibonacci projection towards 1st Support in line with 100% Fibonacci projection and 78.6% Fibonacci retracement. Our bearish bias is further supported by the stochastic indicator where the %K line is at the resistance level.
Areas of consideration:
- H4 1st support at 113.484
- H4 1st resistance at 116.257
AUD/USD:
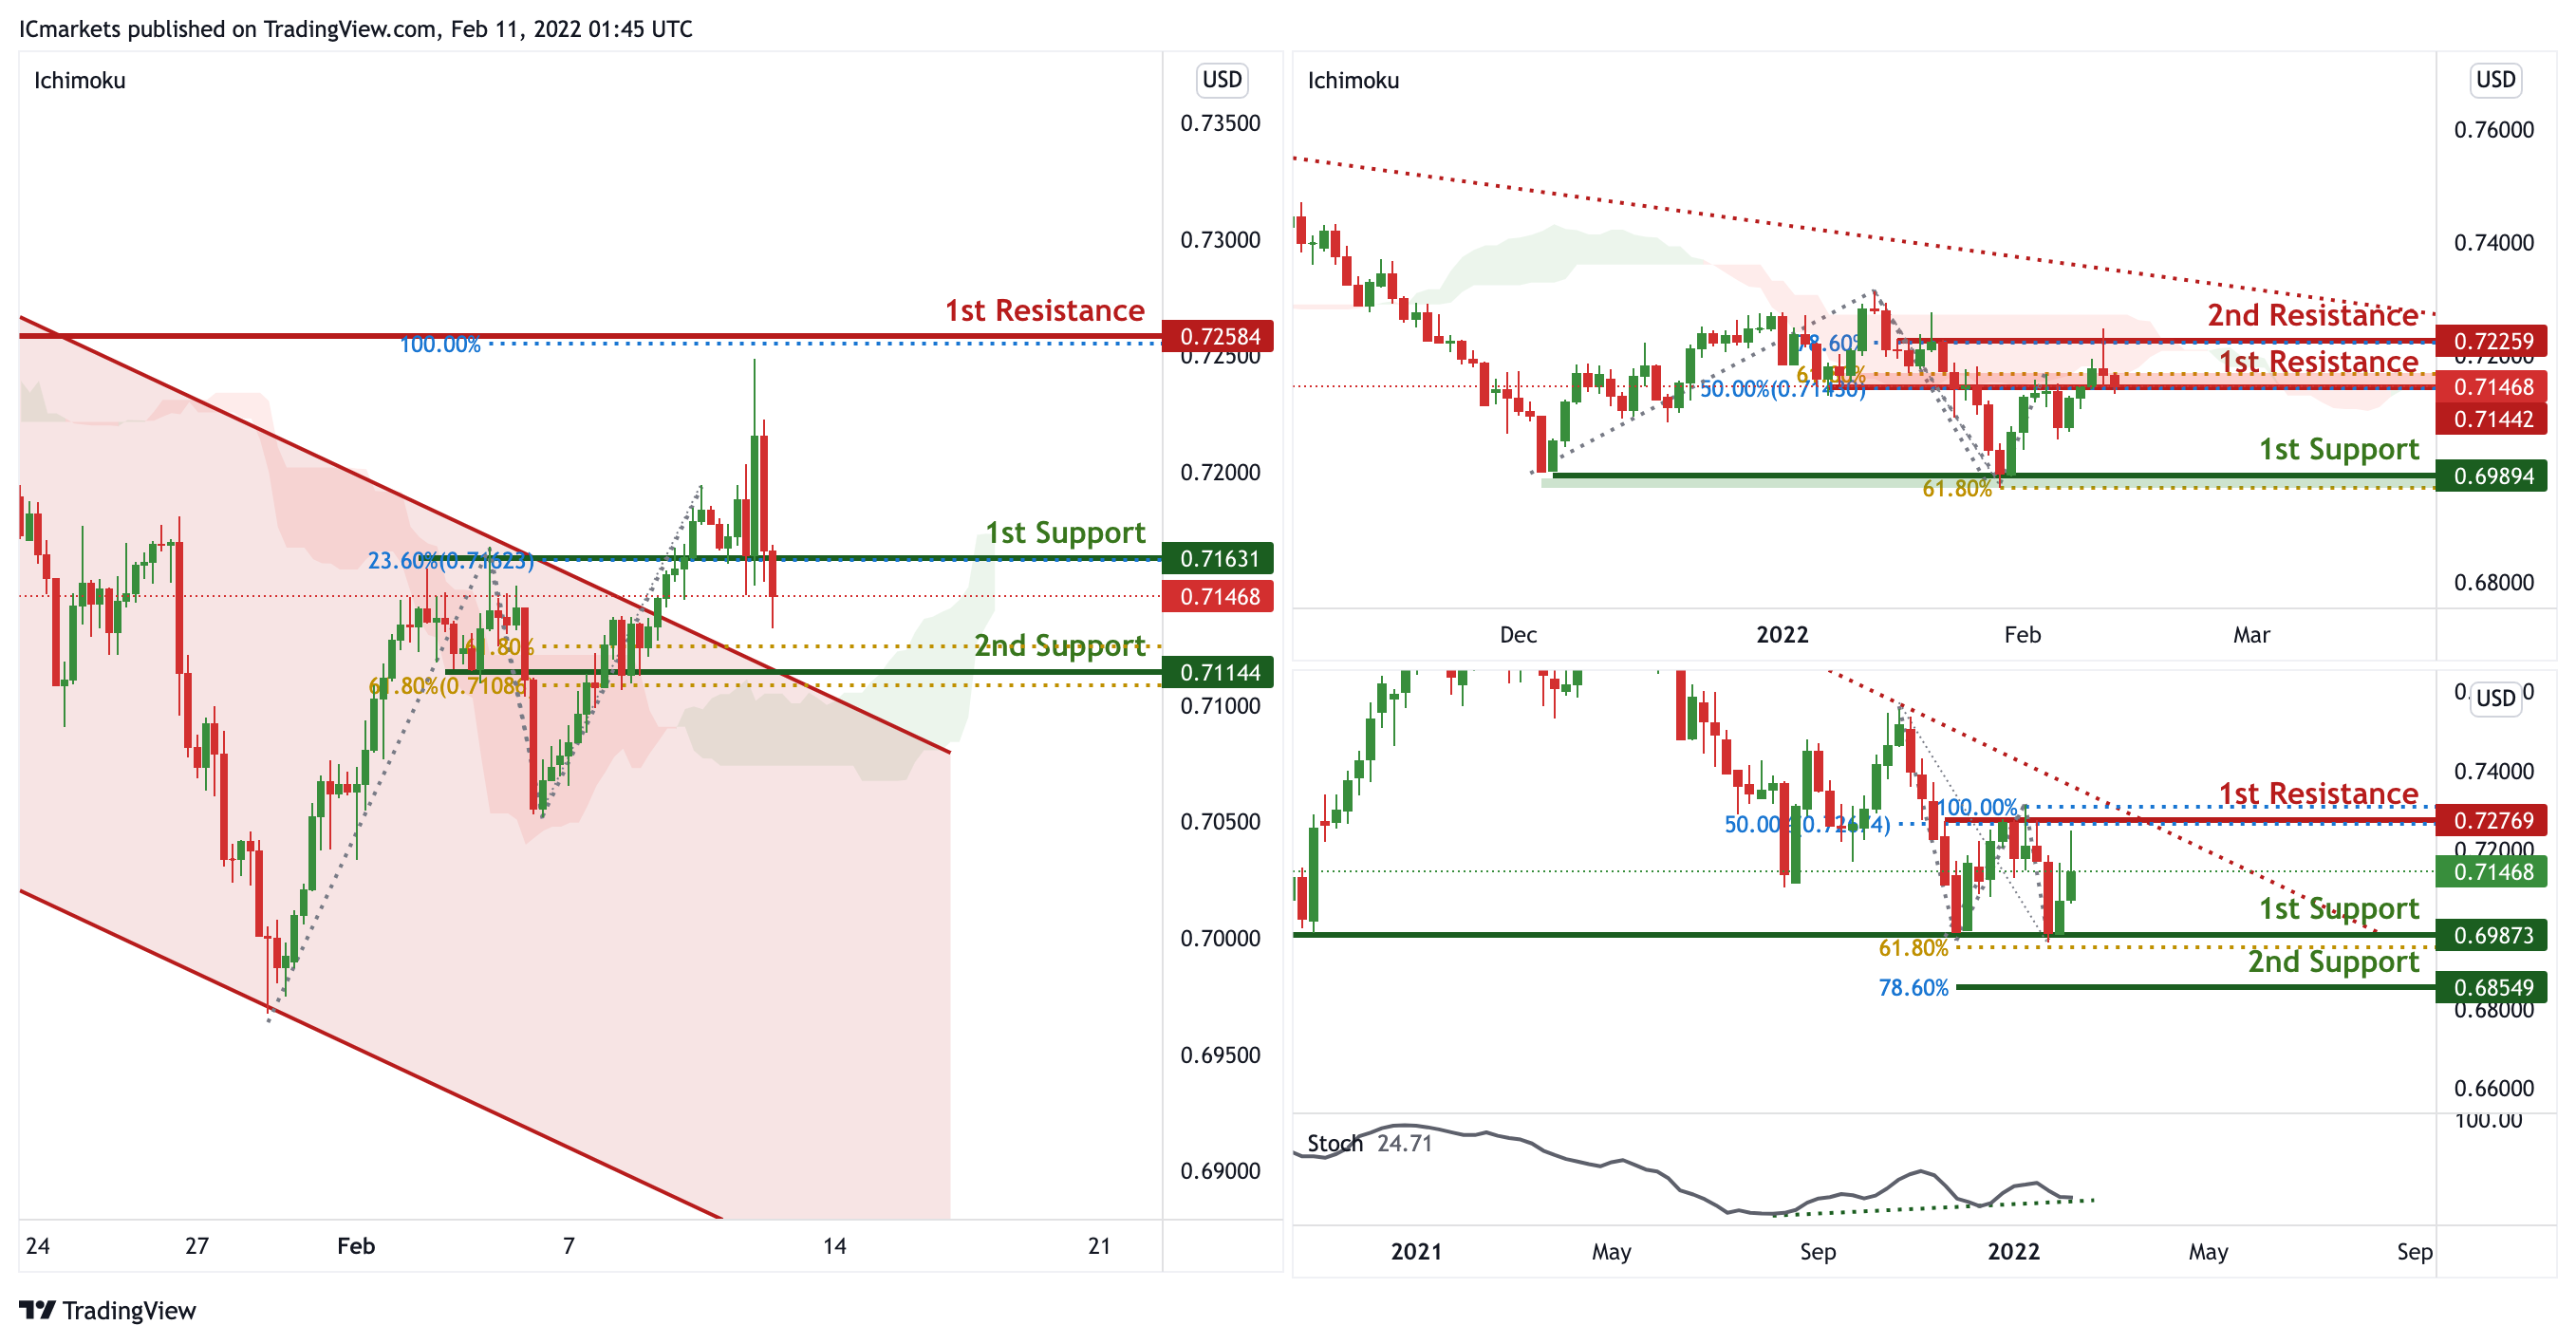
On the weekly, price is abiding to the descending trendline resistance , signifying an overall bearish momentum. However, the price bounced up at the horizontal support. We can expect price to reach 1st Resistance in line with 50% Fibonacci retracement and 100% Fibonacci projection. Traders can wait for price to swing higher or lower before entering.
On the Daily timeframe, price is abiding to the descending trendline , signifying an overall bearish momentum. We can expect the price to drop from 1st Resistance in line with 50% Fibonacci retracement and 61.8% Fibonacci projection towards 1st Support in line with horizontal support and 61.8% Fibonacci projection.
Price broke out of the descending channel, signifying an overall bullish momentum. We can expect price to bounce from 1st Support in line with 23.6% Fibonacci retracement and graphical overlap support towards 1st Resistance in line with previous swing high and 100% Fibonacci projection. Our bullish bias is further supported by the Ichimoku indicator where the prices are holding above the cloud.
Areas of consideration:
- H4 1st Support level 0.71631
- H4 1st resistance level 0.72584
NZD/USD:
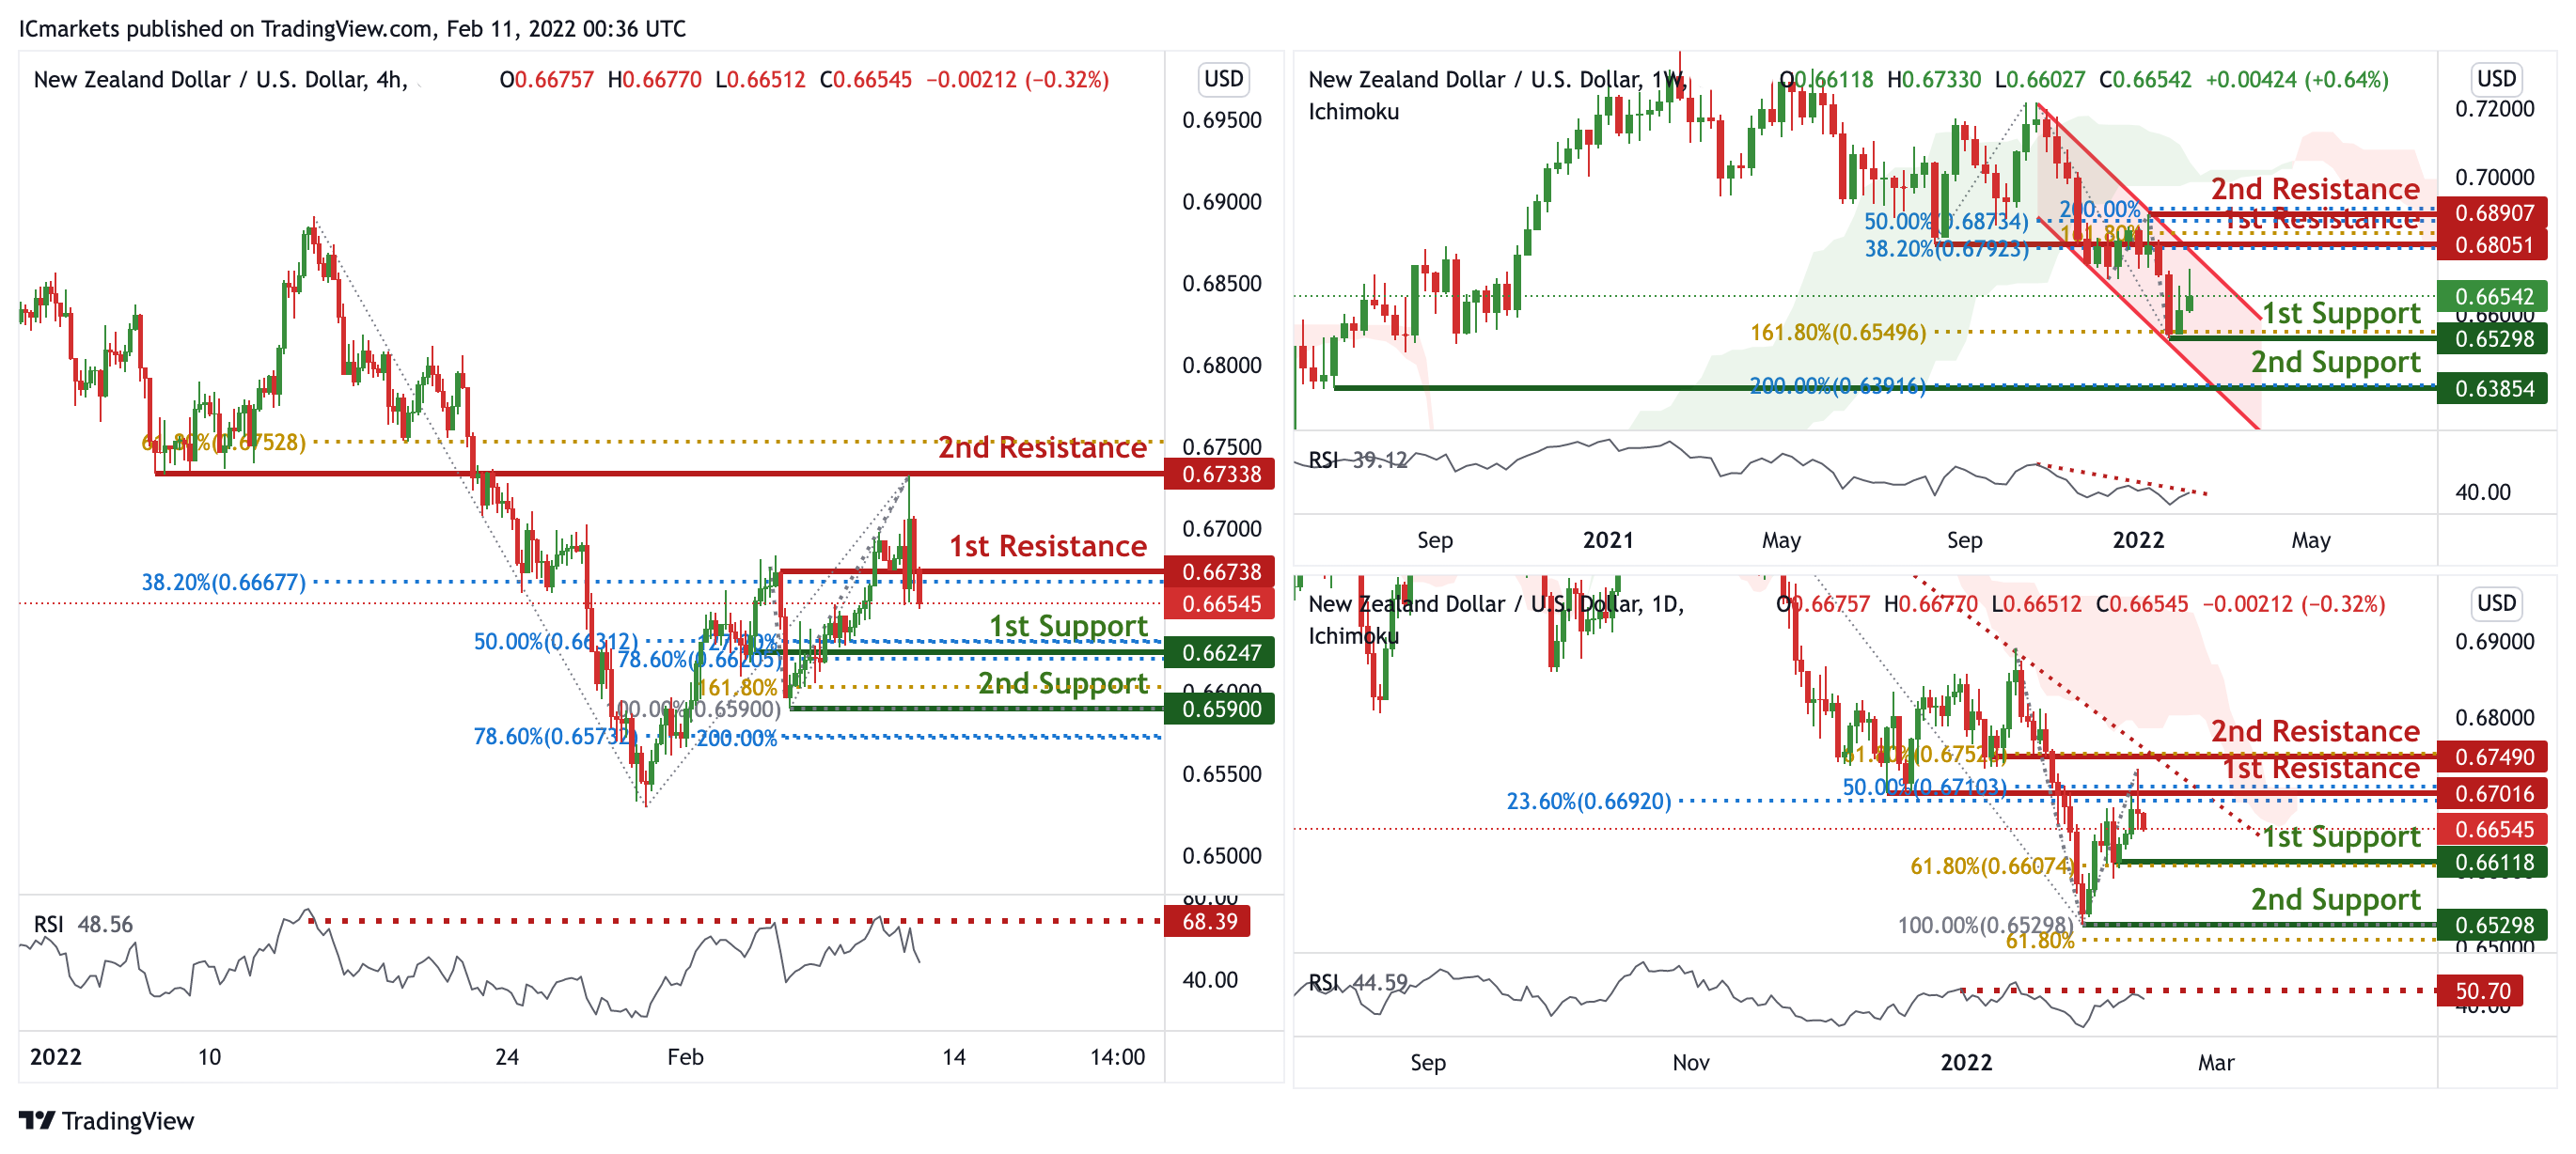
On the weekly, prices are on bearish momentum and consolidating in a bearish channel. We see the potential for a dip from our 1st resistance at 0.68051 in line with 38.2% Fibonacci retracement and 161.8% Fibonacci Projection towards our 1st support at 0.65298 in line with 161.8% Fibonacci Projection. Prices are trading below our Ichimoku cloud resistance and RSI is on bearish momentum, further supporting our bearish bias. On the daily, prices are on bearish momentum and abiding to our descending trendline. We see the potential for a dip from our 1st resistance at 0.67016 in line with 50% Fibonacci retracement and 23.6% Fibonacci retracement towards our 1st support at 0.66118 in line with 61.8% Fibonacci retracement. Prices sre trading below our ichimoku cloud resistance and also RSI is at levels where dips previously occurred, supporting our bearish bias.
On the H4 timeframe, prices have dipped beyond our strong graphical overlap and are on bearish momentum. We see potential for bearish continuation from our 1st resistance at 0.66738 in line with 38.2% Fibonacci retracement towards our 1st support at 0.66247 in line with 50% Fibonacci retracement, 78.6% Fibonacci extensions and 23.6% Fibonacci retracement. Our bias is further supported by RSI being at levels where dips previously occurred. Alternatively, our stop loss will be placed at 2nd resistance at 0.67338 in line with 61.8% Fibonacci retracement.
Areas of consideration:
- H4 time frame, 1st resistance at 0.66738
- H4 time frame, 1st support at 0.66247
USD/CAD:
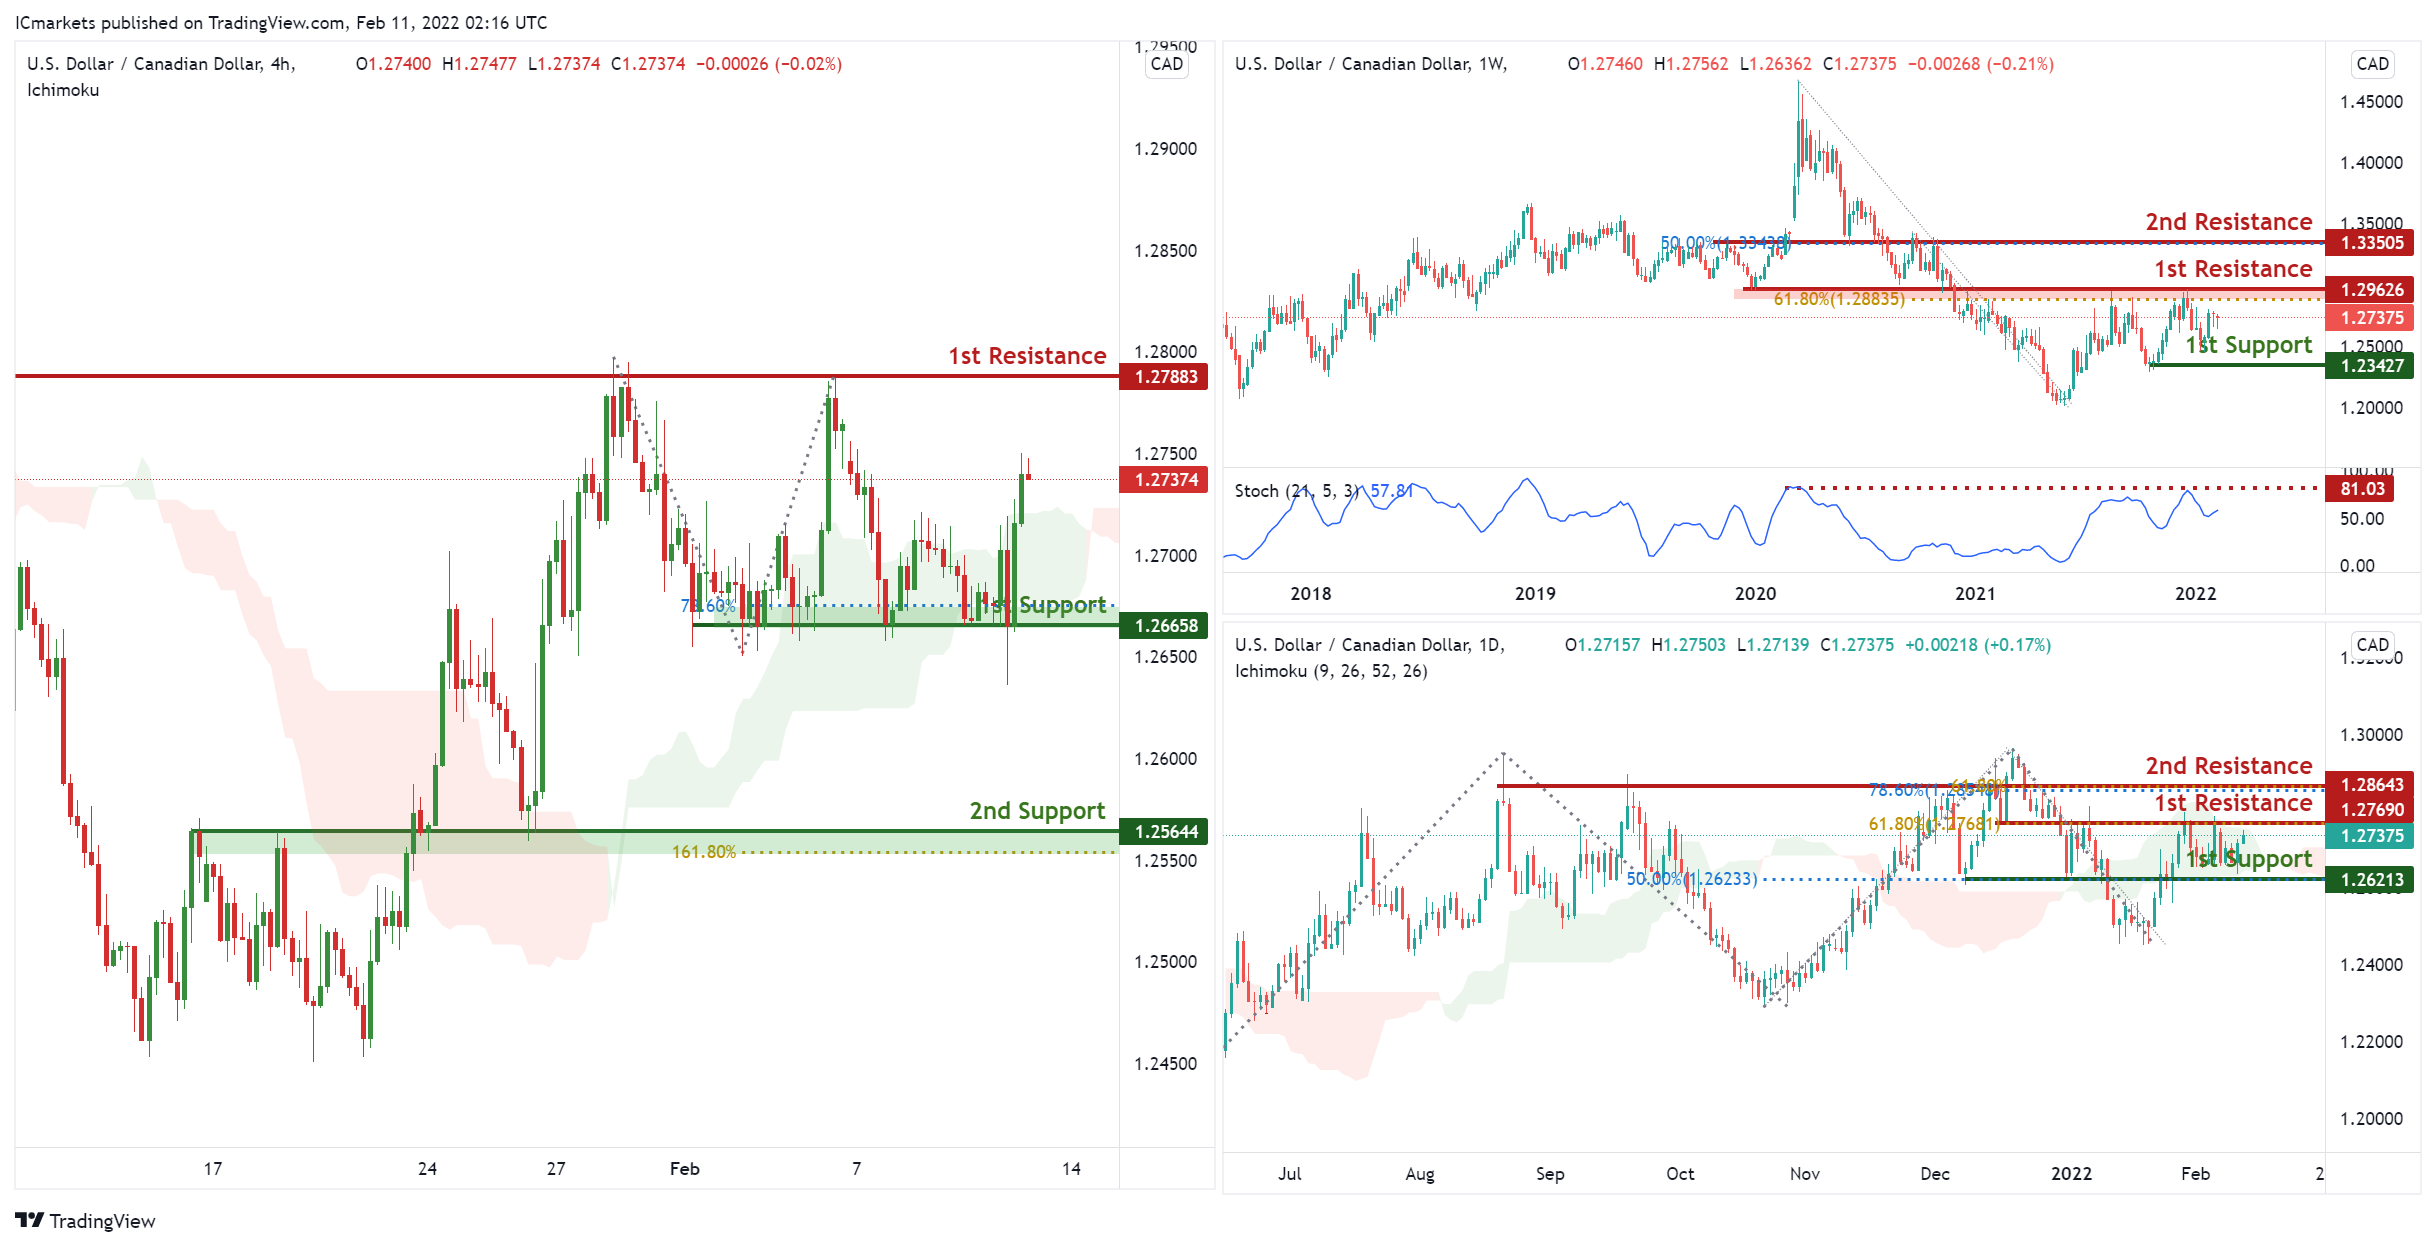
On the Weekly, with prices expected to reverse off the stochastics resistance, we see a potential drop to our 1st support at 1.25644 in line with horizontal overlap support from our 1st resistance at 1.26664 in line with horizontal overlap resistance. Alternatively, price may break 1st resistance structure and head for 2nd resistance at 1.27779, in line with the horizontal swing high resistance.
On the Daily, with prices approaching the resistance of the ichimoku cloud, we see a potential drop to our 1st support at 1.25644 in line with horizontal overlap support and 50% Fibonacci retracement from our 1st resistance at 1.26664 in line with horizontal overlap resistance and 61.8% Fibonacci retracement . Alternatively, price may break 1st resistance structure and head for 2nd resistance at 1.27779, in line with the horizontal swing high resistance.
On the H4, with price moving above the ichimoku cloud, signifying an overall bullish momentum. We can expect price to rise to our 1st resistance at 36251 in line horizontal graphical swing high resistance and 161.8% Fibonacci extension from our 1st support in line with horizontal overlap support at 35680. Alternatively, price may break 1st support structure and head for 2nd support, which coincides with horizontal swing low support at 34978.
Areas of consideration:
- H4 time frame, 1st support at 1.25644
- H4 time frame, 1st resistance at 1.26664
OIL:
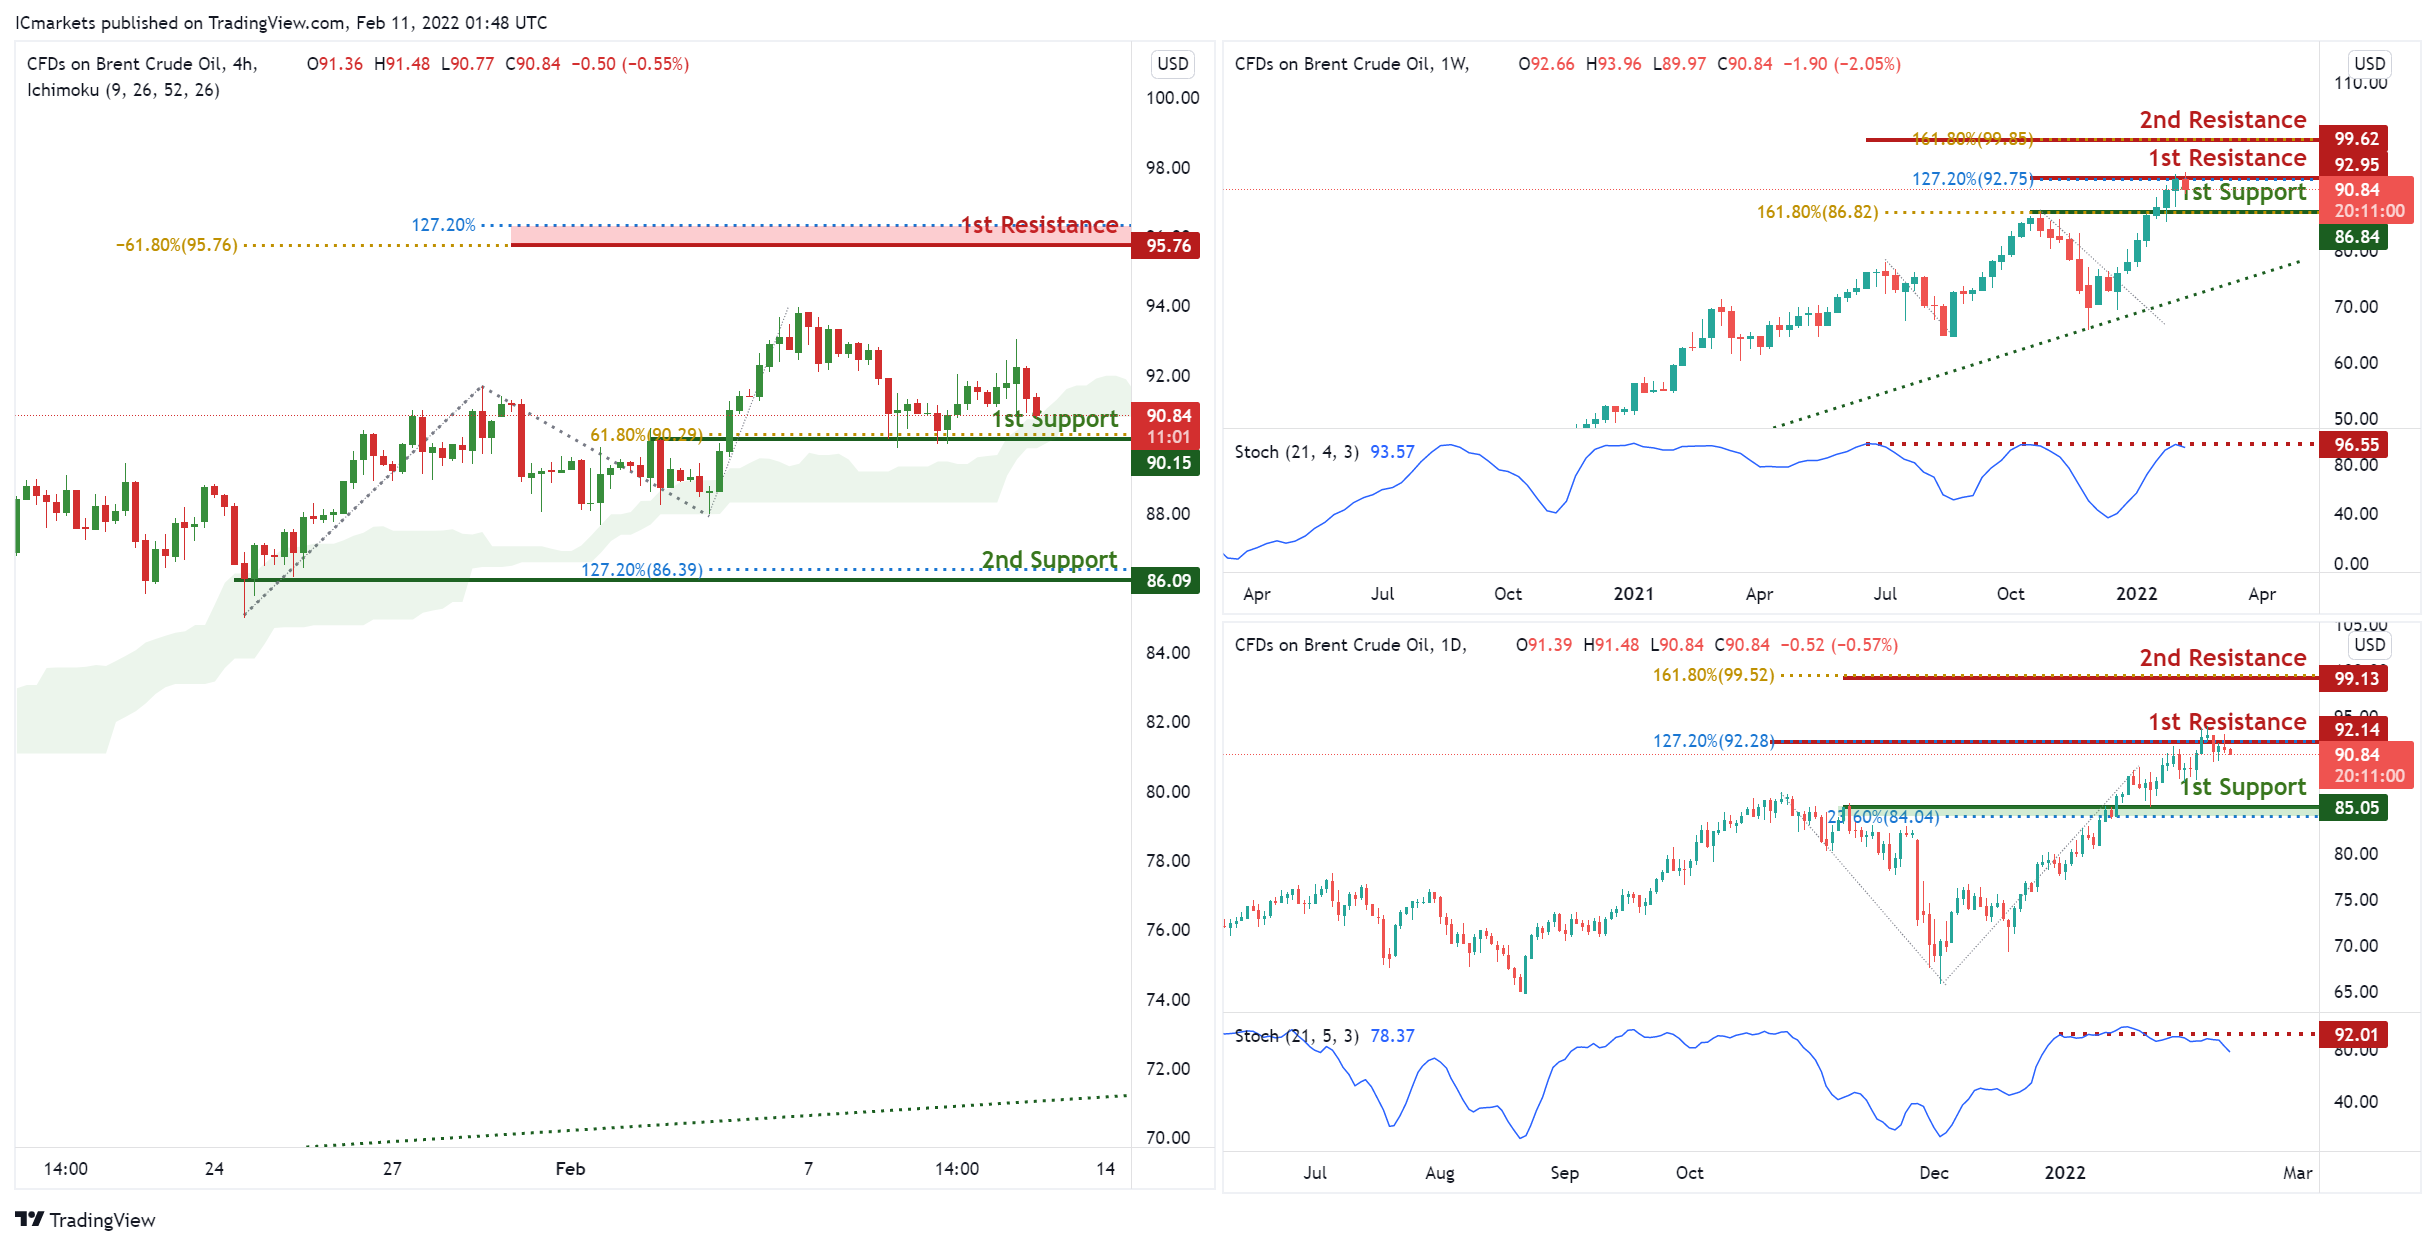
On the Weekly, with prices expected to reverse off the stochastics resistance, we see a potential drop to our 1st support at 86.84 in line with horizontal overlap support and 127.2% Fibonacci extension from our 1st resistance at 92.95 in line with horizontal overlap resistance. Alternatively, price may break 1st resistance structure and head for 2nd resistance at 99.62, in line with the horizontal swing high resistance and 161.8% Fibonacci extension.
On the Daily, with prices expected to reverse off the stochastics resistance, we see a potential drop to our 1st support at 85.05 in line with horizontal overlap support and 23.6% Fibonacci retracement from our 1st resistance at 92.14 and 127.2% Fibonacci extension in line with horizontal swing high resistance. Alternatively, price may break 1st resistance structure and head for 2nd resistance at 99.13, in line with the horizontal swing high resistance.
On the H4, with prices moving above the ichimoku cloud, we see the potential for a bounce from our 1st support at 90.15 in line with horizontal overlap support towards our 1st resistance at 95.76 in line with the 127.2% Fibonacci extension and -61.8% Fibonacci expansion. Alternatively, price may break 1st support structure and head for 2nd support at 86.09, in line with the horizontal swing low support and 127.2% Fibonacci extension.
Areas of consideration:
- H4 time frame, 1st resistance of 95.76
- H4 time frame, 1st support of 90.15
Dow Jones Industrial Average:
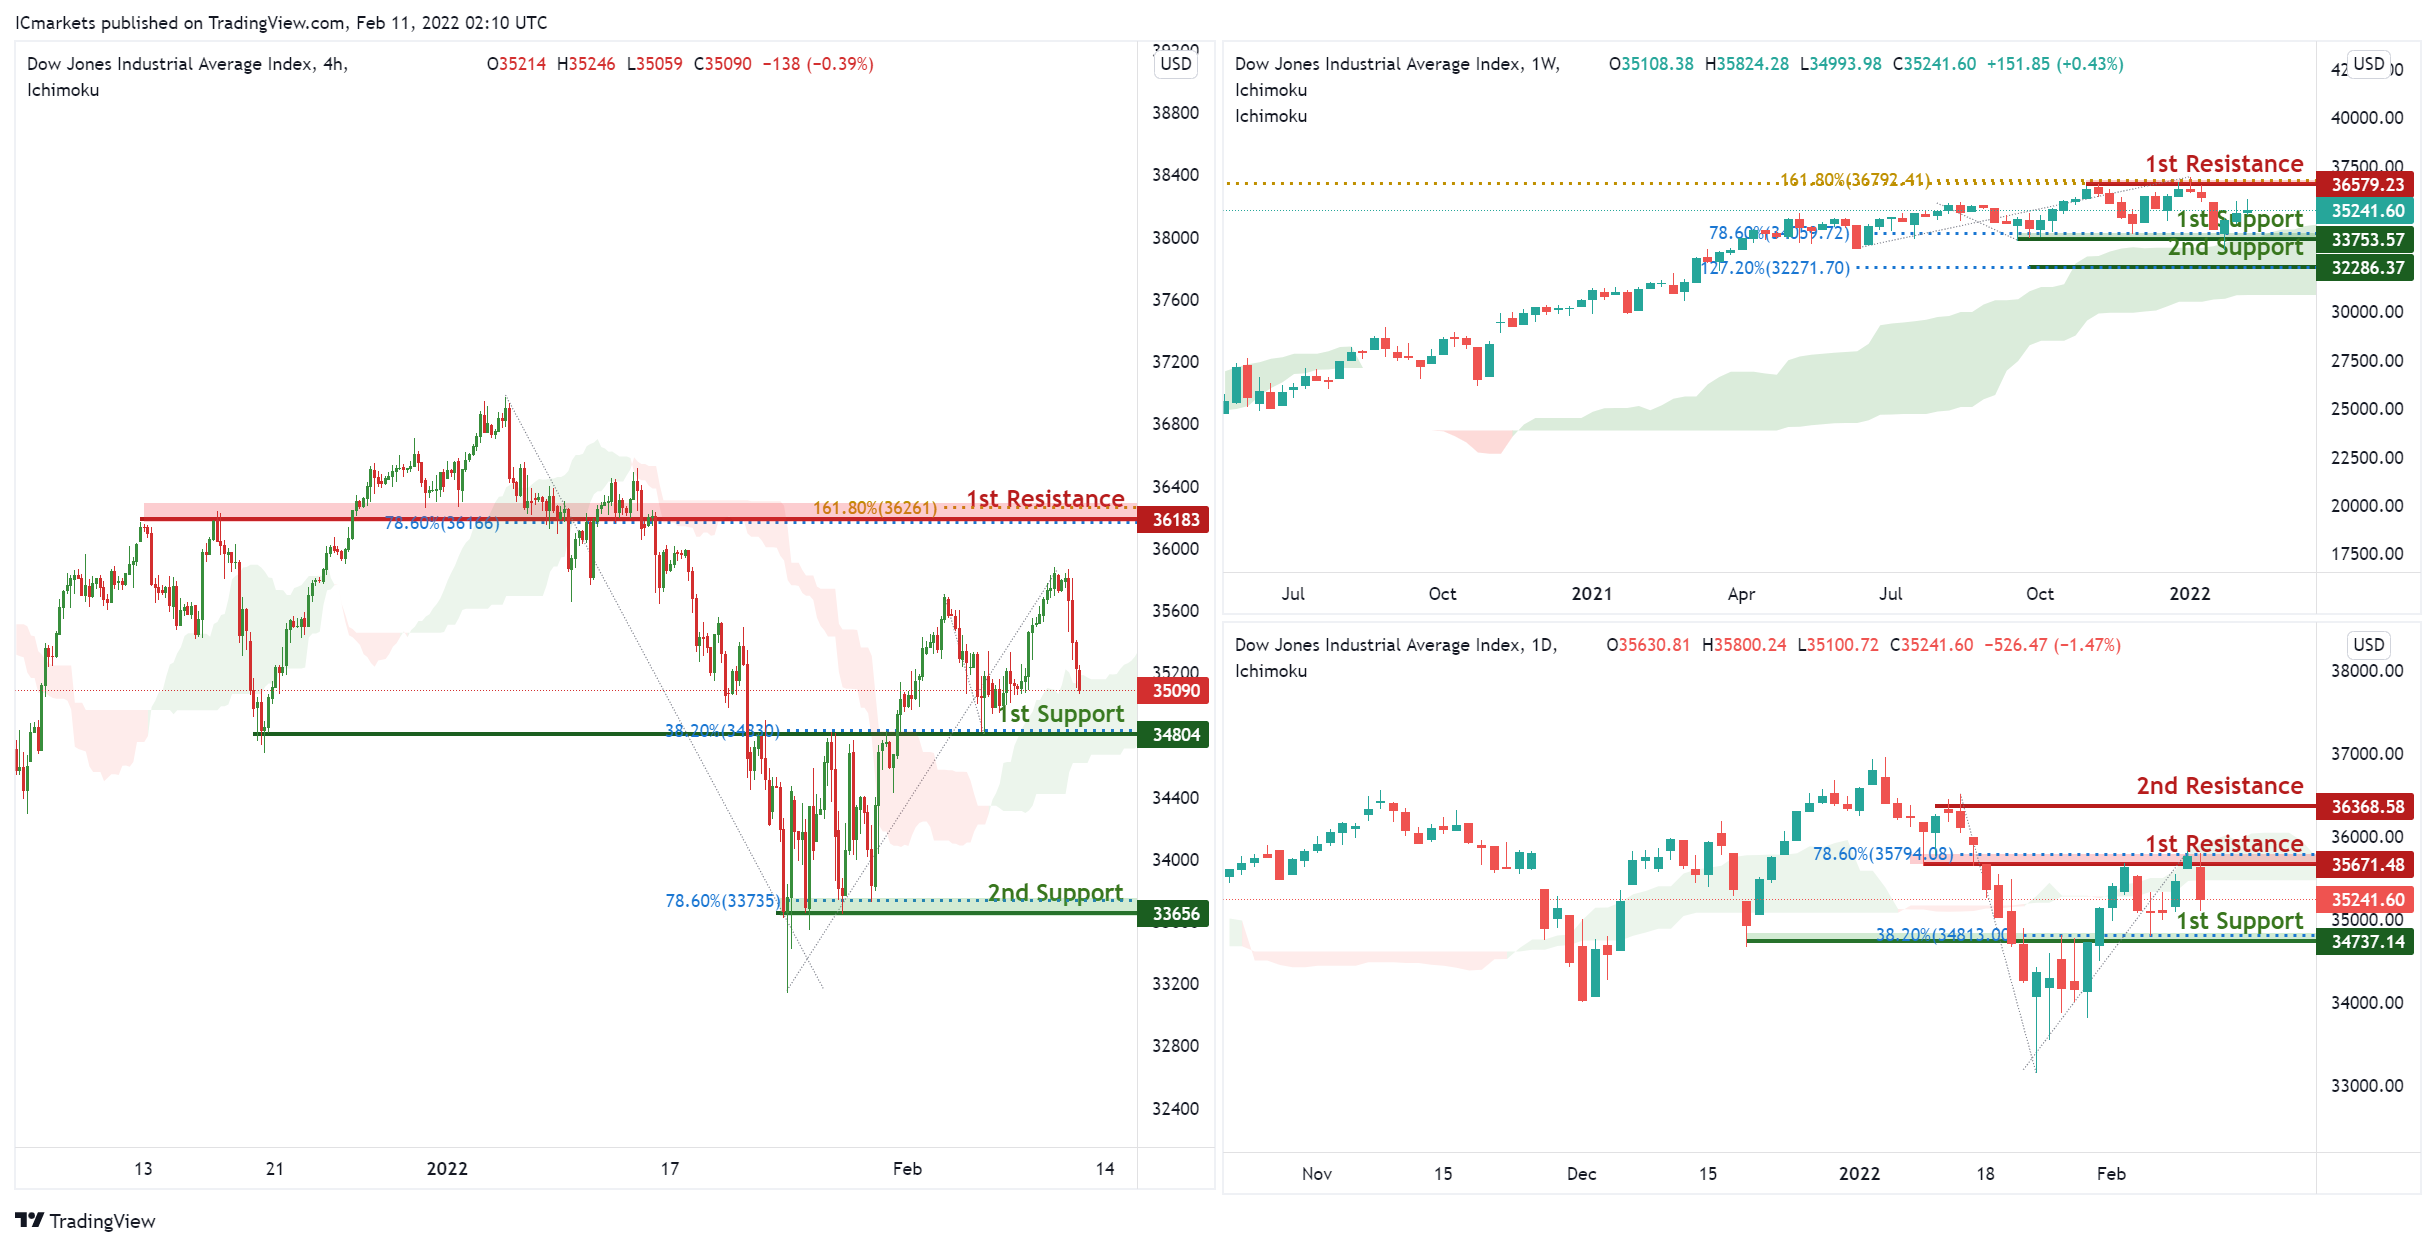
On the Weekly, with price moving above the ichimoku cloud, signifying an overall bullish momentum. We can expect price to rise to our 1st resistance at 36579 in line horizontal graphical swing high resistance and 161.8% Fibonacci extension from our 1st support in line with horizontal swing low support at 33753. Alternatively, price may break 1st support structure and head for 2nd support, which coincides with horizontal swing low support at 32286.
On the Daily, with price moving above the ichimoku cloud, signifying an overall bullish momentum. We can expect price to rise to our 1st resistance at 36251 in line horizontal graphical swing high resistance and 161.8% Fibonacci extension from our 1st support in line with horizontal overlap support at 35680. Alternatively, price may break 1st support structure and head for 2nd support, which coincides with horizontal swing low support at 34978.
On the H4, with price moving above the ichimoku cloud, signifying an overall bullish momentum. We can expect price to rise to our 1st resistance at 36251 in line horizontal graphical swing high resistance and 161.8% Fibonacci extension from our 1st support in line with horizontal overlap support at 35680. Alternatively, price may break 1st support structure and head for 2nd support, which coincides with horizontal swing low support at 34978.
Areas of consideration:
- H4 time frame, 1st resistance of 36251
- H4 time frame, 1st support of 35680
USD/JPY Rally Gathers Pace, 117.00 Presents Resistance
Key Highlights
- USD/JPY climbed above the 115.00 and 115.50 resistance levels.
- There is a major bullish trend line forming with support near 115.20 on the 4-hours chart.
- EUR/USD is struggling below 1.1480, and GBP/USD could rally above the 1.3600 resistance.
- The US CPI increased 7.5% in Jan 2022 (YoY), up from 7%.
USD/JPY Technical Analysis
The US Dollar formed a base above the 113.50 level against the Japanese Yen. USD/JPY started a major increase and cleared many hurdles near 114.80.
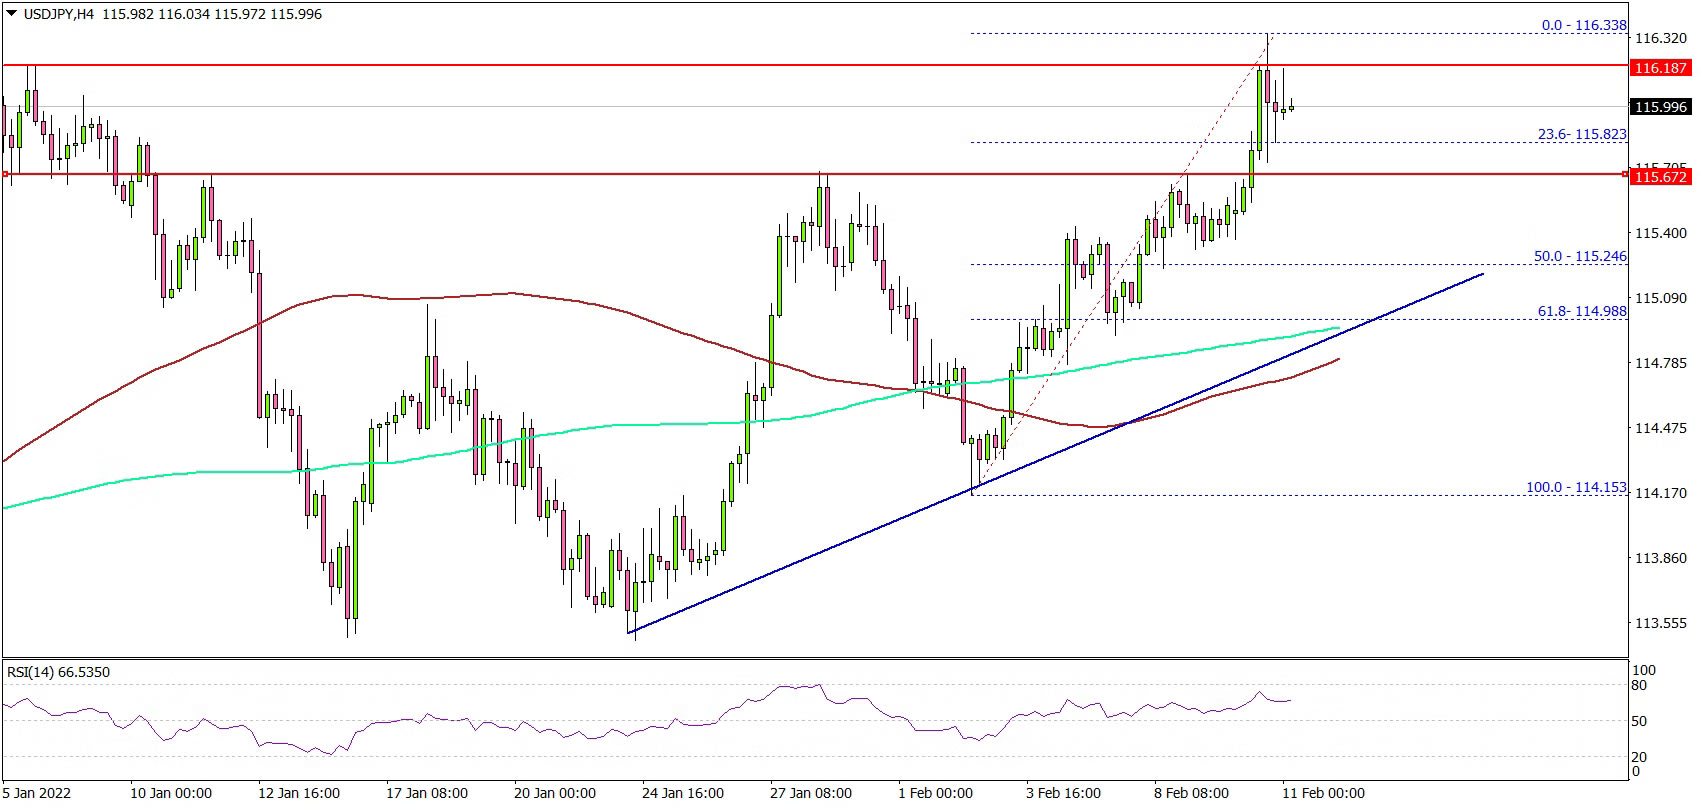
Looking at the 4-hours chart, the pair even settled above the 115.00 level, the 100 simple moving average (red, 4-hours), and the 200 simple moving average (green, 4-hours).
The pair gained pace for a move above the 115.50 resistance zone. It even spiked above the 115.80 level. However, the pair is now facing a strong resistance near the 116.20 and 116.50 levels. If there is a close above 116.50, the pair could surge towards 117.00 or 117.50.
If not, there could be a downside correction to 115.20. There is also a major bullish trend line with support near 115.20 on the same chart. Any more losses might push the pair to 114.50.
Fundamentally, the US Consumer Price Index for Jan 2022 was released yesterday by the US Bureau of Labor Statistics. The market was looking for an increase of 7.3% compared with the same month a year ago.
The actual result was above the market forecast, as the US Consumer Price Index increased 7.5% in Jan 2022 (YoY). The monthly change was +0.6%, similar to the last reading.
Looking at EUR/USD, the pair is still struggling to clear the 1.1480 resistance level. Similarly, GBP/USD must settle above 1.3600 to start a fresh increase.
Economic Releases
- UK GDP for Q4 2021 (QoQ) - Forecast +1.1%, versus +1.1% previous.
- UK Industrial Production for Dec 2021 (MoM) - Forecast +0.1%, versus +1.0% previous.
- UK Manufacturing Production for Dec 2021 (MoM) - Forecast +0.1%, versus +1.1% previous.
- German Consumer Price Index for Jan 2022 (YoY) – Forecast +4.9%, versus +4.9% previous.
- German Consumer Price Index for Jan 2022 (MoM) – Forecast +0.4%, versus +0.4% previous.