

Sample Category Title
NIESR forecasts 1.0% growth in UK GDP in Q1
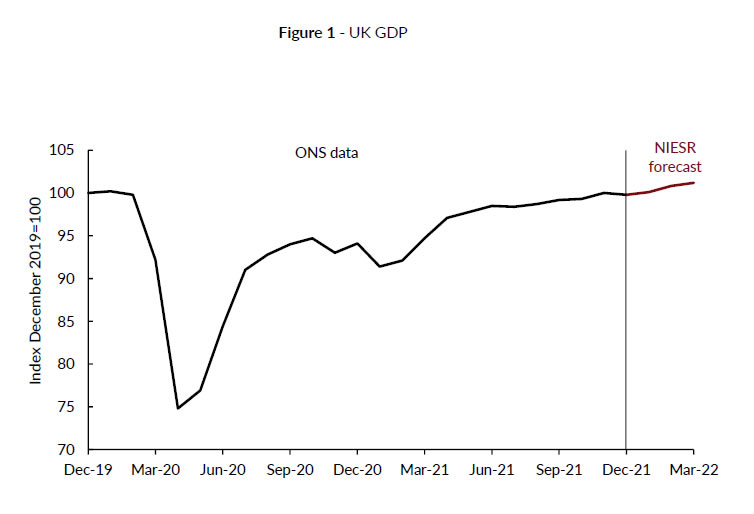
NIESR forecast growth of 1.0% in UK GDP in Q1. It said that economic impact of Omicron was "far smaller than" previous two waves. The -0.2% fall in December GDP was also better than consensus forecasts, suggesting the "possibility of a positive reading in January.
"The economic impact of Omicron was far smaller than that of either of the two previous major waves of Covid-19: a mere 0.2 per cent fall in December was even stronger than consensus forecasts, but in line with NIESR's January GDP tracker, suggesting the possibility of a positive reading in January. Unsurprisingly, retail and hospitality contributed the most to December's fall, with the healthcare sector providing the largest positive contribution." - Rory Macqueen Principal Economist, NIESR
Ending the Week in the Red
Stock markets are ending the week in the red after investors were dealt another inflation blow on Thursday which dampened sentiment once more.
We were just starting to see confidence building in the markets, with investors seemingly coming to terms with the prospect of four or five rate hikes this year. But the relentless and broad-based price rises in the US delivered yet another hammer blow and ruined any momentum that had been building into the report.
We're now entering into quite uncomfortable territory and the very real prospect of multiple rate hikes before the summer as well as a 50 basis point increase to kick things off in March.
What's more, the Fed's Bullard even floated the idea of unscheduled meetings to raise rates and respond more quickly to the data, which seems rather radical. But then, inflation is at a 40-year high, almost four times the Fed's target, and is accelerating faster than most continue to anticipate.
A 50 basis point hike in March is now backed quite heavily in the markets - even though a number of policymakers are still unconvinced - with further hikes following at consecutive meetings after that.
What we could see is the Fed take a similar approach to what the Bank of England appears to be doing and line up a series of increases until the summer, then hope inflation peaks late in Q1/early Q2, as they anticipate, and falls significantly enough after to considerably ease the pressure.
Markets are not erring on the side of hope and are pricing in plenty more hikes in the second half of the year on the belief that the central banks will once again prove too optimistic. While that may lead to plenty more instability in the stock markets over the next couple of months, it could become a useful tailwind in the second half of the year if inflation does fall considerably after peaking and allow for some of the interest rate positionings to be unwound.
UK weathers omicron storm well in December
The UK grew at its fastest annual rate since the second world war last year as it rebounded strongly from a sharp downturn the year before. GDP remains slightly below its pre-pandemic peak though, lagging behind a number of other countries including the US, France, and Canada that have since surpassed those levels.
The economy fared better than expected in December while the services sector was naturally hit hard by the onset of omicron. The start of the new year brings its own challenges, with the cost of living crisis - exacerbated by tax increases in March - becoming a drag on the economy, while omicron likely continued to weigh in January.
None of this is likely to influence the Bank of England over the coming months as the central bank tackles high inflation head-on. Two rate hikes at consecutive meetings and a strong hint at more in the months ahead will compound the squeeze on households and businesses this year. Although that is certainly preferable to the alternative.
Oil jumps as IEA confirms tight market conditions
Oil prices are rallying once more as the IEA raised forecasts for demand this year and confirmed that OPEC+ missed its output targets again in January and by an even wider margin of 900,000 barrels. The group acknowledged that the market is tight right now while highlighting that a nuclear deal between the US and Iran could release 1.3 million barrels of supply. There was also a nod to Saudi Arabia, where available spare capacity is apparently concentrated. Not that the White House is having any luck convincing them to unleash it.
Gold slips after inflation data
A jump in yields on Thursday on the back of the inflation data stopped gold from recording the eighth day of gains in nine. The yellow metal gave up initial gains to end the day a little lower as markets priced in a sixth hike this year in the US and yields elsewhere also rose.
Gold has remained a favourite recently even as rate hike expectations have increased, probably benefiting from its inflation hedge reputation, but there's surely going to come a point when so many hikes are priced in that it will lose some appeal. That's not to say it will suddenly tumble but gains may become limited, as we've seen in recent months around these levels.
Bitcoin continues to show resilience
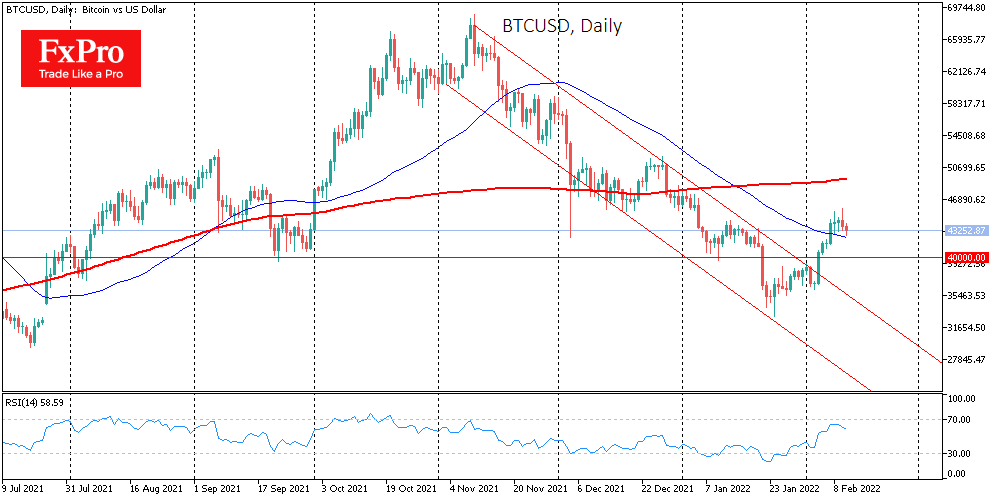
Bitcoin has once again shown some resilience in these volatile markets, as it continues to linger around $45,500 resistance. Its link with risk assets over the last month or so appears to have weakened over the last week or two and we're seeing that again over the last 24 hours. While stocks are coming under heavy pressure, especially the Nasdaq, bitcoin has only slightly pared gains after seeing some profit-taking around key resistance. That could give the crypto crowd plenty of confidence in the coming weeks even if broader risk appetite remains shaky.
Bitcoin Sold Out on US Inflation
Cryptocurrencies were under the pressure of strong data on inflation in the United States on Thursday, which has updated 40-year highs. Such values can force the Fed to raise interest rates faster, which is negative for all risky assets, including cryptocurrencies.
Bitcoin showed high volatility during trading, updating early January highs above $45,800 under the influence of a weakening dollar. However, towards the end of the day, the first cryptocurrency began to decline along with stock indices: the S&P500 lost 1.8%, the high-tech Nasdaq fell 2.1%.
The crypto-currency index of fear and greed for the second day is exactly in the middle of the scale, at around 50 (neutral). However, now the stock markets are having an increased impact on the dynamics of Bitcoin and Ethereum, in which the prospects for monetary policy are being reassessed. The corresponding index is now in the fear territory, near the 37 mark.
Meanwhile, Bitcoin is being bought back on dips towards the 50-day average, which keeps the picture bullish. However, in the event of a prolonged sale of shares, the first cryptocurrency will not hold and risks pulling the entire market with it.
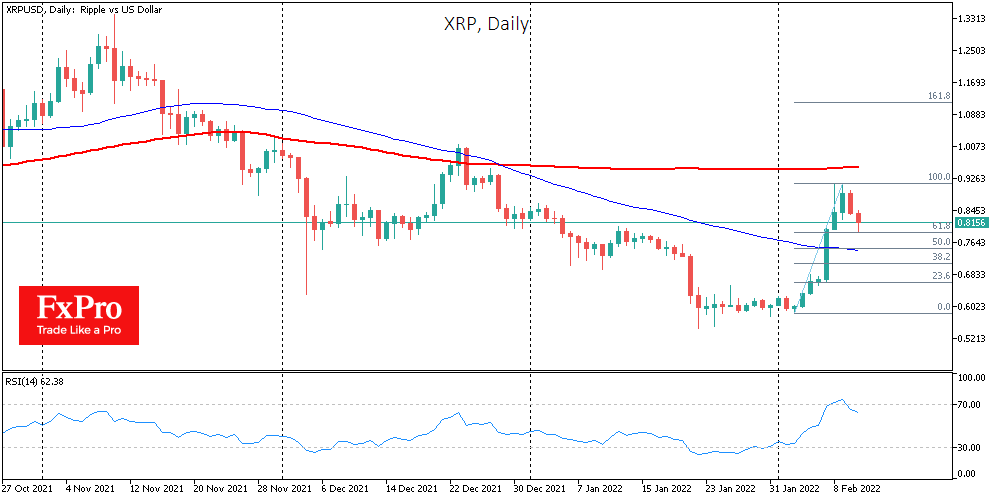
XRP and Solana have both lost around 6% over the past 24 hours, falling amid a general reduction in risk traction in the markets and the two largest cryptocurrencies.
Despite the apparent depth of the pullback, XRP remains 32% above levels from a week earlier, and the current retreat is well within Fibonacci technical correction from the rally of the past eight days.
A drop below $0.78 would signal a deeper correction and open a quick path to $0.75. If all of February’s gains are entirely nullified in the coming week and quotes pull back to below $0.60, it would be safe to speak of a new depressed period with a long-term downside potential of 50% to $0.3.
The technical picture in Solana and Polkadot is worse, as a shadow hangs over them. The rise from January 28th to February 7th looked like a technical rebound after being oversold since November. But this growth momentum is quickly fading. We can say for this coin that without positivity for the overall market, it will continue to lose ground faster than BTC and ETH.
EUR/USD and AUD/USD Look for Correction: Elliott Wave Analysis
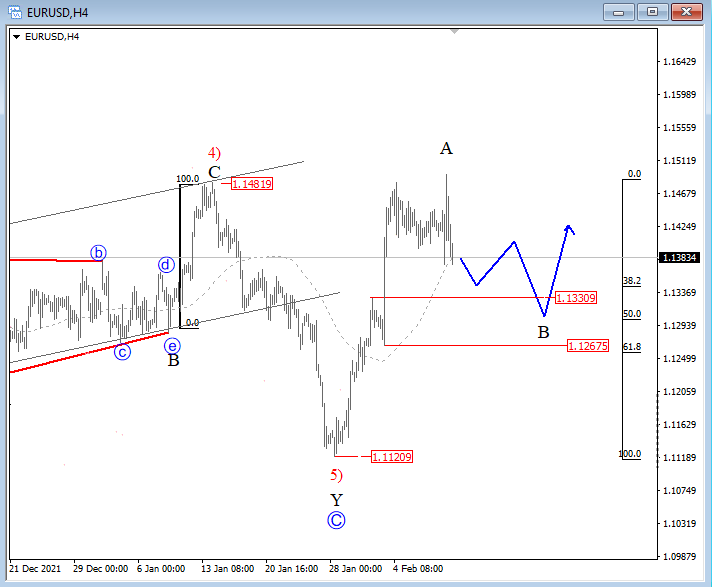
After the first bearish reaction on the USD after US CPI yesterday, the currency turned down later during the US session. Probably it was due to higher 10 year US yields. Stocks also came down, which is supportive for the buck. EURUSD spiked to a new high but then finished the day lower, so it appears temporary top is in place at 1.15 and that new three wave set-back is now underway.
EUR/USD 4h Elliott Wave analysis
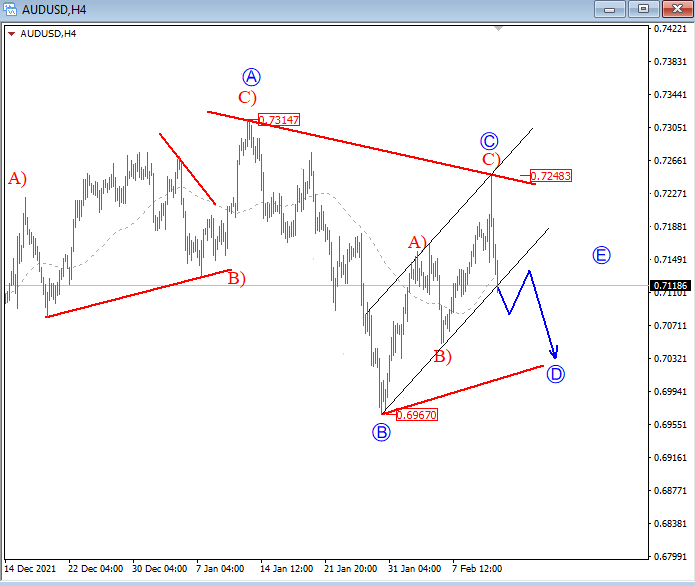
AUDUSD firstly hits new high yesterday and then stopped at 100% Fib equality level. More important, a turndown is now sharp and impulsive so ideally, it's part of a higher degree three-wave structure that can send the pair again close to 0.7
AUD/USD 4h Elliott Wave analysis
NZD Dips as Inflation Expectations Rise
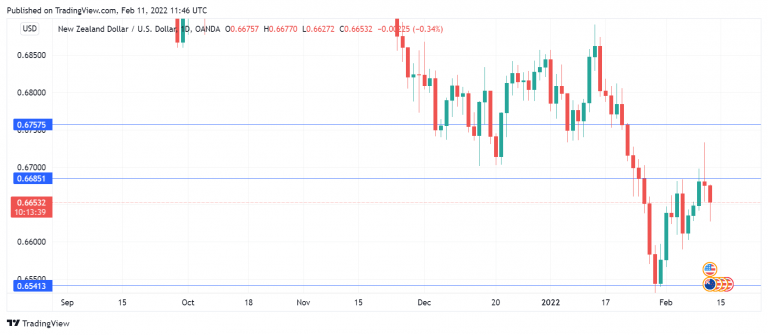
The New Zealand dollar is down 0.38% on the day, as it trades at 0.6650 in the European session.
NZD/USD went for a ride on Thursday, rising close to 1% before retreating and giving up these gains. This was a common thread for most of the major currencies, as the US dollar softened after the hot US inflation report but managed to recover most of these losses by the end of the day.
RBNZ Inflation Expectations rises
New Zealand has not been immune to surging inflation. CPI climbed 5.9% in Q4 YoY, its highest level since 1990. The RBNZ Inflation Expectations survey indicated that consumers expect inflation to continue to rise. This finding is not surprising but will be of concern to the central bank since inflation expectations can manifest into actual inflation. The survey found that one-year ahead inflation expectations rose to 4.4% in Q4, up from 3.7% in Q3. For two years, consumers expected inflation at 3.27%, up from 2.96% previously.
The RBNZ has embarked on a series of rate hikes aimed at normalizing policy, and an increase in inflation expectations will add pressure on the central bank to tighten more aggressively in order to lower inflation to the bank’s target of 1%-3%. The bank holds a policy meeting on February 23rd and is widely expected to hike rates. The recent hikes have been in increments of 25 basis points, but with no signs that surging inflation will ease anytime soon, policymakers may feel that a strong dose of medicine in the form of a half-point rise in rates is warranted.
In the US, inflation has reached 40-year highs and shows no signs of easing, raising speculation that the Fed will need to become more aggressive in its tightening. FOMC member Loretta Mester said on Wednesday that the Fed needed to act to tame inflation, but she didn’t see a compelling case to raise rates by a half-point at the March meeting. The markets disagree, however, and are bracing for a half-point move. CME’s FedWatch indicates has gauged the likelihood of a 0.50% hike in March at 96%, up from just 33% earlier in the week, before the hot US inflation report.
NZD/USD Technical
- NZD/USD has support at 0.6541 and 0.6469
- 0.6685 is a weak resistance line, followed by 0.6757
GBPUSD Trendless Despite Growing Bullish Forces
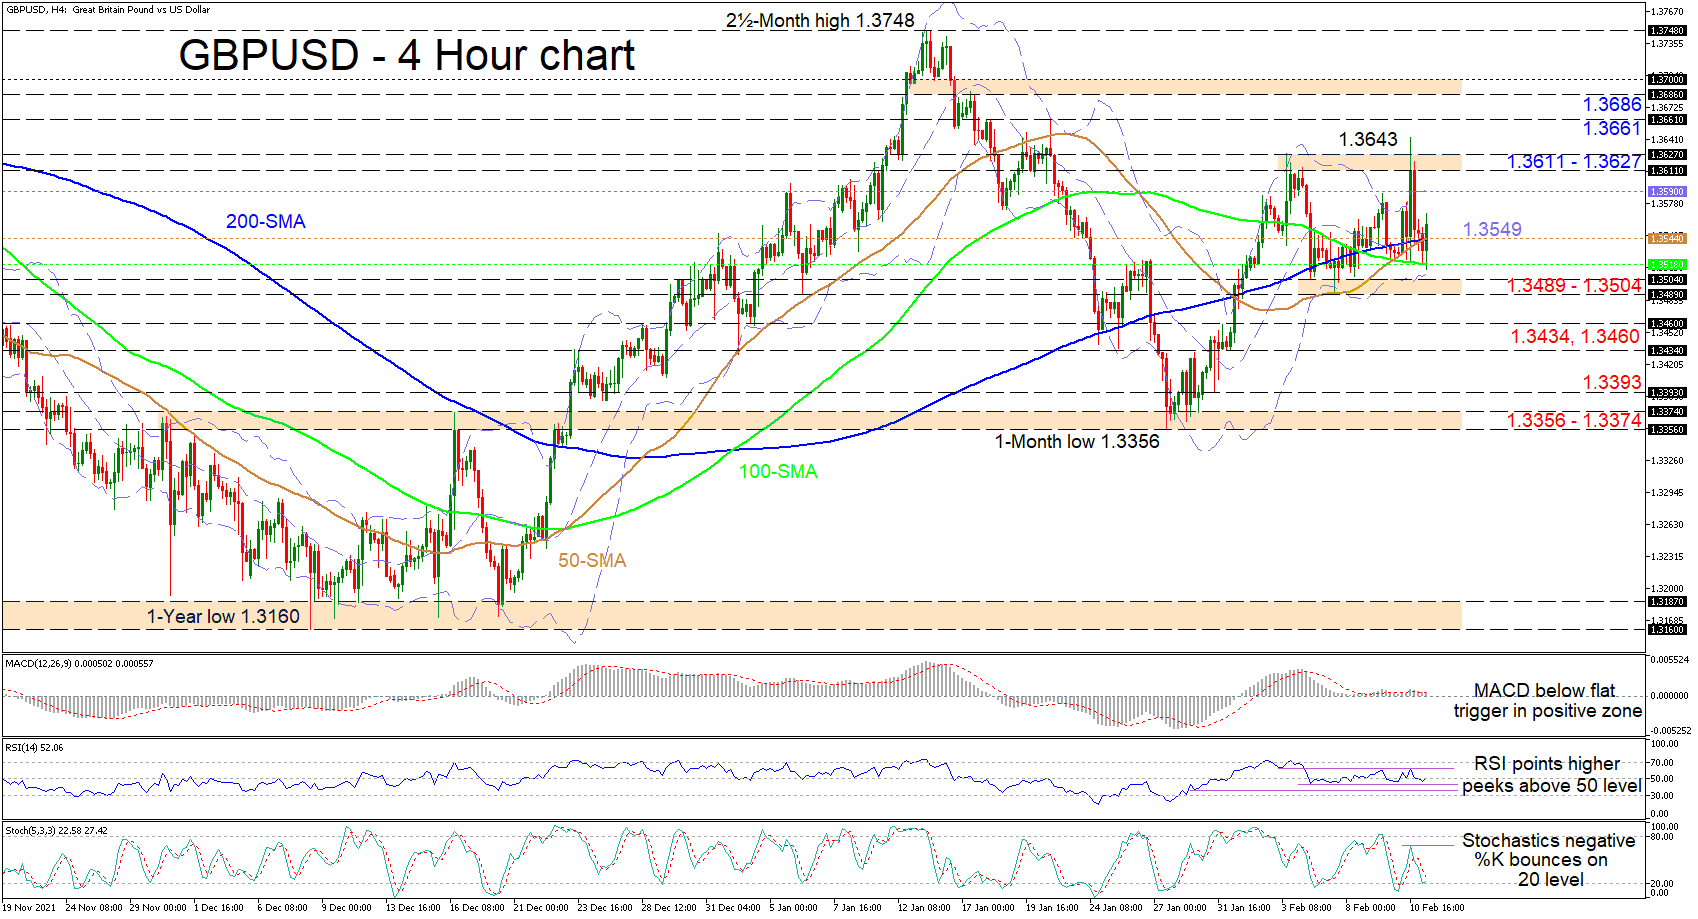
GBPUSD buyers have resurfaced around the 100-period simple moving average (SMA) after the pair’s recent retreat from a 1.3643 spike. Currently, the SMAs have tangled and are not indicating a clear message in terms of a price direction. That said, the 50-period SMA has regained its incline and has just crossed above the 200-period SMA, tilting the directional scale in favour of the upside.
The short-term oscillators are indicating that driving momentum in the pair has practically disengaged. The MACD is sandwiched between its neutral threshold and the flattened red trigger line, which is a tad above the zero mark. The RSI has marginally overstepped the 50 level, while the uptick in the stochastic %K line is hinting that the negative charge of the oscillator is weakening. As such, both are presently implying that buyers are slightly in the lead.
In the positive scenario, if the price gains more legs above the SMAs and the mid-Bollinger band at 1.3549, buyers may face the next positive hindrance at the upper Bollinger band at 1.3590. Should buyers keep at it, upside pressures could emanate from the nearby 1.3611-1.3627 resistance band, where the former level being the February 3 high, allowed only a price spike to 1.3643 before the pair surrendered 100 points back to the SMAs. That said, if the bulls overcome this barricade and stretch beyond the 1.3643 level, they could then confront the 1.3661 barrier before pursuing the 1.3686-1.3700 resistance border.
Alternatively, if selling interest intensifies and the pair sinks back beneath the SMAs around 1.3544 and 1.3518, the lower Bollinger band - coupled with the 1.3489-1.3504 support foundation - could once again attempt to dismiss negative tendencies from gaining the upper hand. However, failing to do so, the 1.3460 and 1.3434 obstacles may then take heavy fire. Dropping past these barriers too, the bears could challenge the 1.3393 trough and the 1.3356-1.3374 support border that extends back to the end of November 2021.
Summarizing, GBPUSD is sustaining a minor neutral-to-bullish tilt above the 1.3489-1.3504 base, and for the bullish mood to bolster, the price would need to float above the 1.3611-1.3627 resistance. Instead, for a bearish tone to return, a profound dive in the price would need to pierce beneath the 1.3356-1.3374 support.
US 100 Hits Resistance
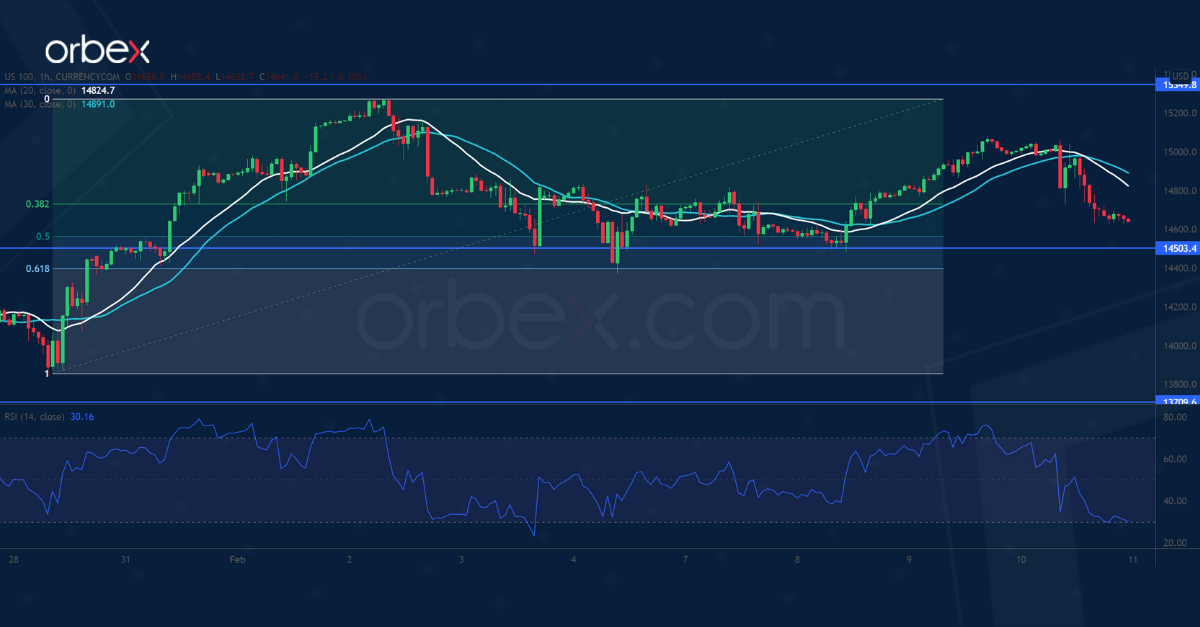
The Nasdaq 100 struggles as record-high US inflation exacerbates rate hike concerns.
The previous rebound has eased selling pressure but hit resistance under 15350. The subsequent pullback bounced off the 61.8% Fibonacci retracement level (14400), which suggests buyers’ strong interest in keeping the index afloat.
Sentiment is still a tad cautious unless the bulls clear the said hurdle. Then the psychological level of 16000 could be within reach. 14500 is a key support in case of an extended consolidation.
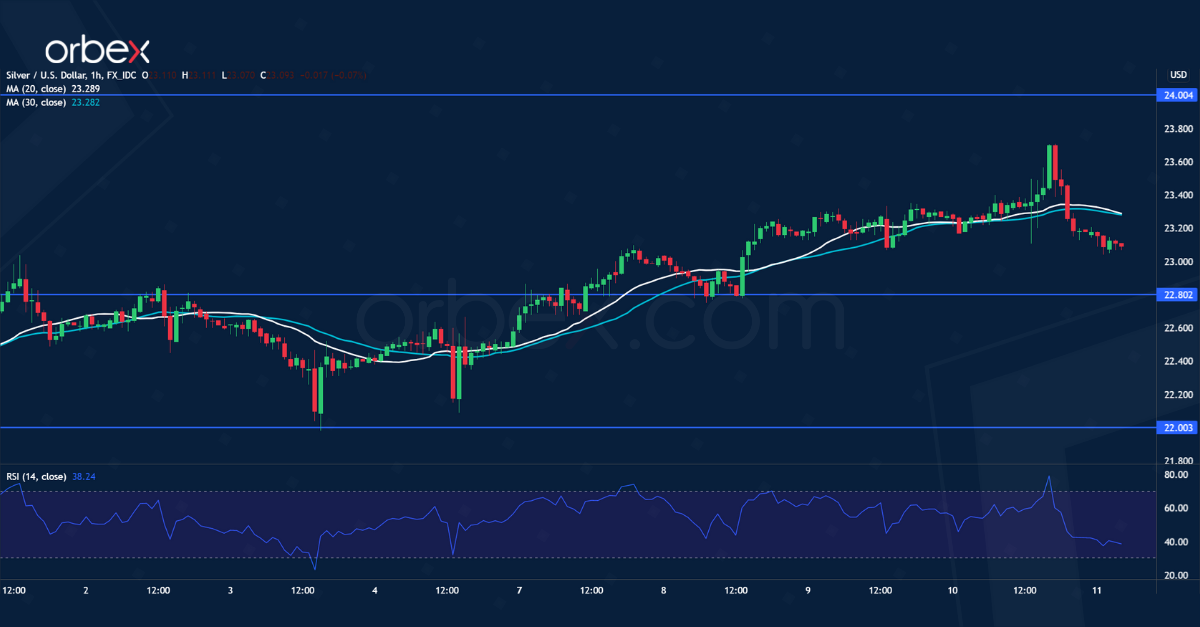
XAG/USD Seeks Support
Bullions fell back after US Treasury yields soared over hot US inflation data. The psychological level of 22.00 has proven to be a solid demand area.
A break above 23.00 has forced sellers to cover, paving the way for an upward extension. 24.00 from a previous rectangle consolidation is the next resistance.
A bullish breakout would bring silver back to this year’s high at 24.70. On the downside, the resistance-turned-support at 22.80 could see buying interest in case of a retracement.
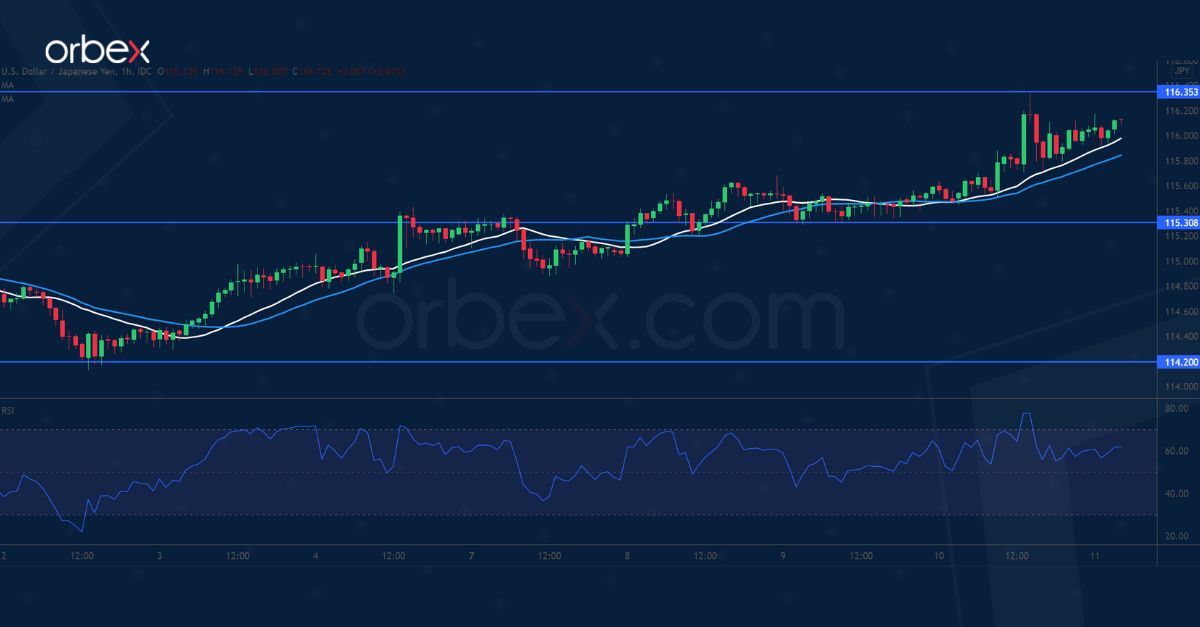
USD/JPY to Test Major Resistance
The US dollar surged after consumer prices hit a 40-year high. Higher lows and then a close above the recent peak at 115.65 is an indication of strong bullish pressure.
This breakout has propelled the greenback to January’s high at 116.35. Its breach could trigger a runaway rally and resume the uptrend in the medium term.
An overbought RSI on the hourly chart may briefly restrain the bullish fever. 115.30 is the closest support and the bulls may see a pullback as an opportunity to stake in.
DIHK downgrades Germany growth forecasts to 3.0% in 2022
Germany's Chambers of Industry and Commerce (DIHK) lowed 2022 growth forecasts from 3.6% to 3.0%. That is, the economy will probably not reach the pre-crisis level until middle of the year.
"The economy is holding its breath. There is still a cautiously optimistic mood in the companies. However, many do not know how things will continue due to great uncertainty," said DIHK Managing Director Martin Wansleben.
"In addition to the Corona crisis and delivery bottlenecks, the biggest stress factors are above all the sharp rise in energy and raw material prices and the shortage of skilled workers. In addition, there are further expected cost increases due to the transformation in climate protection. It is still an open question, especially for companies that are in international competition how such a compensation should work. Many fear a deterioration of their position on the world markets."