Sample Category Title
Bitcoin is in Demand of Institutionalists
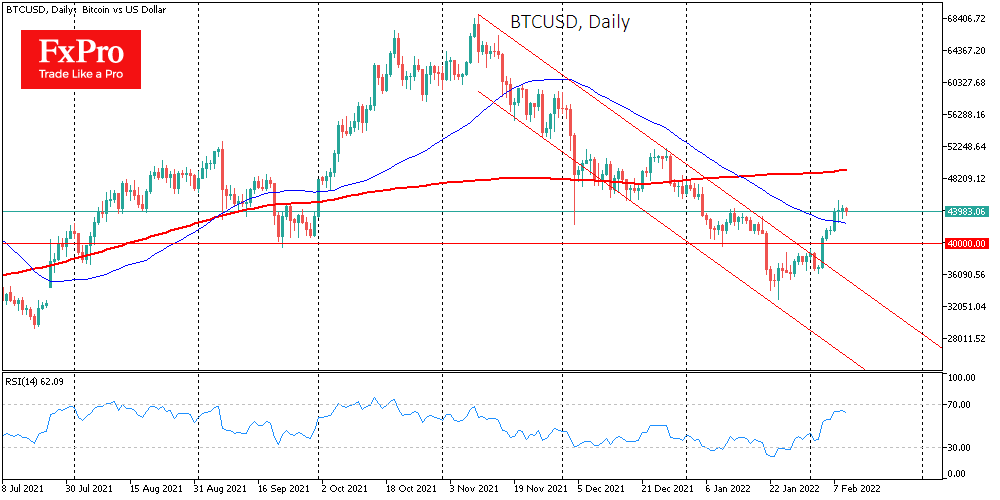
On Wednesday, the cryptocurrency market decided to push and grow amid the rise of US stock indices. The S&P 500 gained 1.5%, while the high-tech Nasdaq gained 2.1%. All this helped Bitcoin shrug off the profit-taking sentiment at the start of the day and close in a slight plus. On the intraday chart, you can see purchases at the close of the American session, which clearly demonstrate the interest of the institutionalists in this region.
The benchmark cryptocurrency continues to be in demand after strengthening above the 50-day moving average, which confirms the breaking of the downtrend of the previous three months. The RSI indicator on the daily charts is now at 61, still far from the overbought zone, confirming that the market is still far from overheating.
For the third week in a row, institutional participants have been investing in crypto funds, according to CoinShare. Why did they start doing this before the January meeting of the Fed, when no one believed in the BTC reversal.
Crypto-whales also bought bitcoin after the fall. According to Santiment, they have purchased 220,000 BTC in the last seven weeks.
On Thursday, US inflation data will be released, which will shed light on how quickly the Fed will raise rates. If inflation accelerates, all risky assets, including cryptocurrencies, may suffer significantly.
Overall, Bitcoin added 0.5% on Wednesday, ending the day around $44,500. Ethereum rose 3.8%, other leading altcoins from the top ten also showed growing dynamics from 0.2% (Terra) to 5.2% ( XRP).
The total capitalization of the crypto market grew by 2.2% over the day, to $2.14 trillion. Altcoins showed outpacing growth, which led to a decrease in the Bitcoin dominance index by 0.4%, to 39.6%.
WTI Futures Stands Below 7-Year High and 90.00
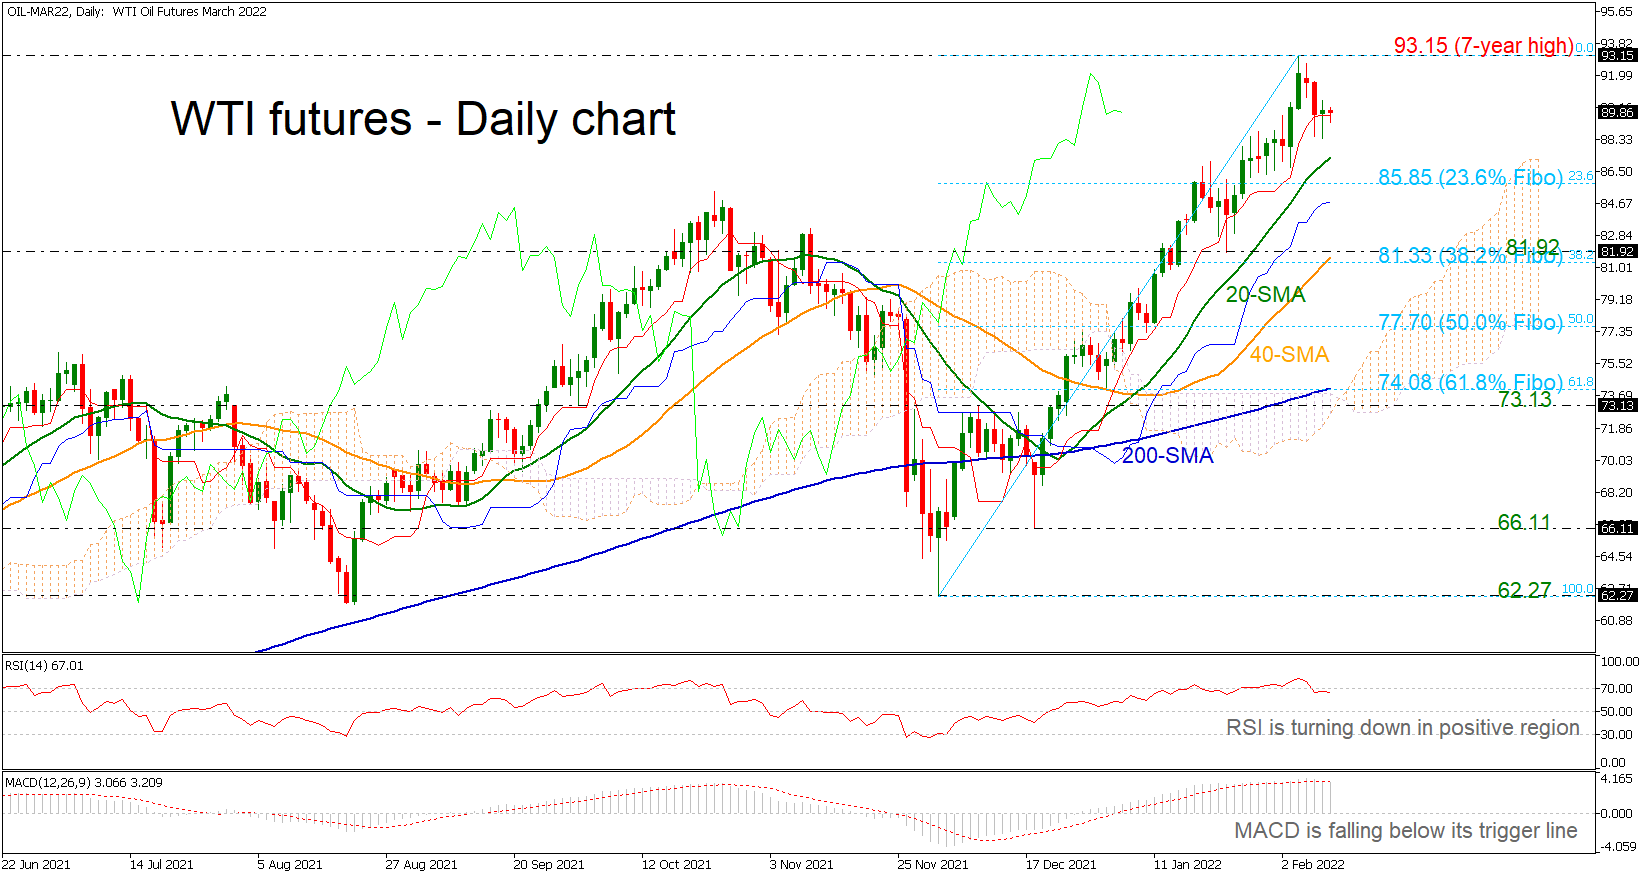
WTI crude oil futures are struggling to gain positive momentum after their pullback off the seven-year high of 93.15.
The downside reversal in the RSI and the slowdown in the MACD justify the diminishing buying pressure, though both remain well above their neutral thresholds keeping the short-term risk skewed to the upside. In trend indicators, the bullish cross between 20- and 50-day simple moving averages (SMAs) is still an encouraging signal.
Should selling forces strengthen, the Fibonacci retracement levels of the 62.27–93.15 up leg will come under the spotlight. The 23.6% Fibonacci of 85.85 could initially turn support to keep the bias on the positive side after it fall (fell) below the 20-day SMA at 87.37. Moving lower, the 81.92 barrier and the 38.2% Fibo of 81.33, which encapsulates the 40-day SMA could next add some footing ahead of the 50.0% Fibonacci of 77.70, while a break lower would put the recent upside correction under examination.
Alternatively, a close above the seven-year high of 93.15 will brighten the broader outlook, pushing the price towards the 100.00 key level. Beyond that, the rally may gear up to 107.45, achieved in June 2014.
In brief, oil prices are facing a weakening bullish bias in the very short-term; however, in the bigger picture the commodity is strongly positive, where a drop below the 200-day SMA at 74.08 is to enhance selling interest.
AUDUSD Crosses Key Barrier; Bullish Double Bottom in Progress
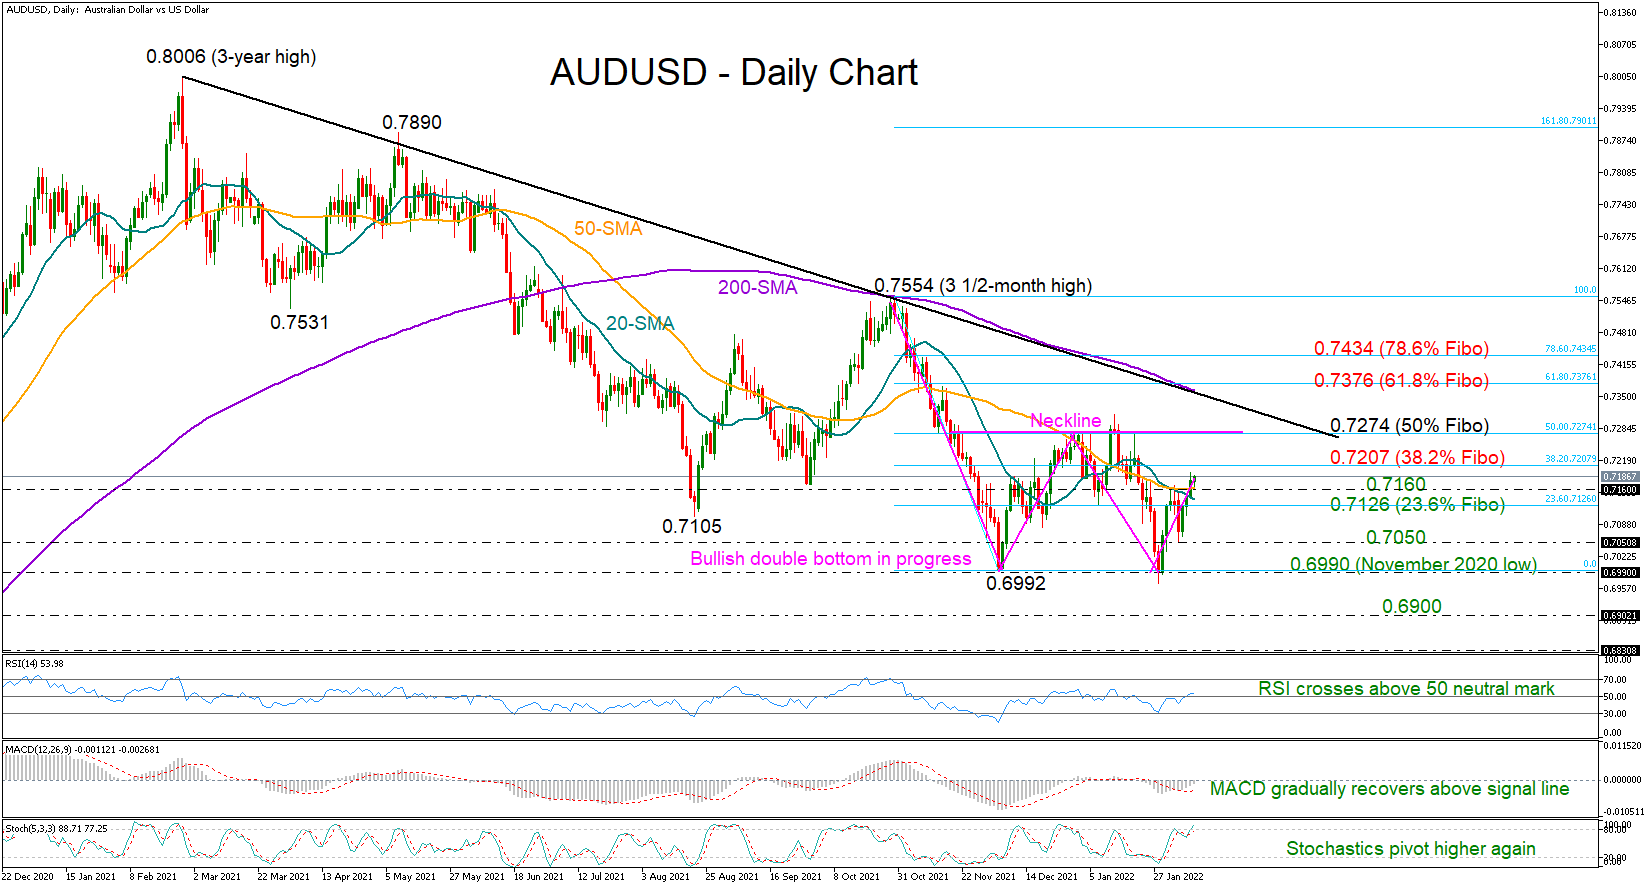
AUDUSD is in the second consecutive week of gains around 0.7180, having marginally surpassed its shorter-term simple moving averages (SMA), which had been controlling bullish forces more vitally since mid-January onwards. Notably, the pair has also overcome the restrictive 200-SMA in the weekly chart.
Of course, the soft bullish breakout still requires confirmation, but with the RSI rising above its 50 neutral mark, the MACD recovering above its red signal line, and the Stochastics pivoting northwards again, the current positive momentum in the price could further grow in the coming sessions.
Additional upside movements could initially get congested around the 0.7200 psychological mark, which overlaps with the 38.2% Fibonacci retracement of the 0.7554 – 0.6992 downleg. A step above this boundary would not bring new buyers into the market unless the recovery extends above the 50% Fibonacci of 0.7274. This area looks to be the neckline of a bullish double bottom pattern with a base at 0.6990. Hence, a significant violation at this point could trigger a more aggressive bullish wave, likely up to the crucial 200-day SMA at 0.7362.
In the bearish scenario, where the price slides back below 0.7160, the 23.6% Fibonacci of 0.7126 could immediately add some footing. Failure to bounce here could intensify selling pressures towards the 0.7050 handle, while deeper, it would be interesting to see whether the pair can ruin the bullish formation below the 0.6990 floor and run towards the 0.6900 number.
Summarizing, buying activity is expected to persist in the AUDUSD market, though only a rally above the 0.7274 bar could send meaningful directional signals.
US Oil Tests Support
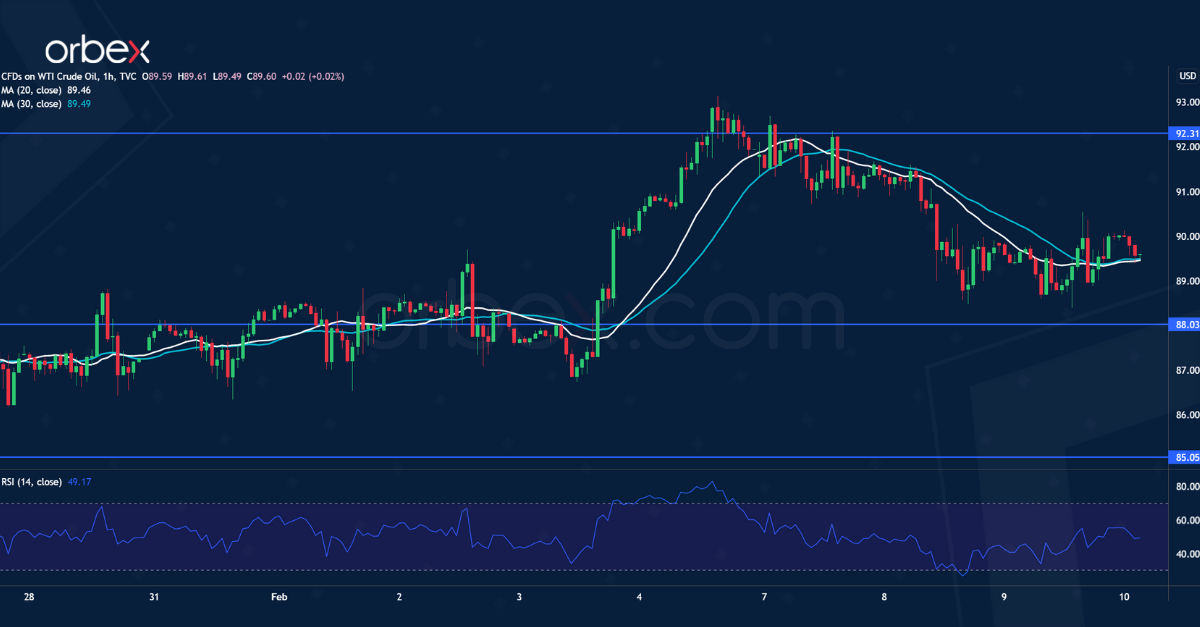
WTI crude bounces higher after the EIA reported a sharp drop in US inventories.
Price action is looking to consolidate its gains above the psychological level of 90.00. Sentiment remains upbeat though the bulls need to take a breather after the latest vertical ascent.
88.00 on the 20-day moving average is the immediate support. An oversold RSI may attract buying interest. A deeper retracement would test 85.00. A recovery above 92.30 could trigger momentum buying once again and resume the rally towards 95.00.
EUR/GBP Seeks Support
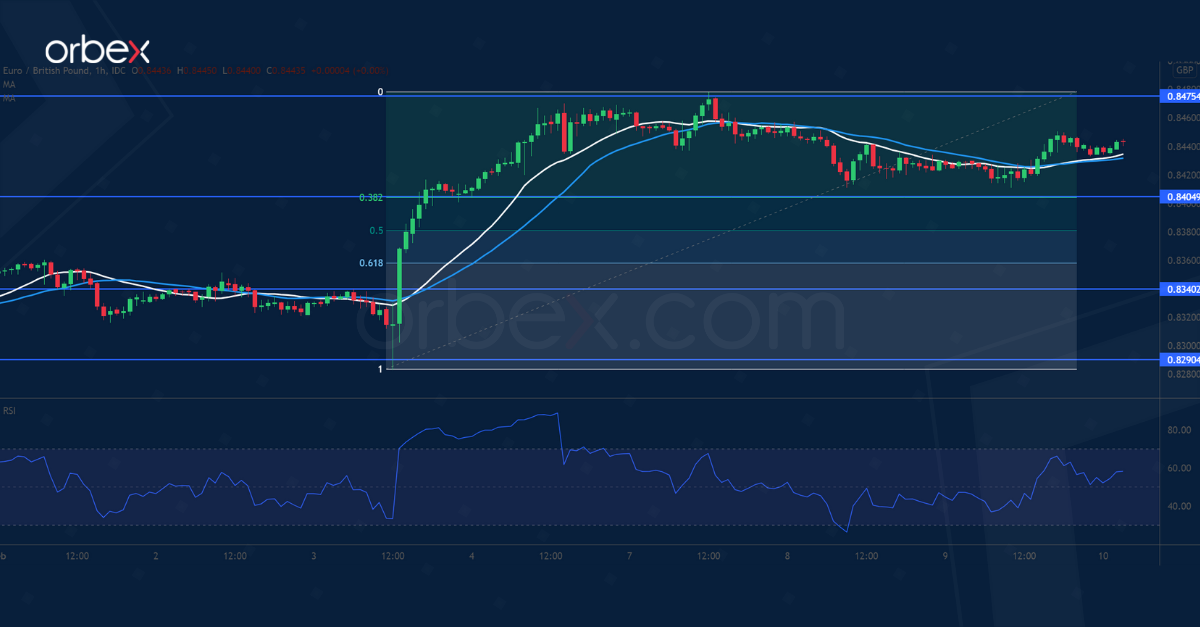
The euro consolidates gains amid mixed messages from the ECB.
The pair found support at February 2020’s low at 0.8290, and a bullish MA cross on the daily chart suggests a potential turnaround. A break above the daily resistance at 0.8405 has put the single currency back on track.
An overbought RSI led momentum traders to take profit. The current pullback is testing the 38.2% Fibonacci retracement level (0.8405) which used to be a resistance. 0.8475 is the main hurdle for the reversal to gain traction.
AUD/USD Breaks Higher
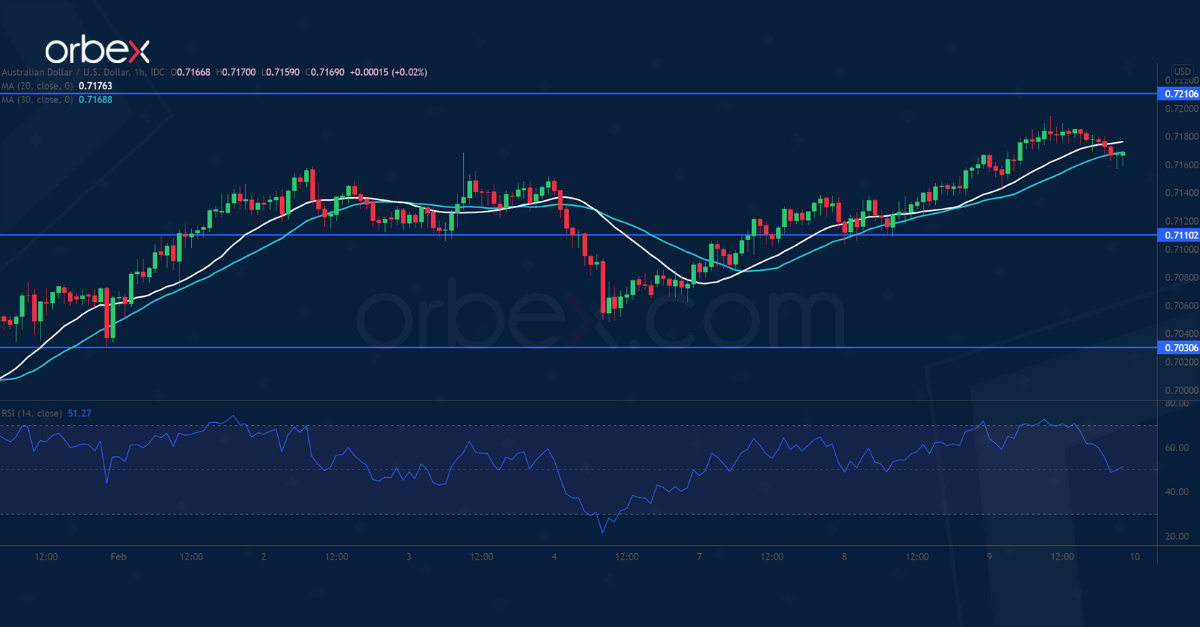
The Australian dollar climbs as traders wager on a hawkish shift from the Reserve Bank of Australia.
On the daily chart, a break above the 30-day moving average suggests improved sentiment in the short term. The pair extended its gains after it broke the supply area around 0.7170.
As sellers scramble to cover their bets, driving up bids, the rally is heading to the next resistance at 0.7210. The RSI’s overbought situation may cause a temporary pullback with 0.7110 as the first support.
If US Inflation Doesn’t Surprise on the Upside, a Retest of 1.1485 is Possible
Markets
The bond market sell-off took breather yesterday. There were no important data with investors counting down to today’s key US CPI release. Central bankers’ comments were plenty but didn’t alter the market assessment in any profound way. Fed members Bostic and Mester were on a same line, supporting a March rate hike. A 50 bps step isn’t excluded, but for now they favour a gradual approach of 25 bps at subsequent meetings. There is also a growing consensus to start the balance sheet roll-off soon and at a rather swift pace. US yields initially dropped 3-4 bps, but especially the short end soon rebounded. Investors apparently didn’t want to be wrongfooted by today’s expected multi-year high inflation. The US 2y yield still closed at a 1.36% cycle top. The longer end fared better, supported by strong investor interest at the Treasury’s $37bn 10y bond sale. At the close, the US curve again returned to a modest flattening trend with the 2y rising 2.3 bps and the 10y easing 2.3 bps. This time the real yield also eased mostly. The European yield correction had some more traction. German yields eased 5-6 bps for in the 2/10y sector. The very long end underperformed (-2.8 bps for the 30y). Equity investors embraced the calm on the bond markets. The EuroStoxx 50 gained 1.8%. US indices rose between 0.86% (Dow) and 2.08% (Nasdaq). Slightly USD supportive interest rate differentials combined with a positive risk sentiment kept the trade weighted dollar (DXY) more or less in balance (95.55). EUR/USD tried to move higher in the lower half of the 1.14 big figure, but the move had no strong legs (close 1.1425). Sterling underperformed with EUR/GBP rebounding from the 0.8415 area to close near 0.8441. BoE’s Chief economist Pill confirmed a further hiking cycle but also advocated a gradual pace.
Focus turns to the US January CPI release today. Headline inflation is expected at 0.4% M/M and 7.2% Y/Y, which would be the highest reading since 1982. Core inflation might accelerate to 5.9% Y/Y from 5.5%. The pace, especially M/M dynamics, will determine whether the Fed should consider a 50 bps hike. Yesterday’s late session rise in ST yields suggests that markets are positioned for a high figure. So there could be some further ST consolidation after the recent yield rise. If so, the room for a substantial yield correction stays limited. European yields yesterday eased off recent peak levels. Also here, we expect the 0.10% level for the German 10y and the 0.60% for the 10y swap to offer solid support. EUR/USD currently stabilizes in a tight 1.1395/1.1485 consolidation range. If US inflation doesn’t surprise on the upside, a retest of 1.1485 is possible. For sterling, quite some BoE tightening is already discounted. Some further sterling underperformance, both against the euro and the dollar might be on the cards. Also keep an eye at the Riksbank policy meeting. Will this ‘last man standing’ finally also leave ‘team temporary’?
News Headlines
Speaking before the Chamber of Commerce, Bank of Canada governor Macklem said the central bank won’t be on “autopilot” when it starts raising interest rates, most likely in March. He hinted that much will depend on business investment, noting that all else being equal, the less investment there is (because of inflation uncertainty), the higher rates will have to be. According to the governor, the current strong price growth (4.8% Y/Y in December) is not “the result of generalized excess demand” but mostly a supply issue. Productivity growth is essential to have non-inflationary growth, he added. Macklem said interest rates may even have to rise above the neutral rate around 2.25%. The Canadian dollar marginally strengthened to USD/CAD 1.267.
The central bank of India left the repo rate unchanged at 4%. The reverse repo remains steady at 3.35%, defying expectations of a hike to 3.55% which would have indicated a tighter policy stance to mop up excess liquidity. Indian inflation came in at 5.59%, above the 4% mid-point target, but the central bank chooses to help growth recover from the omicron hit. Governor Das said this will allow India to grow at the fastest pace among major economies. GDP growth is projected at 7.8% for the next fiscal year 2022-2023 after growing 9.2% this FY. Inflation is forecasted to ease from 5.3% this FY to 4.5%. The Indian rupee briefly went north of USD/INR 75 before paring losses to 74.93.
BoJ Kuroda: No chance to debate stimulus exit in my term
BoJ Governor Haruhiko Kuroda was quoted by Mainichi newspaper saying that "as long as our current price projection lives, there's no chance we will debate" stimulus exit before his term ends in April 2023. "We're not engaging in any debate of an exit. Doing so is inappropriate given Japan's price developments," he added.
"Japan's economic recovery is slower than that of the United States and European countries, and (consumer) inflation is just 0.5%," Kuroda said. "As such, there's no need to scale back monetary stimulus or shift toward policy tightening. Doing so is unlikely,"
The change of consumer inflation accelerating sharply was "very small" and "the key would be wage growth".
Daily Technical Analysis
EUR/USD
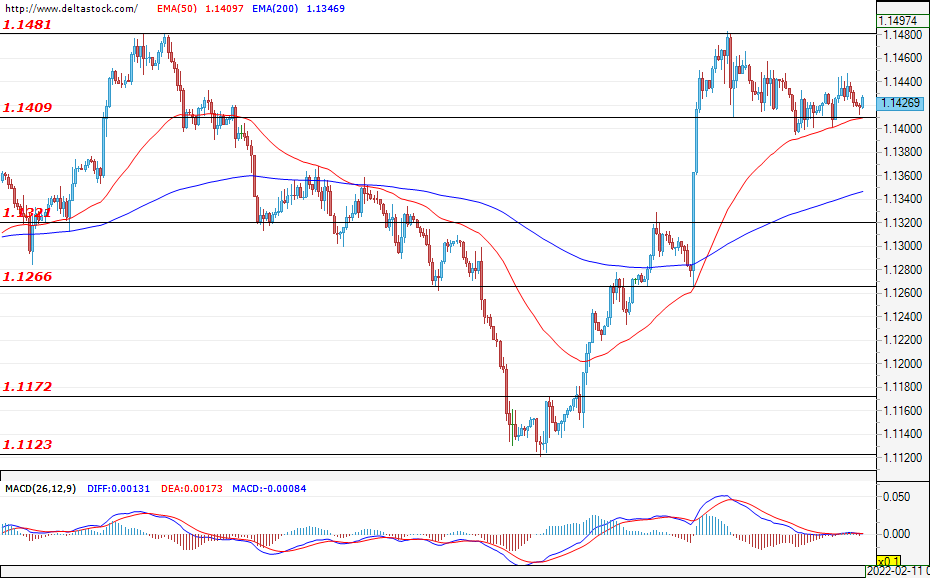
The currency pair is still in a consolidation phase, just above the support level at 1.1409. At the time of writing, neither the bulls nor the bears have managed to gain enough momentum to dominate the market. A possible attack on and a breach of the resistance at 1.1481 could paint a more bullish picture. On the other hand, a reduction in the price and a breach of the mentioned support could give the bears the necessary incentive needed to potentially lead the trade towards the next significant support level at 1.1321. During today's trading session, the most important economic news that would be of interest to the market participants will be the consumer price index data and the initial jobless claims data reports for the U.S. at 13:30 GMT.
USD/JPY
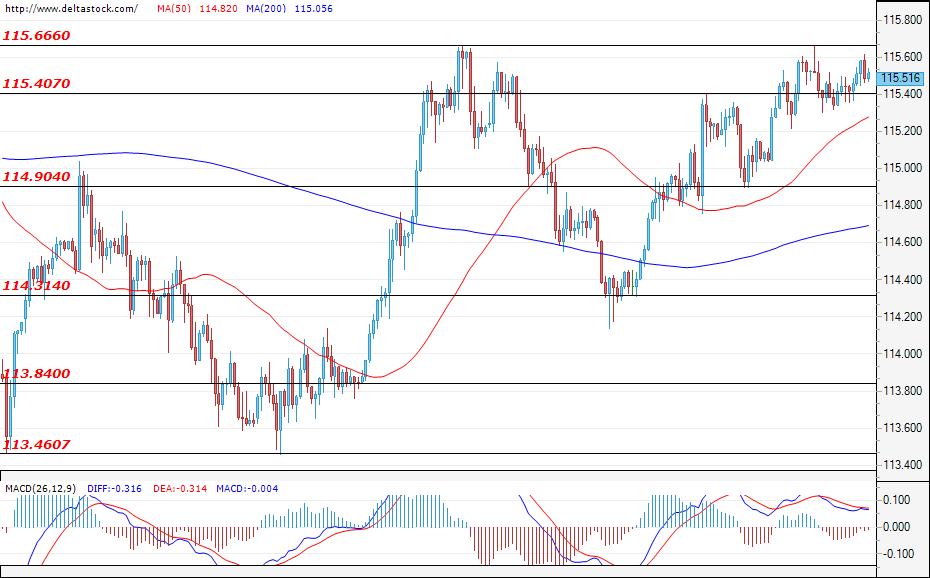
The dollar continues to gain ground against the Japanese yen during the last few days, and at the time of writing the analysis, the bulls are facing a test of the resistance zone at 115.66, which outlines the local highs for the currency pair. An unsuccessful test here could change the sentiment, and in the event of bear predominance, we could see a drop back towards the support area at 114.90.
GBP/USD
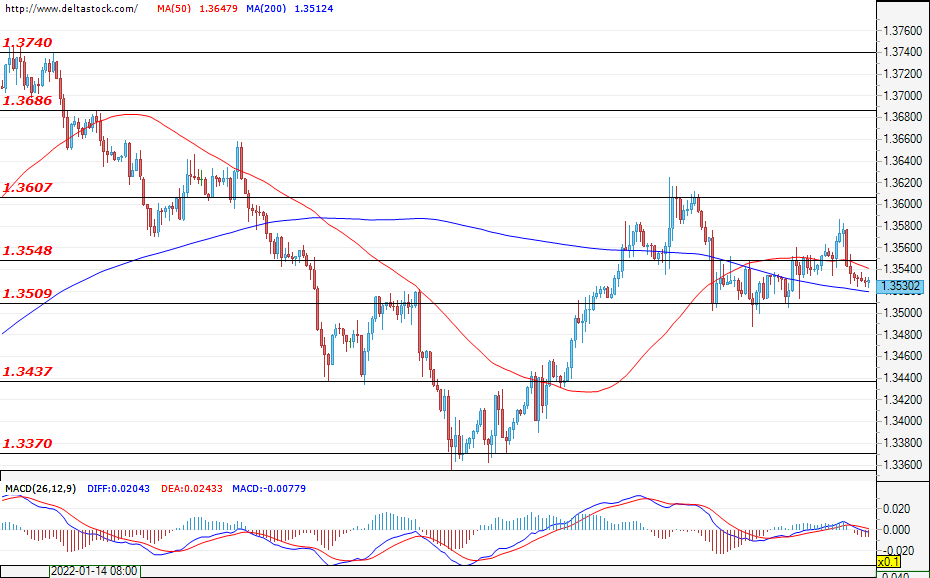
Despite the sell-off being capped at the support level at 1.3509, the bulls are still unable to gain enough momentum in order to breach the resistance area at 1.3607. We are seeing a consolidation just above the mentioned support zone, and in case of a possible bear predominance scenario and a successful breach, we could witness a deepening of the sell-off towards the next support level at 1.3370. Today, the data on the gross domestic product for the UK from 09:30 GMT could have an impact on the market, with increased volatility expected for the currency pair.
EUGERMANY40
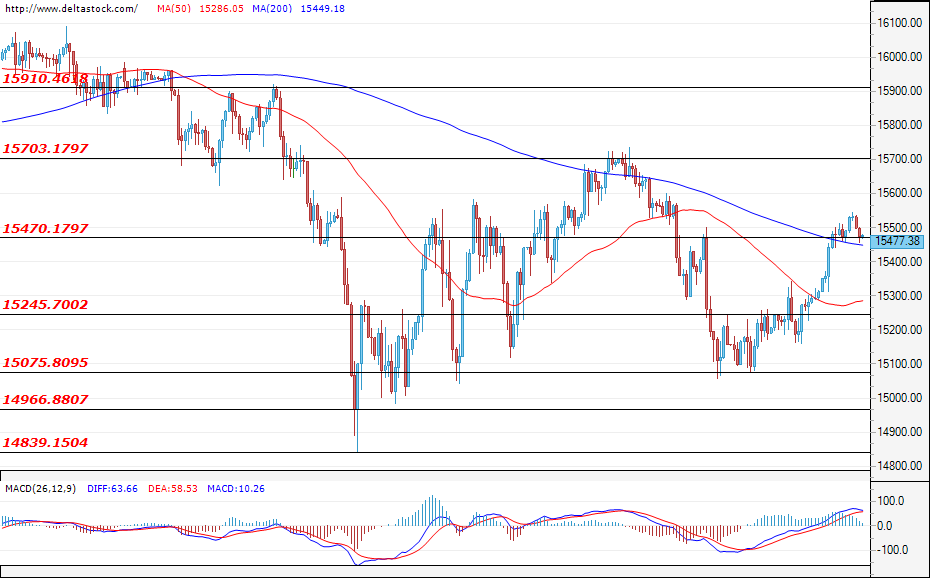
After the German index managed to overcome the resistance at 15470, the bulls lost their previously gained momentum, and at the time of writing the analysis, we see an attempt to breach that level, but in a downward direction. If the buyers manage to recover and bring the trade towards the level of the next significant resistance at 15700, then we may expect the mentioned resistance to be successfully overcome, thereby interrupting the range move, which was formed between 15000 and 15700. On the other hand, if the bears prevail, then we can expect an attack on the lower boundary of the mentioned range.
US30
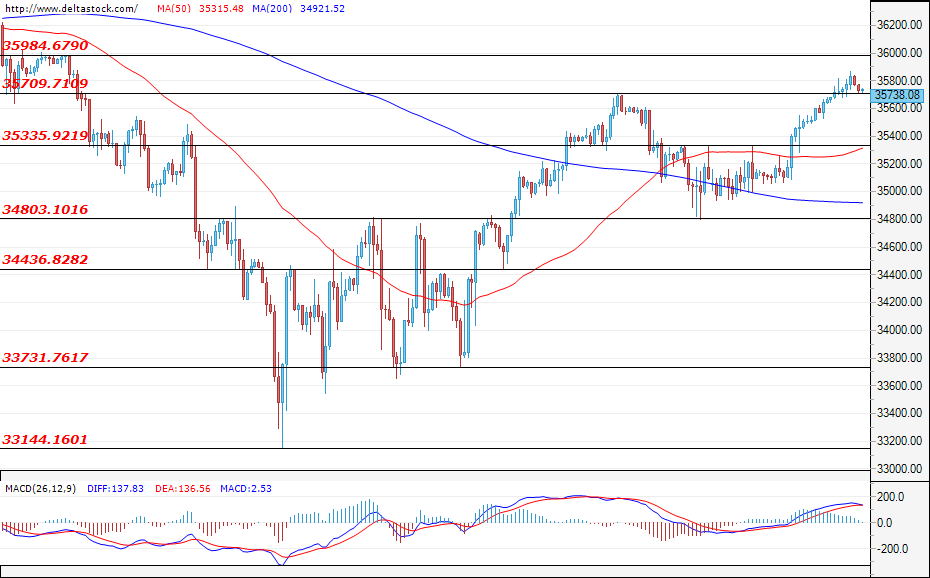
The U.S. blue-chip stock index continues to gain positions, and at the time of writing the analysis, we are seeing a slight buyer pullback. In the event of a bear predominance, we may witness another serious decline towards the support area at 34800. On the other hand, market participants could find better entry levels around the support level at 35700 which, according to the higher time frames, could lead the index up towards the next important resistance at 36500. The economic news, mentioned in the EUR/USD analysis, could have an impact on market participants’ sentiment, with volatility expected to increase around the announcement of the data.
US Dollar Index Loses Momentum ahead of Inflation Data
The momentum in Wall Street extended on Wednesday as investors reacted to strong quarterly results by companies like CVS, CME, and Chipotle Mexican Grill. In general, while companies like PayPal, Meta Platforms, and JP Morgan disappointed, the earnings season has been relatively strong. According to FactSet, companies are set to report earnings growth of over 20% for the fourth straight quarter. Some of the other companies that will publish their results today are Coca-Cola, PepsiCo, Duke Energy, Piper Sandler, and Twitter.
The price of crude oil tilted higher after the latest American inventories data. According to the Energy Information Administration (EIA), the overall inventories declined by more than 4.75 million last week. That decline was higher than the median estimate of an increase of 369k. It was also higher than the previous 1 million barrels. Other data showed that the US imported more than 1.4 million barrels of oil per day last week while the inventories at Cushing rose to more than 2.8 million barrels. Prices rose as the escalation between western countries and Russia continued.
The economic calendar will have several important events today. The most important one will be the latest American consumer price index data. Analysts expect the data to show that the headline CPI rose to 7.3% while the core CPI rose to 5.9%. These numbers are important because they are part of Fed’s dual mandate. The US will also publish the latest initial jobless claims numbers. Elsewhere, the Indian and Swedish central banks will deliver their rate decisions.
XAUUSD
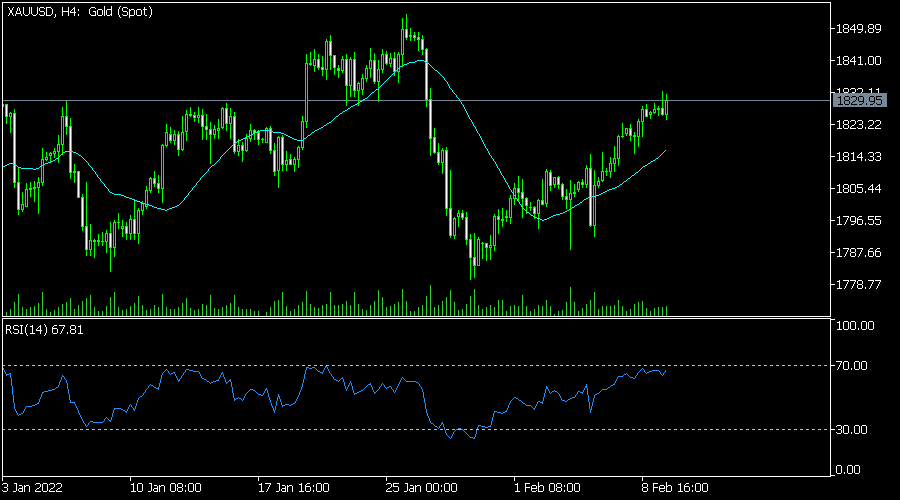
The XAUUSD pair has been in a bullish trend in the past few days. The pair is trading at 1,830, which is the highest it has been since January 26th. The pair has moved to the 23.6% Fibonacci retracement level. It has also risen above the 25-day and 50-day moving averages while the Relative Strength Index (RSI) has moved close to the overbought level. Therefore, the pair will likely keep rising ahead of the American CPI data.
EURJPY
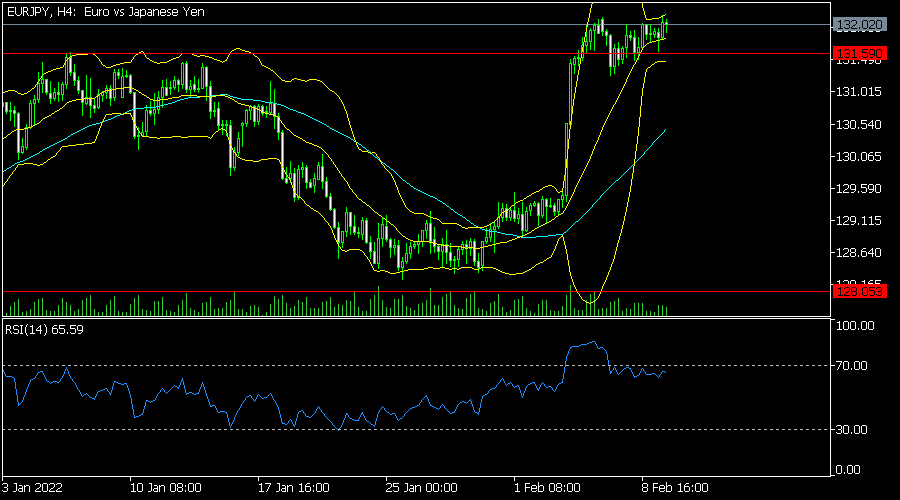
The EURJPY strong rebound has paused in the past few days as investors assess the ongoing divergence between the BOJ and the ECB. On the four-hour chart, the pair has formed a bullish flag pattern. It has also moved between the upper and middle lines of the Bollinger Bands. Also, the price has moved slightly above the 25-day moving average. Therefore, the pair will likely have a bullish breakout soon.
EURUSD
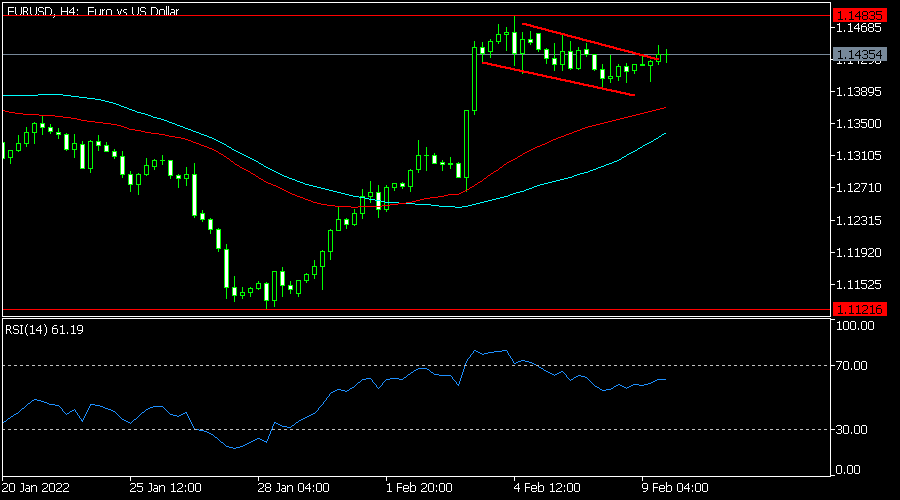
The EURUSD pair rose slightly ahead of the upcoming American consumer inflation data. It is trading at 1.1435, which is slightly above the upper side of the bullish flag pattern. It has also moved above the 25-day moving average while the Relative Strength Index (RSI) has moved slightly below the overbought level. Therefore, the pair will likely break out higher in the coming days since it has formed a cup and handle pattern.