

Sample Category Title
GBP/USD Daily Outlook
Daily Pivots: (S1) 1.3512; (P) 1.3550; (R1) 1.3574; More...
Range trading continues in GBP/USD and intraday bias remains neutral. On the upside, break of 1.3627 will resume the rebound to 1.3748 resistance. Firm break there will revive the bullish case that correction from 1.4248 has completed with three waves down to 1.3158. Further rally should then be seen to retest 1.4248 high. On the downside, however, break of 1.3356 will bring retest of 1.3158 low.
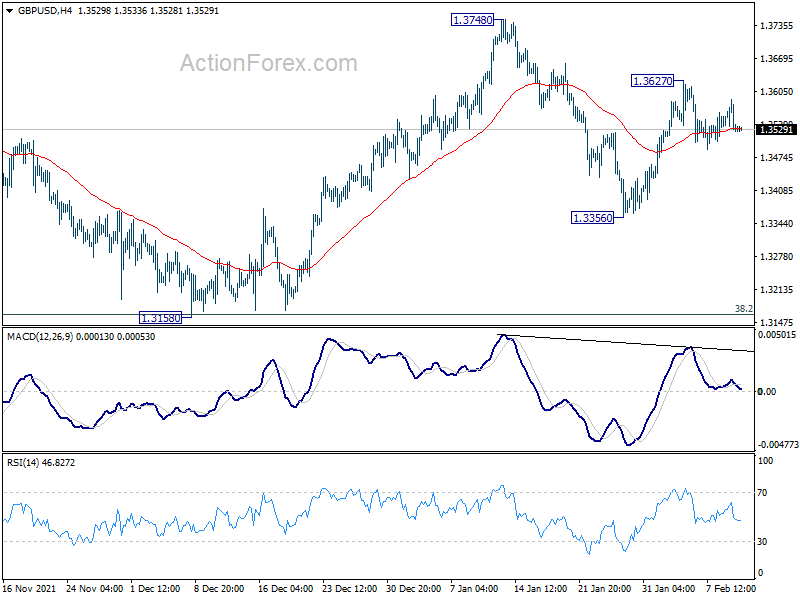
In the bigger picture, as long as 38.2% retracement of 1.1409 to 1.4248 at 1.3164 holds, up trend from 1.1409 (2020 low) is still in progress. On resumption, next target will be 38.2% retracement of 2.1161 to 1.1409 at 1.5134. Nevertheless sustained break of 1.3164 will argue that whole rise from 1.1409 has completed and bring deeper fall to 61.8% retracement at 1.2493.
Elliott Wave View: S&P500 (SPX) 5 Waves Rally Favors the Bulls
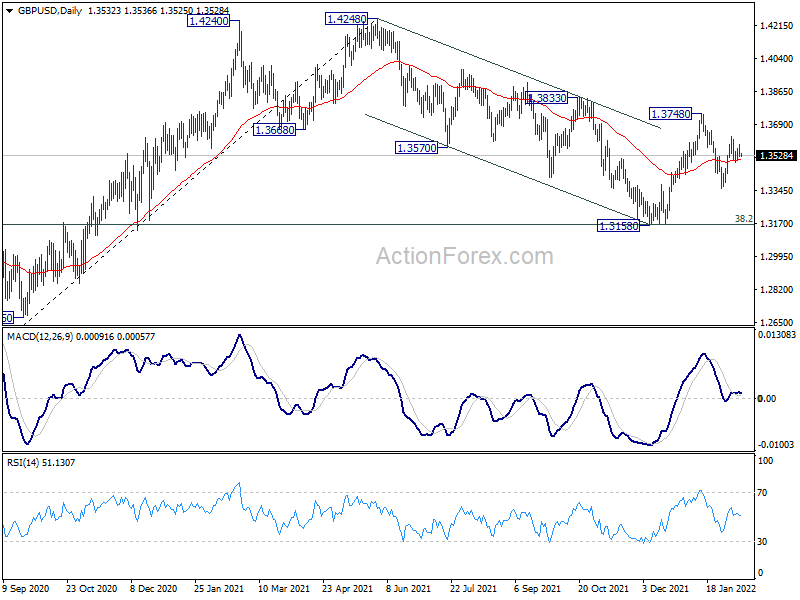
The short-term Elliott wave view in S&P500 (SPX) shows that we are looking for more upside to complete a 5 waves impulse structure, before see at least 3 swings pullback. The impulse move started from 4219 low to end wave ((i)) at 4453. A pullback in wave ((ii)) ended at 4292 low. SPX then resumes higher in wave ((iii)) with internal subdivision as another impulse in a lesser degree. Up from wave ((ii)), wave (i) ended at 4387, dips in wave (ii) ended at 4332, wave (iii) rallied to 4525 and a pullback appeared as wave (iv) ended at 4483. The last push higher to finish wave (v) ended at 4595. This completed wave ((iii)) in a higher degree.
Wave ((iv)) pullback ended at 4451. This level entered into the territory of wave ((i)) high which suggested a leading diagonal structure. Then the rally continued and we expect 5 waves up to finish wave ((v)) and wave 1. We could see already 3 waves up from wave ((iv)) low and we need 2 more waves complete the leading diagonal. The possible place to end this wave 1 comes in 4629 – 4684 area where we could find profit taking to begin a correction in 3, 7, or 11 swings. The view is valid as long as we stay above 4219.
S&P500 (SPX) 1 Hour Elliott Wave Chart
Technical Outlook and Review
DXY:
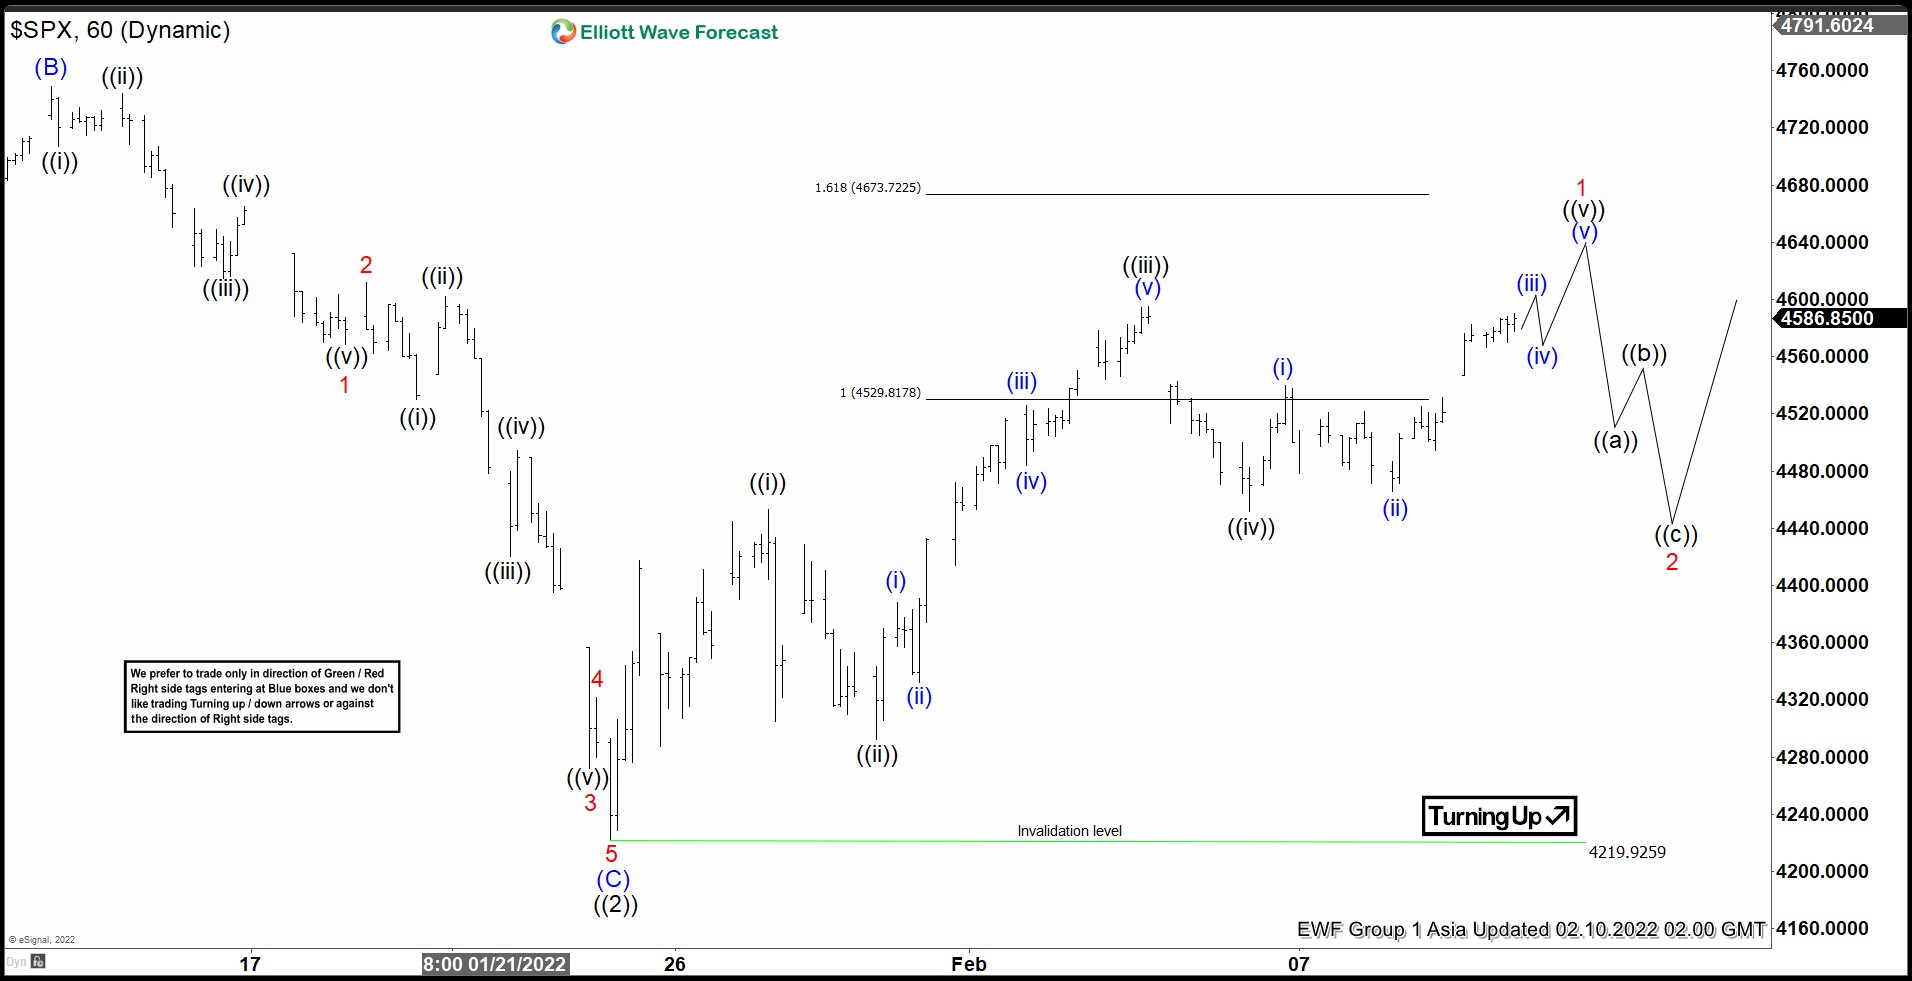
On the H4 timeframe, prices are on bullish momentum and abiding by our daily ascending trendline. We see the potential for a bounce from our 1st support at 95.568 in line with 50% Fibonacci retracement and graphical overlap towards our 1st resistance at 95.695 in line with 23.6% Fibonacci retracement and 50% Fibonacci retracement. Our bullish bias is further supported by our RSI portraying bullish momentum.
Areas of consideration:
- H4 time frame, 1st resistance at 95.693
- H4 time frame, 1st support at 95.366
XAU/USD (GOLD):
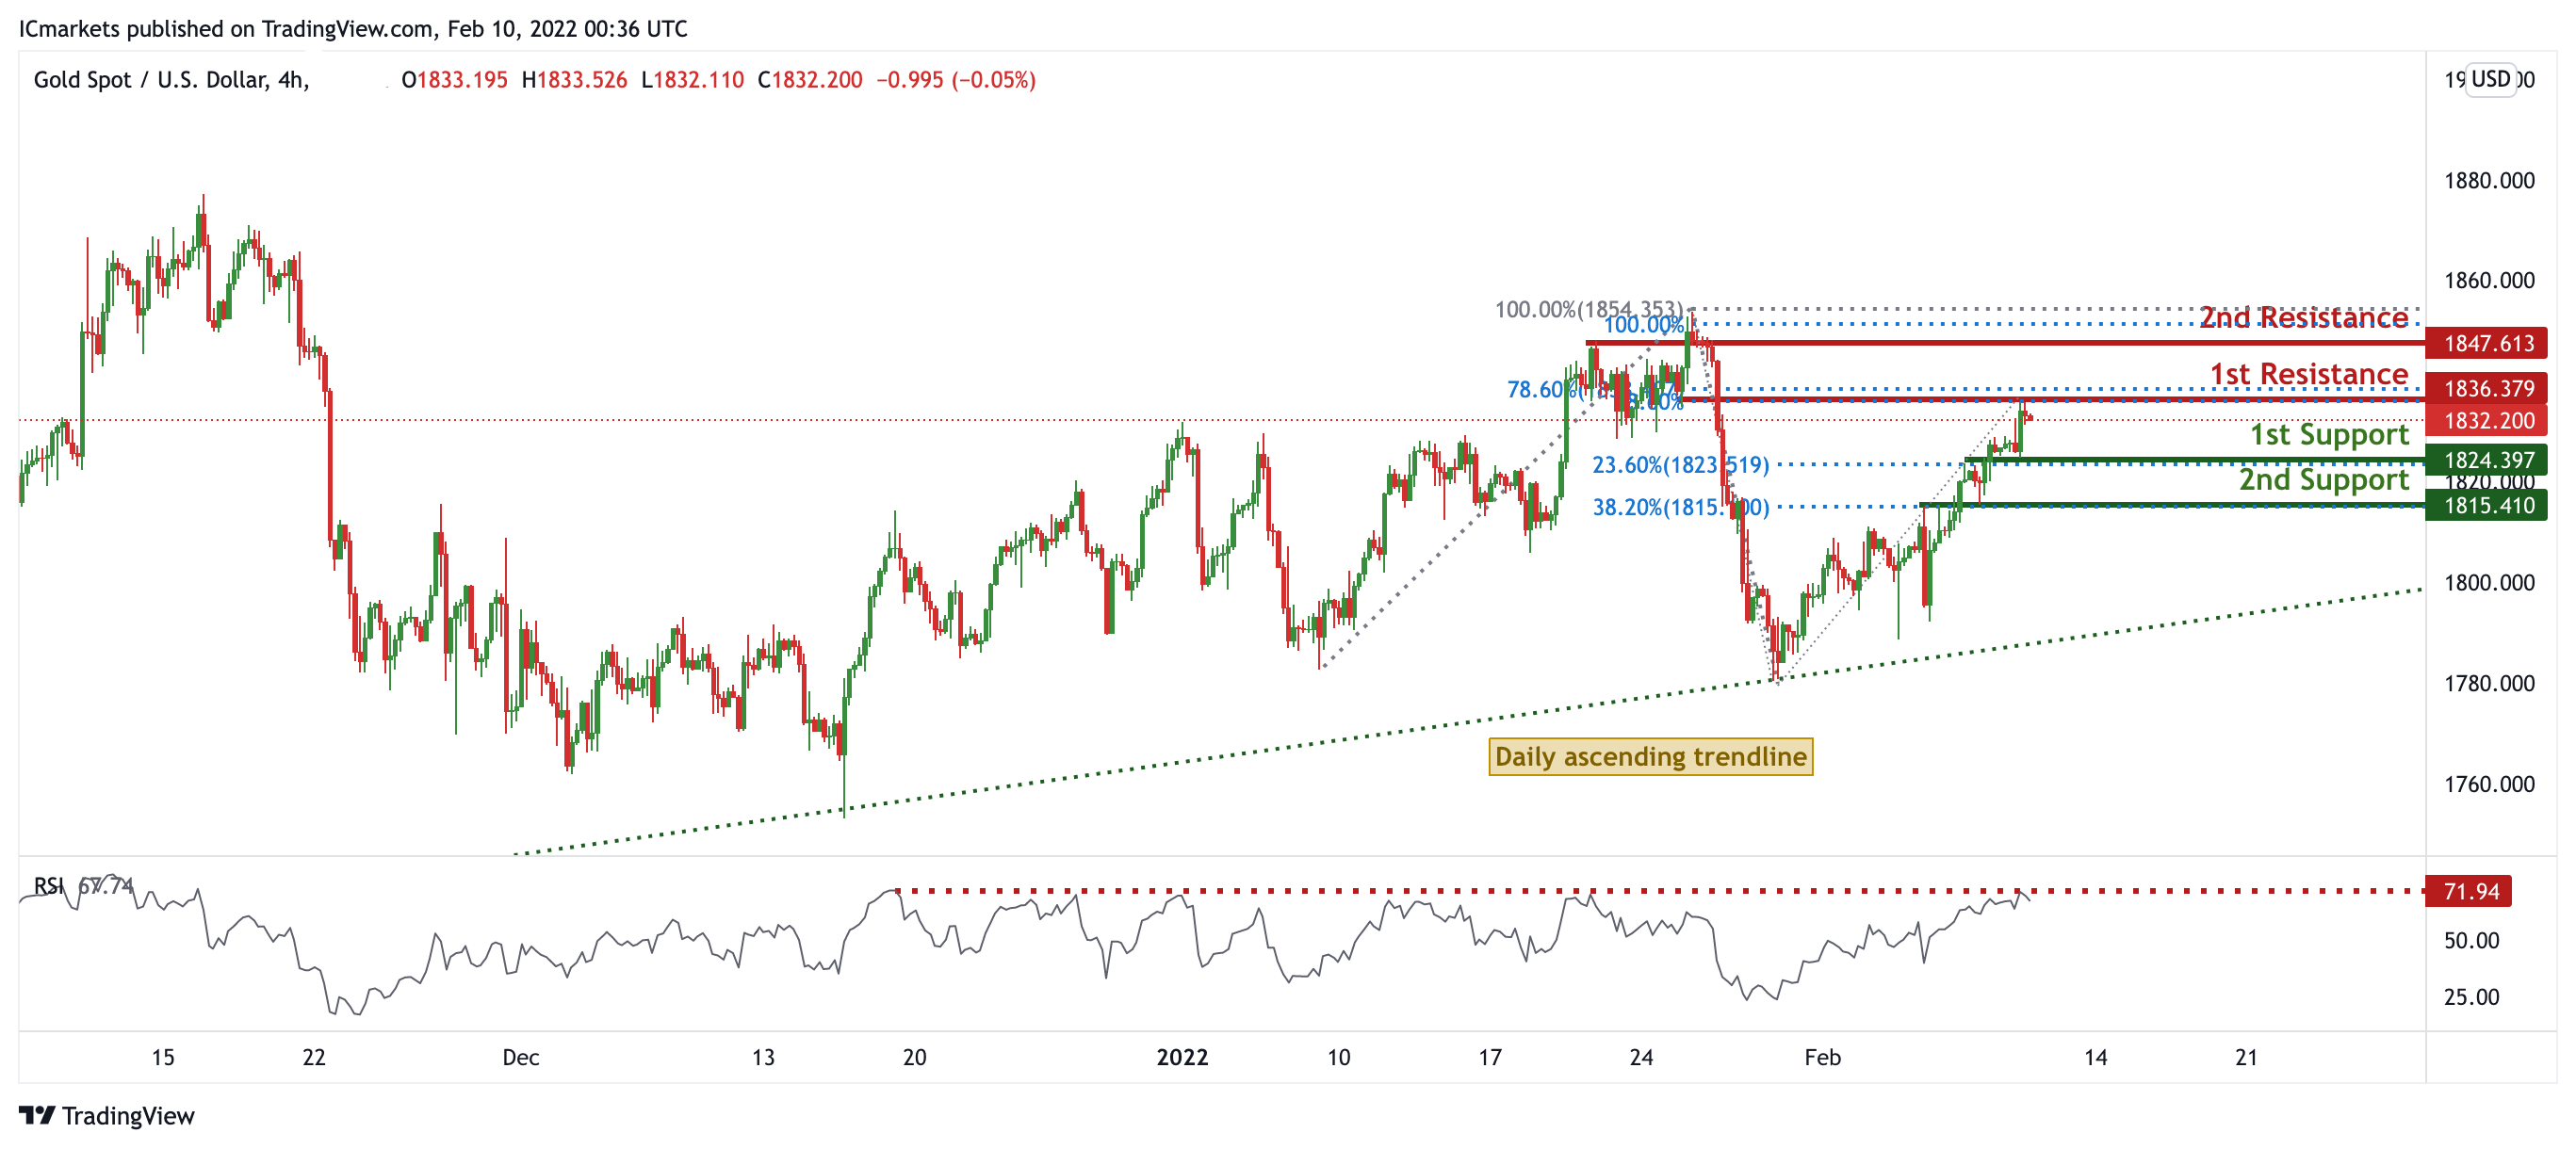
On the H4 chart, prices are at a pivot and strong graphical overlap resistance. We see potential for a pullback from our 1st resistance at 1836.379 in line with 78.6% Fibonacci retracement and 78.6% Fibonacci extension towards our 1st support at 1824.397 in line with 23.6% Fibonacci retracement and 38.2% Fibonacci retracement. RSI are at levels where dips previously occurred.
Areas of consideration:
- 4h 1st support at 1824.397
- 4h 1st resistance at 1829.265
GBP/USD
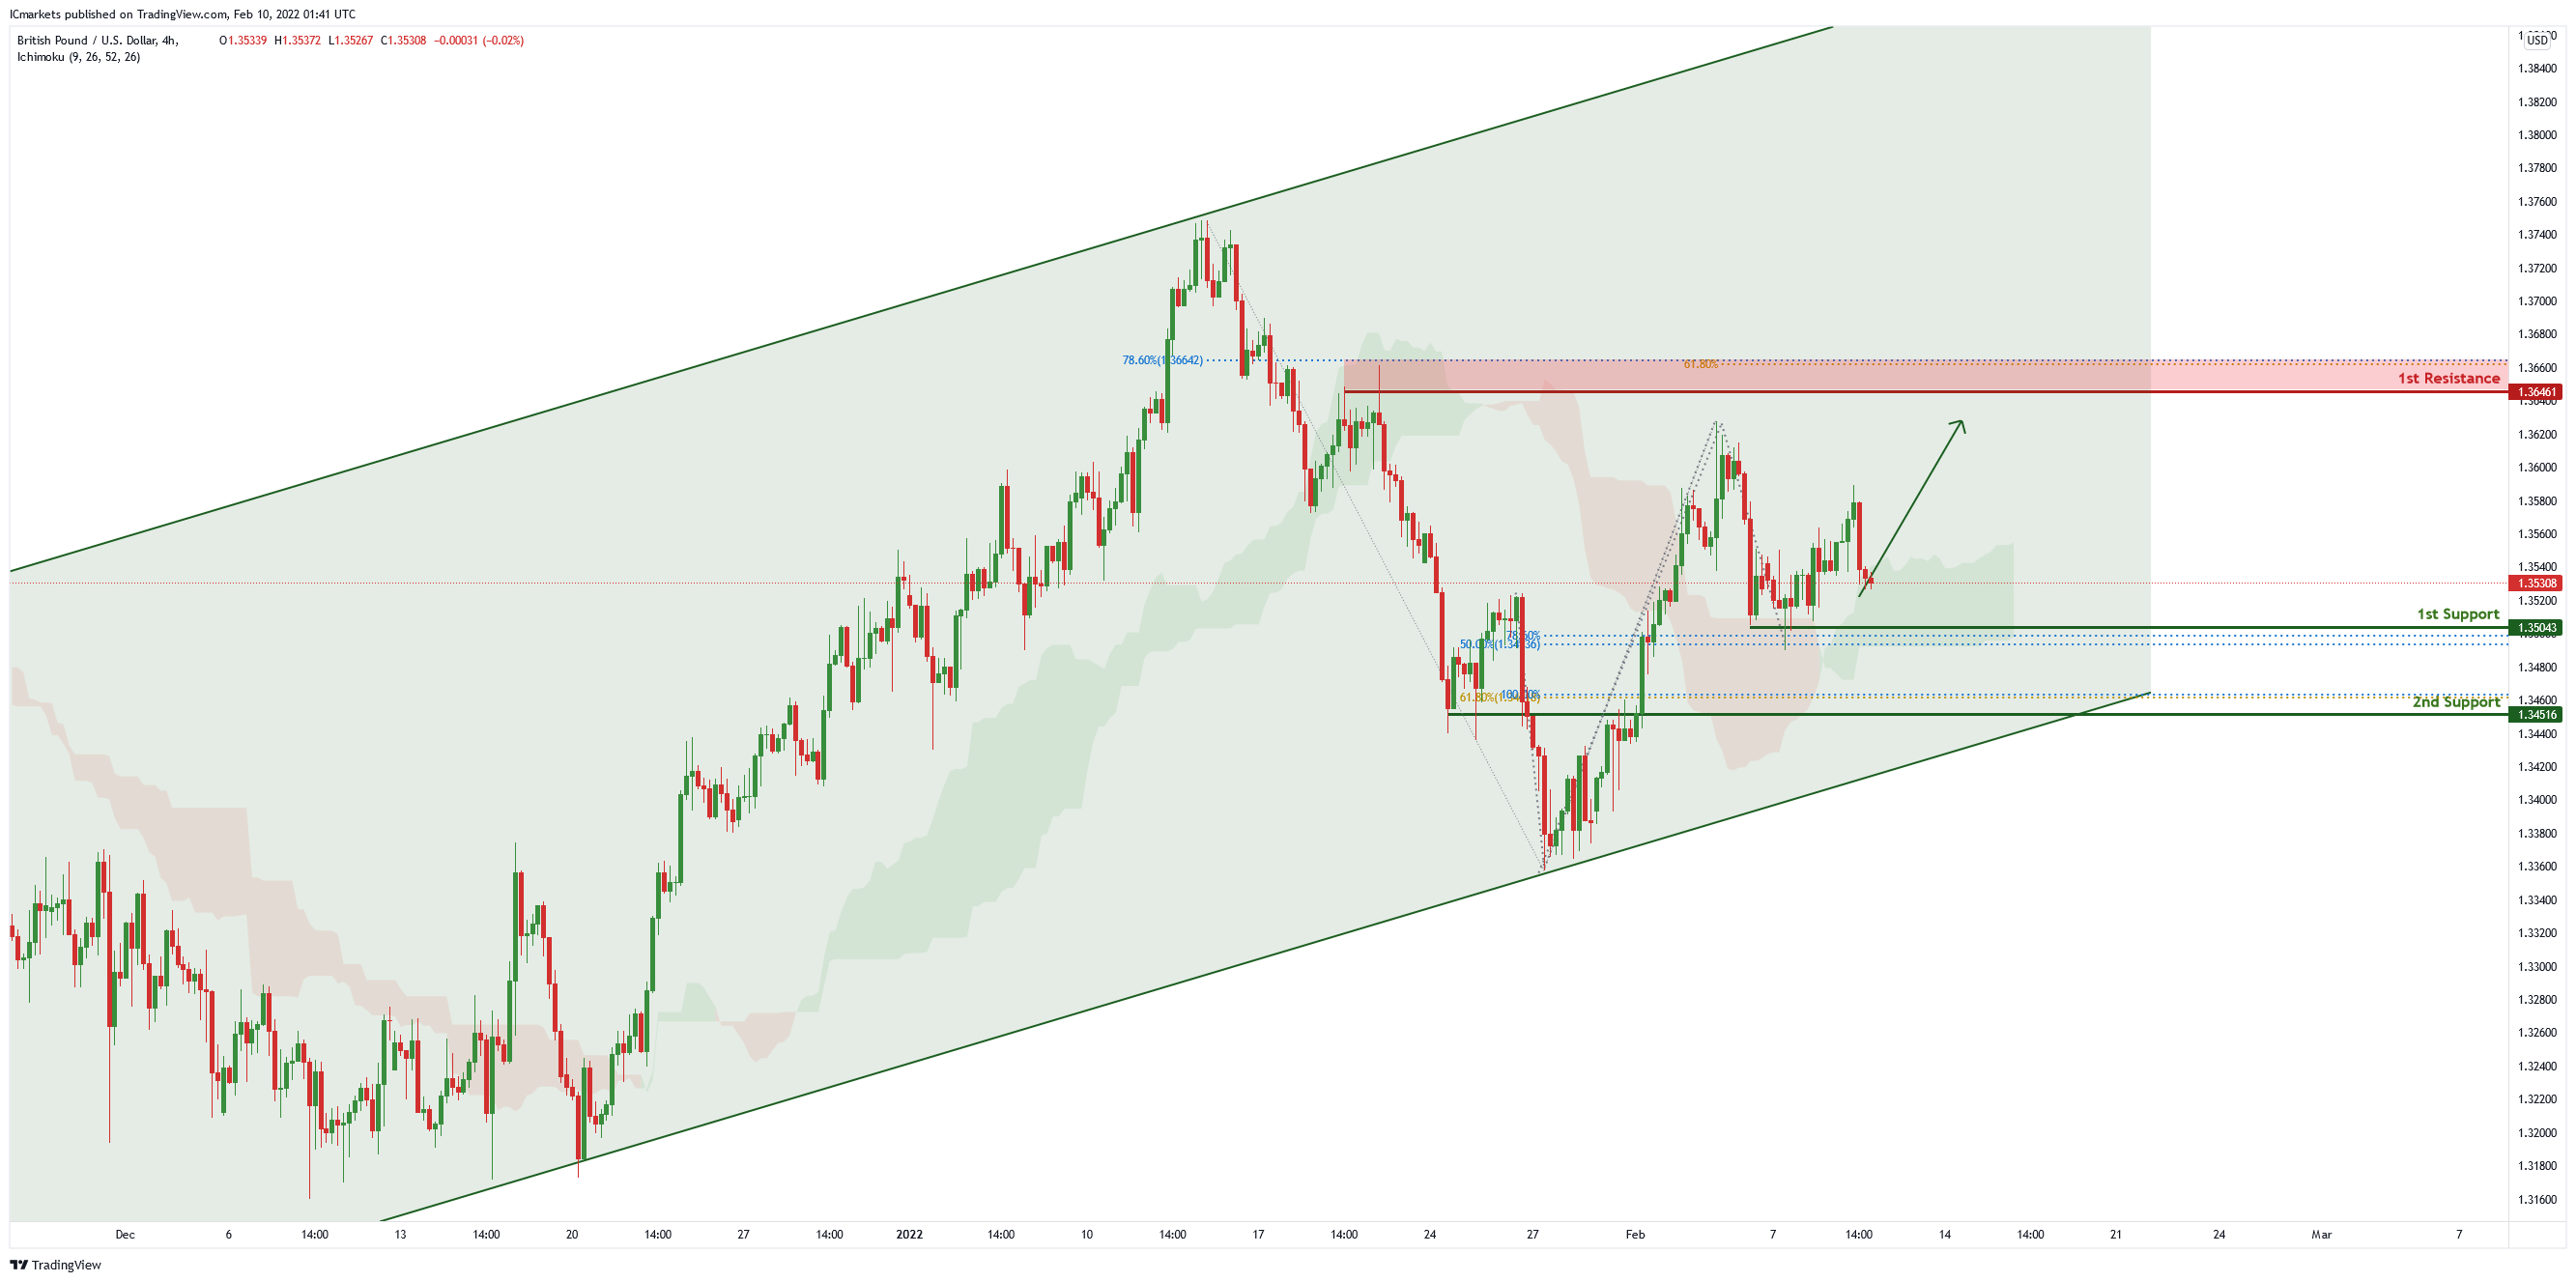
In the H4 chart , price is trading in an ascending channel and near 1st support level of 1.35043 which is also 50% Fibonacci retracement and 78.6% Fibonacci projection. Price can potentially continue its bullish momentum to the 1st resistance level of 1.36461 in line with 61.8% Fibonacci projection and 78.6% Fibonacci retracement. Our bullish bias is supported by the ichimoku cloud indicator as price is trading above it.
Areas of consideration:
- H4 1st resistance 1.36461
- H4 1st support 1.35043
USD/CHF:
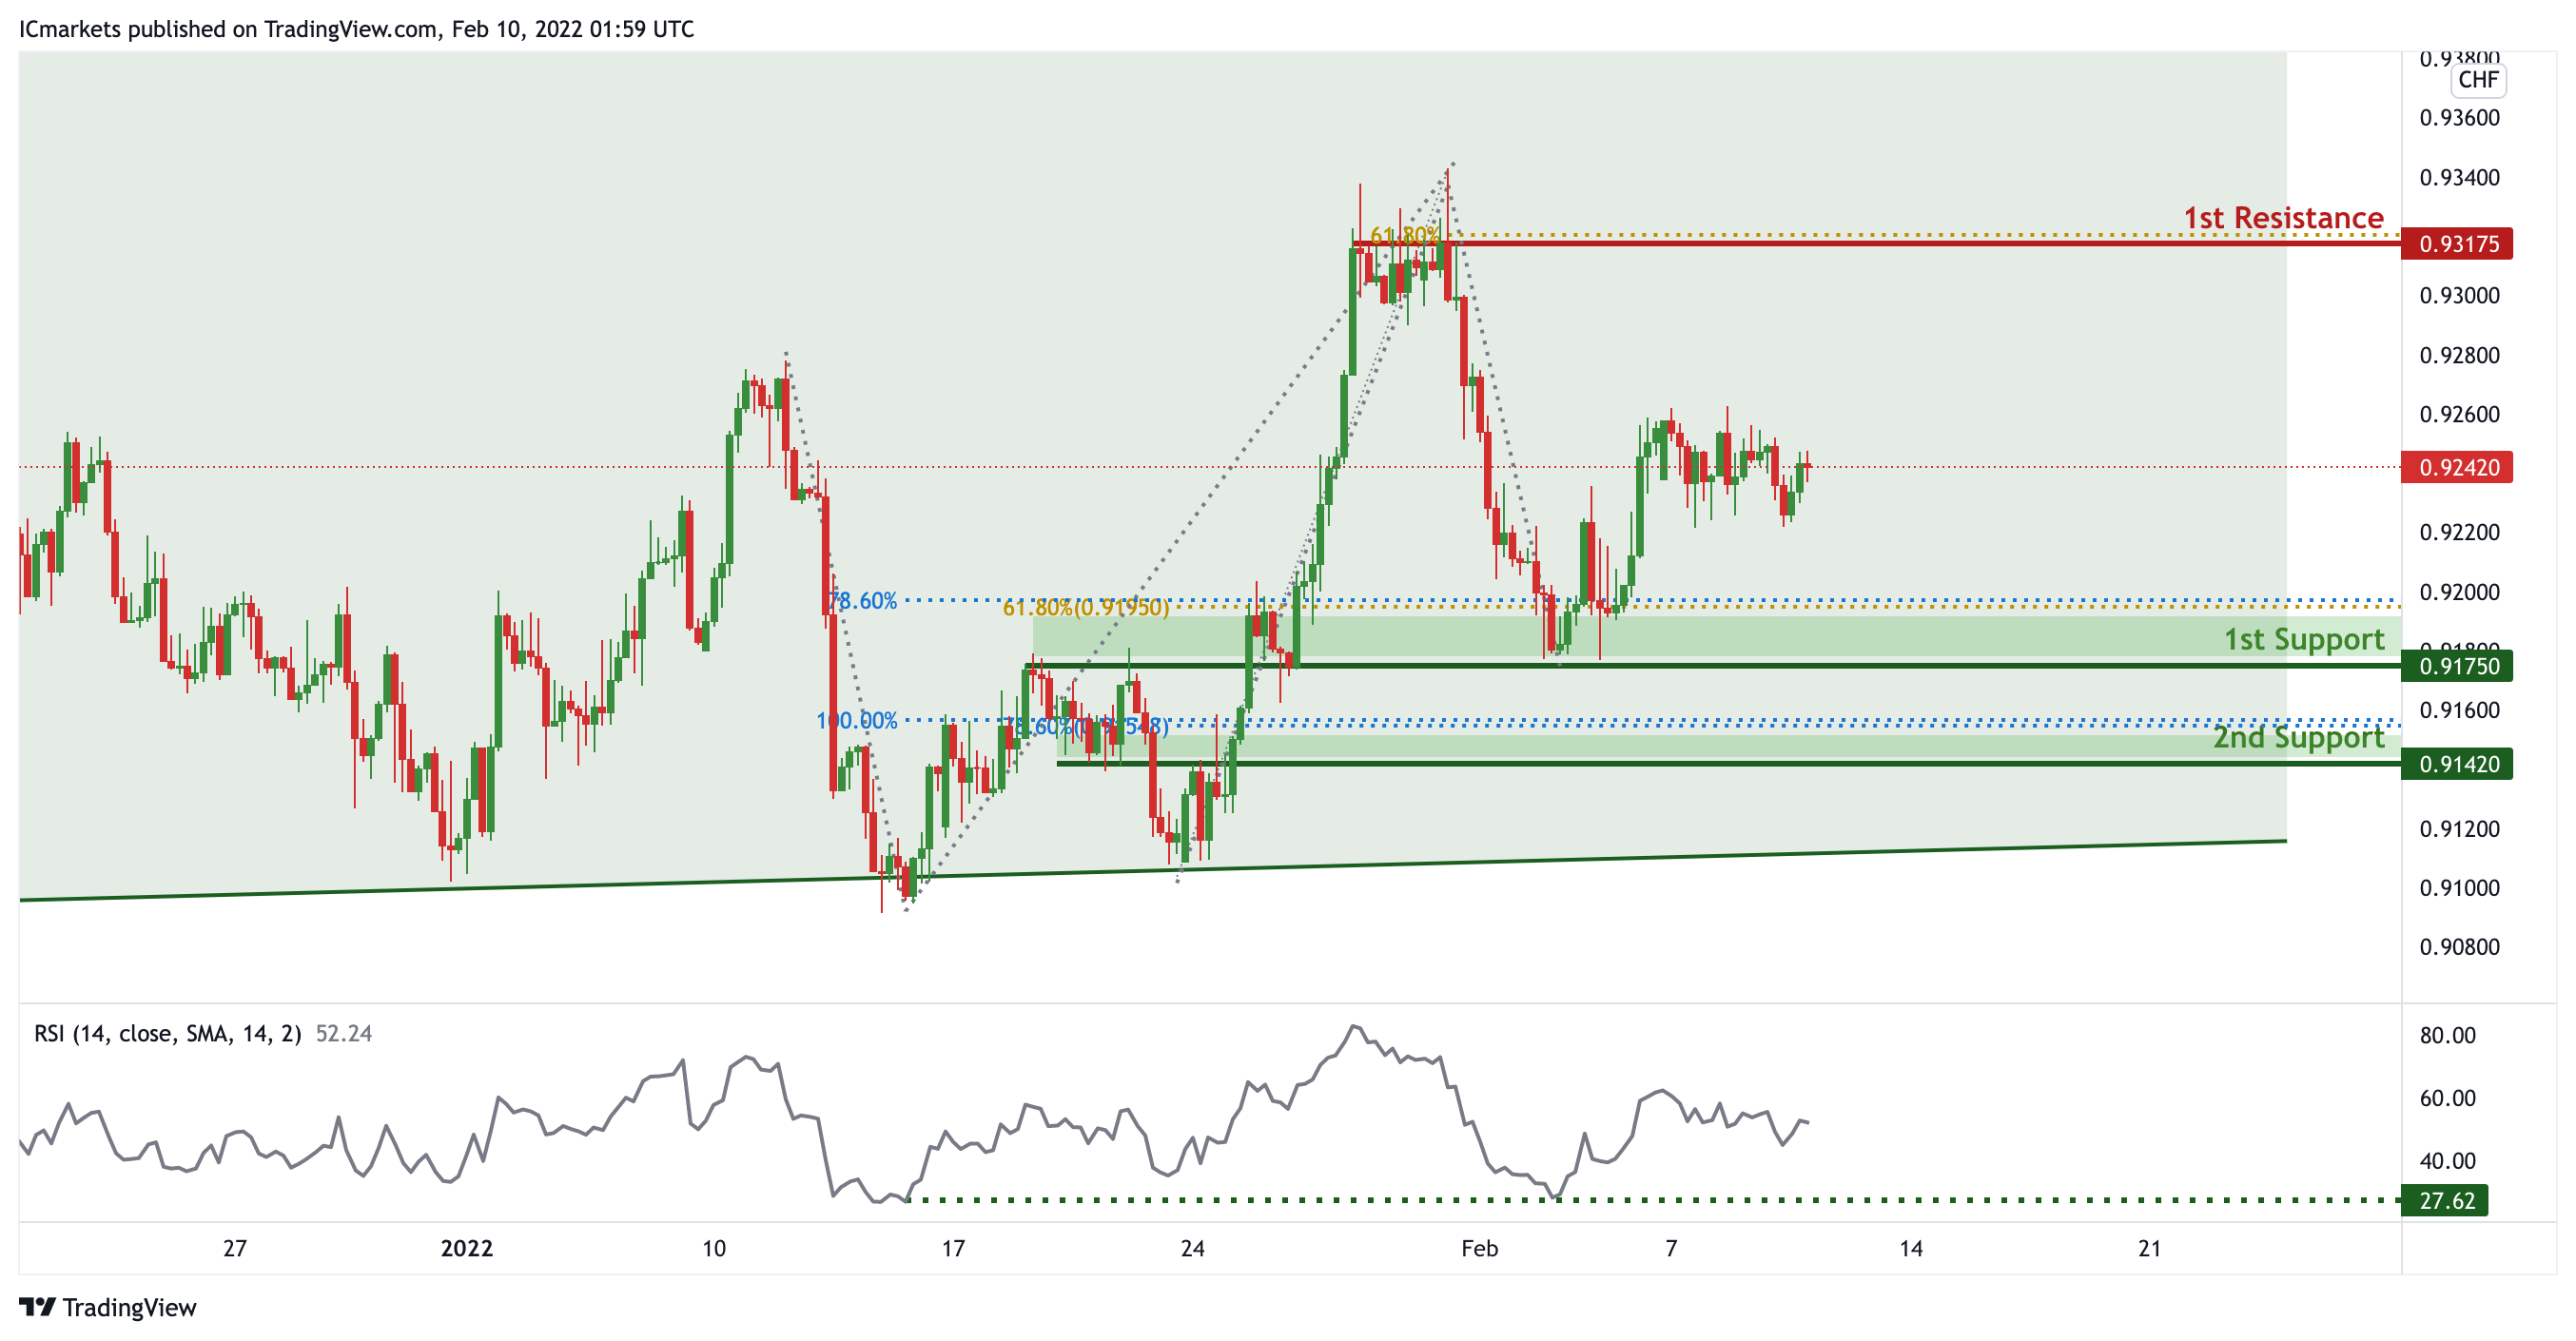
On the H4 timeframe,in reference to last week’s analysis price indeed bounced at the 1st Support level. Price is abiding to the daily ascending channel signifying an overall bullish momentum. We can expect the price to bounce from 1st Support in line with 78.6% Fibonacci projection and 61.8% fibonacci retracement towards 1st Resistance in line with 61.8% Fibonacci projection and previous swing high. Our bullish bias is further supported by the RSI indicator where it is at the support level. Traders should wait for prices to swing higher or lower before entering.
Areas of consideration:
- Watch 1st Support at 0.91750
- Watch 1st Resistance at 0.93175
EUR/USD :
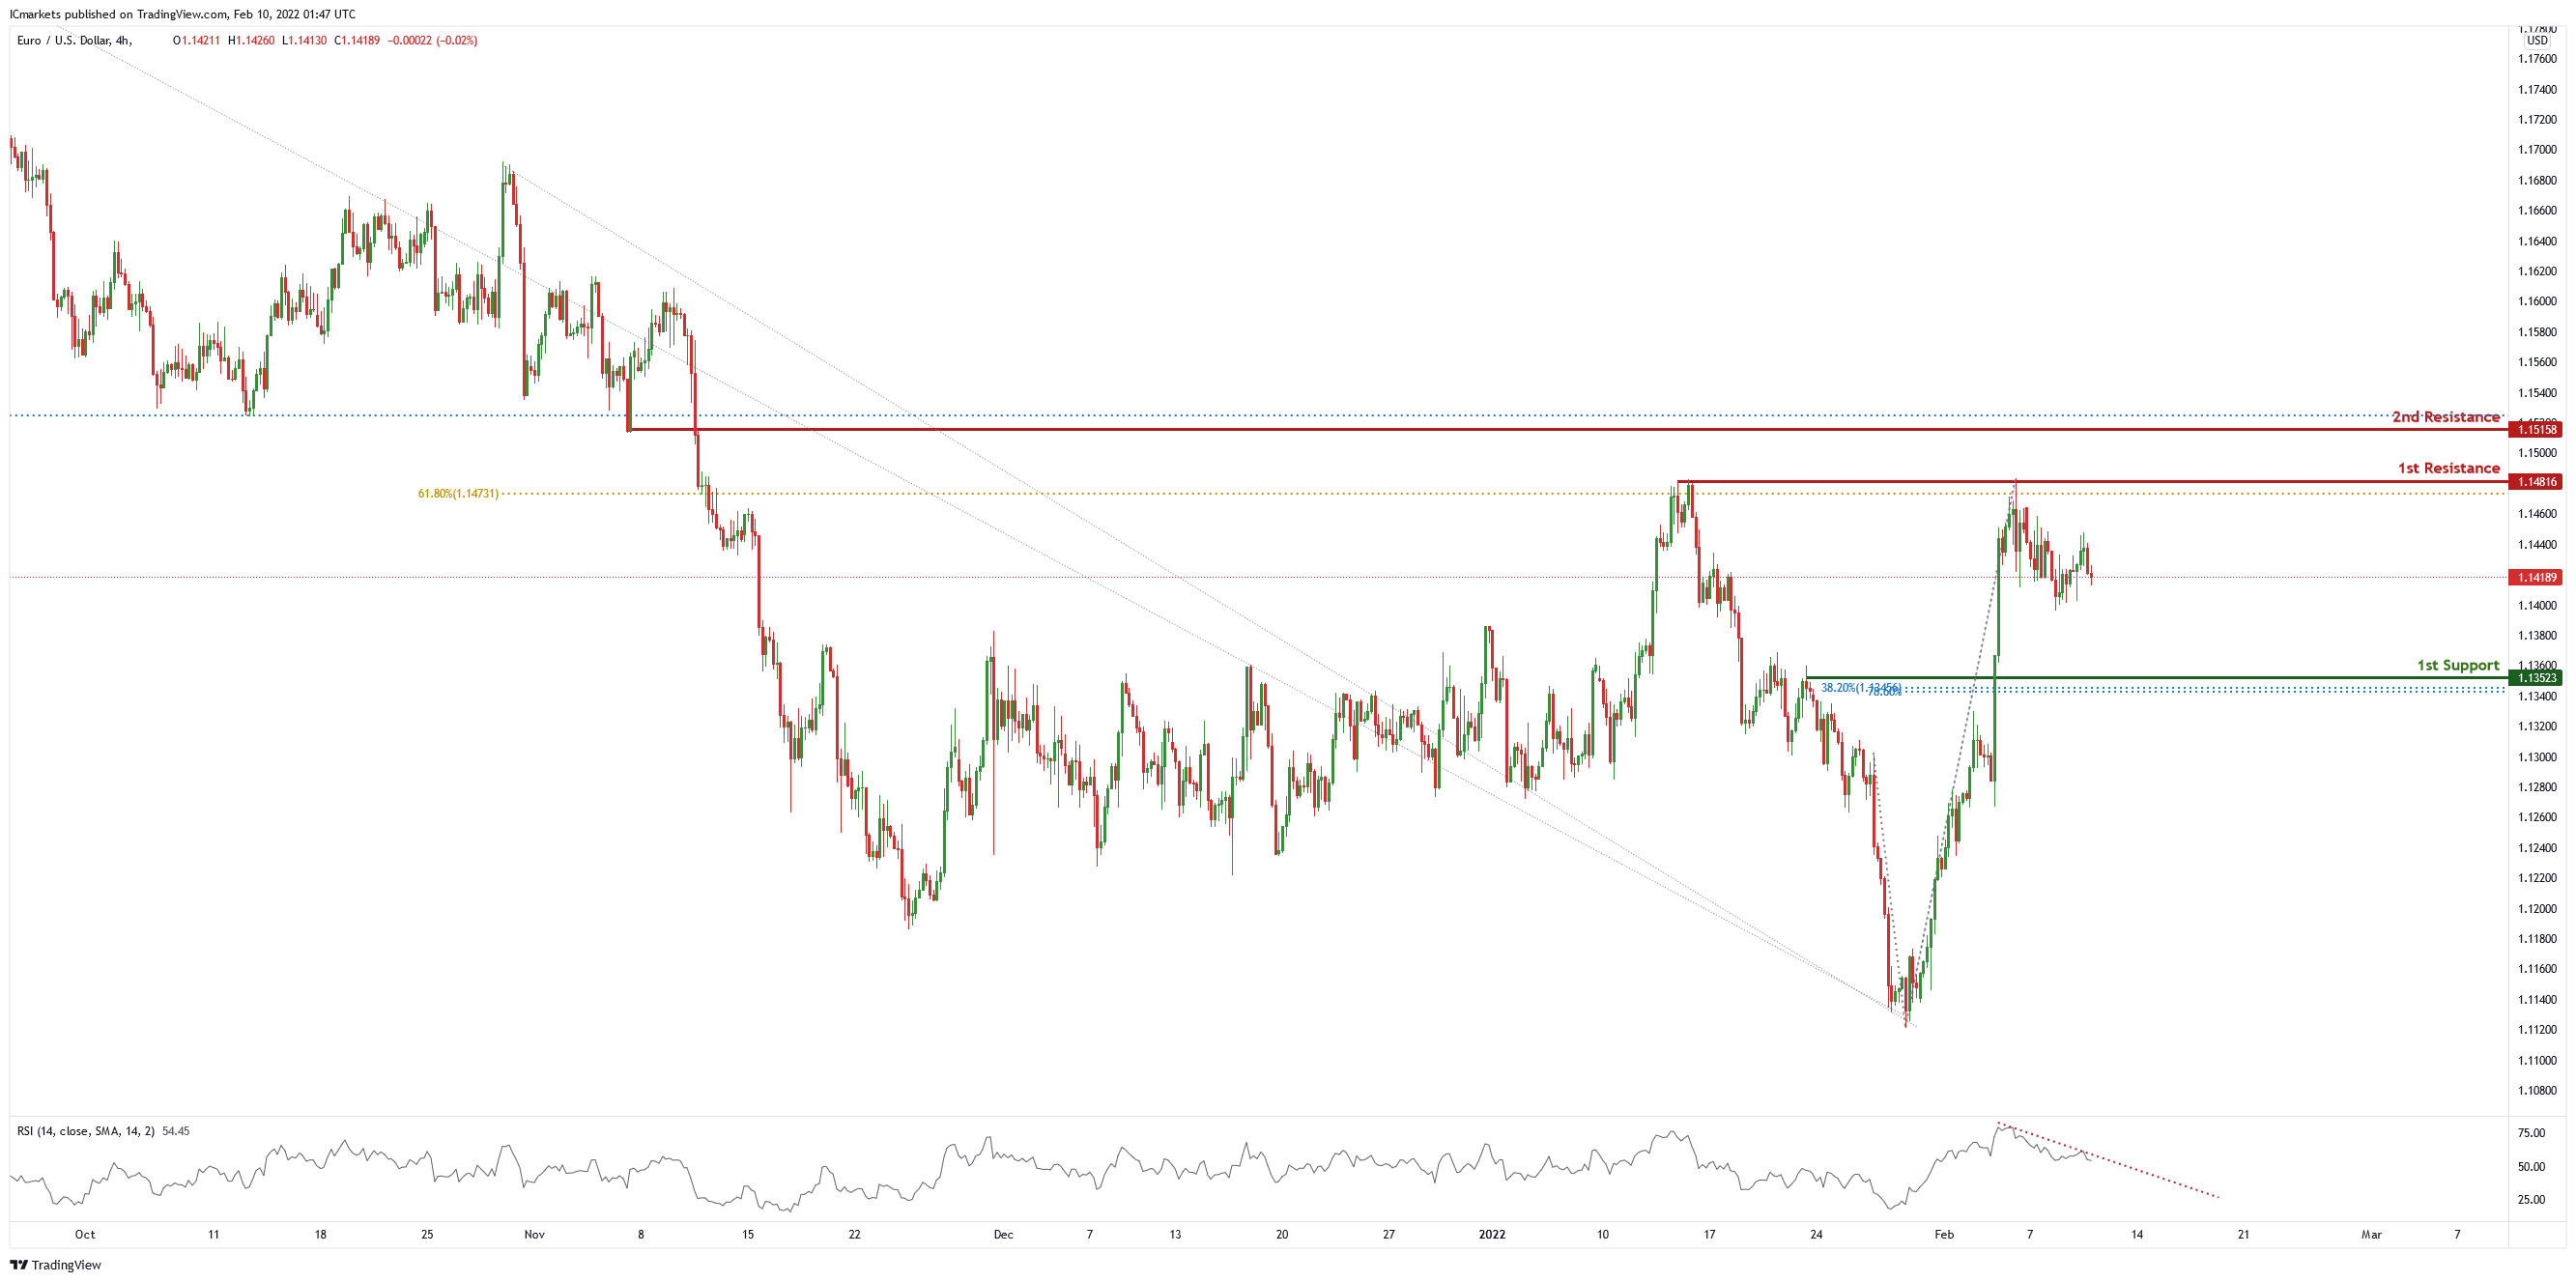
On the H4 chart, price is near the 1st resistance level of 1.14816 which is also 61.8% Fibonacci retracement. Price can potentially dip to the 1st support level of 1.13523 in line with 38.2% Fibonacci retracement and 78.6% Fibonacci projection. Our bearish bias is supported by the RSI indicator as it is abiding by a descending trendline
Areas of consideration :
- H4 1st support at 1.13523
- H4 1st resistance at 1.14816
USD/JPY:
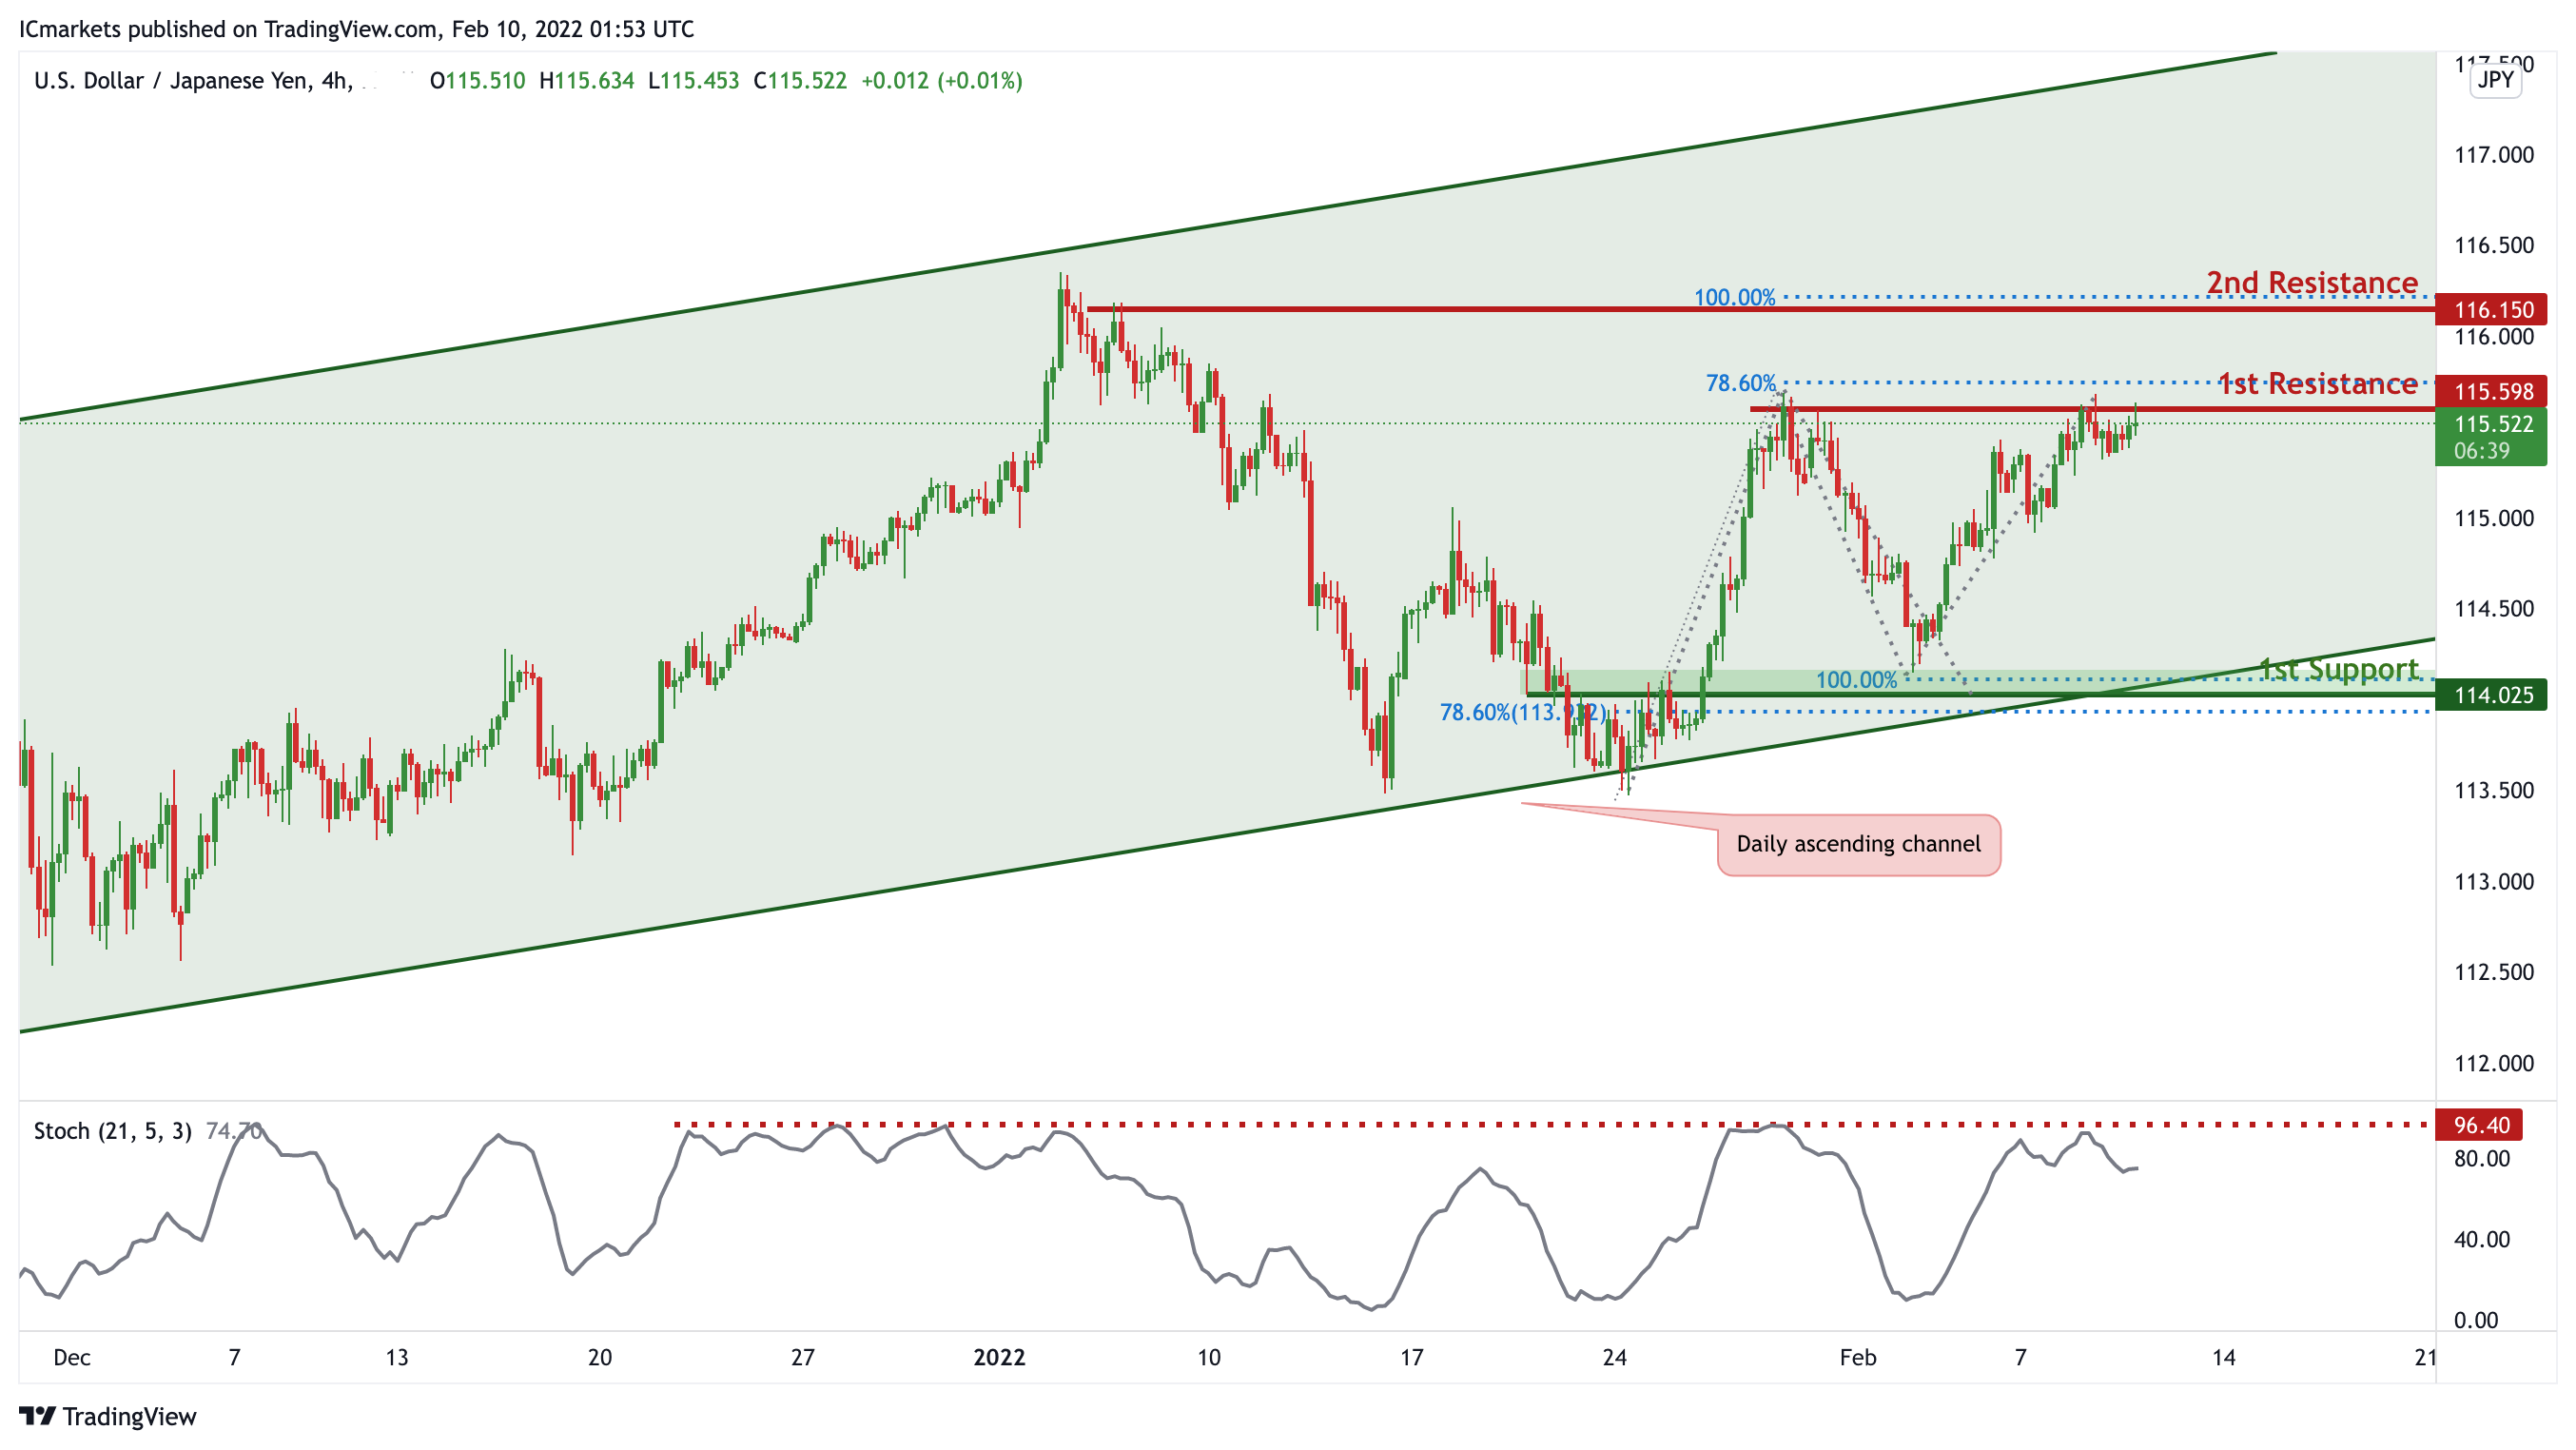
On the H4 chart,in reference to last week’s analysis, price indeed bounced at 1st Support and it is reaching our potential 1st Resistance level @ 115.598.
Price is trading in an ascending channel signifying an overall bullish momentum, however, we can expect a short-term bearish drop from 1st Resistance level in line with horizontal resistance and 78.6% Fibonacci projection towards 1st Support in line with previous swing low and 100% Fibonacci projection. Our bearish bias is further supported by the stochastic indicator where the %K line is at the resistance level.
Areas of consideration:
- H4 1st support at 114.025
- H4 1st resistance at 115.598
AUD/USD:
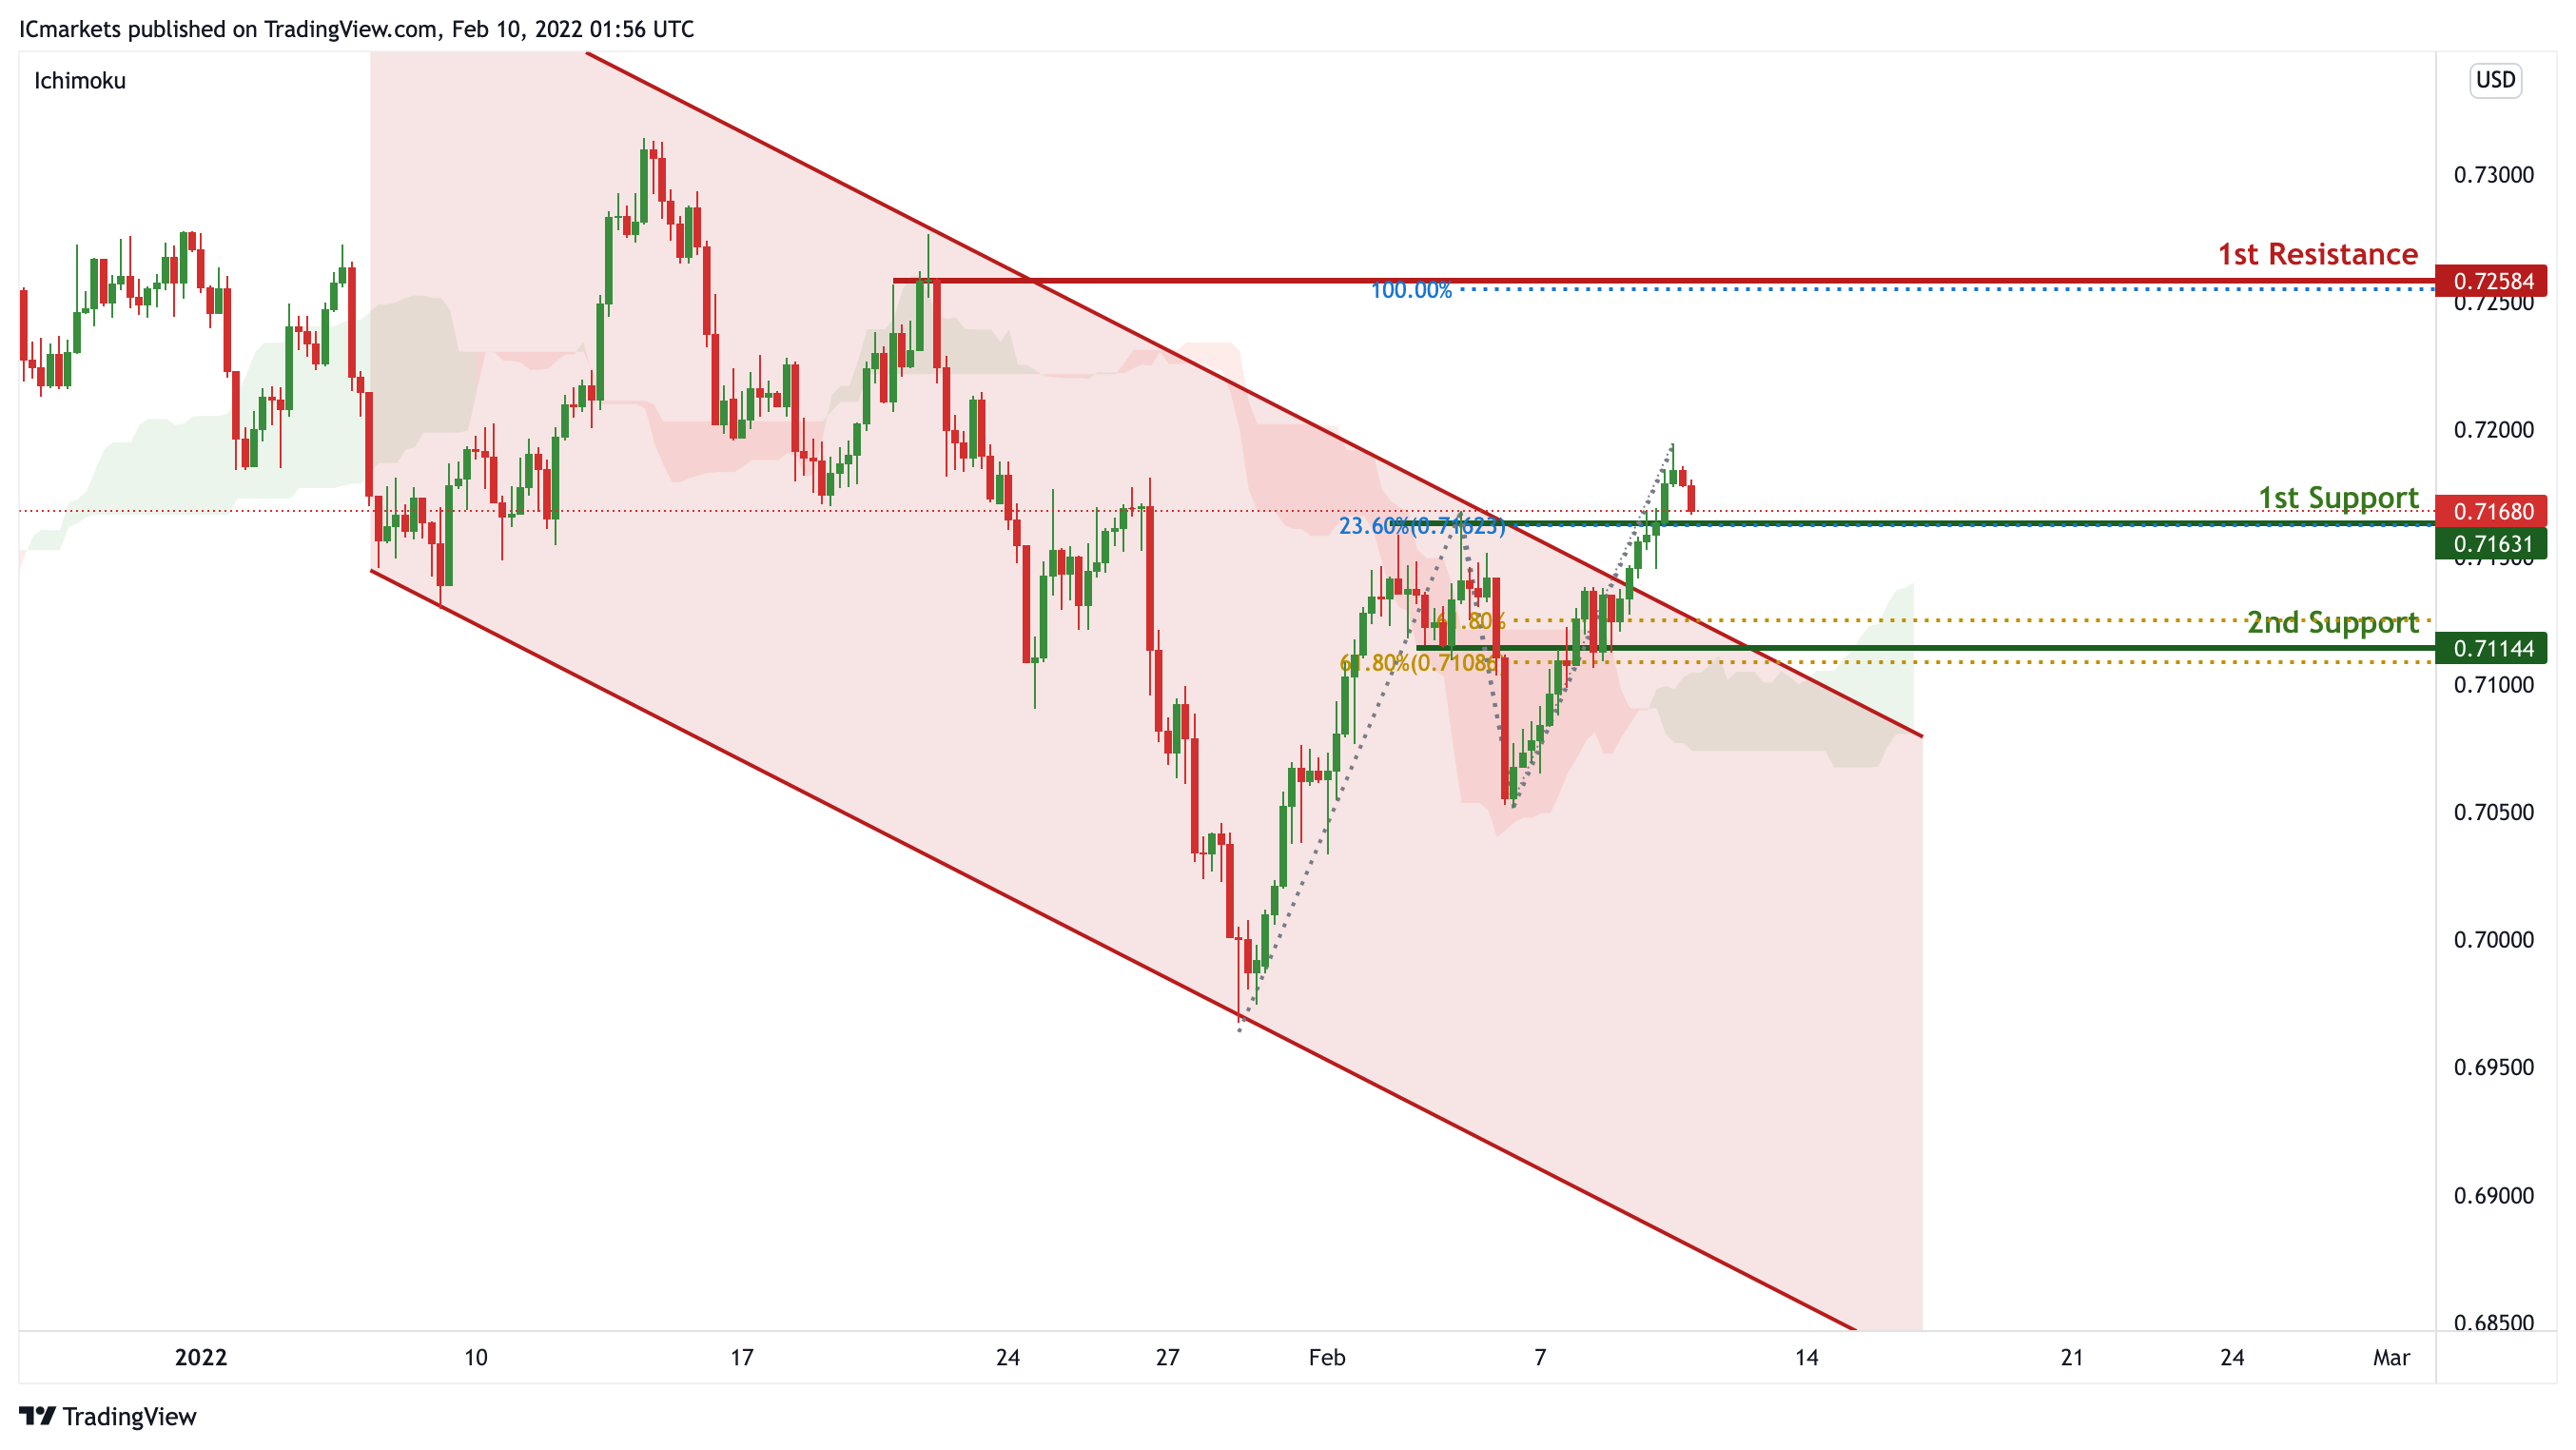
Price broke out of the descending channel, signifying an overall bullish momentum. We can expect price to bounce from 1st Support in line with 23.6% Fibonacci retracement and graphical overlap support towards 1st Resistance in line with previous swing high and 100% Fibonacci projection. Our bullish bias is further supported by the Ichimoku indicator where the prices are holding above the cloud.
Areas of consideration:
- H4 1st Support level 0.71631
- H4 1st resistance level 0.72584
NZD/USD:
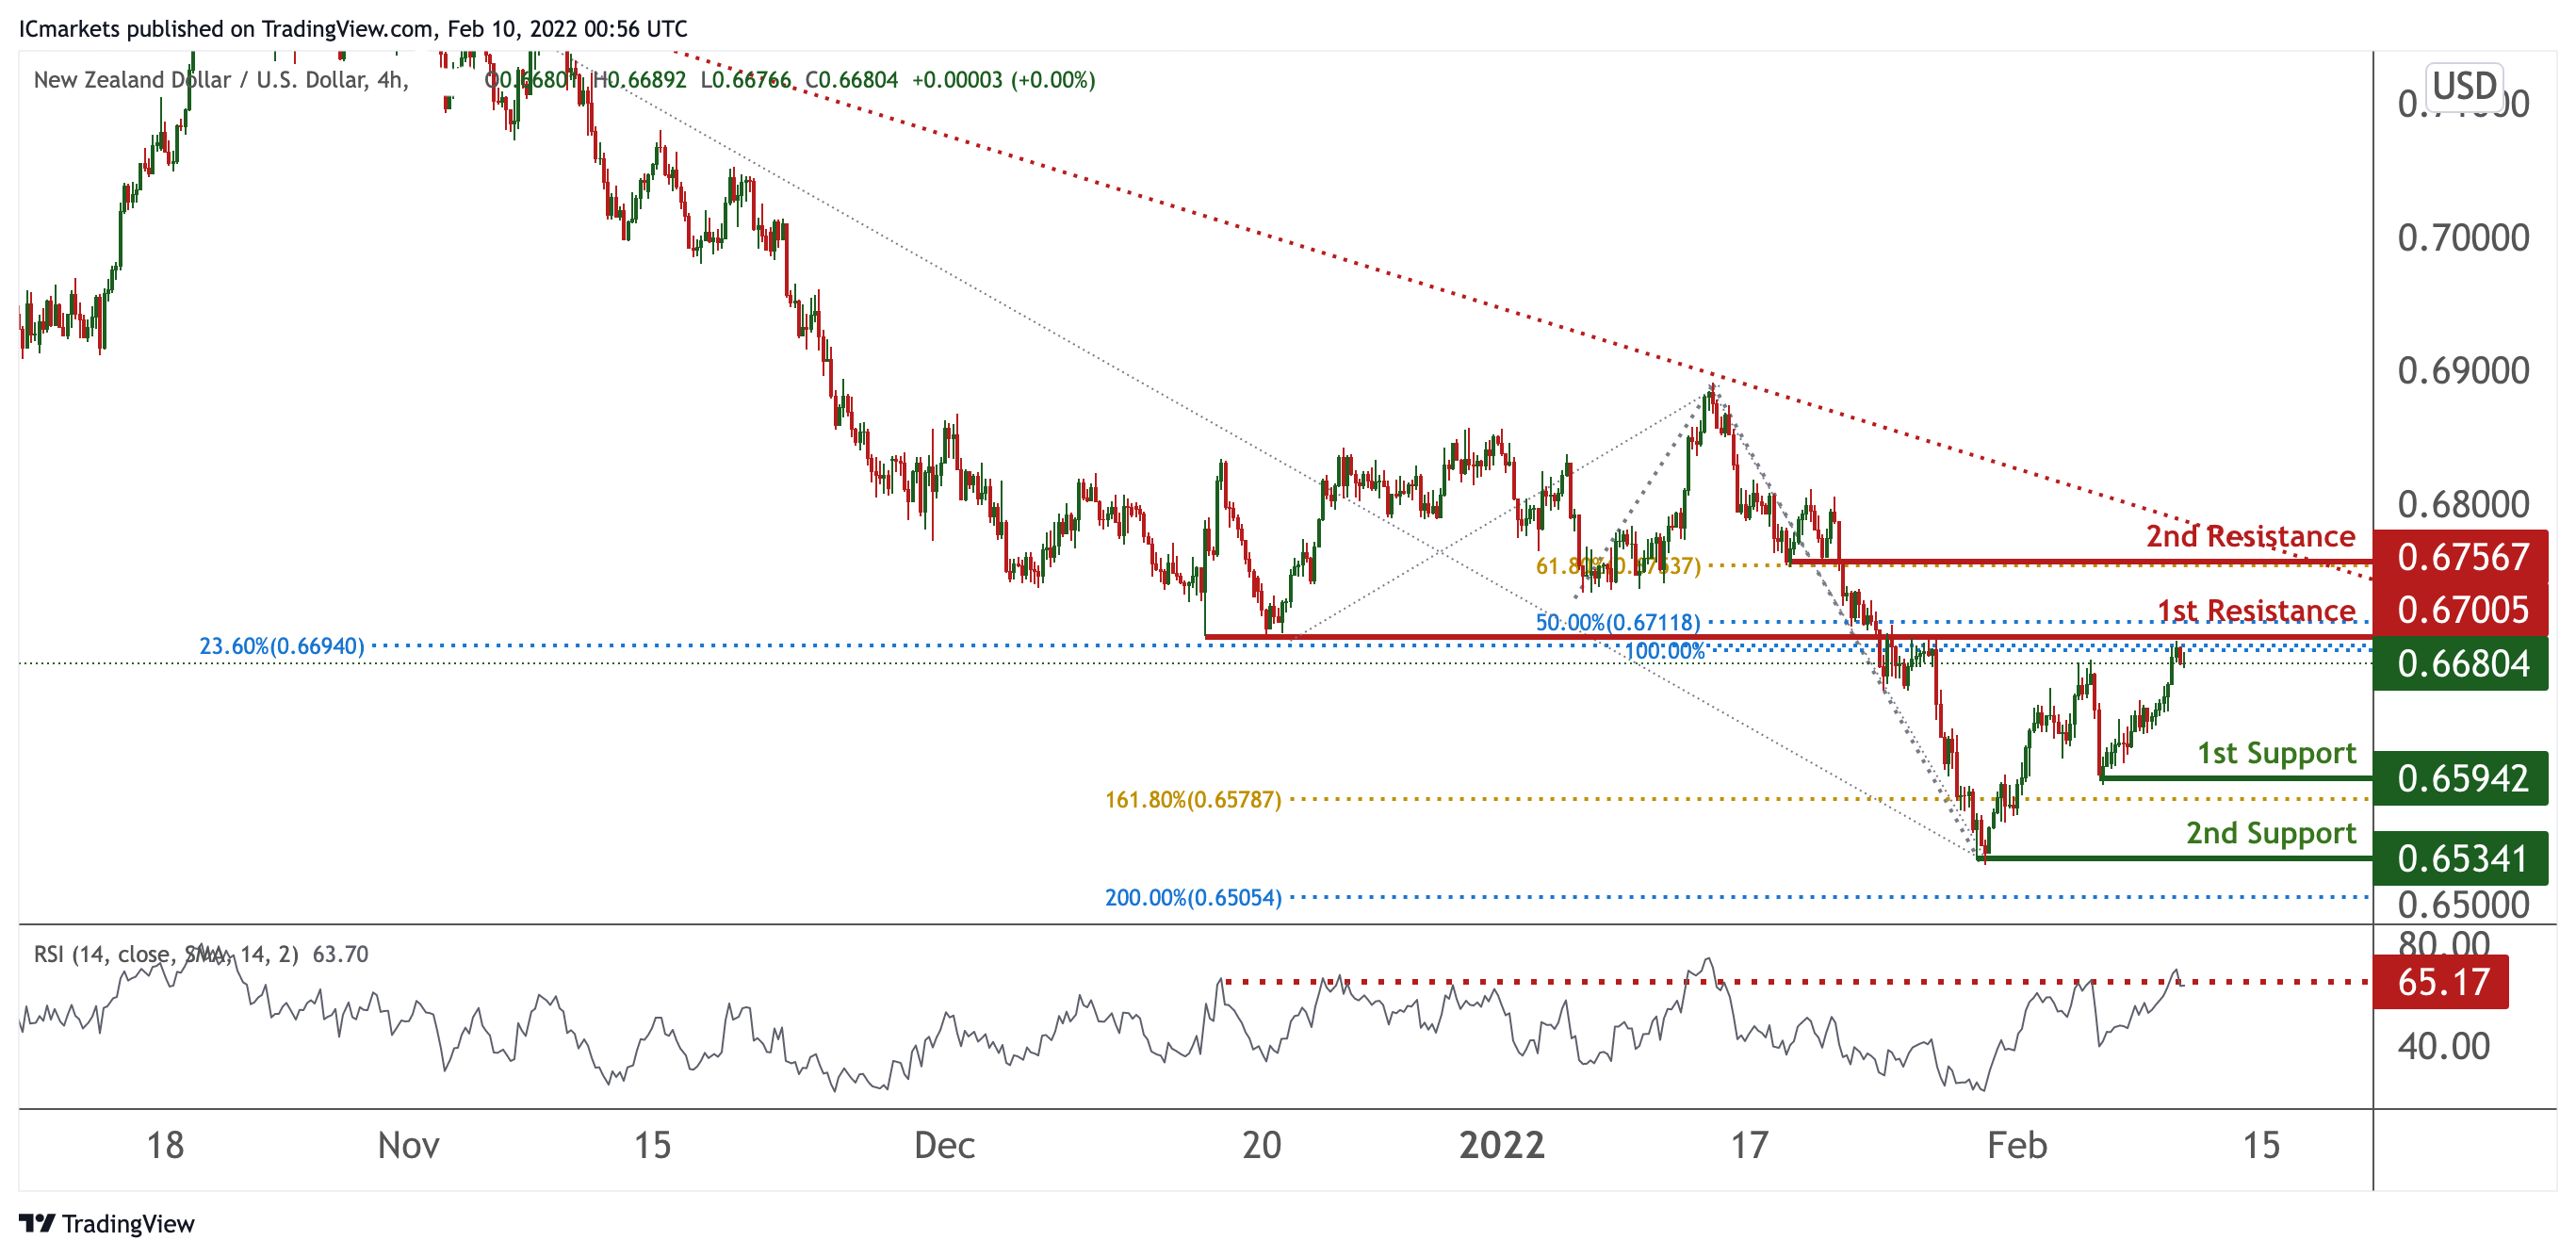
On the H4 timeframe, prices were on bearish momentum and are abiding to our descending trendline. We see potential for prices to dip from our 1st resistance at 0.67005 in line with 23.6% Fibonacci retracement, 38.2% Fibonacci retracement and 78.6% Fibonacci extension towards our 1st support at 0.65916 in line with 161.8% Fibonacci retracement. Our bias is further supported by RSI being at levels where dips previously occurred. Alternatively, our stop loss will be placed at 2nd resistance at 0.67567 in line with 61.8% Fibonacci retracement.
Areas of consideration:
- H4 time frame, 1st resistance at 0.67005
- H4 time frame, 1st support at 0.65942
USD/CAD:
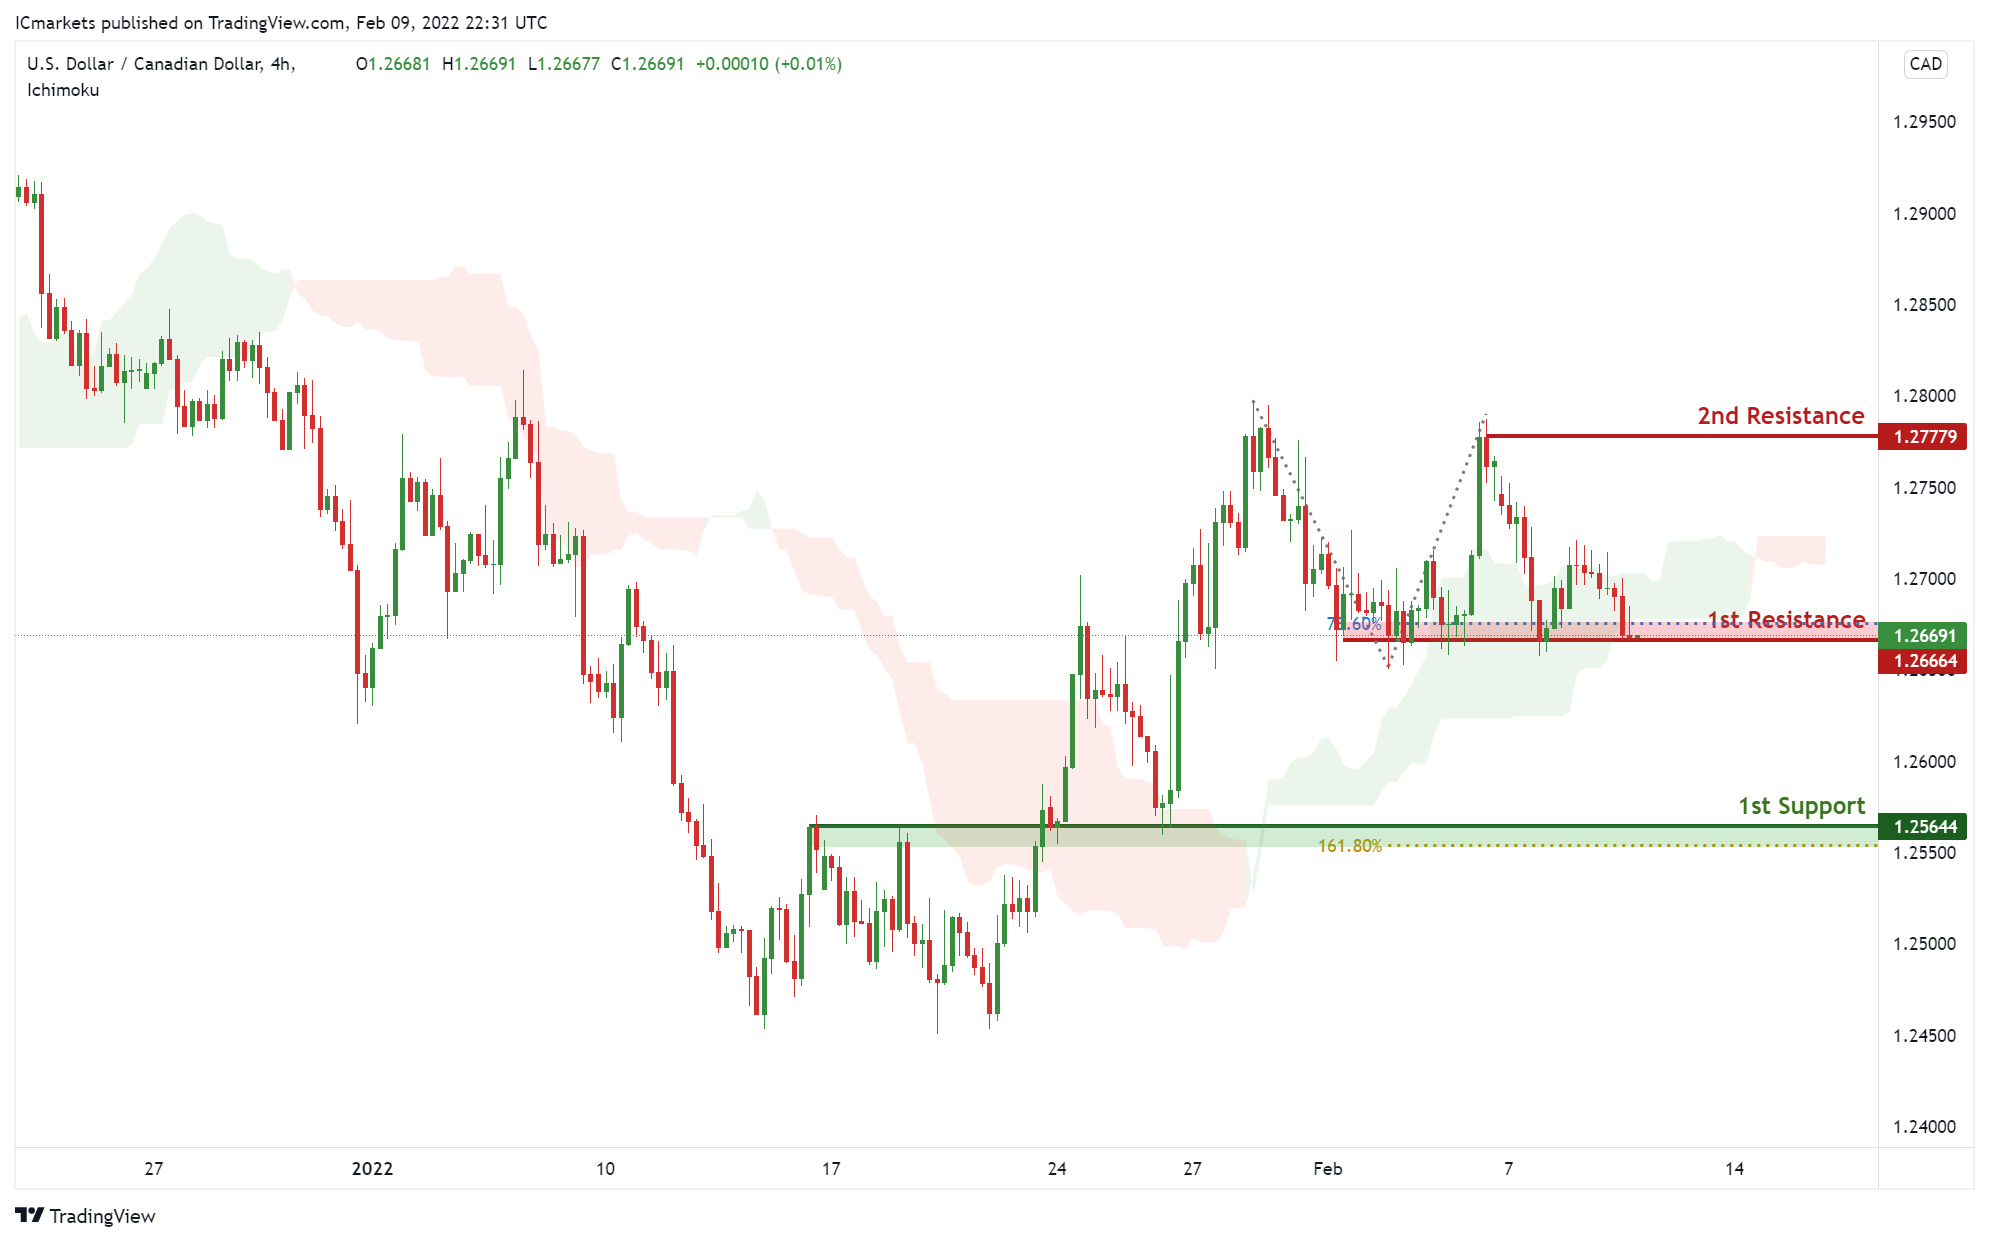
On the H4, with prices moving below the ichimoku cloud, we see a potential drop to our 1st support at 1.25644 in line with horizontal overlap support and 161.8% Fibonacci projection from our 1st resistance at 1.26664 in line with horizontal overlap resistance. Alternatively, price may break 1st resistance structure and head for 2nd resistance at 1.27779, in line with the horizontal swing high resistance.
Areas of consideration:
- H4 time frame, 1st support at 1.25644
- H4 time frame, 1st resistance at 1.26664
OIL:
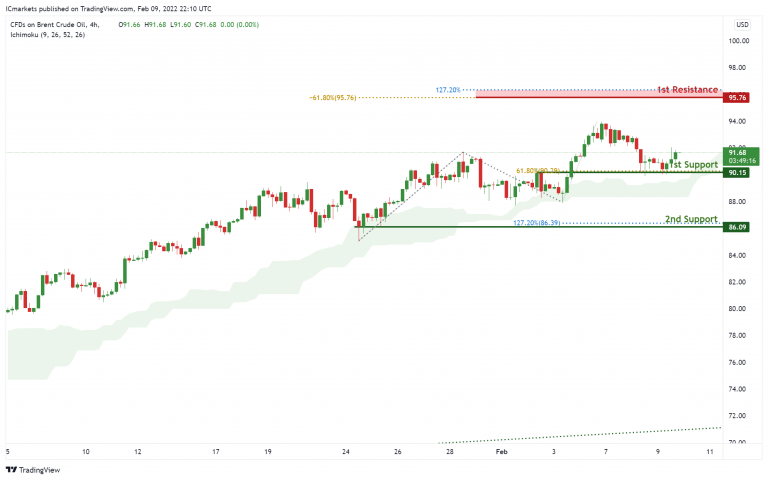
On the H4, with prices moving above the ichimoku cloud, we see the potential for a bounce from our 1st support at 90.15 in line with horizontal overlap support towards our 1st resistance at 95.76 in line with the 127.2% Fibonacci extension and -61.8% Fibonacci expansion. Alternatively, price may break 1st support structure and head for 2nd support at 86.09, in line with the horizontal swing low support and 127.2% Fibonacci extension.
Areas of consideration:
- H4 time frame, 1st resistance of 95.76
- H4 time frame, 1st support of 90.15
Dow Jones Industrial Average:
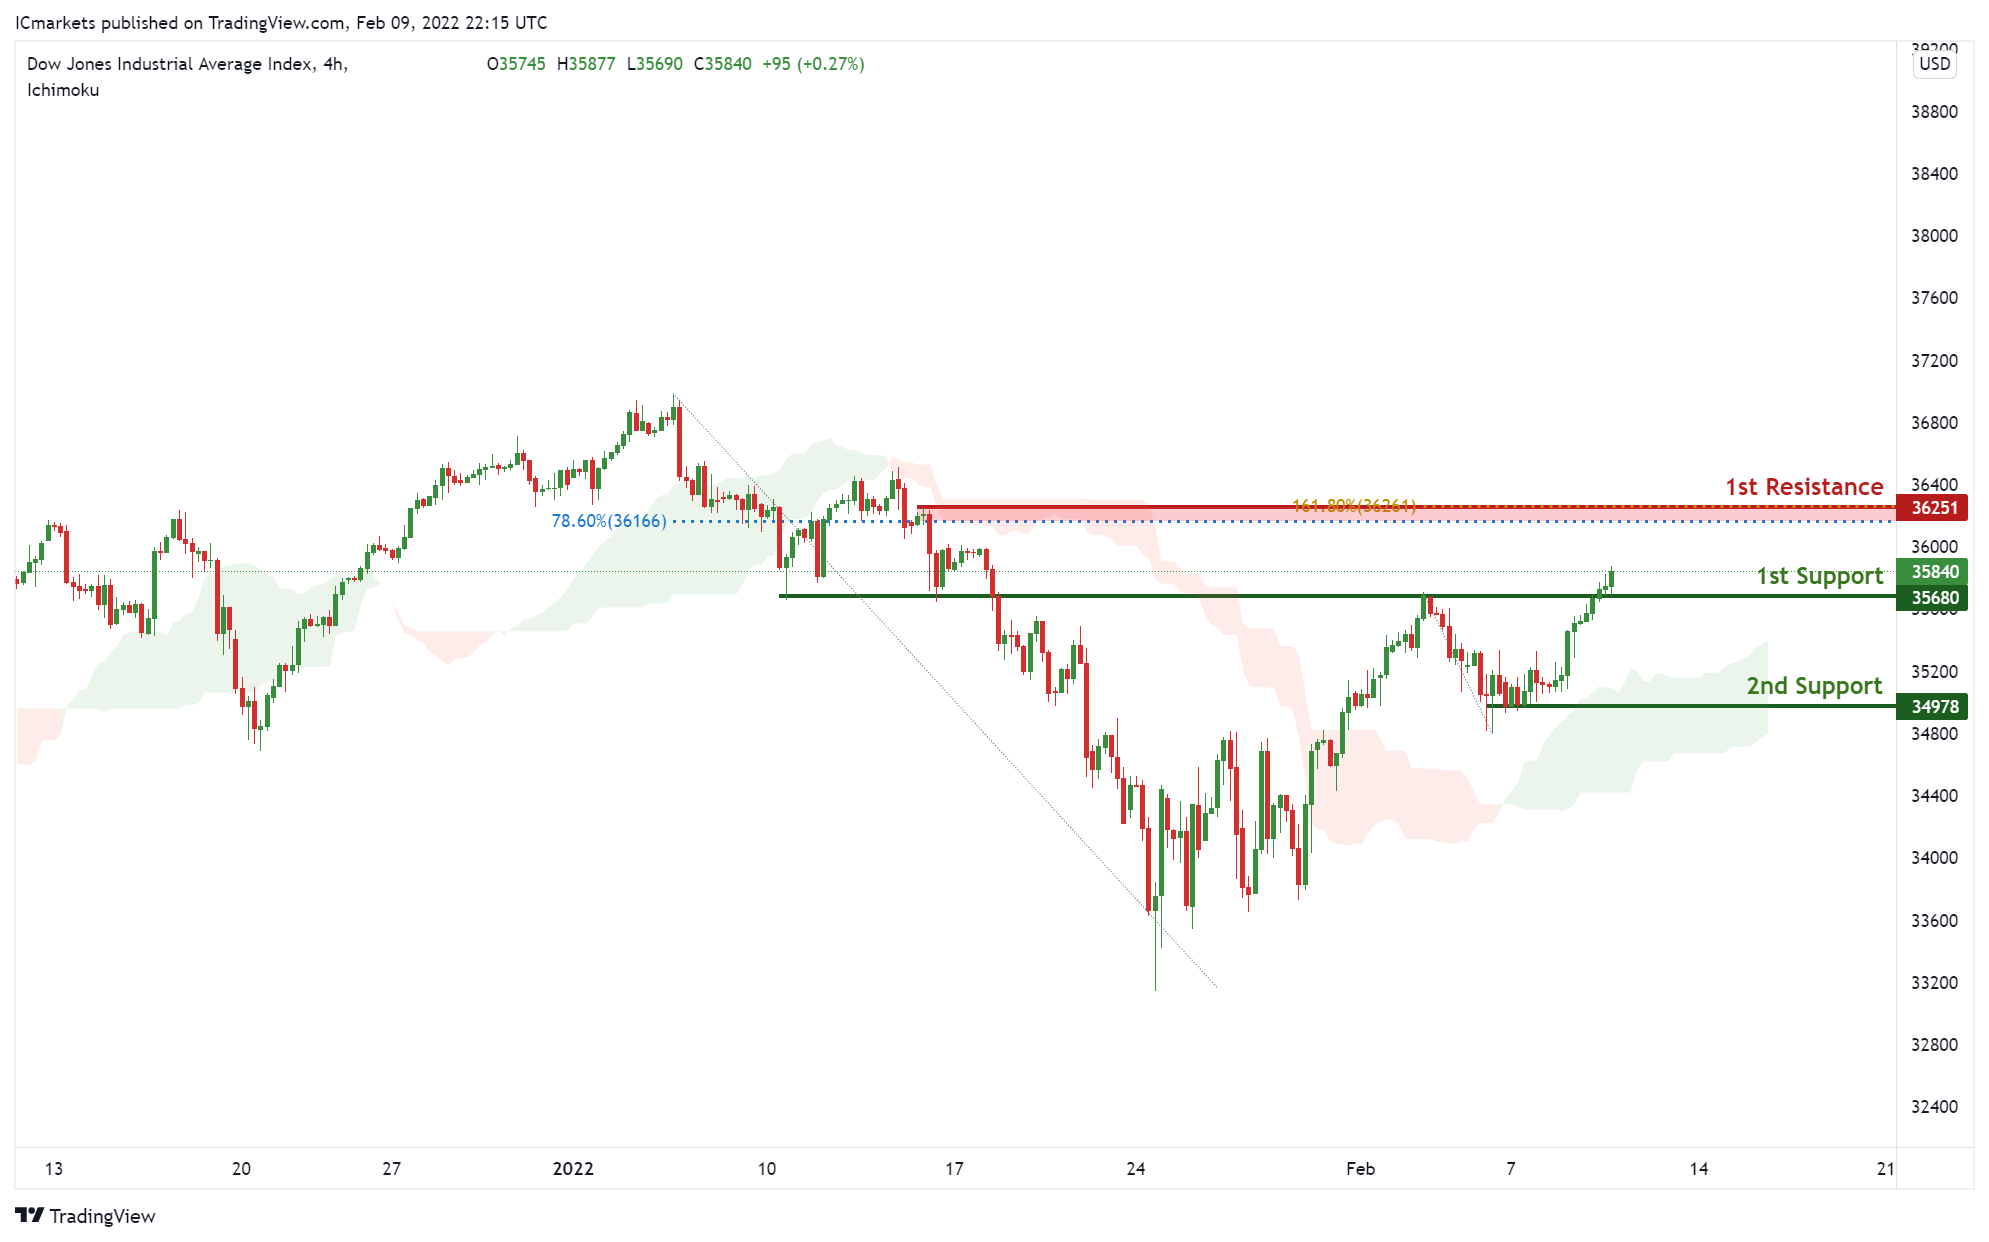
On the H4, with price moving above the ichimoku cloud, signifying an overall bullish momentum. We can expect price to rise to our 1st resistance at 36251 in line horizontal graphical swing high resistance and 161.8% Fibonacci extension from our 1st support in line with horizontal overlap support at 35680. Alternatively, price may break 1st support structure and head for 2nd support, which coincides with horizontal swing low support at 34978.
Areas of consideration:
- H4 time frame, 1st resistance of 36251
- H4 time frame, 1st support of 35680
EUR/USD Daily Outlook
Daily Pivots: (S1) 1.1402; (P) 1.1425; (R1) 1.1447; More...
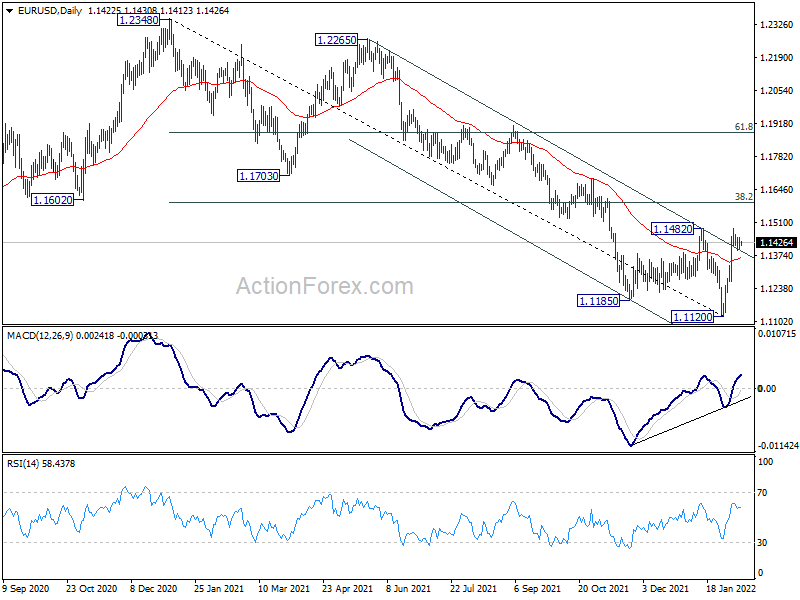
EUR/USD is still staying in consolidation in tight range and intraday bias remains neutral. As noted before, a medium term bottom could be in place at 1.1120, on bullish convergence condition in daily MACD. Break of 1.1482 resistance will target 38.2% retracement of 1.2348 to 1.1120 at 1.1589 next. Sustained break there will argue that whole fall from 1.2348 has completed too and target 61.8% retracement at 1.1879. On the down, however, break of 1.1265 support will dampen this bullish view and bring retest of 1.1120 low instead.
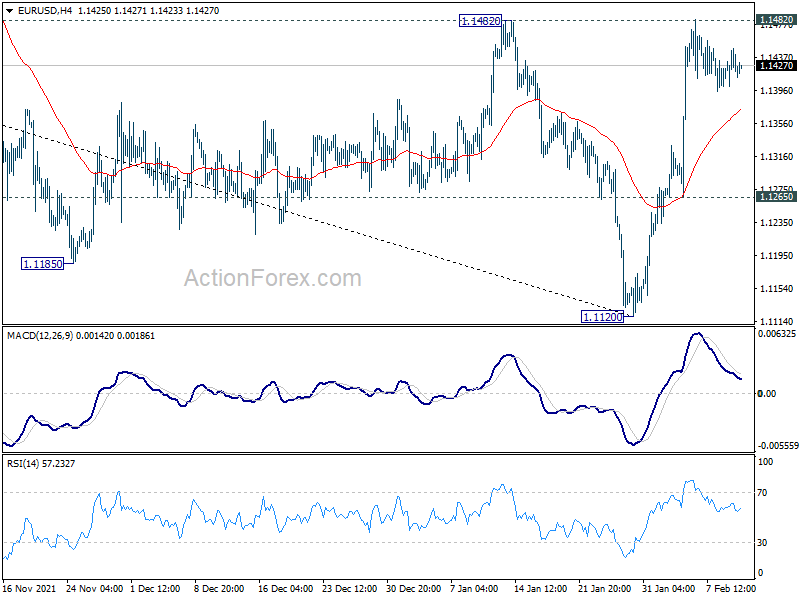
In the bigger picture, the decline from 1.2348 (2021 high) is seen as a leg inside the range pattern from 1.2555 (2018 high). Sustained trading above 55 week EMA (now at 1.1613) will argue that it has completed and stronger rise would be seen back towards top of the range between 1.2348 and 1.2555. However, firm break of 1.0635 (2020 low) will raise the chance of long term down trend resumption and target a retest on 1.0339 (2017 low) next.
Dollar Soft with Yen as US CPI Awaited
While US stocks staged a strong rally overnight, Asian markets turned mixed. Investors are holding their bets ahead of US CPI data. Australian Dollar remains the strongest one for the week, followed by Kiwi. Loonie also regained some ground with help from the stabilization in oil prices. On the other hand, Yen is currently the worst performing one, followed by Euro and then Dollar.
Technically, major focus remains on 1.1482 resistance in EUR/USD. Firm break there will add to the case of bullish trend reversal. At the same time, if that happens, attention will be paid on whether it's more of a return to strength in Euro, or weakness in Dollar. Sterling could be used as a gauge. Break of 1.3627 resistance in GBP/USD will be a sign of Dollar weakness. Break of 0.8476 resistance in EUR/GBP will be a sign of Euro strength. But of course, both could happen at the same time.
In Asia, Nikkei closed up 0.30%. Hong Kong HSI is down -0.33%. China Shanghai SSE is down -0.36%. Singapore Strait Times is down -0.02%. Japan 10-year JGB yield is up 0.0185 at 0.227. Overnight, DOW rose 0.86%. S&P 500 rose 1.45%. NASDAQ rose 2.08%. 10-year yield dropped -0.025 to 1.929.
Fed Mester: No compelling case to start with 50bps hike
Cleveland Fed President Loretta Mester "each meeting is going to be in play" regarding interest rate decisions. She added, "we're going to assess conditions, we're going to assess how the economy's evolving, we're going to be looking at the risks, and we're going to be removing accommodation."
On the idea of a 50bps rate hike in March, Mester said "I don't like taking anything off the table." However, "I don't think there's any compelling case to start with a 50 basis point".
"Again, we've got to be a little bit careful. Even though you can well telegraph what's coming, when you take that first action, there's going to be a reaction," she added.
On the topic of balance sheet runoff, Mester said, "I would support selling some of our mortgage-backed securities at some point during the reduction period to speed the conversion of our portfolio's composition to primarily Treasuries."
BoC Macklem: We signalled with unusual clarity a rising path for interest rates
In a speech, BoC Governor Tiff Macklem said current inflation, close to 5%, is "too high". But that is "not the result of generalized excess demand in the Canadian economy". Inflation "largely reflects global supply problems, most of which stem from the pandemic". As the pandemic recedes, "conditions around the world should normalize, taking pressure off global goods prices.". BoC expects inflation to "come down relatively quickly" in H2 2022 to 3% by the end of the year.
Macklem added, "to get inflation the rest of the way back to its 2% target, we need a significant shift in monetary policy". The economy will need "higher interest rates to moderate growth in spending and bring demand in line with supply", and "keep inflation expectations well anchored". And, "we signalled with unusual clarity that Canadians should expect a rising path for interest rates."
Japan CGPI rose 8.6% yoy in Jan, index at highest since 1985
Japan corporate goods price index rose 8.6% yoy in January, slowed slightly from December's 8.7% yoy, but beat expectation of 8.2% yoy. At 109.5, the index was at the highest level since September 1985.
Export prices jumped 12.5% yoy on Yen basis, 6.6% yoy on contract currency basis. Import prices surged a massive 37.5% yoy on Yen basis, and 28.0% yoy on contract currency basis.
However, consumer prices remained sluggish, with national CPI core at 0.5% yoy in December, which some economists expected to slow to 0.3% yoy in January.
BoJ officials, including Governor Haruhiko Kuroda, have indicated that it would be hard to see consumer inflation to sustainably reach 2% target without wages rise.
Elsewhere
Australia consumer inflation expectations rose further to 4.6% in February, up from 4.4%. UK RICS house price balance rose from 69 to 74, above expectation of 72.
Looking ahead, US CPI will be the major focus of the day. Jobless claims will be released as usual on a Tuesday.
EUR/USD Daily Outlook
Daily Pivots: (S1) 1.1402; (P) 1.1425; (R1) 1.1447; More...
EUR/USD is still staying in consolidation in tight range and intraday bias remains neutral. As noted before, a medium term bottom could be in place at 1.1120, on bullish convergence condition in daily MACD. Break of 1.1482 resistance will target 38.2% retracement of 1.2348 to 1.1120 at 1.1589 next. Sustained break there will argue that whole fall from 1.2348 has completed too and target 61.8% retracement at 1.1879. On the down, however, break of 1.1265 support will dampen this bullish view and bring retest of 1.1120 low instead.
In the bigger picture, the decline from 1.2348 (2021 high) is seen as a leg inside the range pattern from 1.2555 (2018 high). Sustained trading above 55 week EMA (now at 1.1613) will argue that it has completed and stronger rise would be seen back towards top of the range between 1.2348 and 1.2555. However, firm break of 1.0635 (2020 low) will raise the chance of long term down trend resumption and target a retest on 1.0339 (2017 low) next.
Economic Indicators Update
| GMT | Ccy | Events | Actual | Forecast | Previous | Revised |
|---|---|---|---|---|---|---|
| 23:50 | JPY | PPI Y/Y Jan | 8.60% | 8.20% | 8.50% | 8.70% |
| 00:00 | AUD | Consumer Inflation Expectations Feb | 4.60% | 4.40% | ||
| 00:01 | GBP | RICS Housing Price Balance Jan | 74% | 72% | 69% | |
| 13:30 | USD | Initial Jobless Claims (Feb 4) | 230K | 238K | ||
| 13:30 | USD | CPI M/M Jan | 0.40% | 0.50% | ||
| 13:30 | USD | CPI Y/Y Jan | 7.30% | 7.00% | ||
| 13:30 | USD | CPI Core M/M Jan | 0.50% | 0.60% | ||
| 13:30 | USD | CPI Core Y/Y Jan | 5.90% | 5.50% |
USD/CHF Struggles Ahead of US CPI Report
Key Highlights
- USD/CHF corrected gains from the 0.9340 resistance zone.
- There is a key bullish trend line forming with support near 0.9215 on the 4-hours chart.
- EUR/USD is holding gains above 1.1400, and GBP/USD attempts to clear the 1.3600 resistance.
- The US CPI could increase 7.3% in Jan 2022 (YoY).
USD/CHF Technical Analysis
The US Dollar failed to clear the 0.9350 resistance against the Swiss Franc. USD/CHF corrected lower below 0.9300, but dips were limited below the 0.9200 level.
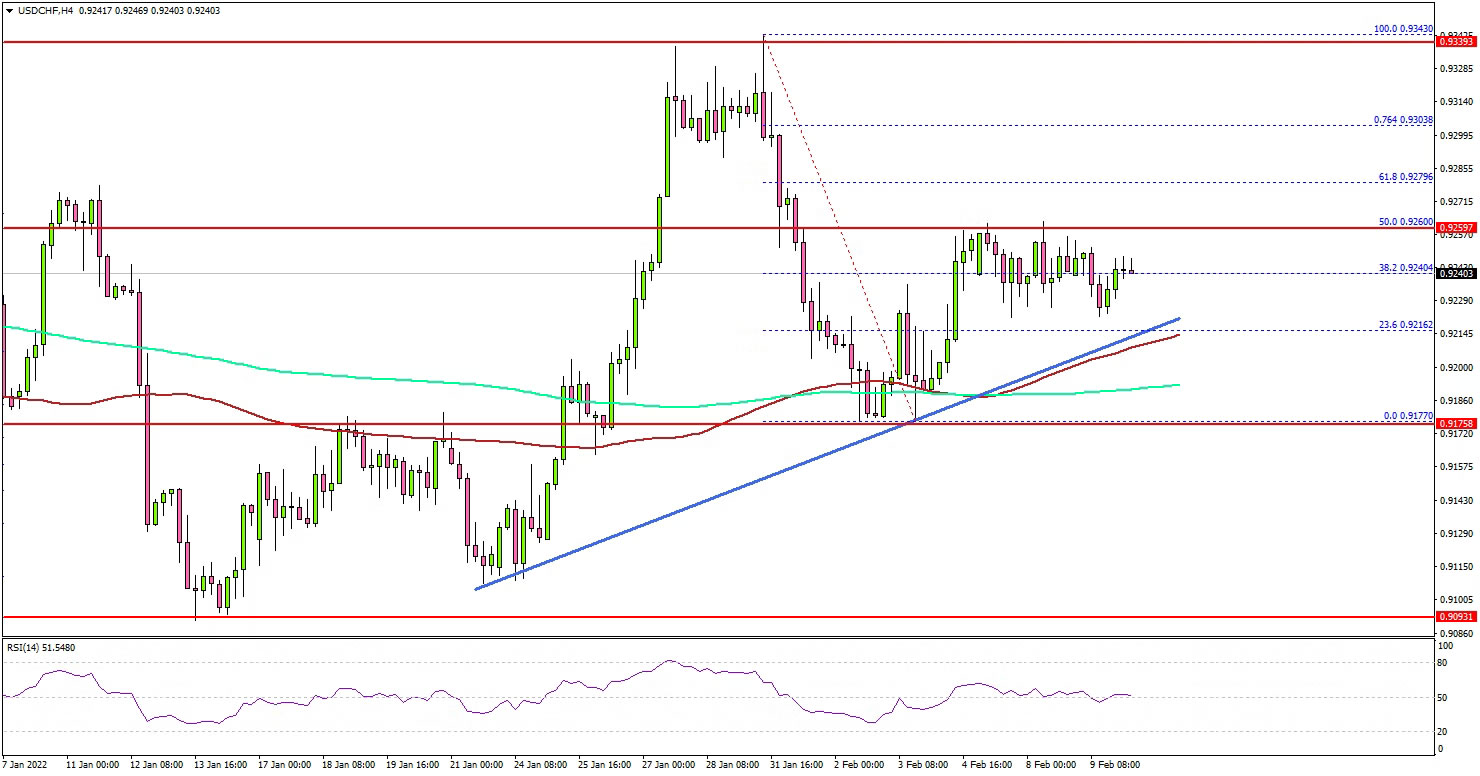
Looking at the 4-hours chart, the pair traded as low as 0.9177 and started a fresh increase. There was a move above the 0.9220 resistance level, the 100 simple moving average (red, 4-hours), and the 200 simple moving average (green, 4-hours).
However, the bears were active near the 50% Fib retracement level of the recent decline from the 0.9343 swing high to 0.9177 low.
To continue higher, the pair must surpass the 0.9260 resistance. The next major resistance is near the 0.9300 level. It coincides with the 76.4% Fib retracement level of the recent decline from the 0.9343 swing high to 0.9177 low.
A clear move above the 0.9260 resistance might start a major increase in the coming sessions. If not, there is a risk of a break below the 0.9200 support.
The next major support is near the 0.9180 level. Any more downsides might send the pair towards the 0.9100 level in the near term.
Looking at EUR/USD, the pair stayed above 1.1380 and might attempt a fresh rally. Similarly, GBP/USD could gain bullish momentum if it settles above the 1.3600 level.
Economic Releases
US Initial Jobless Claims - Forecast 230K, versus 238K previous.
US Consumer Price Index for Jan 2022 (MoM) – Forecast +0.5%, versus +0.5% previous.
US Consumer Price Index for Jan 2022 (YoY) – Forecast +7.3%, versus +7.0% previous.
US Consumer Price Index Ex Food & Energy for Jan 2022 (YoY) – Forecast +5.9%, versus +5.9% previous.
AUDUSD Wave Analysis
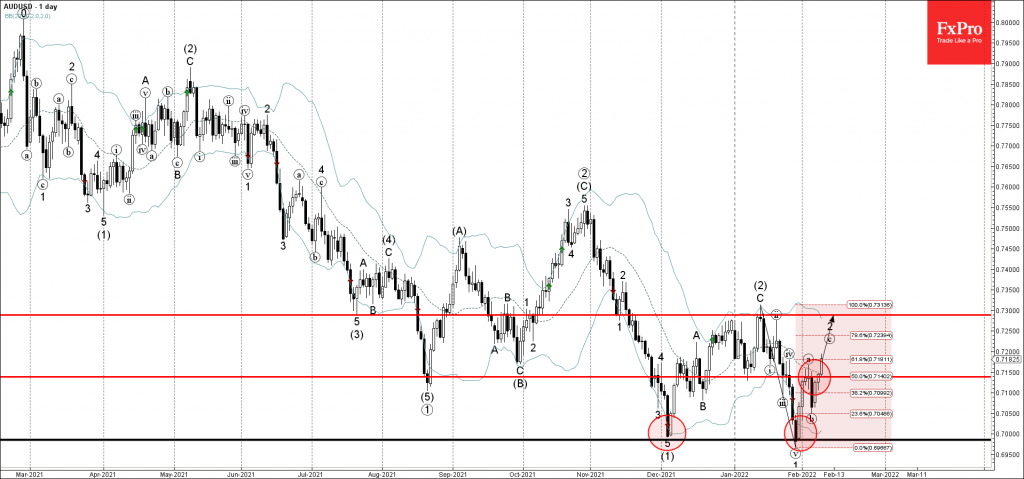
- AUDUSD broke resistance level 0.715
- Likely to rise to resistance level 0.7300
AUDUSD currency pair recently broke the key resistance level 0.715 (former strong support from the start of Januarys).
The breakout of the resistance level 0.715 coincided with the breakout of the 50% Fibonacci correction of the previous sharp impulse wave 1.
AUDUSD currency pair can be expected to rise further toward the next resistance level 0.7300 (target for the completion of the active wave 2).
Japan CGPI rose 8.6% yoy in Jan, index at highest since 1985
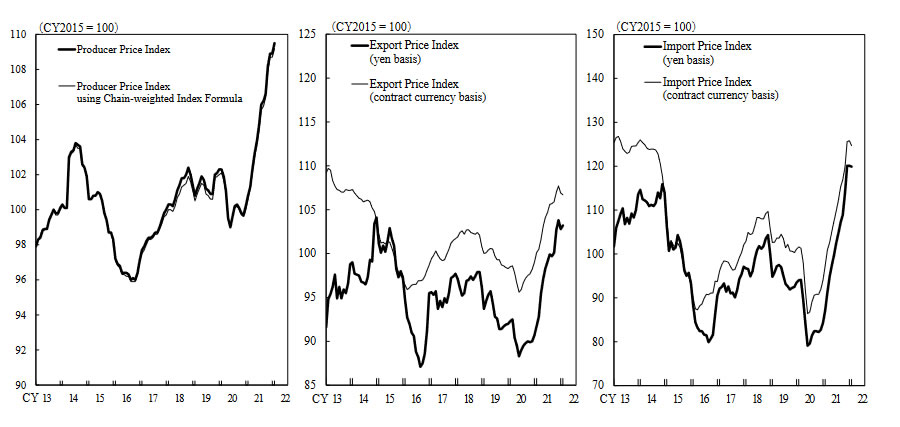
Japan corporate goods price index rose 8.6% yoy in January, slowed slightly from December's 8.7% yoy, but beat expectation of 8.2% yoy. At 109.5, the index was at the highest level since September 1985.
Export prices jumped 12.5% yoy on Yen basis, 6.6% yoy on contract currency basis. Import prices surged a massive 37.5% yoy on Yen basis, and 28.0% yoy on contract currency basis.
However, consumer prices remained sluggish, with national CPI core at 0.5% yoy in December, which some economists expected to slow to 0.3% yoy in January.
BoJ officials, including Governor Haruhiko Kuroda, have indicated that it would be hard to see consumer inflation to sustainably reach 2% target without wages rise.
Fed Mester: No compelling case to start with 50bps hike
Cleveland Fed President Loretta Mester "each meeting is going to be in play" regarding interest rate decisions. She added, "we're going to assess conditions, we're going to assess how the economy's evolving, we're going to be looking at the risks, and we're going to be removing accommodation."
On the idea of a 50bps rate hike in March, Mester said "I don't like taking anything off the table." However, "I don't think there's any compelling case to start with a 50 basis point".
"Again, we've got to be a little bit careful. Even though you can well telegraph what's coming, when you take that first action, there's going to be a reaction," she added.
On the topic of balance sheet runoff, Mester said, "I would support selling some of our mortgage-backed securities at some point during the reduction period to speed the conversion of our portfolio's composition to primarily Treasuries."
BoC Macklem: We signalled with unusual clarity a rising path for interest rates
In a speech, BoC Governor Tiff Macklem said current inflation, close to 5%, is "too high". But that is "not the result of generalized excess demand in the Canadian economy". Inflation "largely reflects global supply problems, most of which stem from the pandemic". As the pandemic recedes, "conditions around the world should normalize, taking pressure off global goods prices.". BoC expects inflation to "come down relatively quickly" in H2 2022 to 3% by the end of the year.
Macklem added, "to get inflation the rest of the way back to its 2% target, we need a significant shift in monetary policy". The economy will need "higher interest rates to moderate growth in spending and bring demand in line with supply", and "keep inflation expectations well anchored". And, "we signalled with unusual clarity that Canadians should expect a rising path for interest rates."