Sample Category Title
EUR/USD Mid-Day Outlook
Daily Pivots: (S1) 1.1415; (P) 1.1449; (R1) 1.1486; More...
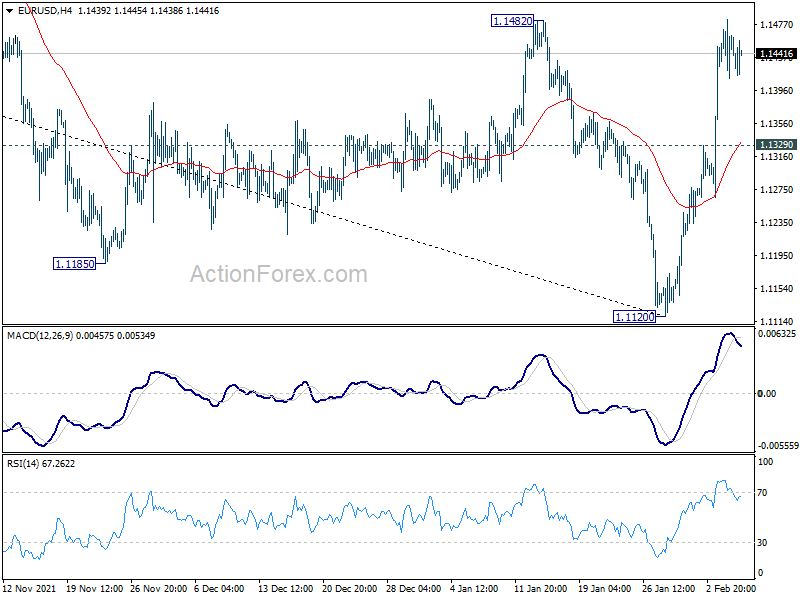
Focus stays on 1.1482 resistance in EUR/USD. A medium term bottom could be in place at 1.1120, on bullish convergence condition in daily MACD. Break of 1.1482 resistance will target 38.2% retracement of 1.2348 to 1.1120 at 1.1589 next. Sustained break there will argue that whole fall from 1.2348 has completed too and target 61.8% retracement at 1.1879. On the downside, break of 1.1329 minor support will mix up the outlook and turn intraday bias neutral first.
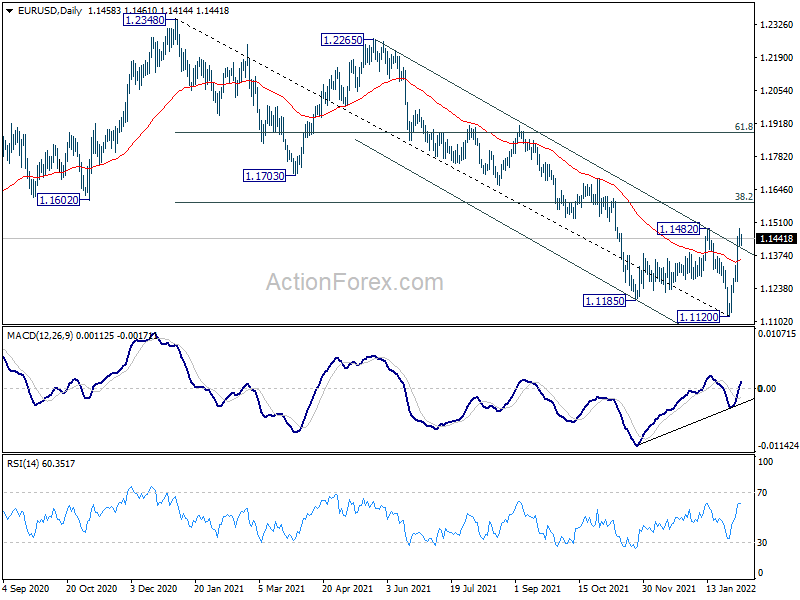
In the bigger picture, the decline from 1.2348 (2021 high) is seen as a leg inside the range pattern from 1.2555 (2018 high). Sustained trading above 55 week EMA (now at 1.1613) will argue that it has completed and stronger rise would be seen back towards top of the range between 1.2348 and 1.2555. However, firm break of 1.0635 (2020 low) will raise the chance of long term down trend resumption and target a retest on 1.0339 (2017 low) next.
GBP/USD Daily Outlook
Daily Pivots: (S1) 1.3484; (P) 1.3549; (R1) 1.3594; More...
Intraday bias in GBP/USD remains neutral as range trading continues. On the upside, break of 1.3627 will resume the rebound to 1.3748 resistance. Firm break there will revive the bullish case that correction from 1.4248 has completed with three waves down to 1.3158. Further rally should then be seen to retest 1.4248 high. On the downside, however, break of 1.3356 will bring retest of 1.3158 low.

In the bigger picture, as long as 38.2% retracement of 1.1409 to 1.4248 at 1.3164 holds, up trend from 1.1409 (2020 low) is still in progress. On resumption, next target will be 38.2% retracement of 2.1161 to 1.1409 at 1.5134. Nevertheless sustained break of 1.3164 will argue that whole rise from 1.1409 has completed and bring deeper fall to 61.8% retracement at 1.2493.

USD/CHF Mid-Day Outlook
Daily Pivots: (S1) 0.9213; (P) 0.9236; (R1) 0.9279; More....
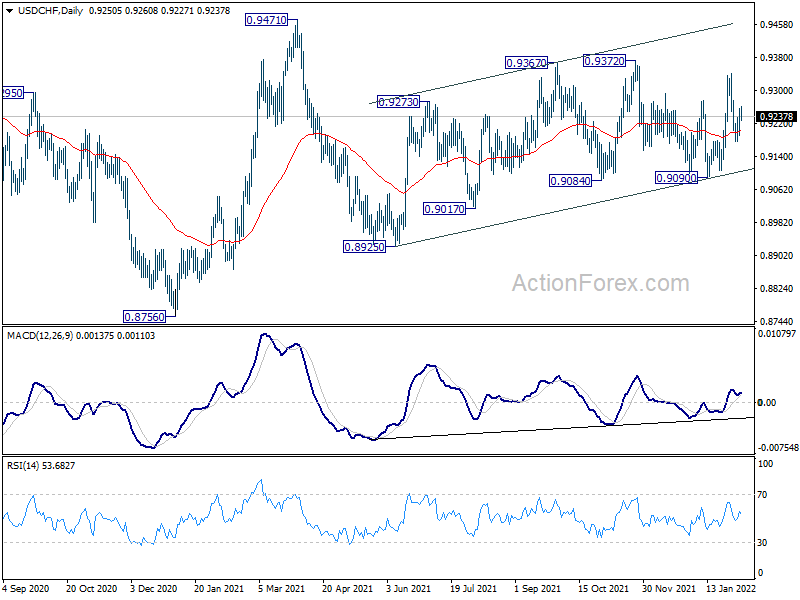
Range trading continues in USD/CHF and intraday bias remains neutral for the moment. Further rise will remain mildly in favor as long as 0.9090 support holds. break of 0.9372 will resume the choppy rally from 0.8925 to 0.9471 high. However, break of 0.9090 will turn bias back to the downside for 0.8925 support instead.
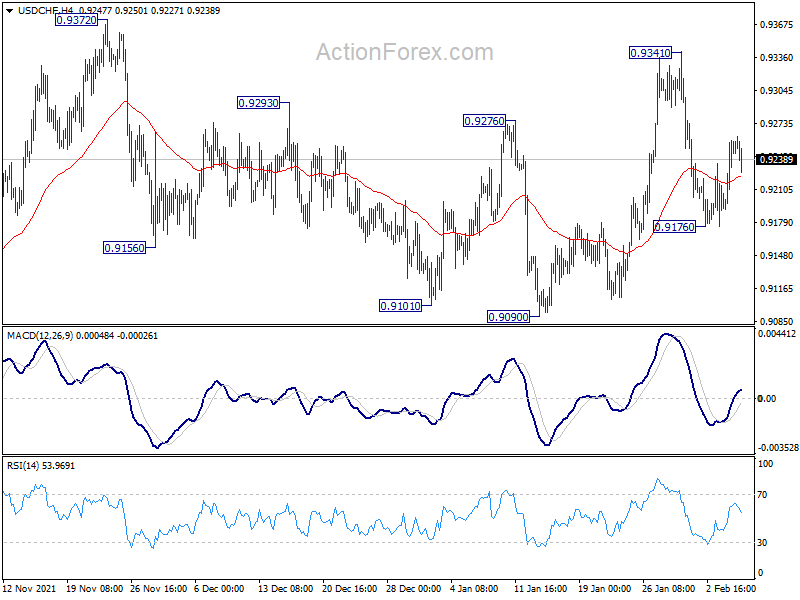
In the bigger picture, medium term outlook will be neutral at best as long as 0.9471 resistance holds. Larger down trend could still extend through 0.8756 (2021 low). However, firm break of 0.9471 will argue that the trend has already reversed and rebound the rally from 0.8756 with another impulsive move.
USD/JPY Mid-Day Outlook
Daily Pivots: (S1) 114.84; (P) 115.13; (R1) 115.49; More...
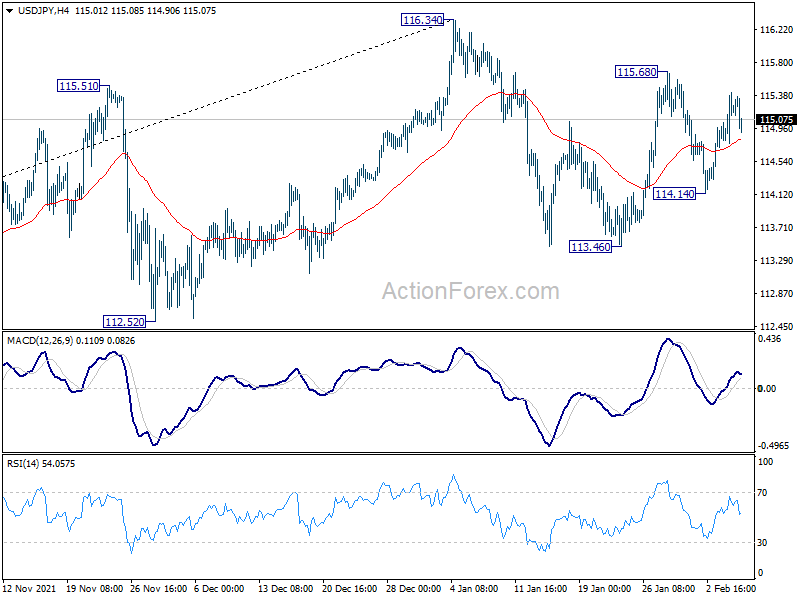
USD/JPY is still bounded in sideway trading and intraday bias remains neutral. Consolidation from 116.34 is still extending. On the upside, break of 115.68 will resume the rebound from 113.46 to retest 116.34 high first. On the downside, break of 114.14 should extend the consolidation with another falling leg through 113.46 support.
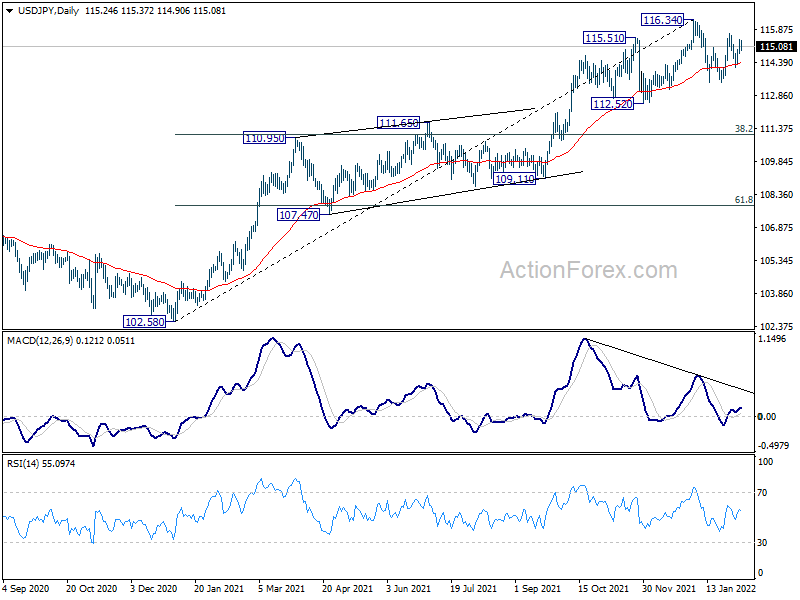
In the bigger picture, no change in the view that rise from 102.58 is the third leg of the up trend from 101.18 (2020 low). Such rally should target a test on 118.65 (2016 high). Sustained break there will pave the way to 120.85 (2015 high) and raise the chance of long term up trend resumption. This will remain the favored case as long as 55 week EMA (now at 111.21) holds.
Euro Extending Consolidations Despite Improving Investor Confidence, Dollar also Soft
Australian Dollar is leading commodity currencies higher in relatively quiet trading today. Swiss Franc is also firm, but mainly because Euro is consolidation gains. Sterling is currently the weakest one, followed by Euro and then Dollar, while Yen is mixed. In other markets, major European indexes are trading water while US futures point to slightly higher open. Gold is trading above 1800 handle but lacks follow through buying so far. WTI crude oil is holding on well to 92 handle for further rally.
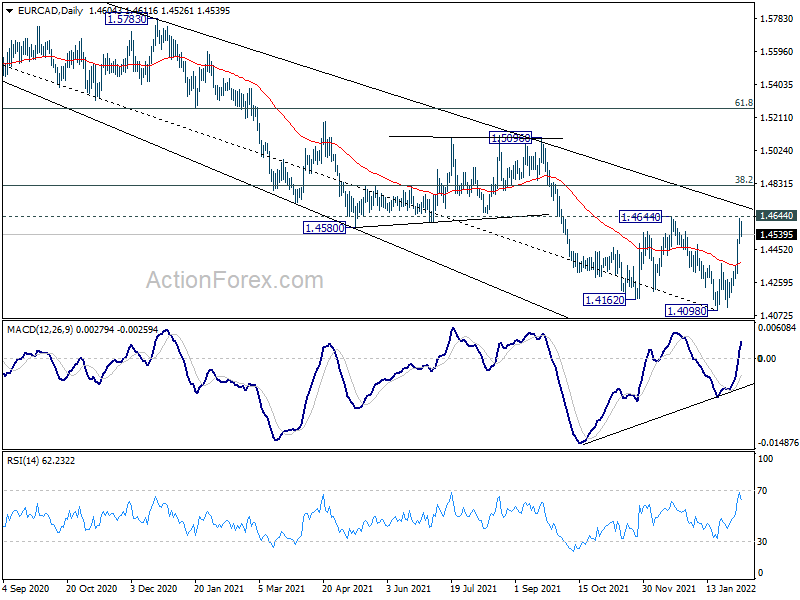
Technically, in addition to 1.1482 resistance in EUR/CAD. We'll also pay close attention to 1.4644 resistance in EUR/CAD. Sustained break there will be a sign of medium term bullish reversal and turn focus to 38.2% retracement of 1.5991 to 1.4098 at 1.4821. Euro will have to break through these two levels with some conviction if the trend reversal is for real.
In Europe, at the time of writing, FTSE is up 0.63%. DAX is up 0.47%. CAC is up 0.39%. Germany 10-year yield is up 0.011 at 0.221. Earlier in Asia, Nikkei dropped -0.70%. Hong Kong HSI rose 0.02%. China Shanghai SSE rose 2.03%. Singapore Strait Times rose 1.05%. Japan 10-year JGB yield dropped -0.0007 to 0.200.
Eurozone Sentix investor confidence rose to 15.2, lack of sustainable new growth drivers
Eurozone Sentix Investor Confidence rose from 14.9 to 15.2 in February, above expectation of 15.2. Current situation index rose from 16.3 to 19.3. Expectations index rose from 13.5 to 14.0, highest since July.
Sentix said: "The economic situation in Euroland is stable in February 2022. The situation and expectations of the more than 1,200 investors surveyed by sentix signal a slight improvement. Thus, our assumption that we are in a "mid-cycle slowdown", i.e. a growth moderation in the middle of an economic cycle, which we have been expressing here for months, remains unchanged. However, this phase of moderation is not yet complete. There is a lack of sustainable new growth drivers. Above all, there is a lack of impetus from the international economy."
Also released, Germany industrial production dropped -0.3% mom in December versus expectation of 0.8% mom. Swiss unemployment rate dropped from 2.4% to 2.3% in January. Swiss foreign currency reserves rose slightly to CHF 947B in January.
ECB Kazaks: July hike imply an imply an extremely and unlikely quick pace of tapering
ECB Governing Council member Martins Kazaks said in a Reuters interview that a July rate hike "would imply an extremely and unlikely quick pace of tapering". Overall, "at the current juncture, naming a specific month would be much premature."
"If we see that inflation remains high and the labor market remains strong or strengthens further, if we see that the economy keeps going, the direction is clear: we may act sooner than we assumed in the past," he added.
Over the weekend, another Governing Council member Klass Knot said, "personally I expect our first rate increase to take place around the fourth quarter of this year.... Normally we would raise rates by a quarter percentage point, I have no reason to expect we would take a different step."
Australia AiG services rose to 56.2, rising sales, employment and new orders
Australia AiG Performance of Services Index rose 6.6 pts to 56.2 in January, hitting the highest level since June last year. Looking at some details, sales rose 5.3 to 58.9. Employment rose 0.5 to 56.7. New orders rose 10.5 to 57.9. Supplier deliveries rose 11.0 to 51.4. Input prices rose 0.8 to 66.1. Selling prices rose 4.0 to 62.2. Average wages dropped -2.9 to 56.9.
Innes Willox, Chief Executive of Ai Group, said: "The performance of Australia's services sector rose over the December-January period with sales, employment and new orders all growing compared with November.... Businesses reported a slight easing of input price and wages pressures compared with November while selling prices rose indicating a belated and partial recovery of earlier cost rises. The rise in employment, while encouraging, came alongside numerous reports of the unavailability of staff and appears likely to reflect businesses hiring staff to cover for the workforce impacts of the Omicron wave."
Australia retail sales dropped -4.4% in Dec, up 8.2% in Q4
Australia retail sales dropped -4.4% mom in December to AUD 31.93B. For Q4, sales rose 8.2%, fastest on record.
Ben James, Director of Quarterly Economy Wide Statistics, said: "Consumers enthusiastically returned to discretionary spending following the end of Delta related lockdowns in October, and the continued easing of restrictions over the quarter. Well publicised concerns over product availability and delivery timeliness led to consumers bringing forward their end of year shopping, in conjunction with a re-opening spending splurge due to pent up consumer demand."
"This post lockdown recovery aligns well with the previous nationwide Covid lockdown recovery in the September quarter 2020 where sales rose 6.3 per cent, more than recovering the losses of the June 2020 quarter fall of 3.5 per cent".
China PMI composite dropped to 50.1, triple pressures of contracting demand, supply shocks and weakening expectations
China PMI Services dropped from 53.1 to 51.4 in January, above expectation of 50.5. PMI Composite dropped from 53.0 to 50.1.
Wang Zhe, Senior Economist at Caixin Insight Group said: "To sum up, both the manufacturing and services sectors weakened in January. Activity in the manufacturing sector shrank. Domestic demand was subdued, and overseas demand largely declined. The labor market remained under pressure. The gauges for input and output prices were stable, while the high prices of some raw materials remained a concern. The level of optimism among service enterprises declined.
"In December and January, the resurgence of Covid-19 in several regions such as Xi'an and Beijing forced local governments to tighten epidemic control measures, which restricted production, transportation and sales of goods. It has become more evident that China's economy is straining under the triple pressures of contracting demand, supply shocks and weakening expectations."
USD/JPY Mid-Day Outlook
Daily Pivots: (S1) 114.84; (P) 115.13; (R1) 115.49; More...
USD/JPY is still bounded in sideway trading and intraday bias remains neutral. Consolidation from 116.34 is still extending. On the upside, break of 115.68 will resume the rebound from 113.46 to retest 116.34 high first. On the downside, break of 114.14 should extend the consolidation with another falling leg through 113.46 support.
In the bigger picture, no change in the view that rise from 102.58 is the third leg of the up trend from 101.18 (2020 low). Such rally should target a test on 118.65 (2016 high). Sustained break there will pave the way to 120.85 (2015 high) and raise the chance of long term up trend resumption. This will remain the favored case as long as 55 week EMA (now at 111.21) holds.
Economic Indicators Update
| GMT | Ccy | Events | Actual | Forecast | Previous | Revised |
|---|---|---|---|---|---|---|
| 21:30 | AUD | AiG Performance of Services Index Jan | 56.2 | 49.6 | ||
| 01:45 | CNY | Caixin Services PMI Jan | 51.4 | 50.5 | 53.1 | |
| 05:00 | JPY | Leading Economic Index Dec P | 104.3 | 103.1 | 103.2 | |
| 06:45 | CHF | Unemployment Rate Jan | 2.30% | 2.40% | 2.40% | |
| 07:00 | EUR | Germany Industrial Production M/M Dec | -0.30% | 0.80% | -0.20% | |
| 08:00 | CHF | Foreign Currency Reserves (CHF) Jan | 947B | 945B | ||
| 09:30 | EUR | Eurozone Sentix Investor Confidence Feb | 16.6 | 15.2 | 14.9 |
ECB’s Hard Choice: Economy or Inflation?
Industrial production in Germany fell by 0.3% for December and by 4.1% on the same month a year earlier. A deeper fall compared to the previous month, while surveyed analysts on average expected production to rise by 0.4% over the same period.
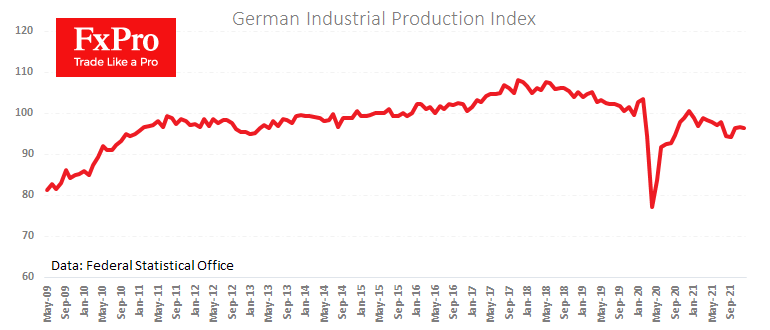
The new data underscores the difficult choices the ECB will have to make in the coming months as record price growth rates go hand in hand with falling economic activity.
The ECB will have to make choices as record inflation in decades requires tightening monetary policy and supporting the euro. On the other hand, industrial activity has been in a downtrend for almost four years.
A rise in interest rates is likely to increase pressure on manufacturing activity and increase borrowing costs, negatively affecting consumer credit.
The market reaction since last week suggests that the ECB will switch to fighting inflation, but the fading momentum in the economy calls this scenario into question.
GBP/USD Outlook: Sterling Remains in Red for the Second Day Following Upbeat US NFP
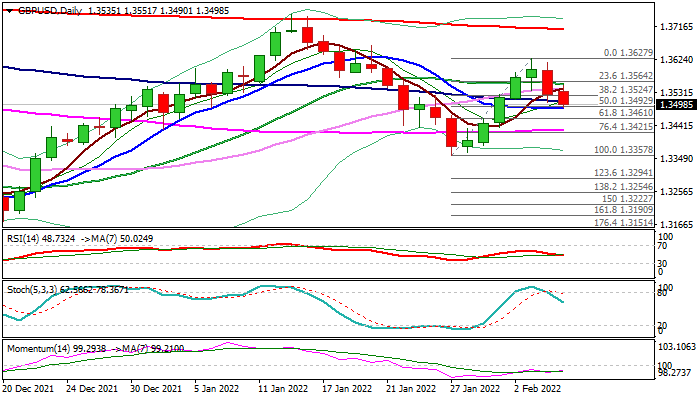
Cable remains under pressure on Monday and probes again through 100DMA (1.3508) which contained Friday’s drop (the pair was down 0.5% for the day) as pound came under increased pressure from better than expected US jobs data which inflated dollar.
Fresh weakness cracks next pivotal supports at 1.3497/92 (daily cloud top / 50% retracement of 1.3357/1.3627 rally) with daily close below here to further weaken near-term structure and confirm lower top at 1.3627 (Feb 3 high) and expose supports at 1.3461/21 (Fibo 61.8% and 76.4% of 1.3357/1.3627 respectively).
Daily RSI is heading south and 14-d momentum remains in the negative territory, adding to bearish signals.
Session high at 1.3552 (reinforced by 20DMA) marks solid resistance which should keep the upside protected and keep near-term bears in play.
Res: 1.3524; 1.3552; 1.3564; 1.3600.
Sup: 1.3490; 1.3461; 1.3421; 1.3400.
Stocks Struggle for Direction as Bond Yields Surge
Last week saw risk assets climb, with the S&P 500 gaining 1.6% as investors rushed to buy the latest dip in equities. The better-than-expected U.S. January jobs report and overall positive earnings encouraged risk-taking. Still, as we saw with Meta Platforms, any miss has been heavily punished, with the Facebook owner losing more than $250 billion in value in one day, which is so far the biggest wipeout in history.
On a macro level, the most exciting development was the shrinking amount of negative-yielding debt across the world. The amount of bonds trading at a negative yield has collapsed from more than $18 trillion at the height of the pandemic to $6 trillion last week. This was helped by ECB’s Christine Lagarde, who refused to rule out tightening policy this year and finally admitted that inflation risks were tilted to the upside. The ECB is now seen following in the Fed’s and BoE’s footsteps towards the withdrawal of monetary stimulus, which sent the euro to an 11-week high against the dollar before giving up some gains.
Equity investors cannot ignore the move in bond yields as most stock prices are derived from them. However, predicting where bond yields will end in one- or two-years’ time is tricky as many factors can change. Markets are convinced that the Federal Reserve will raise interest rates five times this year, but they see the tightening cycle ending with rates below 2%. This implies that either a risk of recession will force the Fed to change course or inflation will get under control over the next several months.
The U.S. consumer price index due on Thursday is expected to have risen 0.5% in January, with the year-on-year change hitting a new four-decade high of 7.3%. Core CPI, which excludes the volatile components of inflation like energy and food, is also forecast to rise 0.5% compared to 0.6% in December. These reports will be scrutinised to see which parts of the economy remain hot and whether there are any signs of prices cooling down. Hence, expect volatility to remain elevated over the upcoming few days.
This week is also another busy one on the earnings front, with 76 S&P 500 companies set to release Q4 results. Any disappointment from a company whose valuation is high will lead to a severe reaction. Pfizer, Walt Disney, Uber, Nvidia, and Twitter are some of the familiar names that investors need to keep an eye on.
EUR/USD Took a Break
The major currency pair skyrocketed last week. However, the pair has already slowed down a little bit and right now is balancing at 1.1432.
Last Friday, financial markets got additional signals in favour of a rate hike by the US Federal Reserve System in the nearest future.
The Unemployment Rate in the US showed 4% in January after being 3.9% the month before. This might be an adjustment for seasonal fluctuation because the decline was not critical. The Non-Farm Payrolls report showed 467K after being 510K in December and against the expected reading of 110K.
The Average Hourly Earnings added 0.7% m/m, which turned out to be better than expected.
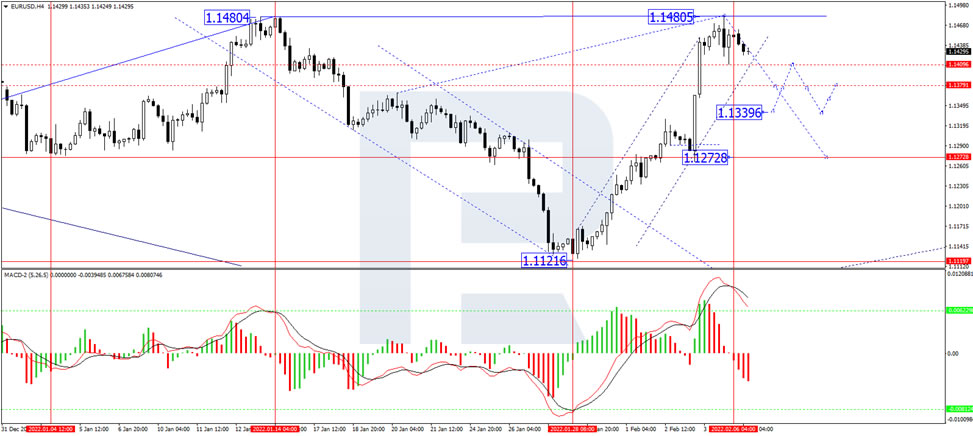
In the H4 chart, having finished another ascending wave at 1.1480 along with the descending impulse towards 1.1410, EUR/USD has completed the correction to reach 1.1460; right now, it is falling to break 1.1410 and reach the short-term target at 1.1355. After that, the instrument may correct to test 1.1410 from below and then trade downwards with the first target at 1.1342. From the technical point of view, this scenario is confirmed by MACD Oscillator: its signal line is moving towards 0. After this level is broken, the correction in the price chart may continue.
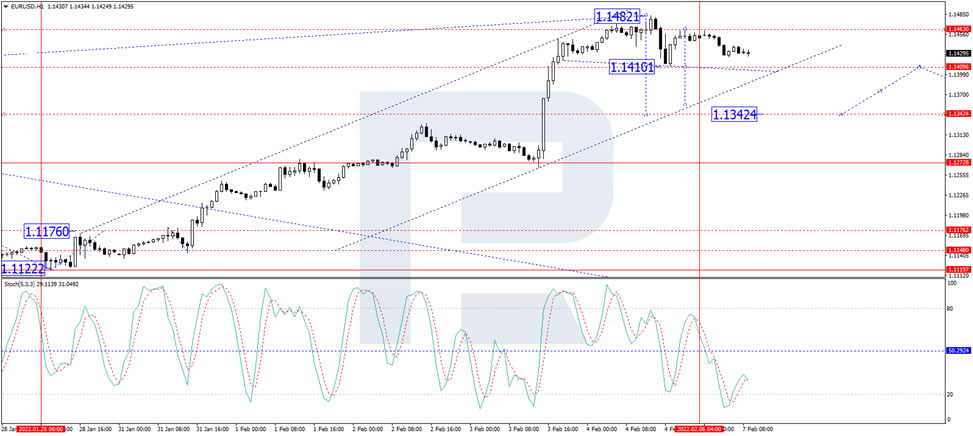
As we can see in the H1 chart, after rebounding from 1.1463, EUR/USD is forming the second descending structure to break 1.1410 and may later continue trading downwards with the target at 1.1355. From the technical point of view, this idea is confirmed by the Stochastic Oscillator: its signal line is moving above 20 and may continue growling to reach 50. Later, the line may rebound from 50 and resume falling to reach 20.
EURNZD Breaks 2021 High Within Ascending Channel
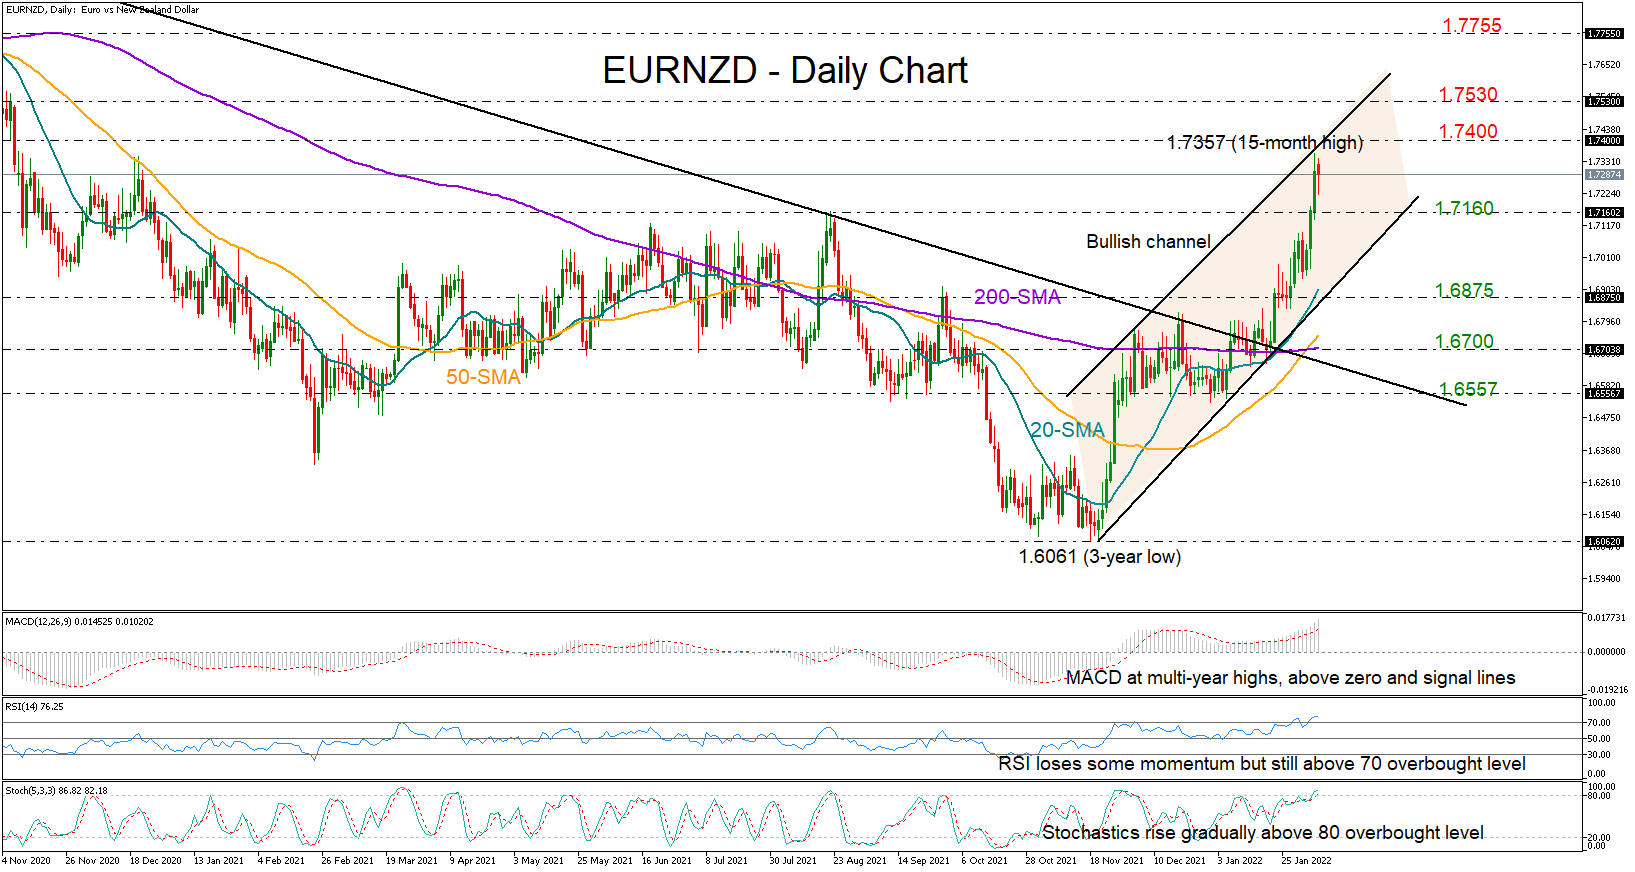
EURNZD halted its impressive rally at a 15-month high of 1.7357 on Friday and near the top line of the upward-sloping channel, which has been navigating the market since the slide to a three year low of 1.6061 in late November.
A downside correction or some consolidation would be normal at the current stage of the bullish wave, though how brutal any pullback could be is still in question since the RSI and the Stochastics, although in overbought territory, have yet to show any convincing weakness, while the MACD is still preserving its positive momentum well above its zero and signal lines.
Nevertheless, unless the pair resumes its neutral trajectory below the 2021 resistance of 1.7160, any declines could barely attract attention. A drop beneath the 20-day simple moving average (SMA) and the channel both seen around 1.6875 could be a stronger bearish signal, especially if a plunge below the 200-day SMA and towards the 1.6557 follows that action. Note that the broken resistance trendline stretched from August 2020 is also passing through this region.
On the other hand, if the rally gears above the channel’s upper boundary and the 1.7400 level, the next obstacle could pop up near the 1.7530 restrictive area, last seen in the second half of 2020. Beyond the latter, buying pressures could intensify towards the 1.7755 hurdle.
In summary, EURNZD could give up some ground in the near term after touching the surface of the bullish channel. However, such an action may not raise any concerns unless the price falls back below 1.7160.