Sample Category Title
EURNZD Breaks 2021 High Within Ascending Channel
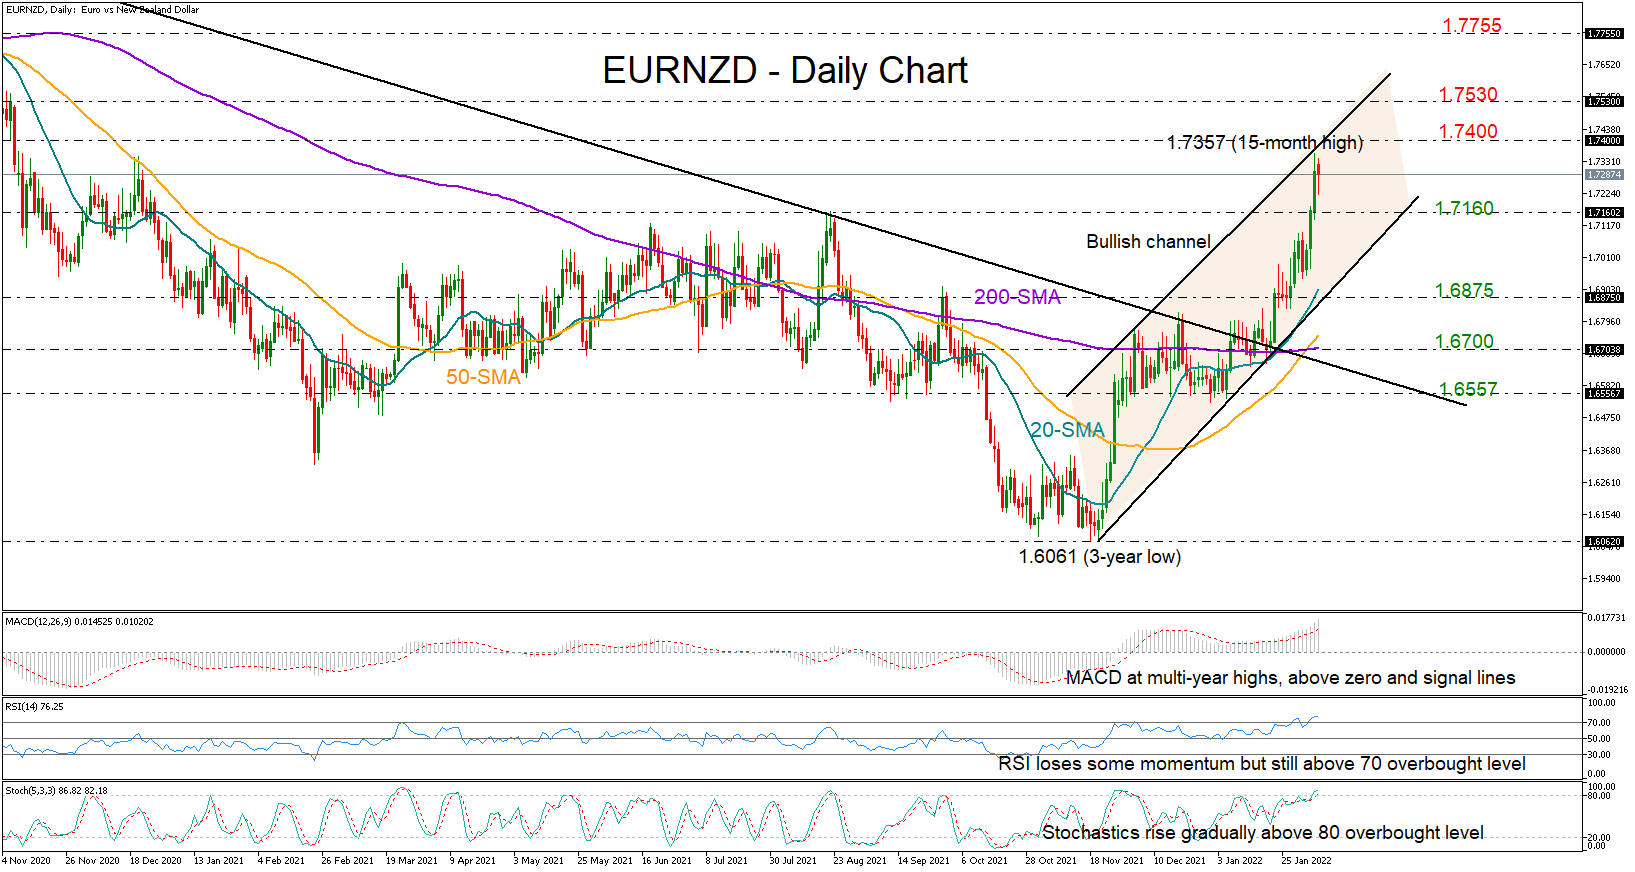
EURNZD halted its impressive rally at a 15-month high of 1.7357 on Friday and near the top line of the upward-sloping channel, which has been navigating the market since the slide to a three year low of 1.6061 in late November.
A downside correction or some consolidation would be normal at the current stage of the bullish wave, though how brutal any pullback could be is still in question since the RSI and the Stochastics, although in overbought territory, have yet to show any convincing weakness, while the MACD is still preserving its positive momentum well above its zero and signal lines.
Nevertheless, unless the pair resumes its neutral trajectory below the 2021 resistance of 1.7160, any declines could barely attract attention. A drop beneath the 20-day simple moving average (SMA) and the channel both seen around 1.6875 could be a stronger bearish signal, especially if a plunge below the 200-day SMA and towards the 1.6557 follows that action. Note that the broken resistance trendline stretched from August 2020 is also passing through this region.
On the other hand, if the rally gears above the channel’s upper boundary and the 1.7400 level, the next obstacle could pop up near the 1.7530 restrictive area, last seen in the second half of 2020. Beyond the latter, buying pressures could intensify towards the 1.7755 hurdle.
In summary, EURNZD could give up some ground in the near term after touching the surface of the bullish channel. However, such an action may not raise any concerns unless the price falls back below 1.7160.
AUDUSD Shows Some Improvement, Reaching 0.7100
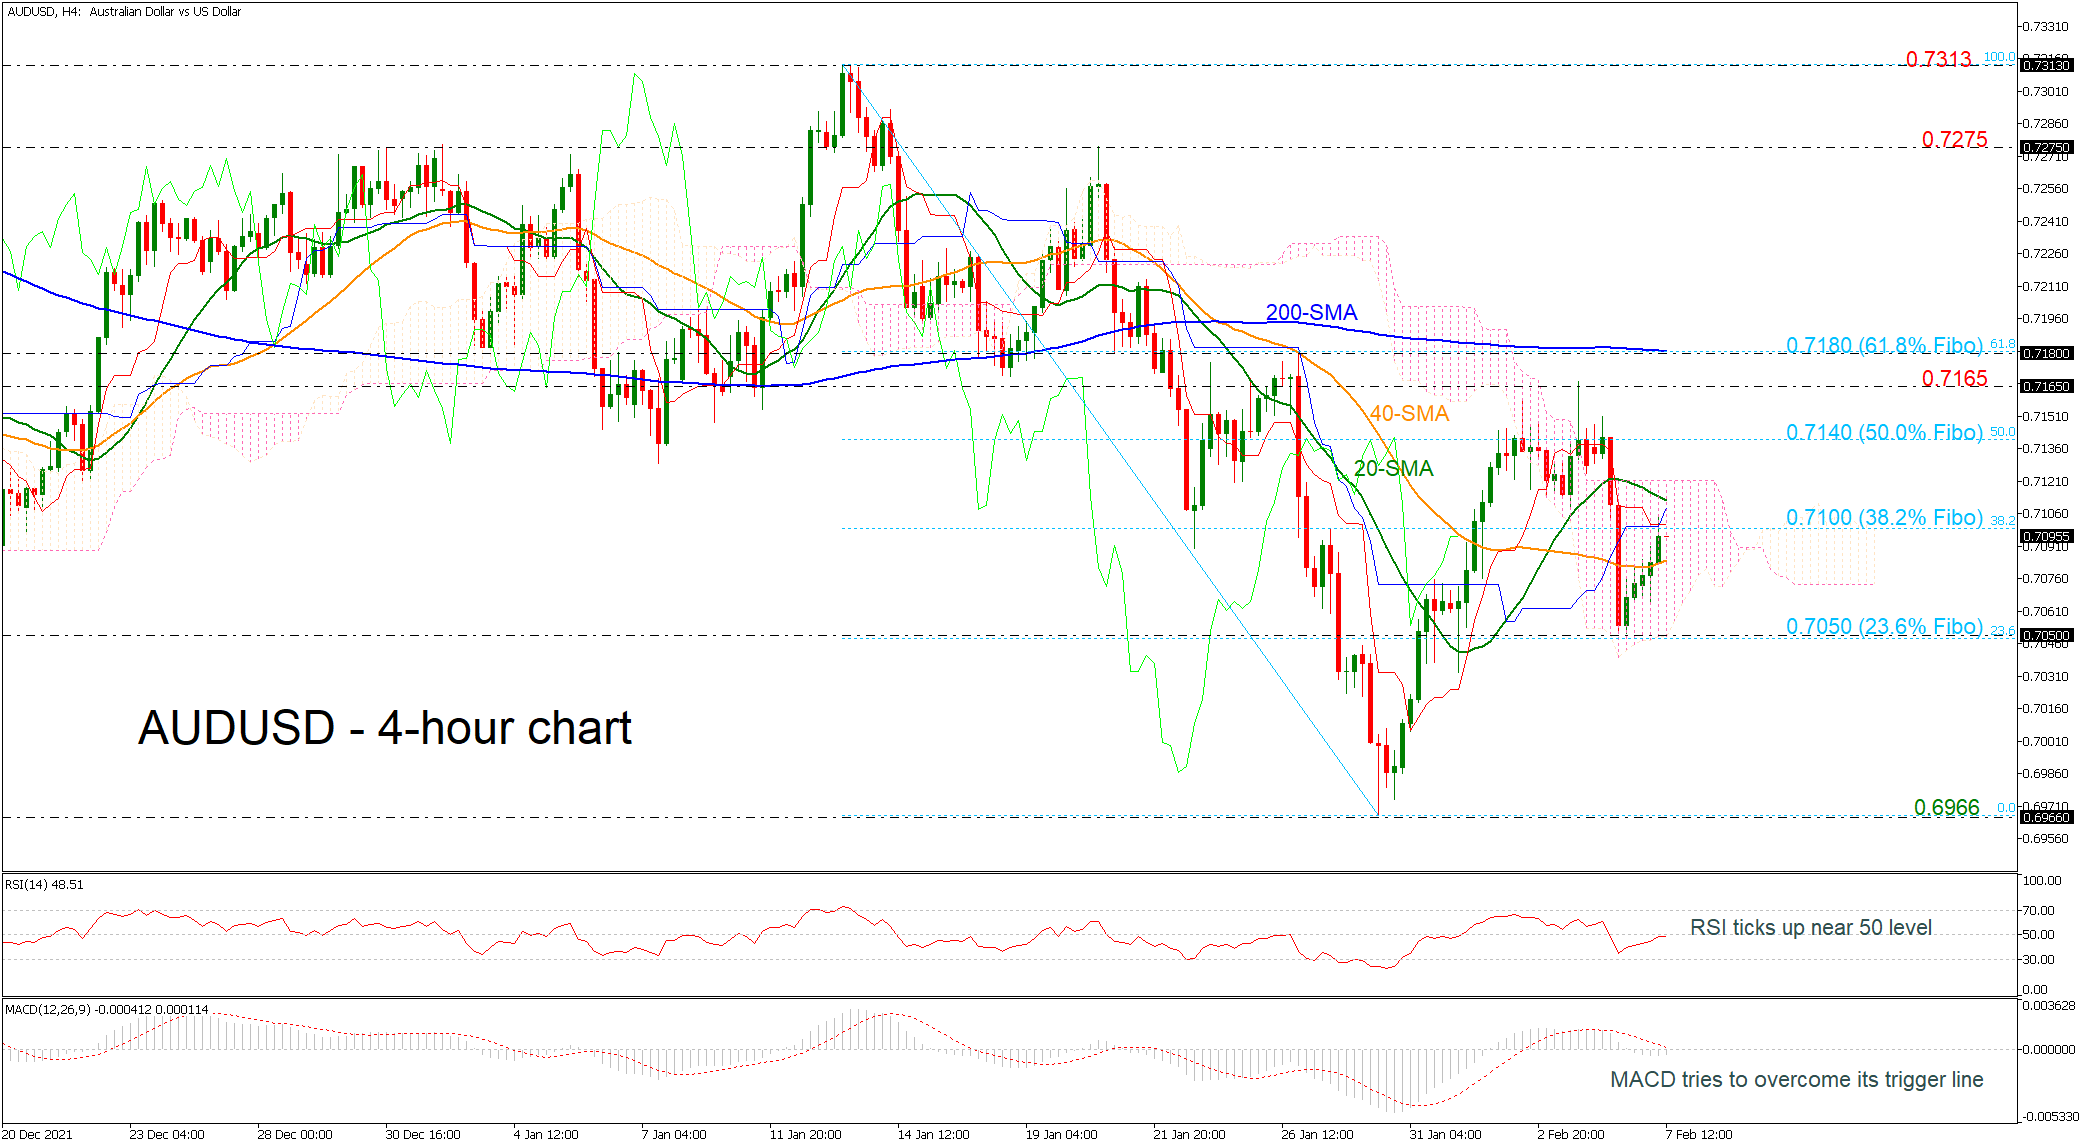
AUDUSD looks to be forming a roof around the 0.7100 psychological level, which is also the 38.2% Fibonacci retracement level of the down leg from 0.7313 to 0.6966. The RSI and the MACD seem to have reached a bottom in bearish territory and are now changing direction to the upside.
Traders, however, would be more eager to engage in buying activities if the price manages to surpass the nearby resistance at 0.7100. If this is successfully breached, then the rally may next rest somewhere between the 50.0% Fibonacci of 0.7140 and the 0.7165 high. A close above these obstacles may be needed to push the price towards the 200-day simple moving average (SMA), which coincides with the 61.8% Fibonacci of 0.7180.
On the flip side, the selling pressure could accelerate again if the market deteriorates below the 23.6% Fibonacci of 0.7050. Such a move could next bring 0.6966 key barrier under the spotlight, which if violated could trigger sharper losses.
In the medium-term timeframe, the pair is in a bearish trend since January 13 and only a rally above the 200-day SMA would put the market in a sideways path.
EUR/USD Eyes More Upside: Elliott Wave Analysis
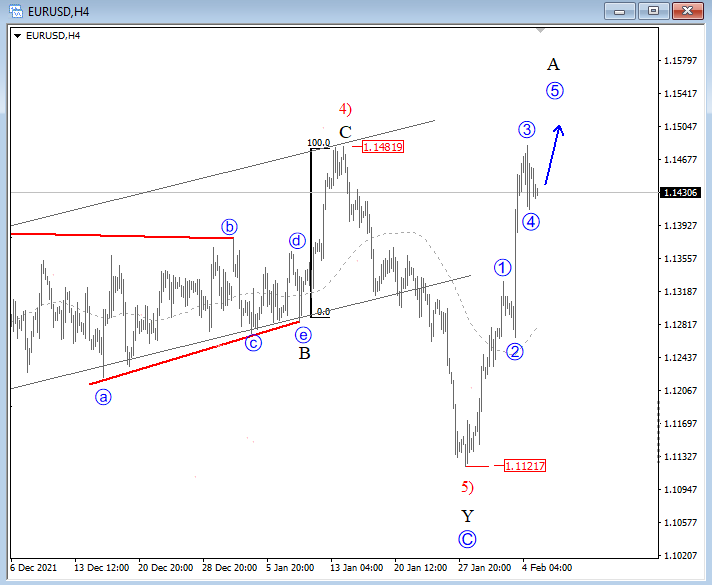
USD came slightly higher at the end of the week after better than expected US jobs figures (467k), but this may not stop euro from rising which has been the most attractive after some hawkish remarks on the ECB press conference. We see the euro in a strong rise, a move that may not be over yet as we see impulsive activity on intraday charts.
On 4h chart EURUSD is making a sharp rise which is looking impulsive from 1.1121, so we assume that pair is bottoming and that more upside can be seen after a pullback. Keep in mind that on a daily chart we also see price breaking an important trendline which can be an indication for higher prices into wave E).
EUR/USD 4h Elliott Wave analysis
Aussie Rebounds on Strong Retail Sales
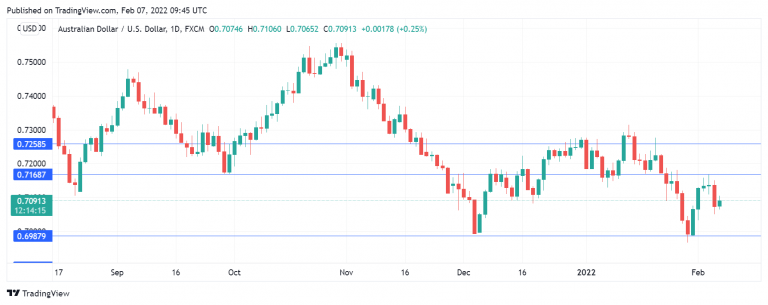
The Australian dollar has started the week with gains. In the European session, AUD/USD is trading at 0.7091, up 0.26% on the day.
It was shaping up to be a banner week for the Aussie, which recorded gains every day of last week until a bump at the end of the week. AUD/USD plunged 0.90% on Friday, as the US nonfarm payrolls shocked the markets with a massive gain. Still, the Australian dollar posted a strong gain of 1.16% last week.
Australian retail sales surge
The Aussie has bounced back on Monday, boosted by an excellent retail sales report for Q4. Retail sales surged 8.2%, above the consensus of 7.8% and ahead of the Q3 read of -4.4%. The end of the Covid-related lockdowns and the holiday season brought out consumers who were in a spending mood. The upswing in consumer spending has raised expectations that the RBA will hit the rate trigger in the second half of the year, perhaps as early as August.
At last week’s RBA meeting, Governor Lowe said that a hike could be a year away or even longer, but the markets aren’t buying it. Lowe is clearly in no rush to raise rates and may not have abandoned the view that inflation is transient and will ease in the near term. The markets, in contrast, are more hawkish and feel that high inflation will prompt the RBA to raise rates in the second half of 2022.
The US nonfarm payrolls was an absolute shocker, with a gain of 467 thousand jobs in January. Many analysts had projected a negative print, and the consensus of 125 thousand showed that expectations were quite low. With inflation at 40-year highs, wage pressures are rising. Average hourly earnings climbed 5.7% in January y/y, as workers seek higher wages due to the rise in the cost of living. The NFP report will raise expectations that the Fed will have to do more in order to stamp out high inflation.
AUD/USD Technical
- AUD/USD faces resistance at 0.7168 and 0.7258
- There is support at 0.6987 and 0.6896
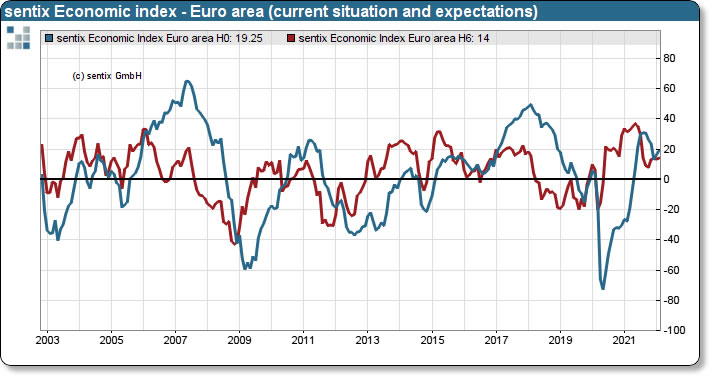
Eurozone Sentix investor confidence rose to 15.2, lack of sustainable new growth drivers
Eurozone Sentix Investor Confidence rose from 14.9 to 15.2 in February, above expectation of 15.2. Current situation index rose from 16.3 to 19.3. Expectations index rose from 13.5 to 14.0, highest since July.
Sentix said: "The economic situation in Euroland is stable in February 2022. The situation and expectations of the more than 1,200 investors surveyed by sentix signal a slight improvement. Thus, our assumption that we are in a "mid-cycle slowdown", i.e. a growth moderation in the middle of an economic cycle, which we have been expressing here for months, remains unchanged. However, this phase of moderation is not yet complete. There is a lack of sustainable new growth drivers. Above all, there is a lack of impetus from the international economy."
Bitcoin is Gaining Momentum
Bitcoin is up 9% over the past week, ending at around $41,700. Ethereum is up 15%. Altcoins also woke up from hibernation and grew stronger than the market: from 5.8% (Binance Coin) to 17.3% (Solana).
Over the same period, the total capitalization of the crypto market, according to CoinGecko, grew by 11.2%, up to $1.99 trillion.
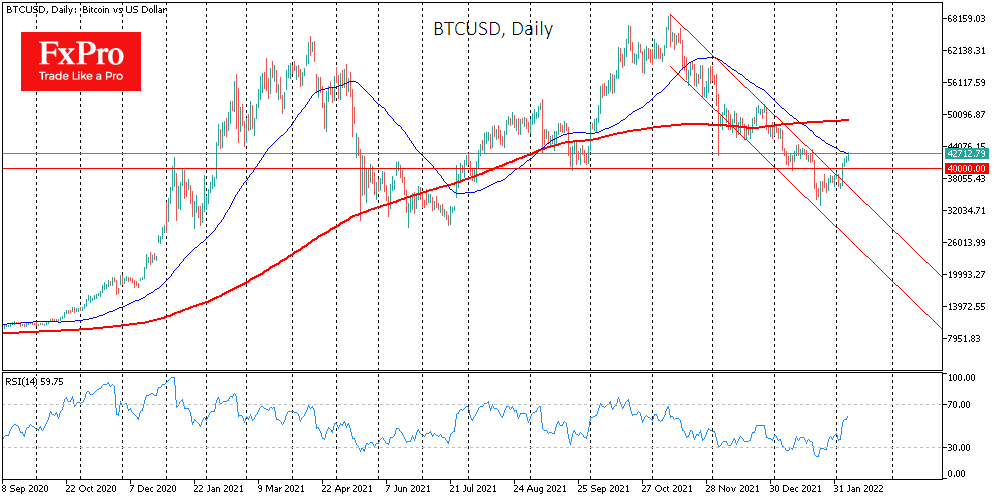
The primary growth of the crypto market last week came on Friday when bitcoin at the end of the day soared by 10% in a few hours. The increase was not prevented even by strong data on the US labour market, which came out a couple of hours before the jump.
It is worth noting that the Nonfarm Payrolls can force the Fed to move faster to tighten monetary policy. Against this background, the yield of 10-year Treasuries jumped above 1.93%, hitting new two-year highs, and this could soon lead to sales in the stock market. If cryptocurrencies manage to resist and continue to grow, this will be a serious trend reversal order. Just like on Friday, when investors decided to buy BTC in order to protect investments from inflation.
Since then, Bitcoin has already added 17%, moving into a phase of an active uptrend. Technically, the first cryptocurrency broke the resistance of the descending corridor. Accelerating growth and steady buying throughout the weekend indicate a strong bullish momentum. Cautious investors are now looking at the test of the 50-day moving average. Previously, repeatedly fixing above this line preceded a multi-month uptrend.
Potentially, this will also be lost now. Therefore, some players consider this impulse as an important first signal of a recovery in demand for risky assets, despite fears of a rate increase.
Meanwhile, billionaire Ray Dalio has warned that a number of governments could outlaw cryptocurrencies. The government of the Russian Federation is considering introducing a tax on miners of at least 15%. In the meantime, the Fed has presented the Digital Dollar White Paper, but the issue of its future launch has not yet been resolved.
EURUSD Takes a Rest after Remarkable Weekly Bounce
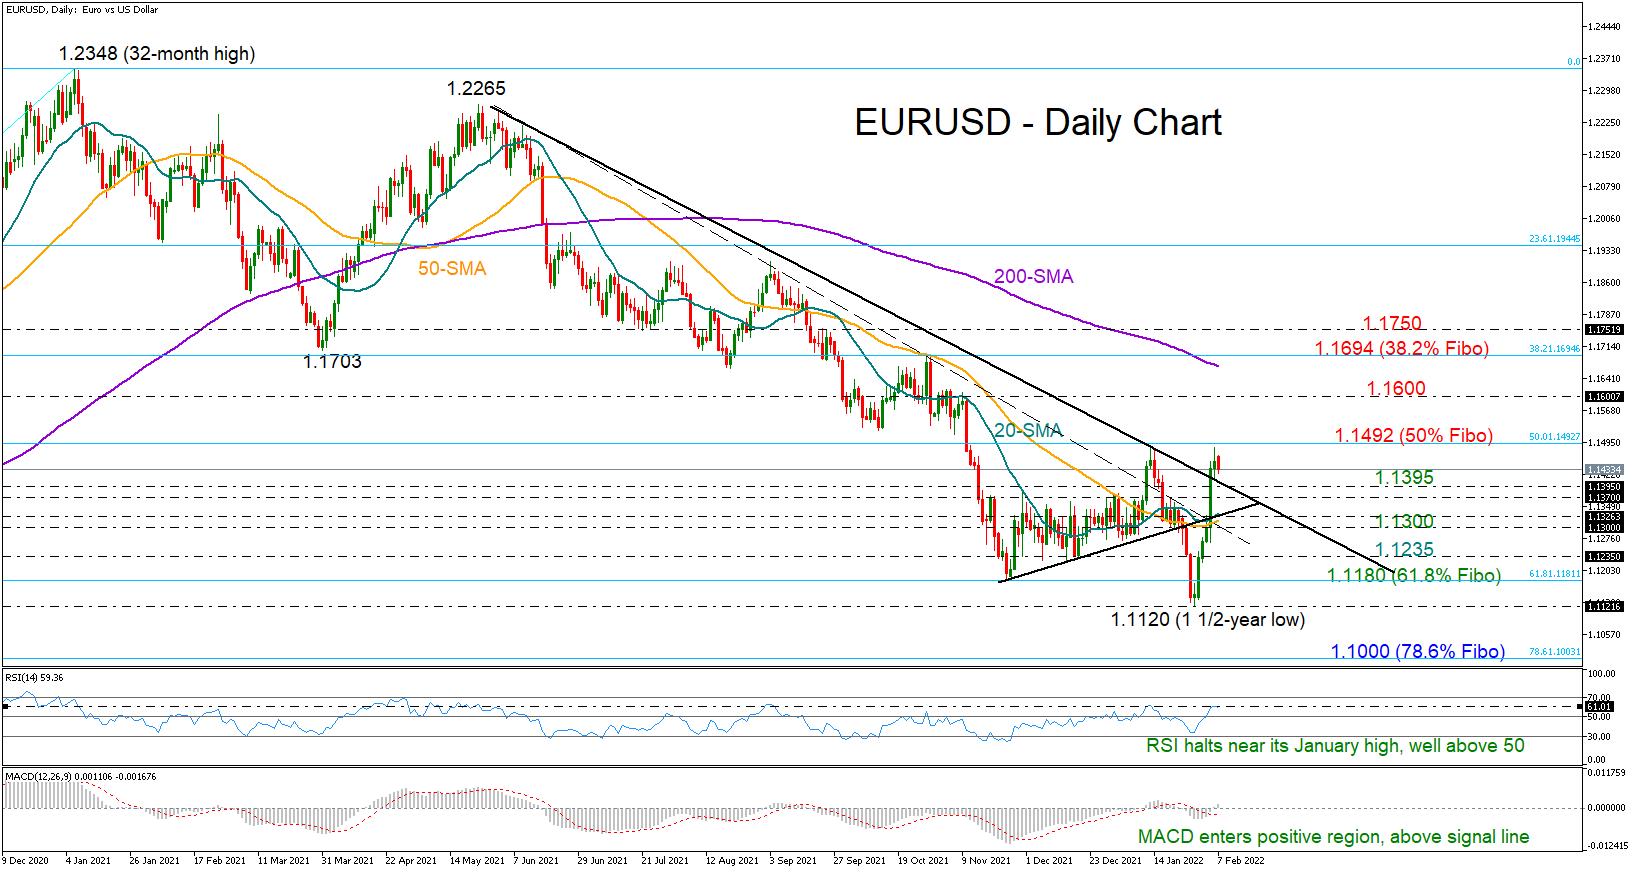
EURUSD started the month on the right foot last week, charting its fastest weekly rebound since March 2020 to advance from a 1½-year low of 1.1120 straight back into the 1.1400 zone.
Encouragingly, the bulls' fortunes have improved following the peak above the key resistance trendline drawn from May’s high of 1.2265, but downside risks have not fully evaporated since last week’s thrilling rally was not enough to drive the price above its previous high of 1.1492. Notably, that level is coinciding with the 50% Fibonacci retracement of the 2020 uptrend, which topped at a 32-month high of 1.2348.
Will the bulls continue to march higher in the coming sessions? Well, the technical picture is still favouring the case. Even though the RSI is currently struggling to surpass its January high, the indicator is comfortably above its 50 neutral mark, suggesting buying pressures may keep balancing any sharp declines. Likewise, the MACD remains positively charged above its zero and signal lines, while in trend indicators, the positive intersection between the 20- and 50-day simple moving averages (SMAs) is still valid.
A decisive close above the 1.1492 bar could push the price up to the 1.1600 hurdle. Claiming that area, the next crucial obstacle may emerge around the 200-day SMA and the 38.2% Fibonacci of 1.1694, while not far above, the 1.1750 level could be another barricade.
On the downside, the bears will need to squeeze the price back below the 1.1395 – 1.1300 territory of trendlines in order to regain command. Then, a forceful extension below the former support region of 1.1235 – 1.1180, which encapsulates the 61.8% Fibonacci, may threaten the resumption of the long-term downtrend below the 1.1120 bottom, bringing the 1.1000 number back into focus.
In brief, EURUSD is taking a breather following its recent impressive rebound. Although the bias remains titled to the upside, the bulls have another mission to accomplish before they declare victory. Particularly, they need to successfully close the gap with the 1.1492 barrier to dominate the market in the short term.
Gold Price Overcomes 200-Day SMA, Holding above 1,800
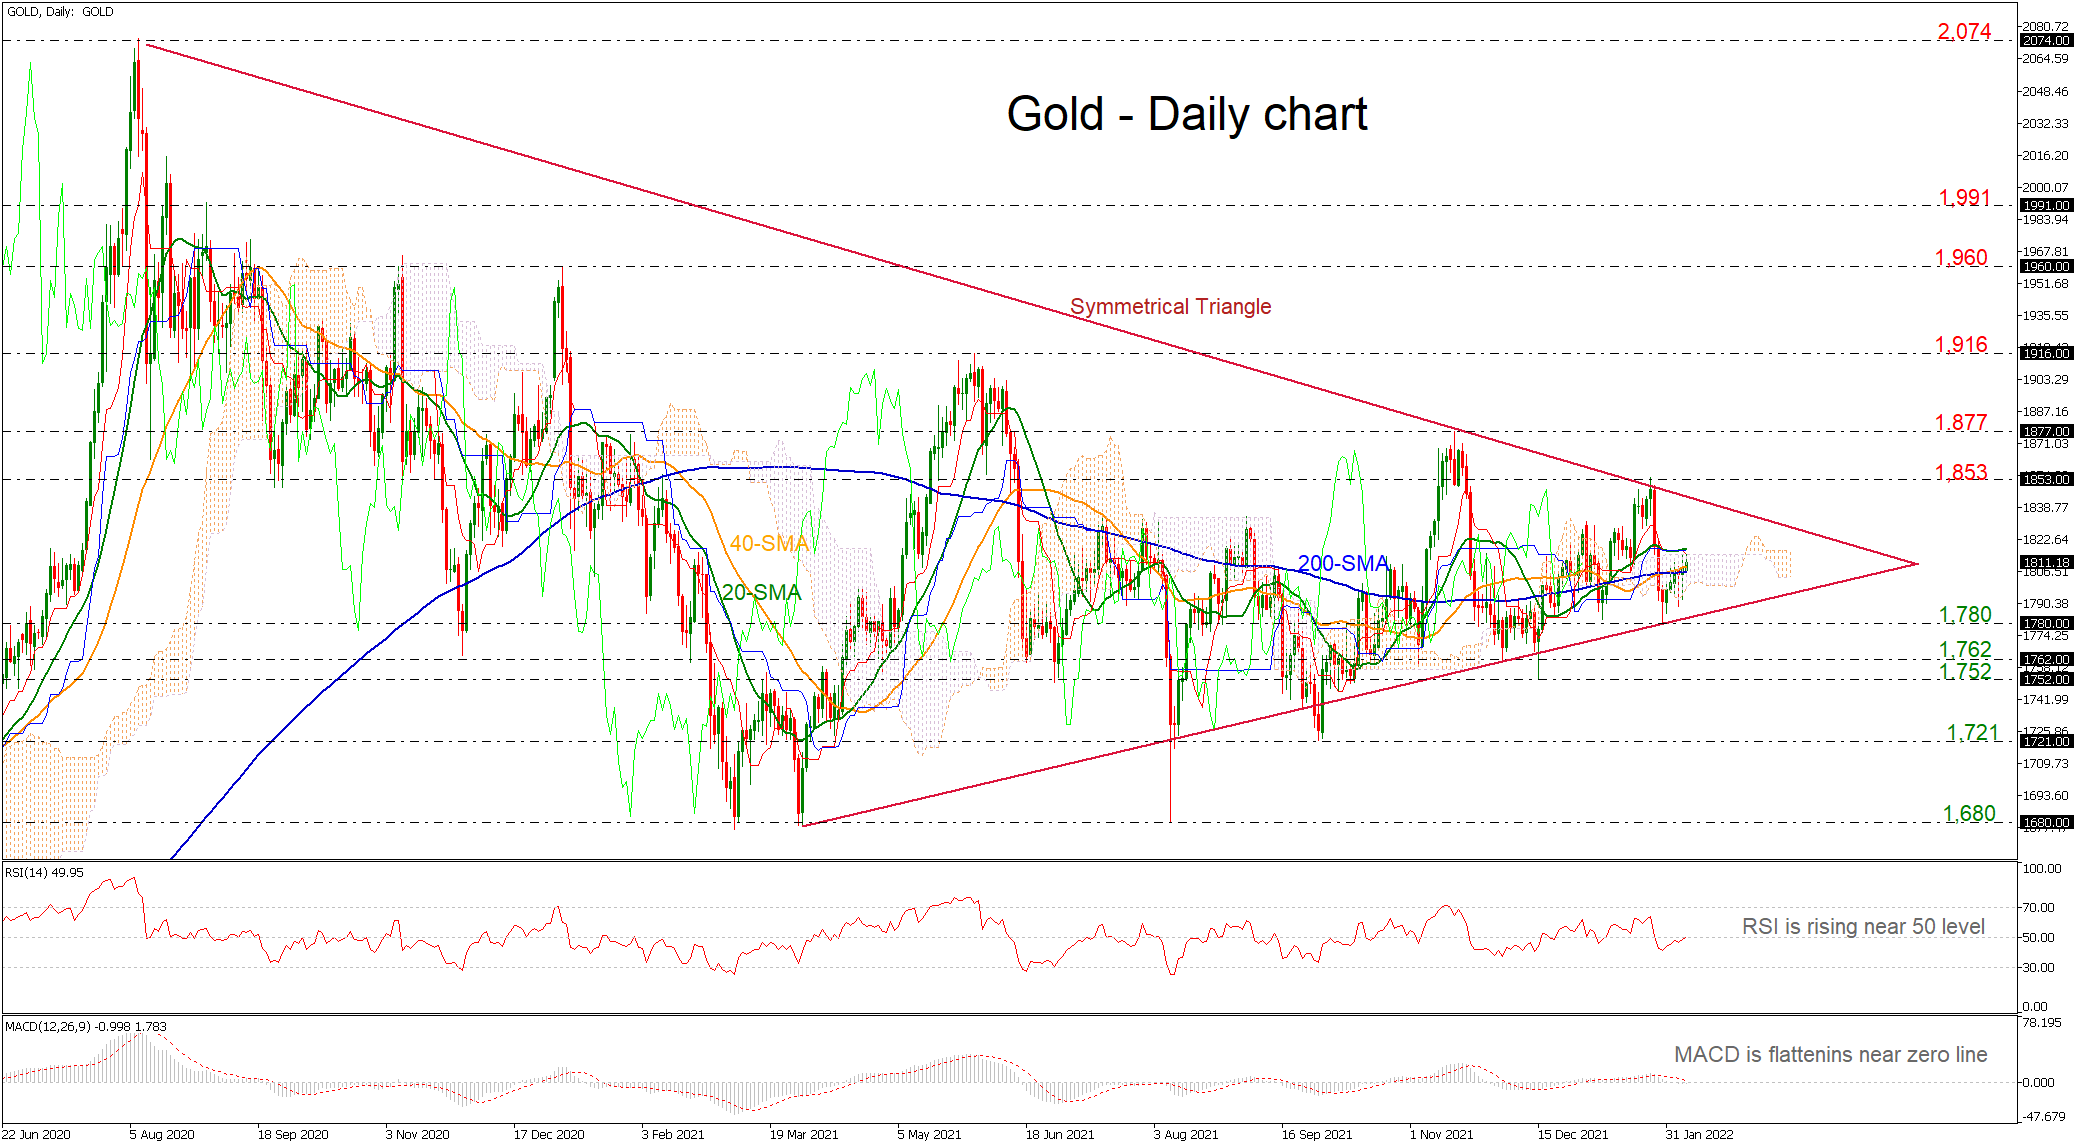
Gold prices have found a turning point at the 1,780 support level, which overlaps with the ascending trend line of the long-term symmetrical triangle. The price is currently testing the 40- and 200-day simple moving averages (SMAs), holding within the Ichimoku cloud in the short-term.
Technically, the RSI indicator is showing some positive signals as it is approaching the neutral threshold of 50 with stronger momentum than before. The MACD oscillator is edging sideways near its trigger and zero lines, failing to endorse any positive scenarios.
Should the price close comfortably above the 20-day SMA, which has been unbreakable over the past week, traders could add more momentum to the upside move, pushing the market up to 1,853. A move higher could reach the downtrend line at 1,836 ahead of the 1,853 resistance level. Penetrating these obstacles too, the market could switch the current outlook to positive, touching the recent 1,877 high and 1,960, registered in January 2021.
In the negative scenario the market could retest the bottom of 1,780. If this proves easy to overcome this time, the decline may next pause somewhere between 1,762-1,752, while even lower, investors could shift attention to the 1,721 number.
In brief, the yellow metal is in neutral mode in the short-term timeframe and any declines below the symmetrical triangle could endorse the bearish outlook. Otherwise, a climb above the downtrend line could add some fuel for positive move.
GER 40 Lacks Support
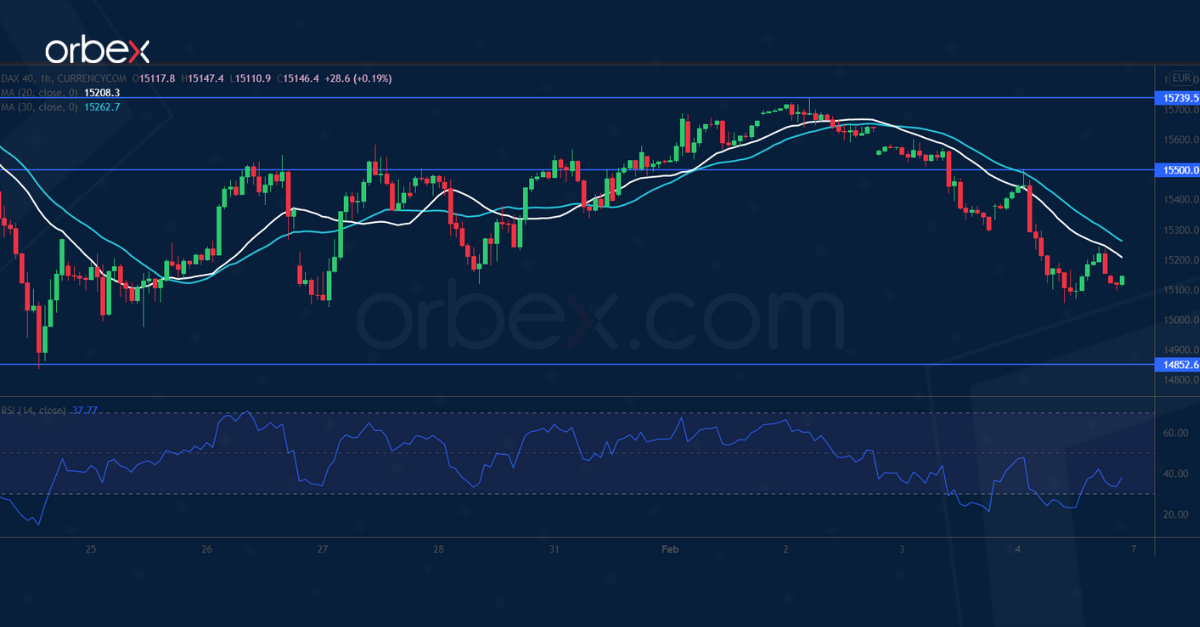
The Dax 40 drifts lower after the ECB’s hawkish turn. The recent rebound met stiff selling pressure at 15740. Then a fall below 15350 indicates a lack of commitment from the buy-side.
A bearish MA cross suggests an acceleration to the downside and may attract more bears. The demand area around 14850 is a critical floor on the daily chart. Its breach could trigger a bearish reversal in the medium term.
An oversold RSI may cause a limited bounce. The bulls need to reclaim 15500 in order to turn sentiment around.
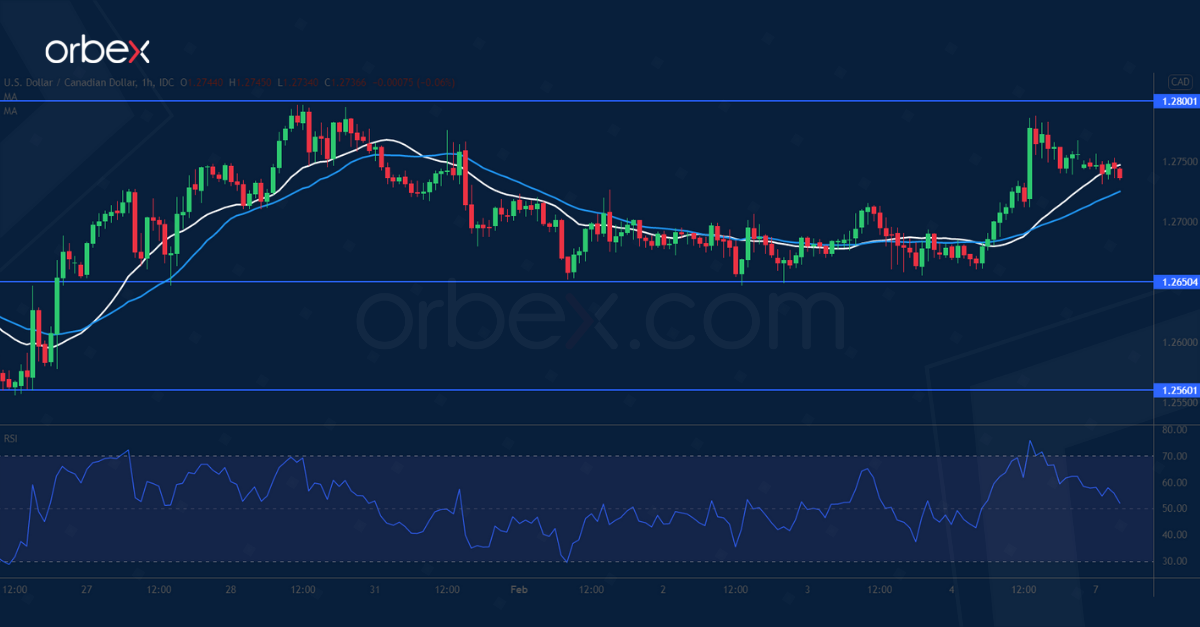
USD/CAD Awaits Breakout
The loonie weakened after a rise in Canada’s unemployment rate in January. The greenback has previously come to a halt at the daily resistance (1.2800).
The retracement then found bids at the resistance-turned-support at 1.2650, suggesting traders’ strong interest in keeping the two-week-long rally intact. The RSI has inched into the overbought territory and may drive the price lower with short-term profit-taking.
A bullish breakout may extend the uptrend to December’s peak at 1.2950.