Sample Category Title
GBP/USD Pair Broke above a Key Bearish Trend Line with Resistance Near 1.3500
The British Pound started a fresh decline from the 1.3600 resistance zone against the US Dollar. The GBP/USD pair traded below the 1.3500 level to move into a short-term bearish zone.
It traded as low as 1.3426 and settled well below the 50 hourly simple moving average. It is now correcting losses and trading above 1.3480. There was a break above a key bearish trend line with resistance near 1.3500 on the hourly chart.
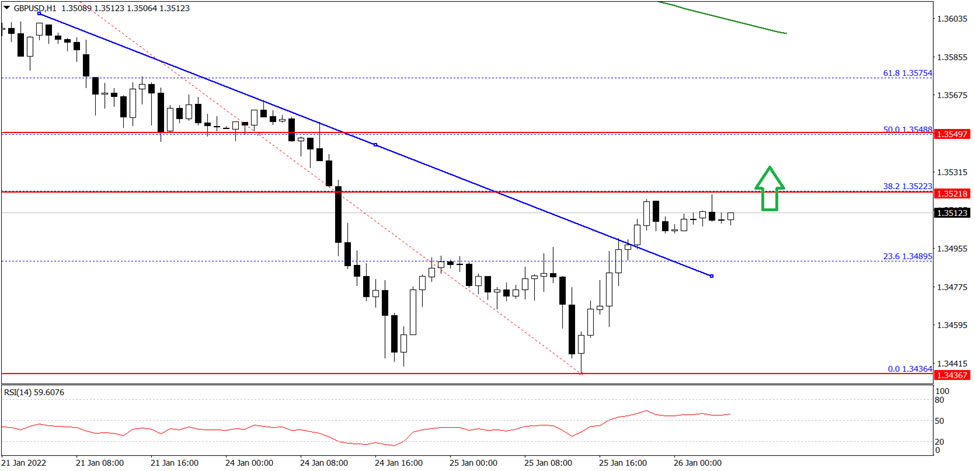
On the upside, the pair is now facing resistance near the 1.3520 zone. The next key resistance is near the 1.3550 level. Any more gains might push the pair towards the 1.3600 level.
An initial support on the downside is near the 1.3495 level. The main support is forming near 1.3480 on FXOpen. A break below the 1.3480 support level could even push the pair below the 1.3450 support.
USDCAD in a Tight Range ahead of BoC and Fed Decisions
American shares continued their volatility on Tuesday as investors waited for the upcoming interest rate decision by the Federal Reserve that will come out later today. Economists expect that the Fed will deliver a relatively hawkish decision. In it, the bank will slash its quantitative easing (QE) policy for the third month in a row and then point to a rate hike in March. Stocks were also volatile as investors reflected on the strong American consumer confidence data. According to the Conference Board, consumer confidence dropped from 115.2 to 113.8 in January. This decline was a bit better than the median estimate of 111.8. Additional data showed that the country’s home price growth slowed in November.
The Canadian dollar moved sideways in the American and Asian sessions as investors waited for the upcoming interest rate decision by the Bank of Canada. The bank is expected to leave its interest rate unchanged at 0.25%. However, like the Fed, analysts expect that the BOC will sound hawkish considering that the country’s economy is doing well. The unemployment rate has declined while inflation is rising as the ongoing supply chain challenges remain. Data published earlier this month showed that the unemployment rate declined to a pandemic-era low of 5.9% in December.
The earning season will continue today. On Monday, IBM published relatively strong quarterly results as demand for cloud computing improved. Microsoft had a similar sentiment on Tuesday after the company published strong results. However, the General Electric stock price tumbled by over 7% after the company published weak results. Similarly, Johnson & Johnson published weak revenue and higher profitability. Later today, some of the firms that will publish their quarterly results are Anthem, ADP, Freeport-McMoran, and General Dynamics, among others.
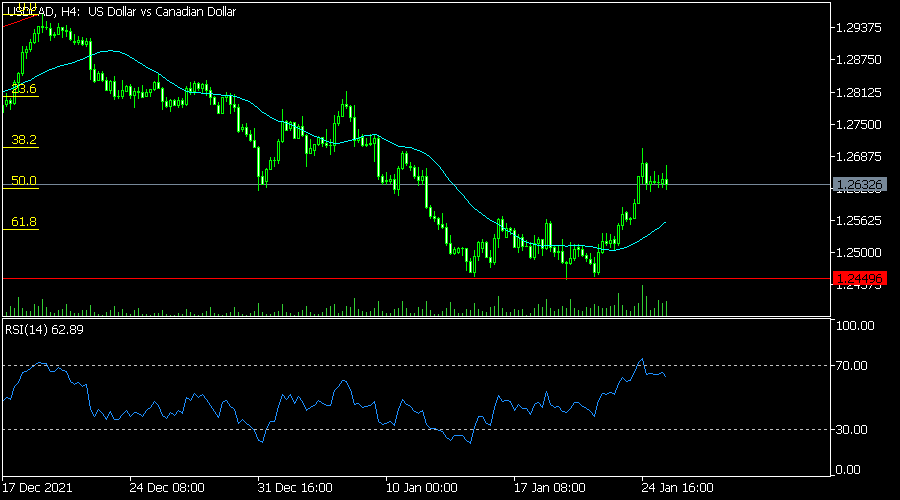
USDCAD
The USDCAD pair moved sideways ahead of the upcoming Fed and Bank of Canada decision. The pair is trading at 1.2623, which was slightly lower than this week’s high of 1.2700. On the four-hour chart, the pair moved to the 50% Fibonacci retracement level. It is also above the 50-day moving average. A closer look shows that the pair is forming a bullish flag pattern while the Relative Strength Index (RSI) has been in a bullish trend. Therefore, the pair will likely have a bullish breakout today.
EURUSD
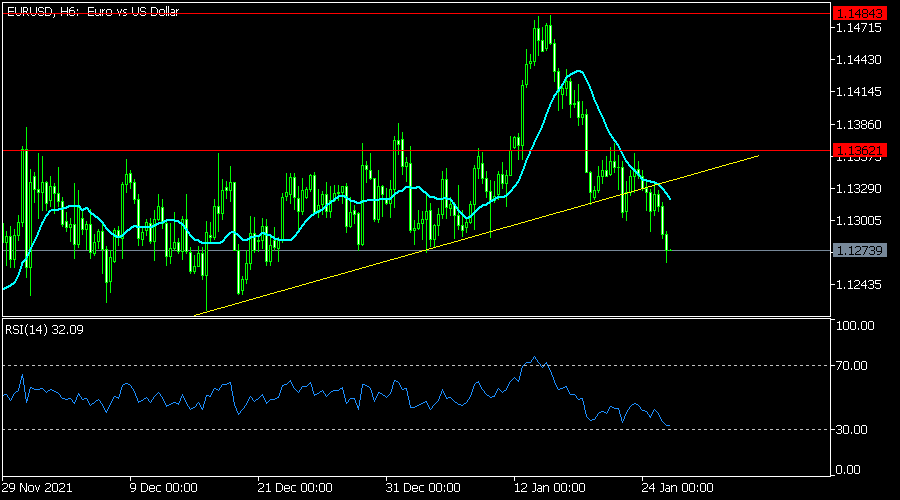
The EURUSD pair has been in a strong bearish trend in the past few days. The pair has dropped to a low of 1.1263, which was the lowest level since December last year. On the six-hour chart, the pair has moved below the neckline of the head and shoulders pattern. The moving averages have formed a bearish crossover pattern while the Relative Strength Index (RSI) has been in a bearish trend. Therefore, the pair will likely keep falling ahead of the latest Fed decision.
EURJPY
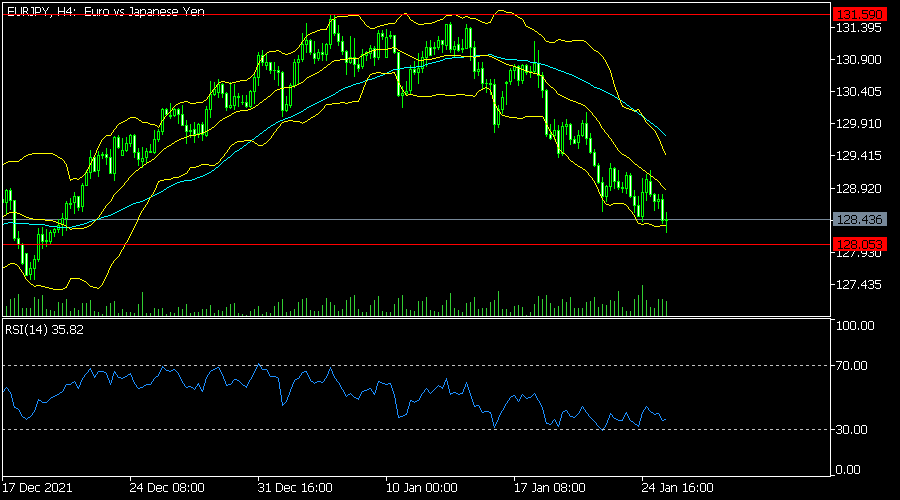
The EURJPY pair declined after the relatively strong German business confidence data. The pair is trading at 128.45, which is substantially lower than this month’s high of 131.60. On the four-hour chart, the pair is between the lower and middle lines of the Bollinger Bands while oscillators have been falling. Therefore, the pair will likely continue falling as bears target the key support level at 128.
The First FOMC Meeting of 2022 is Today’s Main Event
Markets
The sell-off on European stock markets paused following Monday’s WS intraday comeback, but “rebound” gains remained limited to 0.5%-1%. Main US indices lost 0.2% (Dow), to 2.3% (Nasdaq), but closed off worst intraday levels. German Ifo business sentiment beat consensus like earlier released PMI’s. US eco data showed accelerating house prices, a sober outlook in consumer confidence and a disappointing Richmond Fed manufacturing index. The combination adds to the high inflation/(s)low(ing) growth environment we’re heading into.
Markets ignored the data going into the Fed meeting. Daily changes on the US yield curve remained confined to +- 1 bp. The German yield curve bear steepened with yields ending 0.4 bps (2-yr) to 3.7 bps (30-yr) higher in a catch-up move with the US on Monday night. 10-yr yield spread changes vs Germany ended broadly unchanged with Greece (-3 bps) and Italy (-2 bps) outperforming.
The second ballot in attempting to elect a new Italian president yielded no success. A deal is unlikely before tomorrow, when the majority to elect a president will be lowered from 673 to 505 of 1008 eligible voters. EUR/USD in technical trade briefly fell to the 1.1260 area before closing at 1.1301. The first FOMC meeting of 2022 is today’s main event. We expect the Fed to lay the groundwork for a 25 bps March rate hike/lift-off. Abruptly ending net asset purchases (normally tapered down to zero in March) is a wildcard.
We currently take into account a scenario of four consecutive 25 bps rate hikes in the US central bank’s inflation battle, before allowing for a pause once the central bank puts in motion pillar two of its normalization process: shrinking the balance sheet at stealth pace. Rapidly deteriorating inflation dynamics probably imply that risks surrounding this scenario are tilted to the hawkish side.
This means potentially more and/or bigger rate hikes and a sooner start to winding down the balance sheet. From a market point of view, we hold our downward bias for US Treasuries via higher US real rates. (Lack of) specific guidance on the balance sheet will be decisive in determining the curve’s move: flatter (no guidance) or steeper.
We expect more turbulence on risk markets. The combination of both could benefit the dollar short term. First support in EUR/USD stands at the 2021 low of 1.1186.
News Headlines
The national Bank of Hungary (MNB) yesterday increased the base rate by 0.50% to 2.90%, as was the case for the overnight deposit rate. They raised the overnight and one-week collateralized lending rates also by 50 bps to 4.9%. By increasing the ceiling of its interest rate corridor, the MNB allows for further hikes of the one week deposit rate (currently 4%). In its statement, the MNB indicated that the morphology of inflation probably has changed. Headline inflation (7.4% in December) may have approached a peak, but could decline slower than expected. At the same time, core inflation is expected to pick up further in coming months as companies are repricing their goods and services at short notice amid strong domestic demand in order to reflect rises in commodity prices and wage costs. Risks to inflation expectations and second-round effects remain skewed to the upside. The one week depot rate was/is used to respond to higher risks in financial and commodity markets. However the rise in persistent (core) inflation warrants a catching up of the base rate toward the one week deposit rate over the coming months in >30 bps steps. The prospect of a protracted hiking cycle supported the forint despite persistent global volatility. EUR/HUF closed near 358.75 compared to a start near 361. According to a report of the US Commerce department, the shortage of semiconductor ships won’t be solved anytime soon. A survey among 150 companies indicates that there remains a significant and persistent mismatch in supply and demand for ships that isn’t expected to be solved in the next six months. Manufacturers’ median chip inventory dropped from 40 days of supply in 2019 to about 5 days last year. The report suggests that there are limited options available for the US administration to address to problem. US Commerce Secretary Raimondo urged Congress to pass the Chips Act, which would unlock $52bn in subsidies to encourage domestic chip manufacturing.
Time to Chill for the Fed Hawks?
Trading in the US equities remains hectic, unpredictable and full of surprises. The escalating tensions in the Ukrainian border, Biden threatening Putin with personal sanctions, IMF cutting the US and Chinese growth outlooks, combined to the hawkish Federal Reserve (Fed) expectations are mostly responsible with the rising volatility and confusion among investors.
Yesterday, major US indices went from tears to laughter then back to tears, again. The S&P500 was trading almost 3% down when the dip buyers piled in to send the index into the positive territory. But gains remained short-lived, and the index closed the session 1.22% lower. Nasdaq swung up and down, as well, to end the session 2.28% down, but the Dow was almost flat, having lost just 0.19% to the close.
As such, seeking a dip has become a difficult exercise, and the strong corporate results have little impact on the market’s bad faith these days.
Time to chill for the Fed hawks
It’s probably soon time to chill for the Fed hawks, as the Fed hasn’t got anything to gain in sending out hawkish messages today: slaughtered equity markets won’t help them to get the inflation situation straight. On the contrary, a deep dive in the financial markets would only refrain the Fed from doing what it’s got to do and worsen inflation.
The hawkish fears include that the Fed could announce the end of the QE taper as soon as today, that it could hint at back-to-back rate hikes instead of one rate hike every quarter, that it could surprise with a 50bp point hike in March instead of a more likely 25bp raise, or it could even choose not to wait until March and hike the rates this week.
Yet, these hawkish expectations are certainly a bit far stretched; the Fed can’t trigger a financial crisis to fix the inflation problem. There is a greater chance we meet a confident, yet comforting Fed at today’s announcement. If the Fed wants to carry on with its hawkish plans, it needs to get the risk appetite under control.
Fed to Signal a March Hike
Market movers today
Today's highlight will be the FOMC meeting. We expect Fed to keep policy rates unchanged, but reinforce signals for a March hike. As it is one of the interim meetings, no updated projections on the 'dots' will be released. We now expect four 25bp rate hikes this year and QT starting in September, with risks skewed towards more hikes and earlier QT (see also Fed Research - Preview: End of money printing brrrrr - (at least) four 25bp rate hikes this year and QT in September, 18 January).
Bank of Canada (BoC) was one of the first G10 central banks to turn in a more hawkish direction last year. While its latest guidance for the first-rate hike has been for the "middle quarters of 2022" there is a real likelihood that BoC will hike policy rates today by 25bp. Analysts are almost evenly divided on the call while markets are leaning slightly towards a hike. As recent data supports the need for policy tightening we would not be surprised to see a hike today even if our base case (based on BoC's guidance) is for unchanged policy rates.
Developments in the Russia-Ukraine dispute will remain the key focus in Europe, amid a light data calendar.
Danish retail sales figures for December could show a slight downturn in the month according to our Spending Monitor. In Sweden, we keep an eye on the extraordinary meeting of the Financial Stability Council in light of the tense security situation in Europe.
The 60 second overview
Risk-off: Markets remain in a risk-off mode with Asian markets mostly in the red on Wednesday morning. The option-based volatility measure, VIX index, rose to one-year highs yesterday, and S&P500 is almost 9% below the year-end levels.
IMF growth downgrade: Yesterday, the IMF cut its global growth forecast to 4.4% in 2022 from 4.9% in October. US growth is now projected at 4% this year, compared to 5.2% earlier, due to the stalling of the Build Back Better plan, faster-than-expected unwinding of monetary stimulus and continued supply-side shortages. China's growth outlook for this year was also cut by 0.8% to 4.8% due to negative impacts from the zero-covid policy and protracted stress in the property market. The IMF projections assume that negative health effects from the pandemic will gradually fade towards the end of this year globally but they see risks to the downside, as low vaccination rates across many developing economies continue to pose a threat of new variants emerging.
Russia-Ukraine standoff: Tensions keep building up as Russia awaits for a written proposal from the US/NATO regarding their security guarantees. Meanwhile, the US and the EU struggle to find common ground on new sanctions in the case that Russia launches an attack. Several options have been laid on the table. The US administration has been reported to consider sanctions targeting Russian individuals and financial institutions, export bans (e.g. chips and military-related technology), and punishing Nord Stream 2 operators. The EU seems less hawkish than the US, and also remains divided in their stance with regards to a bloc-wide response. The likelihood of removing Russia from SWIFT seems somewhat lower than in early January, as particularly Germany has appeared very reluctant to consider any sanctions that would stop gas imports from Russia. We think the West would abstain from the most extreme sanctions even if there is a military escalation, as long as any new conflict would be contained in size and scope. But in the unlikely event of a large-scale Russian attack and a full-blown war, the West's response could be harsh.
Equities: The rebound proved to be short-lived, with US markets dipping back to red on Tuesday. Growth lagged again as yields picked up, with semis, MedTech and tech selling off further. S&P 500 -1.2%, Dow -0.2%, Nasdaq -2.3% and Russell -1.5%. Asian markets are somewhat directionless this morning, and US futures have turned slightly positive.
FI: The long-end underperformance yesterday was noticeable with the Dutch 2052 supply as well as the French 2052 linker. Furthermore, Finland mandating banks for a long 20y resulted in additional underperformance of the long end RFGB curve versus peers. Benchmark spreads in the 10y segment were broadly stable for the core and semi-core while the peripheral spreads to Bunds tightened some 2bp - with no outcome of the Italian presidential election yet as widely expected.
FX: Fed will likely remain hawkish until commodities roll over. EUR weakness is here to stay and we see EUR/USD at 1.08 in 12M. Growth downgrades by IMF are in line with wobbly markets. RUB has tentatively stabilized after having returned to anchor.
Credit: CDS indices followed European equities in green, but cash bonds continued to sell off yesterday. iTraxx Xover tightened 4.3bp and Main almost 1bp while HY bonds widened 5bp and IG 1.5bp.
Nordic macro
In Sweden, Max Elger, Minister for Financial Markets, has called an extraordinary meeting of the Financial Stability Council (09:00 CET) in light of the tense security situation in Europe and the risk of effects on the functioning of the financial markets. FSA's Erik Thedéen, Stefan Ingves, SNDO's Hans Lindblad will participate. The data calendar is light with PPI and trade balance numbers for December.
EUR/USD Daily Outlook
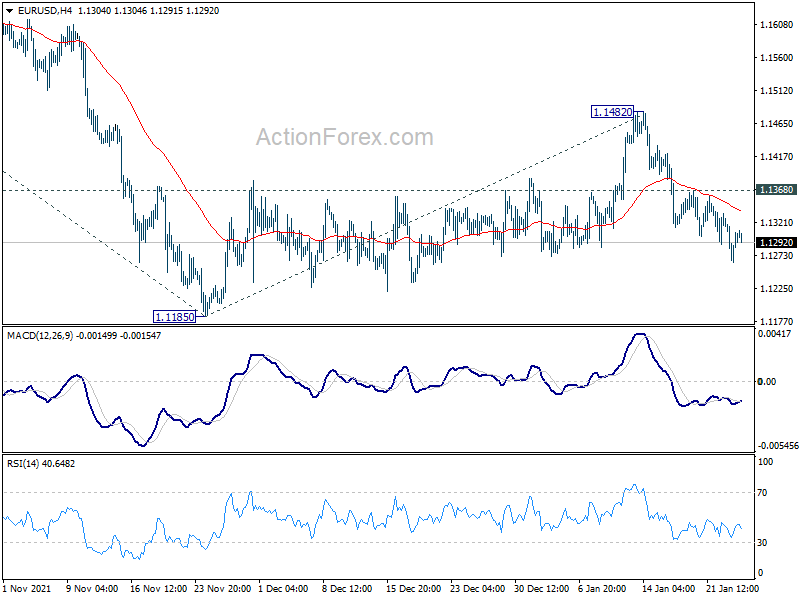
Daily Pivots: (S1) 1.1268; (P) 1.1298; (R1) 1.1334; More...
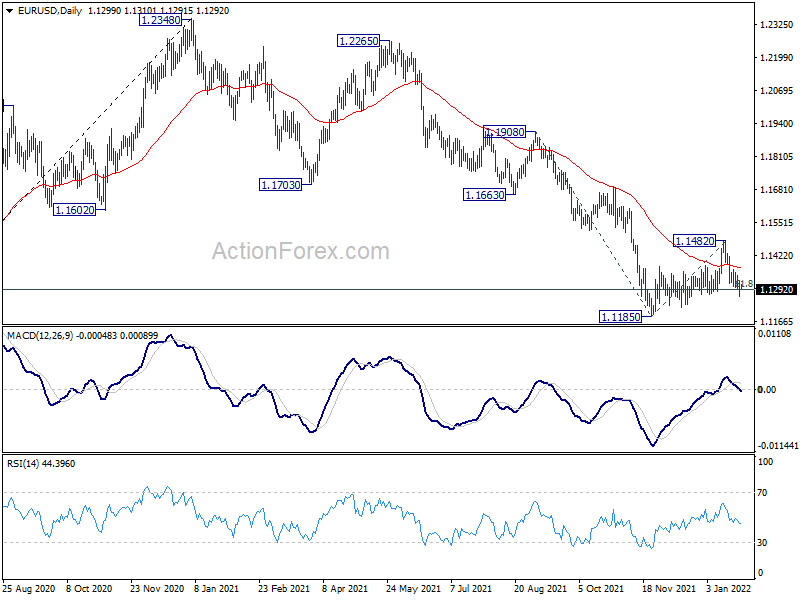
Intraday bias in EUR/USD remains mildly on the downside. Corrective rebound from 1.1185 should have completed at a.1482. Deeper fall would be seen back to 1.1185 first. Firm break there will resume larger down trend from 1.2348 to 61.8% projection of 1.1908 to 1.1185 from 1.1482 at 1.1035. On the upside, above 1.1368 minor resistance will turn intraday bias back to the upside, and extend the consolidation from 1.1185 with another rise.
In the bigger picture, there are various ways of interpreting the fall from 1.2348 (2021 high). It could be a correction to rise from 1.0635 (2020 low), the fourth leg of a sideway pattern from 1.0339 (2017 low), or resuming long term down trend. In any case, outlook will now stay bearish as long as 1.1703 support turned resistance holds. Sustained break of 61.8% retracement of 1.0635 to 1.2348 at 1.1289 would pave the way back to 1.0635.
GBP/USD Daily Outlook
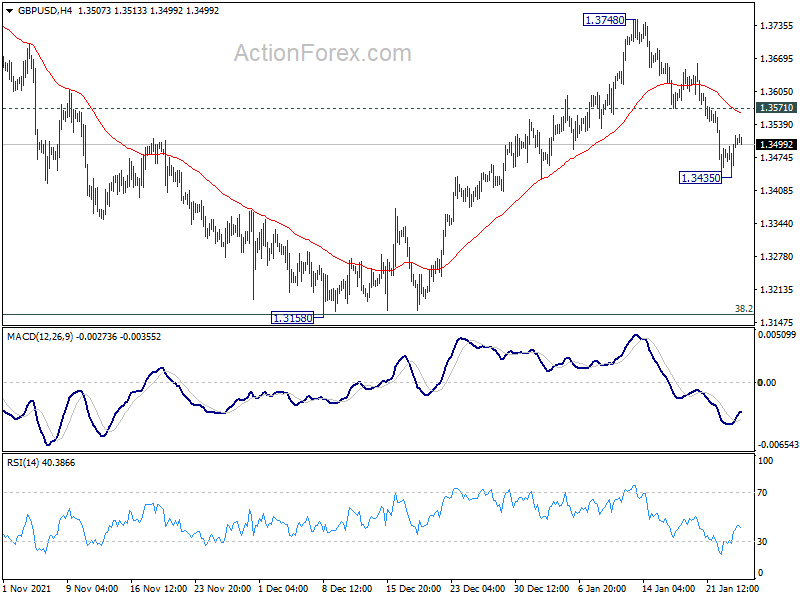
Daily Pivots: (S1) 1.3455; (P) 1.3487; (R1) 1.3537; More...
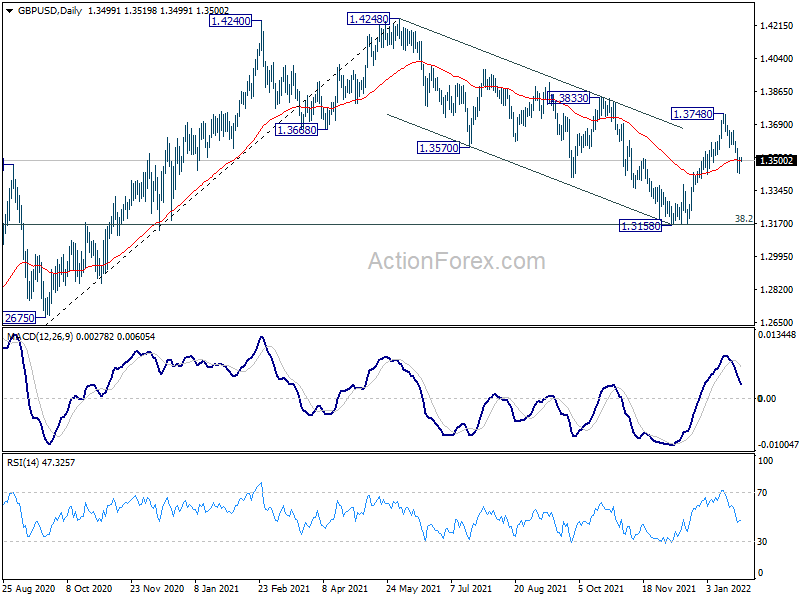
GBP/USD recovered after dropping to 1.3435 and intraday bias is turned neutral first. As noted before, rebound from 1.3158 could have completed at 1.3748 already. More importantly, larger fall from 1.4282 is probably not over yet. Deeper fall would be seen and break of 1.3435 will target 1.3158 low. On the upside, though, above 1.3571 minor resistance will turn bias back to the upside for retesting 1.3748.
In the bigger picture, strong support was seen from 38.2% retracement of 1.1409 to 1.4248 at 1.3164. The development suggests that up trend from 1.1409 (2020 low) is still in progress. On resumption, next target will be 38.2% retracement of 2.1161 to 1.1409 at 1.5134. Nevertheless sustained break of 1.3164 will argue that whole rise from 1.1409 has completed and bring deeper fall to 61.8% retracement at 1.2493.
USD/CHF Daily Outlook
Daily Pivots: (S1) 0.9114; (P) 0.9136; (R1) 0.9164; More....
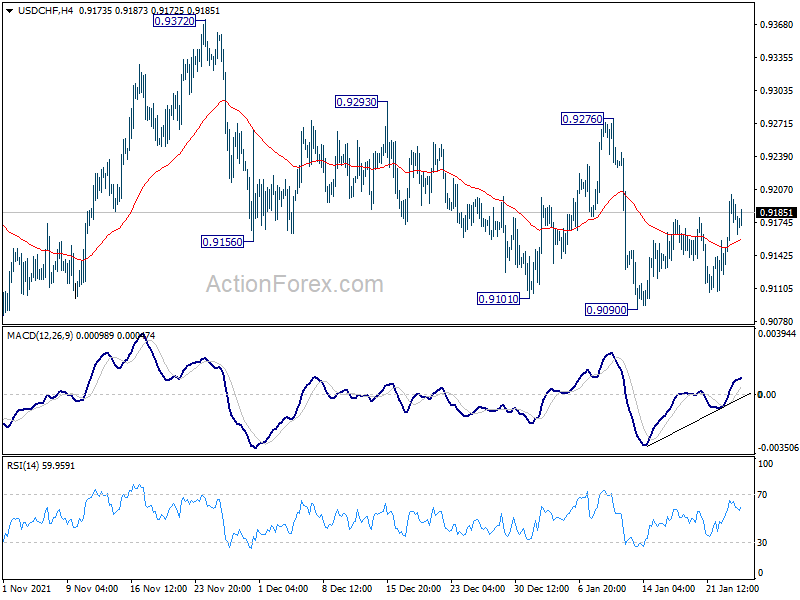
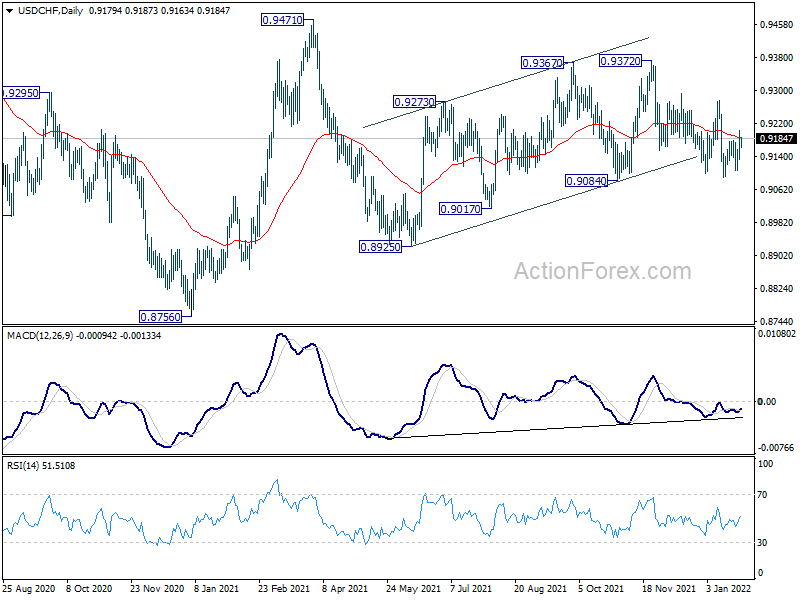
Intraday bias in USD/CHF remains neutral as range trading continues. On the downside, firm break of 0.9084 support will argue that choppy rise from 0.8925 has completed. Fall from 0.9471 might be ready to resuming. Further decline would be seen back to 0.8925 support first. On the upside, above 0.9276 will target 0.9372 resistance instead.
In the bigger picture, the corrective structure of the rebound from 0.8925 argues that fall from 0.9471 is not complete yet. It could either be the second leg of pattern from 0.8756 (2021 low), or resuming larger down trend from 1.0237 (2018 high). We'd pay attention to the downside momentum and assess the odds later. But for now, medium term outlook will be neutral at best as long as 0.9471 resistance holds.
USD/JPY Daily Outlook
Daily Pivots: (S1) 113.63; (P) 113.89; (R1) 114.12; More...
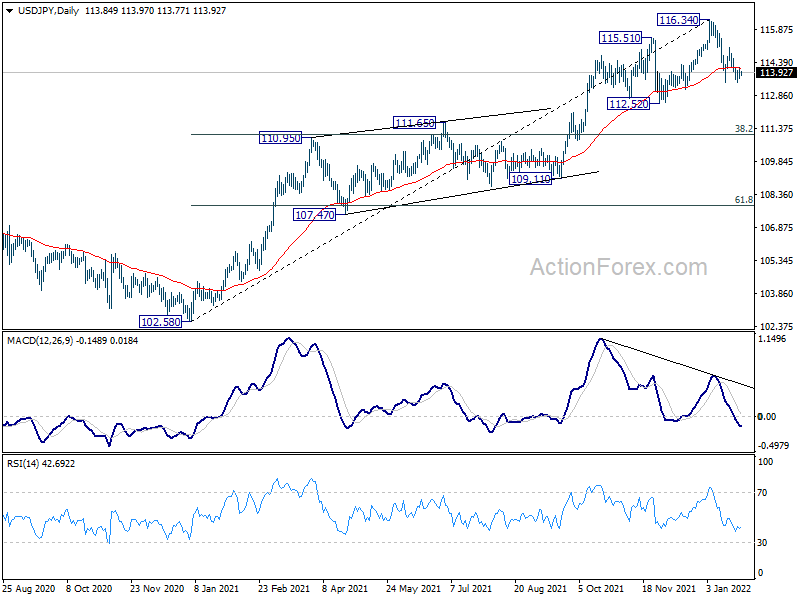
Intraday bias in USD/JPY stays neutral and outlook is unchanged. As noted before, considering bearish divergence condition in in daily MACD, it's probably already in correction to whole up trend from 102.58. Break of 113.47 will target 112.52 support first, and then 38.2% retracement of 102.58 to 116.34 at 111.08. For now, risk will stay on the downside as long as 115.05 resistance holds, in case of recovery.
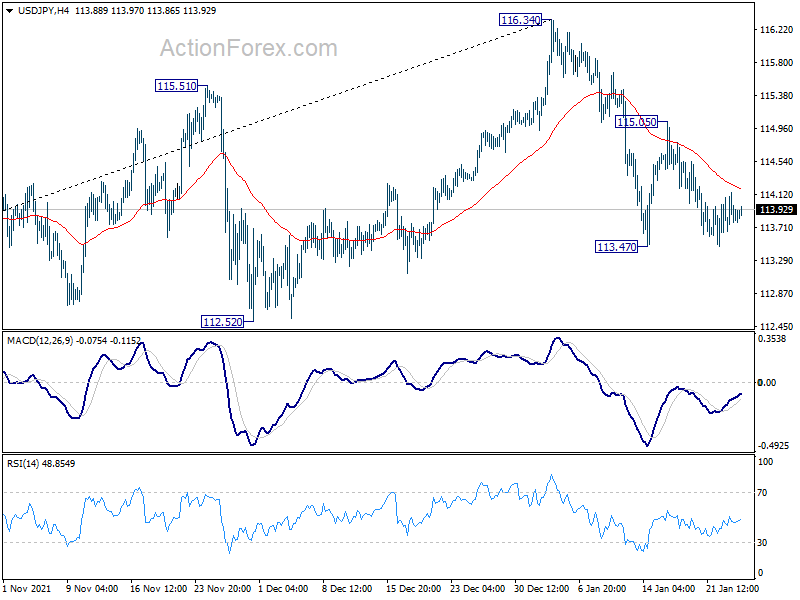
In the bigger picture, no change in the view that rise from 102.58 is the third leg of the up trend from 101.18 (2020 low). Such rally should target a test on 118.65 (2016 high). Sustained break there will pave the way to 120.85 (2015 high) and raise the chance of long term up trend resumption. This will remain the favored case as long as 55 week EMA (now at 110.91) holds.
AUD/USD Daily Report
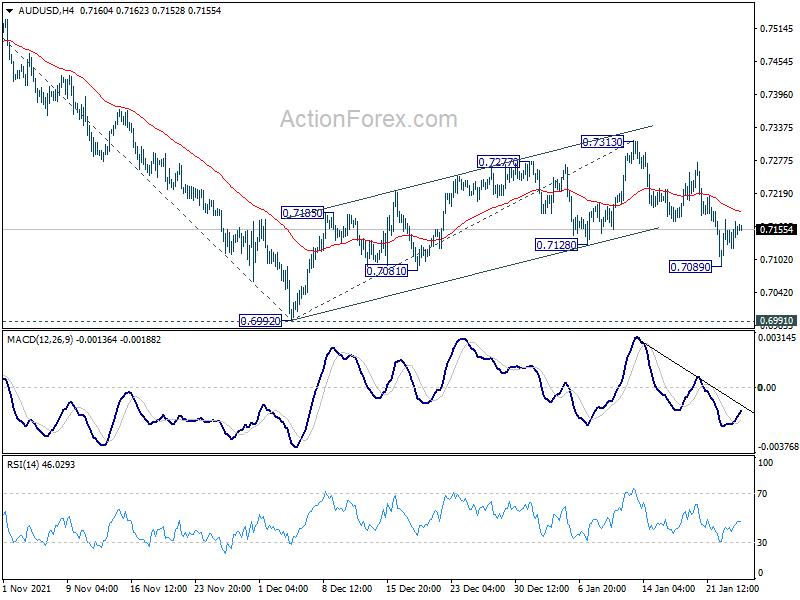
Daily Pivots: (S1) 0.7125; (P) 0.7149; (R1) 0.7175; More...
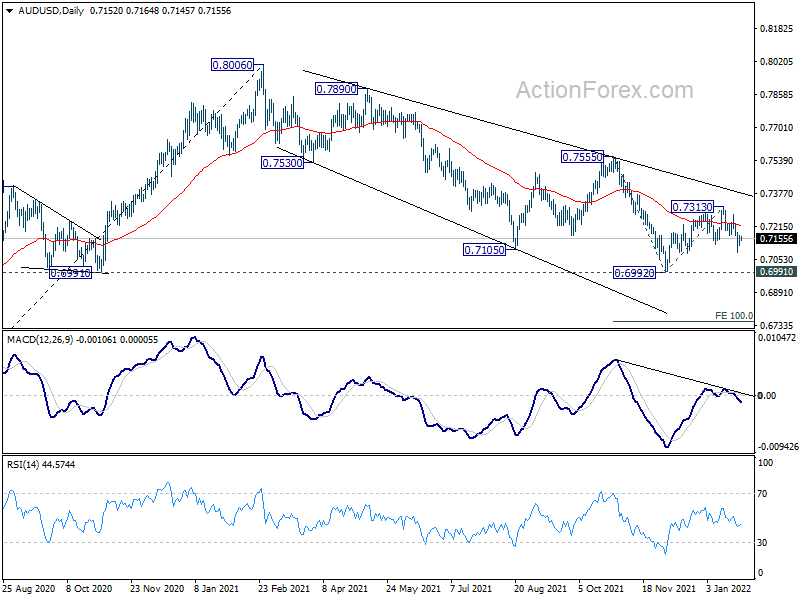
Intraday bias in AUD/USD remains neutral first. Risk will stay on the downside as long as 0.7313 resistance holds. Corrective rebound from 0.6992 should have completed there. Below 0.7089 will target 0.6991/2 support zone. Further break there will resume larger down trend from 0.8006, and carries larger bearish implication. Next target will be 100% projection of 0.7555 to 0.6992 from 0.7313 at 0.6750.
In the bigger picture, strong rebound from 0.6991 key structural support will retain medium term bullishness. That is, whole up trend from 0.5506 is still in progress. Firm break of 0.7555 resistance will target 0.8006 high and above. However, sustained break of 0.6991 will argue that the whole up trend from 0.5506 might be finished at 0.8006, after rejection by 0.8135 long term resistance. Deeper decline would then be seen back to 61.8% retracement of 0.5506 to 0.8006 at 0.6461.