Sample Category Title
Temporary Reprieve
Equity markets are recovering some of yesterday's losses but anxiety and uncertainty continue to dominate after a disappointing start to earnings season.
Inflation and interest rate concerns are going nowhere soon and with traders now increasingly considering the possibility of hikes larger than 25 basis points, the possibility of more pain in stock markets is very real.
The idea that we could go from rock bottom rates and enormous bond-buying to rapid tapering, 50 basis point hikes, and earlier balance sheet reduction is quite alarming. We're talking about markets that have become very accustomed to extensive support from central banks and very gentle unwinding when appropriate. This is quite a shock to the system.
And so far earnings season is not providing investors the comfort they were hoping for. Significant compensation increases and lower trading revenues hurt JP Morgan and Goldman Sachs, and higher wage demands are likely to be a common theme throughout the next few weeks which will put a dampener on the bottom line and not alleviate concerns about persistent and widespread price pressures.
UK inflation jumps again ahead of Bailey appearance
The CPI data from the UK this morning compounded inflation concerns, hitting a 30-year high and once again surpassing expectations in the process. And it's highly unlikely we're seeing the peak, with that potentially coming around April when the cap on energy tariffs is lifted considerably to reflect higher wholesale prices. Other aspects will also contribute to higher levels of inflation at the start of the second quarter, at which point we may have a better idea of how fast it will then decline.
Of course, the Bank of England can't just turn a blind eye until then. The MPC may be willing to overlook transitory inflationary pressures but the rise in CPI has proven to be neither temporary nor tolerable. Instead, it's become more widespread and the central bank is being forced to act and may do so again next month after raising interest rates for the first time since the pandemic in December. A few more hikes after that are also priced in for this year but if pressures continue to mount, traders may begin to speculate about the possibility of larger hikes, as we've seen starting in the US.
All of this should make Andrew Bailey's appearance before the Treasury Select Committee later today all the more interesting. The central bank has warned of higher inflation and possible interest rate hikes for months but delayed doing so after initial hints ahead of the November meeting. Given what's happened since, the decision looks all the more strange. Of course, it's easy to say that with 20/20 hindsight.
Oil gathering momentum as $100 oil looks increasingly likely
Oil prices are continuing to climb on Wednesday and find themselves only a little shy of $90 a barrel. This happened as IEA confirmed that the market looks tighter than previously anticipated as a result of stronger demand, despite omicron, and the inability of OPEC+ to hit its monthly increased production targets. This imbalance has led to surging prices which will further pressure households and businesses already fighting high inflation.
What's more, not only does the rally not appear to be losing steam, it may have even generated fresh momentum. While $90 could have triggered some profit-taking and a minor cooling of prices, this suggests they'll see no reprieve and we could realistically see $100 oil soon.
Can gold break higher as traders speculate about more rate hikes
Gold is marginally higher again after the easing over the course of the last week. The yellow metal is continuing to struggle around $1,833 which has been a surprisingly strong level of resistance over the last six months. But support is returning after it came close to $1,800 so a break to the upside remains a strong possibility.
Given the calls for even more rate hikes this year than markets are pricing in, not to mention larger individual increases than we've seen for many years, perhaps we are seeing some inflation hedging from traders that don't think central banks are doing enough to bring price pressures down.
Consolidation continues
Bitcoin appears to have gotten lost in the noise of the last few weeks. It's not falling too hard despite risk assets getting pummelled but it's not recovering to any great extent either. Instead, it's floating between support at $40,000 and resistance around $45,000 and showing no signs of breaking either at this point.
Canadian Dollar Falls Below 1.25
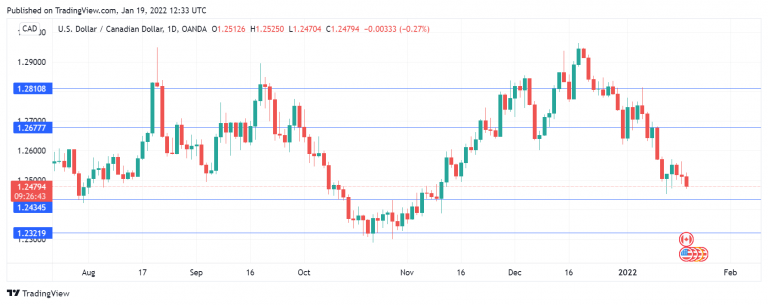
The Canadian dollar continues to push higher and USD/CAD has dropped below the symbolic 1.25 line. The pair is currently trading at 1.2476 and is close to 1.2553, its lowest level since November 10th.
US Treasury rates continue to move higher. After punching past 1.80% on Tuesday, a 2-year high, the 10-year rate has climbed to 1.90%. The 10-year rate hasn’t been above the symbolic 2% level since July 2019, but it looks poised to climb above that line shortly. The jump in US yields is reflective of market concerns that the Fed will accelerate its tightening. Last week, FOMC member Patrick Harker said that the Fed could raise rates three or four times this year. That was not big news, but the markets paid attention when JP Mogan’s CEO Jamie Dimon weighed in and stated that the Fed might hike six or seven times. Higher yields should provide a boost for the US dollar.
Will Canada CPI be a market-mover?
Canada will release CPI data for December later in the day. The headline reading is expected in at 4.8%, while core CPI is forecast at 3.5%. These inflation readings will be carefully monitored by the BoC and could be a market-mover for the Canadian dollar. If the inflation reports prove to be a big miss, the Canadian dollar could lose ground, as expectations that the BoC will raise rates next week would ease. Conversely, strong reading will provide support for the bank to raise rates next week, which is bullish for the Canadian dollar.
Oil prices are a key driver for the Canadian dollar, and the recent jump in oil prices has helped boost the currency, with USD/CAD falling by 1.33% in January. With geopolitical tensions rising in the Persian Gulf and Ukraine, oil could head closer towards the USD 100 level, which would be great news for the Canadian dollar.
USD/CAD Technical
- USD/CAD is testing support at 1.2513. Below, there is support at 1.2396
- There is resistance at 1.2762 and 1.2879
Equities Under Fire, Dollar Shines as Yields Soar
- Stocks remain under pressure as traders position for Fed hikes
- Dollar outperforms, yen benefits from risk aversion, euro hammered
- Oil prices keep going, Canadian inflation stats in the spotlight
All about the Fed
Bets that the Fed will take a sledgehammer to crush inflationary pressures continue to escalate. More than four rate increases are now priced in for this year, which means traders have started to entertain the idea of either a fifth increase or a ‘double’ hike of 50 basis points to shock markets and pummel inflation expectations back down.
This has translated into a mighty rally in US Treasury yields, which have powered higher to eclipse pre-pandemic levels with a little help from surging energy prices. It is really the breakneck speed of this move that has taken many investors by storm.
Once the bond market starts to ring alarm bells, that fills the stock market with fear. That’s because many players aren’t willing to take on the risk or stomach the volatility of stocks if bonds start paying a positive return. Higher yields also make it more difficult to justify pricey valuations, hence why the purge usually begins with the riskiest companies.
As such, it is the tech sector that has suffered the most damage, with the Nasdaq losing 2.6% yesterday and futures pointing to another bloody nose today. The battle could be decided around the 200-day moving average, a barrier the index has never violated during the pandemic recovery.
Dollar shines, euro takes a hit
The FX market has pretty much stuck to the script of risk aversion this week. The dollar is leading the pack as rate differentials continue to widen in its favor and nervous traders look for shelter in the reserve currency. And while rising yields are usually anathema for the yen, that hasn’t played out this time, with its safe-haven qualities outshining its rate disadvantage.
Instead, the biggest loser has been the euro. Even though European yields have also joined the global rally, with the German 10-year turning positive today for the first time since 2019, American yields are rising much faster. That has clipped euro/dollar’s wings.
The bad news is that there’s more scope for losses. Money markets are currently pricing in 20 basis points of ECB rate increases by year-end, which seems rather unrealistic given the gloomy growth prospects in the euro area, even if inflation has fired up.
Oil stays elevated, loonie awaits inflation test
Elsewhere, oil prices remain elevated near multi-year highs, benefiting from a combination of supply concerns and demand hopes. An explosion in a pipeline running from Iraq to Turkey was the latest episode in a series of production disruptions lately, while on the demand side, there are growing hopes the pandemic might be downgraded to an endemic soon.
As for today, British inflation data have already been released and showed another acceleration in price pressures. That has almost sealed the deal for a Bank of England rate increase next month, which is currently priced in with a 95% probability. And yet sterling has been unable to capitalize, mirroring the sour mood in equity markets instead.
The spotlight will fall on the Canadian dollar later today as the nation’s latest inflation numbers could either lead traders to fully price in a Bank of Canada rate hike for next week, or turn the event into a coin toss.
Finally, the earnings season will fire up with Bank of America, Morgan Stanley, Procter & Gamble, and ASML Holdings reporting their quarterly results.
Gold Shackled in a Neutral Trajectory as Driving Forces Fade
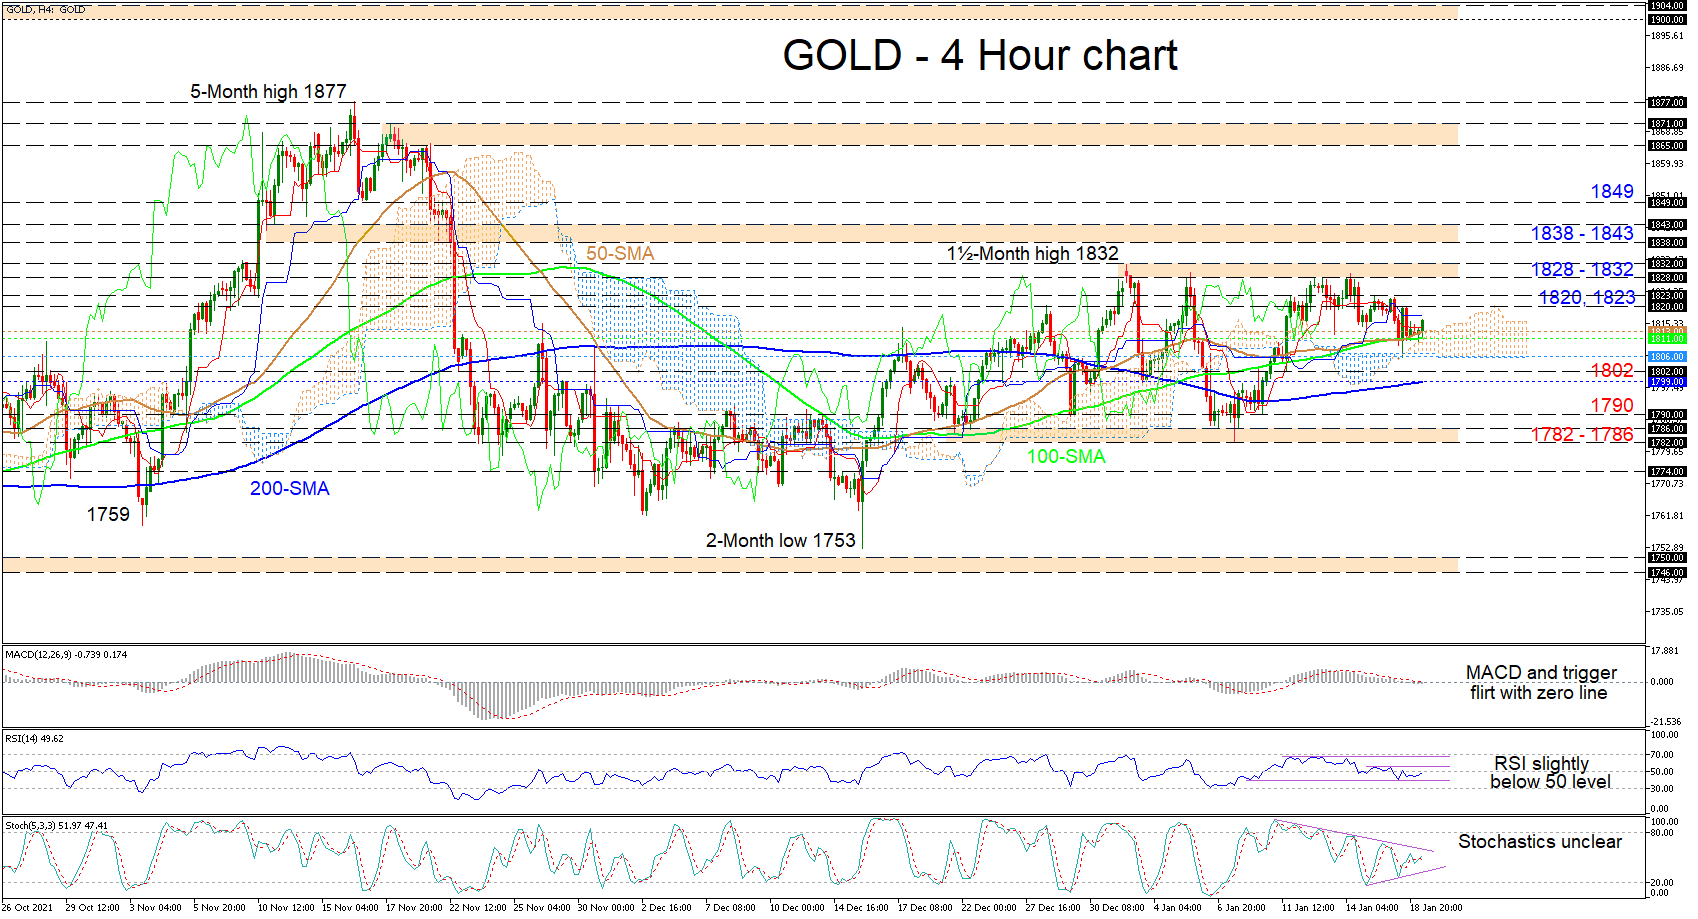
Gold has fairly flatlined around the Ichimoku clouds’ upper band, where the 50- and 100-period simple moving averages (SMAs) are also residing. Directional momentum seems to have dried up even though the SMAs are endorsing a modest upside bearing.
The Ichimoku lines are indicating the absence of directing impetus, while the short-term oscillators are not suggesting any clear price preference in the precious metal. Momentum is lacking, something also being demonstrated by the MACD and red trigger line, which are both toying with the zero threshold. The RSI is slightly underneath the 50 level and is showing weakness in directional momentum. The consolidating stochastic lines are currently not reflecting a commanding price direction.
In the positive scenario, initial upside hindrance could develop around the nearby 1,820 and 1,823 highs. Efforts to improve further may then be opposed by the 1,828-1,832 resistance ceiling. If the bulls successfully overstep this obstacle, they may meet the 1,838-1,843 resistance border before pursuing the 1,849 barrier.
Otherwise, for the price to steer lower, sellers would need to overpower the immediate support zone from the 50-period SMA at 1,813 until the cloud’s lower surface at 1,806, an area which encompasses the 100-period SMA, the recent low and the cloud. Should the bears take the lead, the next support section could evolve between the 1,802 barrier and the 200-period SMA at 1,799. Sinking further, the 1,790 obstacle may come into play before the 1,782-1,786 base draws traders’ attention.
Summarizing, gold is sustaining a neutral bias between the lower limit of 1,782-1,786 and the upper limit 1,828-1,832. A break of these boundaries could fuel a clearer price direction.
NZD Rises as US Dollar Rally Pauses
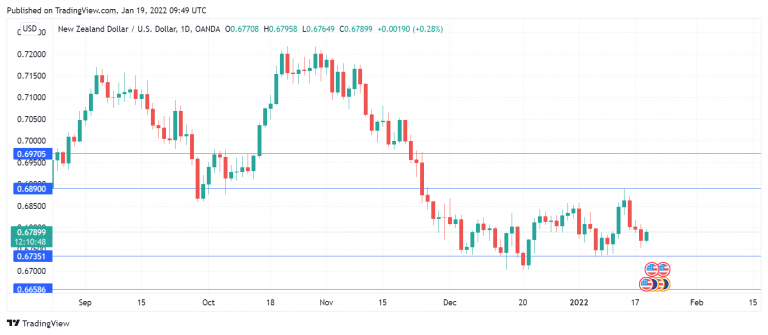
After falling over 1% since late last week, the New Zealand dollar is in positive territory on Wednesday. NZD/USD is trading at 0.6785 in the European session, up 0.19% on the day.
ANZ says RBNZ to hike up to 3%
The RBNZ has embarked on a series of incremental interest rate hikes, starting with two hikes of 25 bps in the fourth quarter of 2021, bringing the current rate to 0.75%. How far will the bank go? The ANZ Bank had projected in October that the rates would reach 2% by April 2023, but now says that rates will reach 3% by that date. ANZ wrote that this updated forecast is not due to stronger growth, but rather surging inflation and the tight labour market. ANZ noted that inflation is galloping above 5%, as is inflation expectations, which means that an OCR of 3% would be “modest”. If more analysts adopt this view, expectations of higher interest rates should boost the New Zealand dollar.
Omicron continues to cause headaches for the New Zealand government. The number of Omicron cases remains quite low, but the country has imposed tight border controls to combat the virus. The government is now closing its border to New Zealand citizens and is trying to boost the vaccination rates. Still, it’s doubtful that the country can keep Omicron at bay, and a spike in cases could lead to renewed lockdowns which would hamper economic growth.
US Treasury rates continue to creep higher. After punching past 1.80% on Tuesday, a 2-year high, the 10-year rate has climbed to 1.89%. The 2% level, which is psychologically significant, is within striking distance. Higher US bonds, a reflection of market worries about accelerated Fed tightening, have boosted the US dollar against most of the major currencies.
NZD/USD Technical
- NZD/USD is putting pressure on resistance at 0.6912. Next, there is resistance at 0.6967
- 0.6844 is providing support. Below, there is support at 0.6721
EURCHF Downtrend Continues, Marking Yet More Lower Highs
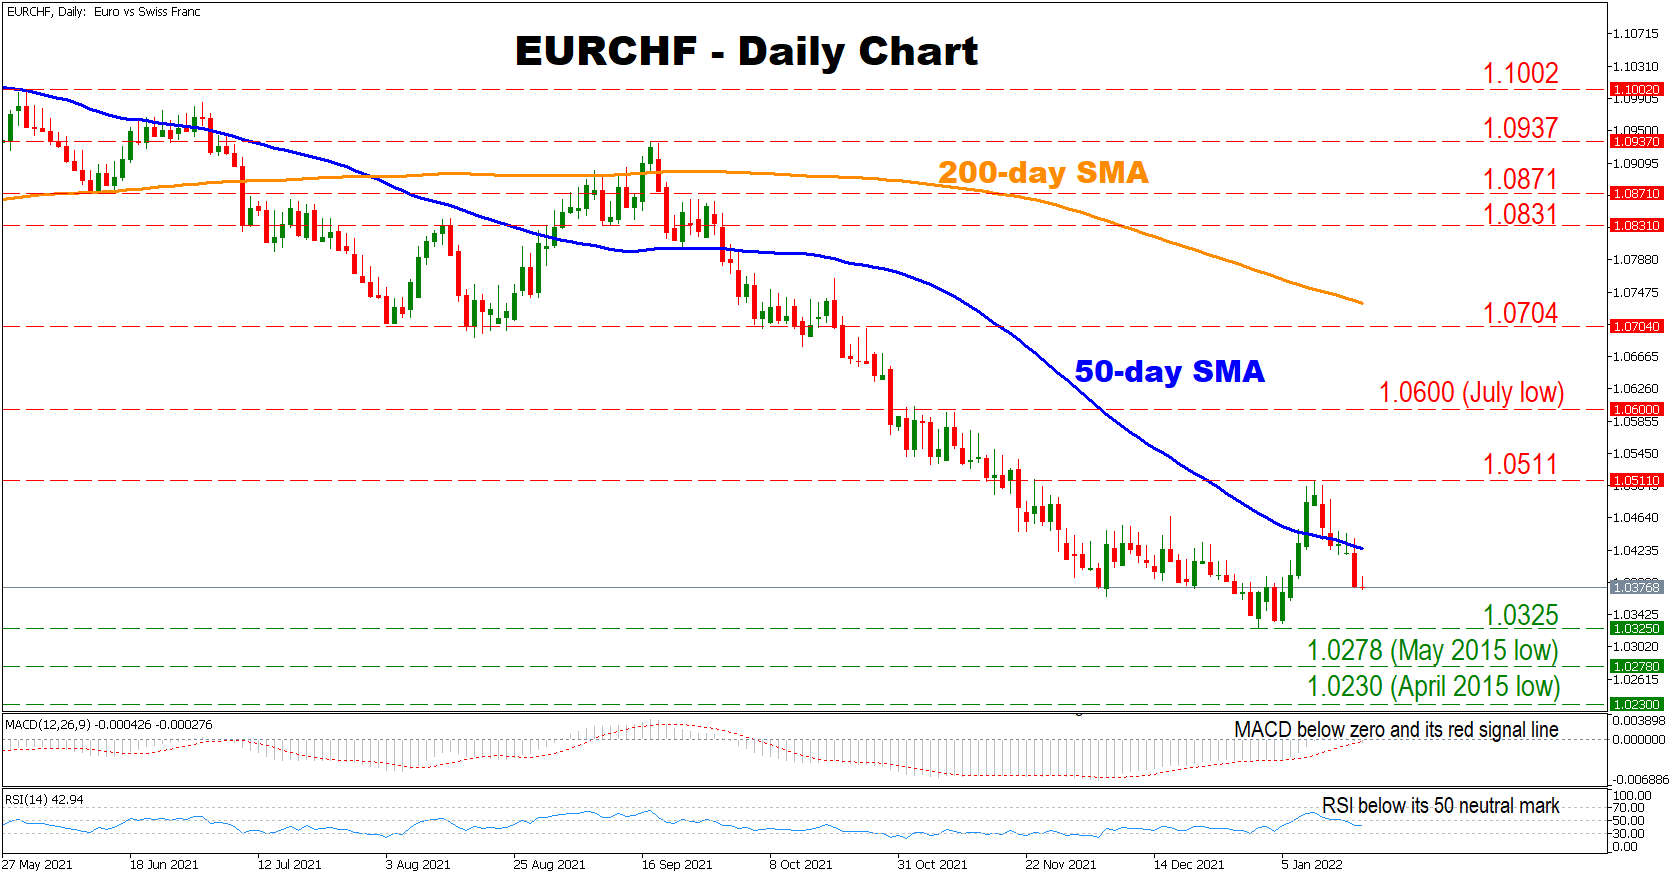
EURCHF has continued its downward trend, marking yet more lower highs and lower lows as negative forces linger. Moreover, the pair is currently trading below its 50- and 200-day simple moving average, reflecting an overall bearish outlook.
Short-term momentum indicators are supporting a negative bias for the pair as the RSI is found below its 50 neutral mark. Also, the MACD is located below zero and its red signal line, which might indicate that the negative momentum is gaining further ground.
Should the bears remain in charge, initial support might be found at the 1.0325 hurdle. A decisive move below this point could intensify selling pressures, sending the price to test its May 2015 low at 1.0278. A break below the latter could shift the attention of the bears' towards the April 2015 low at 1.0230.
On the flip side, should buyers resurface, initial resistance might be found at the 50-day SMA currently at 1.0425 before eyeing the 1.0511 barrier. Crossing above the latter could open the door towards the July low of 1.0600. A break above this point could increase buying activity, sending the price to test the 1.0704 hurdle before the bulls shift their attention towards the 200-day SMA currently at 1.0733.
In brief, the overall outlook for the pair is bearish. For sentiment to change, buyers would need to break above the 200-day SMA, which is currently around 1.0733.
Wall Street Sell-Off Accelerates as Earnings and Bond Worries Remain
American stocks declined sharply on Tuesday after relatively weak results from some of the biggest companies in the US. For example, Goldman Sachs reported that its total earnings declined by 13% while its revenue fell by 6%. The weak results came a few days after JP Morgan and Citigroup published weak earnings as their costs rose. Stocks also declined after US bond yields rose to the highest level in over two years, signaling that investors are still worried about the rising interest rates. One of the biggest movers in Wall Street was Activision Blizzard. The stock jumped sharply after being acquired by Microsoft in a $68 billion deal.
The price of crude oil maintained its bullish trend on Tuesday as investors remained optimistic that demand growth will be stronger than supplies. Recent data by the Energy Information Administration (EIA) showed that inventories have declined in the past 7 weeks straight. The EIA will publish the latest inventories data later today. At the same time, more countries have reopened, meaning that demand will continue being strong. Oil prices also surged as geopolitical risks rose in the Middle East. Houthi rebels attacked Abu Dhabi, the third-biggest producer in OPEC.
The economic calendar will have several important events today. In the UK, the Office of National Statistics will publish the latest consumer price index (CPI) data. Economists expect the data to show that prices jumped by 5.2% in December. Excluding food and energy prices, they expect the data to show that the country’s inflation rose to 3.9%. These numbers will come a day after the ONS published strong jobs numbers. The next key data to watch will be the latest Canadian consumer inflation data. As in other countries, analysts expect the numbers to show that inflation rose to 3.5%.
XTIUSD
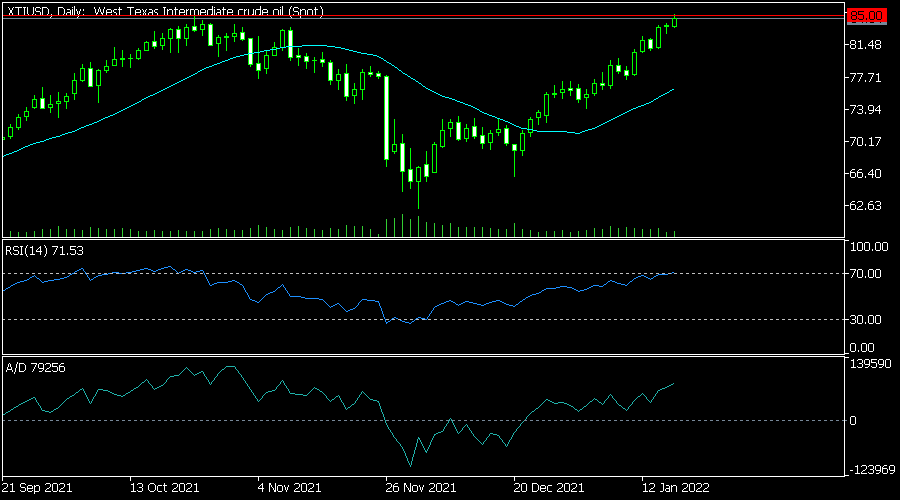
The XTIUSD pair has been in a strong bullish trend in the past few months. It has managed to rise from a low of 62.15 in December to the current 84.70. On the daily chart, the pair moved above the 25-day and 50-day moving averages. The Relative Strength Index (RSI) is approaching its oversold level while the accumulation and distribution indicator has kept rising. Therefore, the pair will likely keep rising as bulls target the key resistance at 86.
EURUSD
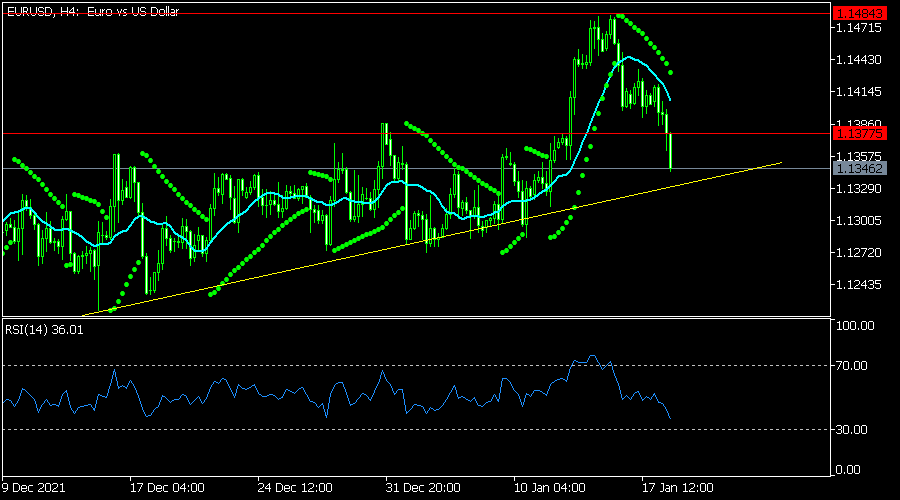
The EURUSD declined sharply in the overnight session as US bond yields rose. It declined to a low of 1.1350, which was significantly lower than last week’s high of 1.1485. The price is approaching its ascending trendline shown in yellow. It has also moved slightly below the 25-day and 50-day moving average and the dots of the Parabolic SAR. Therefore, the pair will likely keep falling as bears target the key support at 1.1300.
GBPUSD
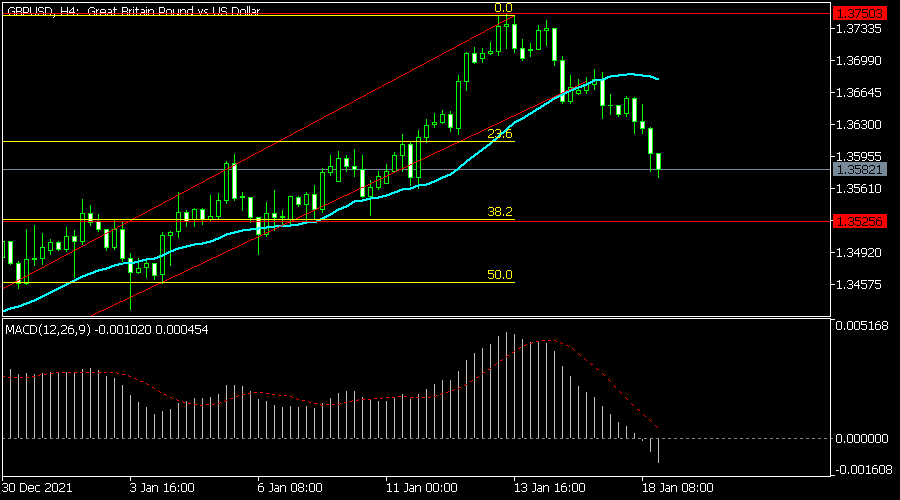
The GBPUSD pair continued its bearish trend after strong UK jobs numbers. It is trading at 1.3518, which was the lowest level in weeks. It has crossed the 23.6% Fibonacci retracement level on the four-hour chart. It has also moved below the 25-day and 50-day moving averages while oscillators have been falling. Therefore, the pair will likely keep falling, with the next key support being at the 38.2% retracement level at 1.3525.
NZDUSD Preserves Buying Interest with Technical Support
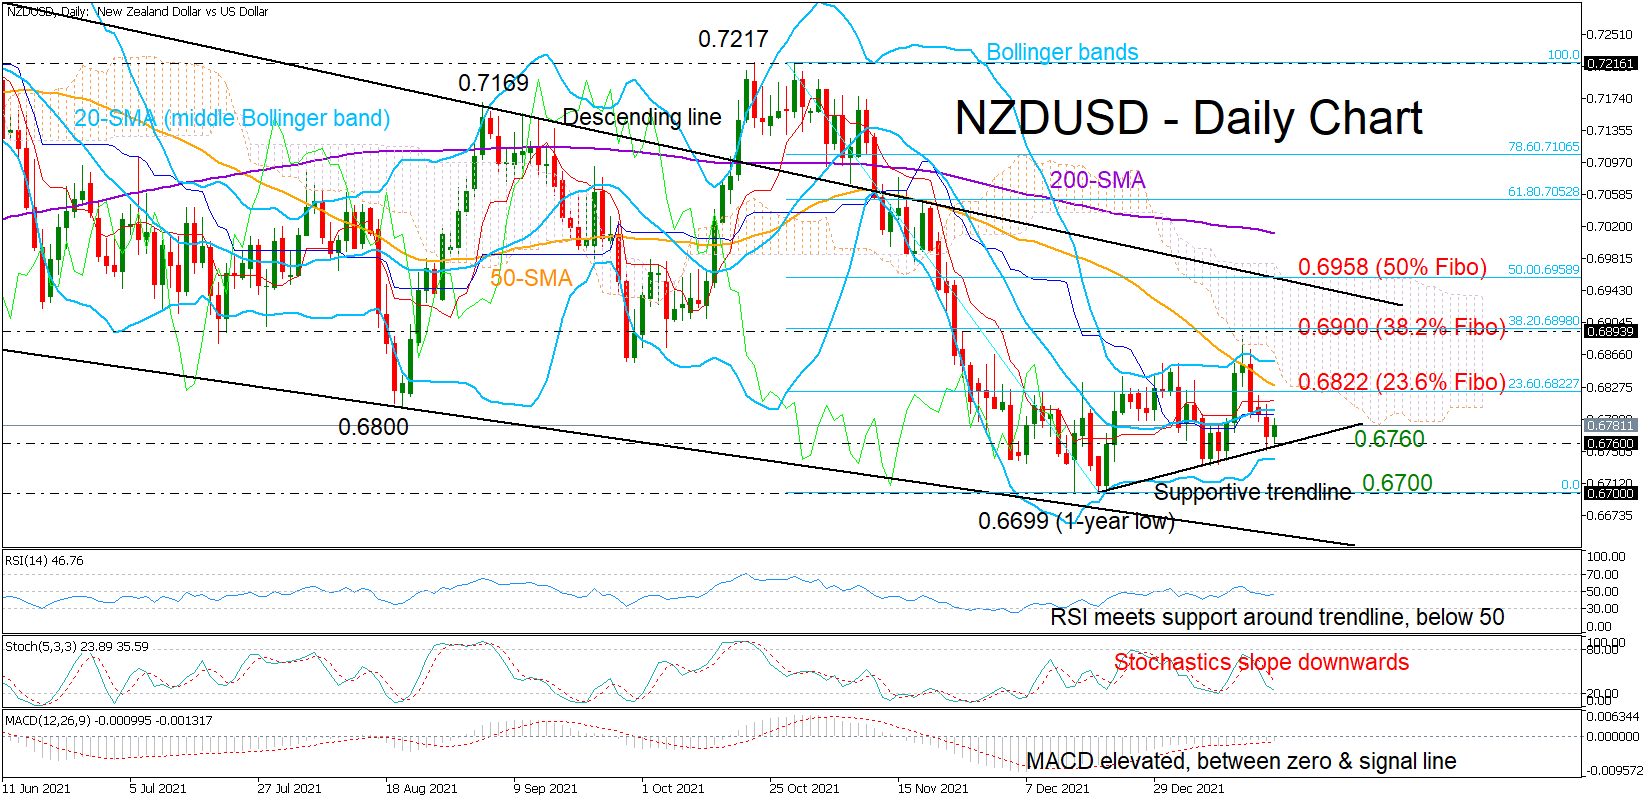
NZDUSD has been quite unstable, oscillating between gains and losses within the 0.6700 – 0.6900 territory since the drop to a one-year low of 0.6699 in December. Yet, despite the fluctuations, the pair managed to build a soft upward trajectory in the short-term picture with the help of a strong supportive trendline.
The 20-day simple moving average (SMA), which represents the middle Bollinger band, is currently blocking bullish actions around the 0.6800 round level as the momentum indicators provide little direction about what the next move in the price could be. The RSI has yet to set a foothold within the bullish area despite maintaining a positive trend above an ascending trendline, currently hovering marginally below its 50 neutral mark. The MACD is also following a positive direction, though it is still trapped between its red signal and zero lines, while the Stochastics keep sloping downwards.
The 0.6800 – 0.6820 region, which encapsulates the 20- and 50-day SMAs and the 23.6% Fibonacci retracement of the 0.7217 – 0.6699 down leg, is currently the main target. A successful step above it could generate additional upside corrections up to the 38.2% Fibonacci of 0.6900, where the price almost topped last week. Further up, the bulls may attempt to breach the descending trendline from February 2021 and the 50% Fibonacci of 0.6958.
On the downside, the short-term supportive trendline is preserving some optimism in the market for now. Should it crack, the price will probably see another test near the one-year low of 0.6699 before it seeks shelter again around the downward-sloping line stretched from March 2021 at 0.6650. Lower, the pair would strengthen its broad bearish outlook, shifting attention to the 0.6600 and 0.6500 psychological marks.
In brief, although technical signals are unclear at the moment, the soft upward pattern in the short-term picture could feed buying interest, making additional higher highs above 0.6900 likely. Otherwise, a close below the ascending trendline at 0.6760 would bring bearish risks back into play.
GBP/USD Pair is Now Facing Resistance Near the 1.3600 zone
The British Pound started a downside correction from the 1.3740 zone against the US Dollar. The GBP/USD pair traded below the 1.3680 level to move into a short-term bearish zone.
There was a close below the 1.3600 level and the 50 hourly simple moving average. The pair traded as low as 1.3573 and is currently consolidating losses. On the upside, the pair is now facing resistance near the 1.3600 zone.
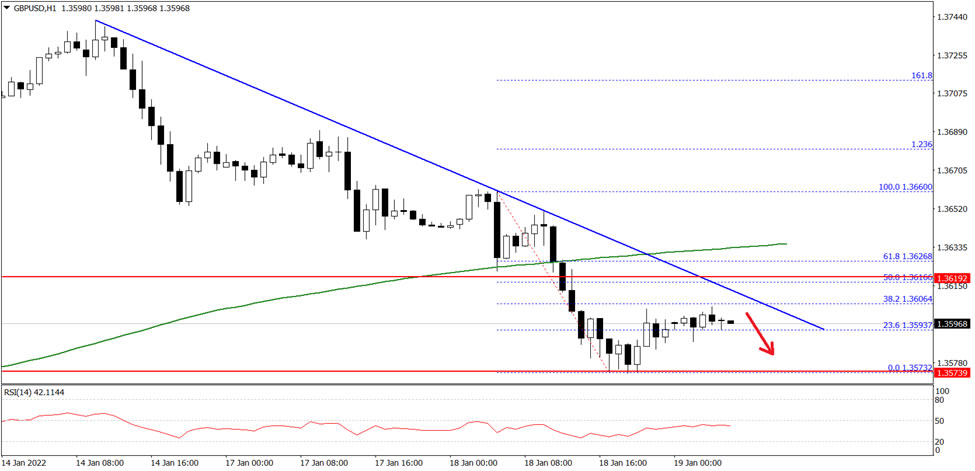
There is also a key bearish trend line with resistance near 1.3600 on the hourly chart. The next key resistance is near the 1.3640 level. Any more gains might push the pair towards the 1.3700 level.
An initial support on the downside is near 1.3580 on FXOpen. The main support is forming near the 1.3565 level. A break below the 1.3565 support level could even push the pair below the 1.3550 support.
USDJPY Struggles within SMAs after Bullish Doji
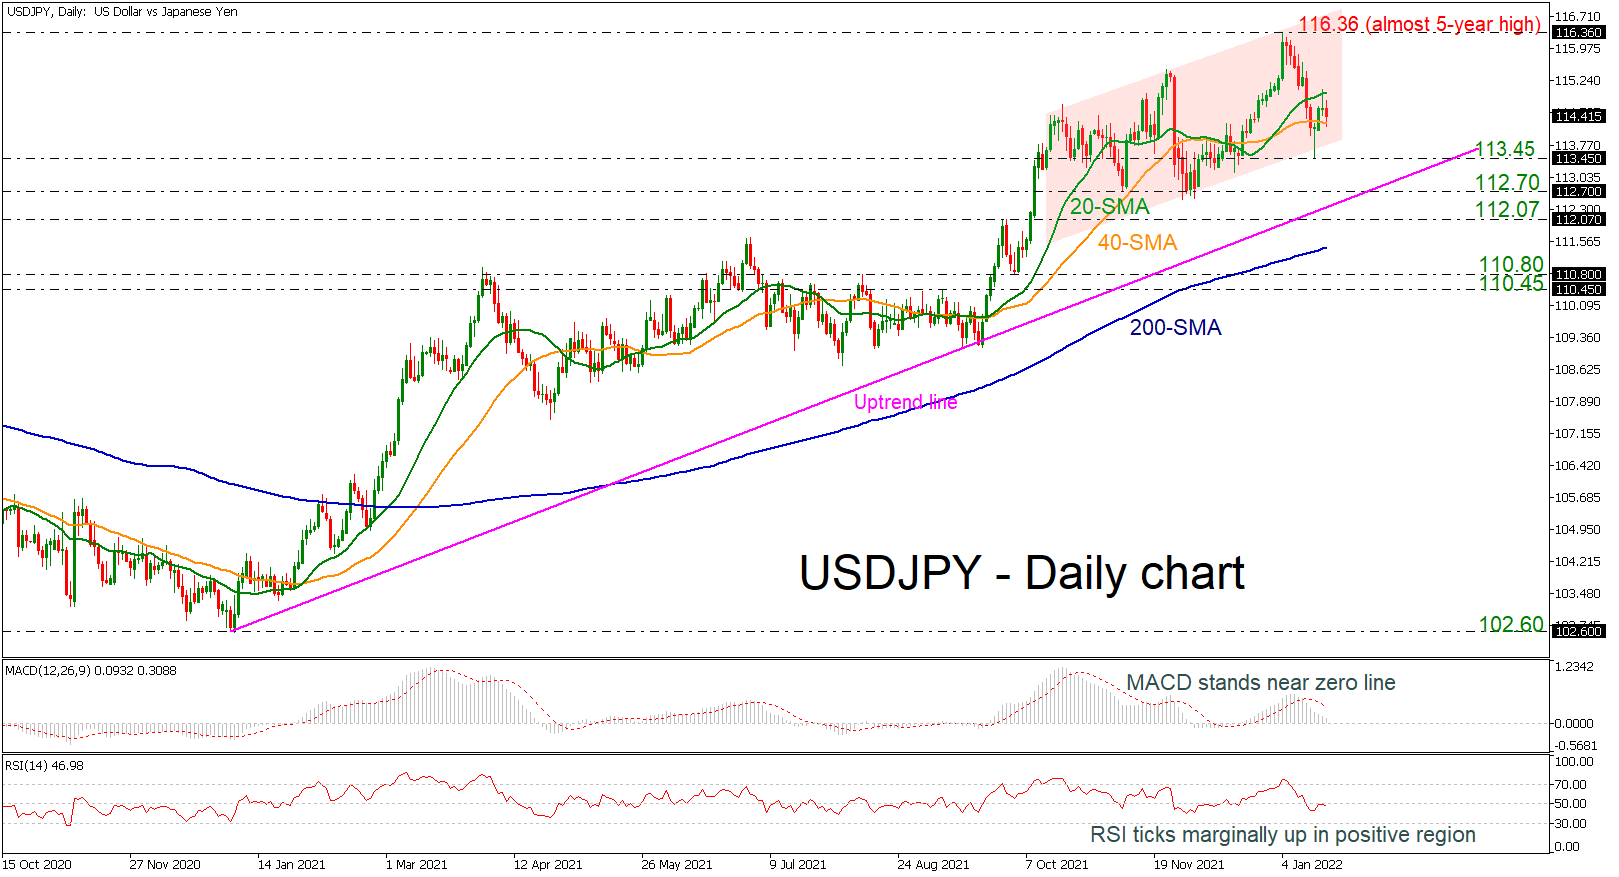
USDJPY is hovering within the 20- and 40-day simple moving averages (SMAs) after the bounce off the 113.45 support level that posted on Friday, creating an impressive spike. If the price jumps above the 20-day SMA, it could confirm a bullish doji pattern which is behaving as a reversal formation.
Regarding the technical indicators, the MACD is weakening in the positive area, below its trigger line, while the RSI is sloping marginally down in the negative region, both suggesting the next move to the downside rather to the upside.
If sellers drive the pair lower, immediate support could come from the recent low at 113.45 before touching the long-term ascending trend line around 112.70. A dive below this line could open the door for bearish moves, hitting 112.07 and the 200-day SMA at 111.45.
On the flip side, a climb beyond the 20-day SMA may boost the price until the almost five-year high of 116.36 before the bullish rally continues towards the January 2017 high of 118.60.
In brief, the long- and medium-term pictures are bullish, but if there is a decline below the uptrend line near 112.70, it may turn the outlook to neutral.