Sample Category Title
NASDAQ lost -2.6% while 10-yr yield extends up trend
Major US stock indexes, particularly the NASDAQ tumbled sharply overnight, while benchmark treasury yields surged. Investors are still in the process of adjusting to the evolution of a more aggressive Fed in terms of stimulus withdrawal. At the same time, it's unsure when the no-longer-transitory inflation would start easing down, and Fed's response to that.
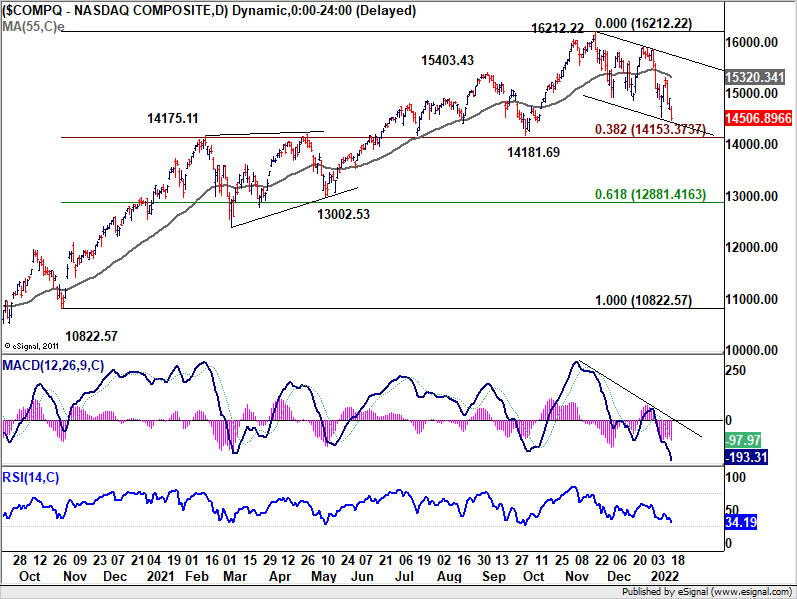
NASDAQ dropped -2.6% to close at 14506.89. The development is not a surprise as price actions from 16212.22 are seen as correcting the up trend from 10822.57 to 16212.22. Deeper fall could be seen. But we'd expect strong support around 14100/14200 to contain downside to bring rebound. The support zone coincides with 14715.11 resistance turned support, 14181.69 structural support, and 38.2% retracement of 10822.57 to 16212.22 at 14153.37. However, sustained break of this level will argue that NASDAQ is already in a larger scale correction.
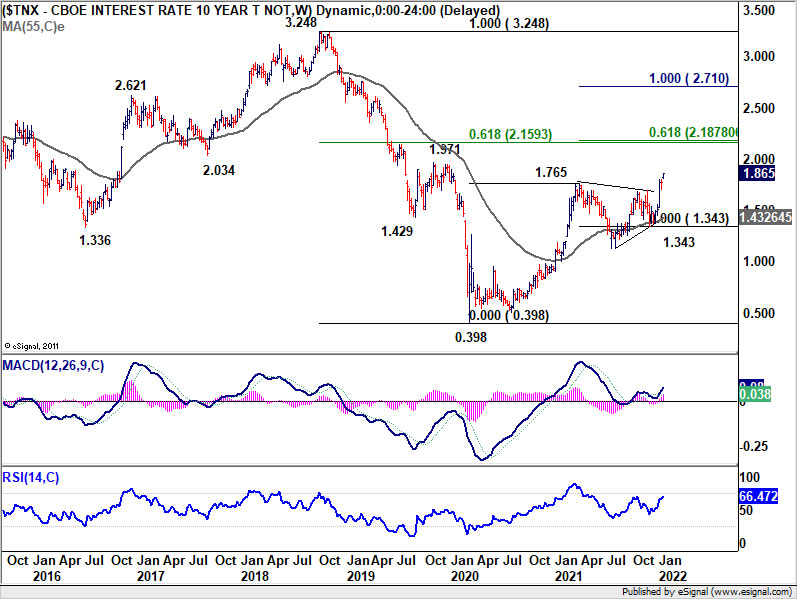
10-year yield rose 0.093 to close at 1.865. The medium term up trend is back in full force. 2% handle now looks rather approachable. But TNX should start to feel heavy above there. There should be strong resistance from 2.16/18 zone to repel the rally. This is a cluster level of 61.8% projection of 0.398 to 1.765 from 1.343 at 2.187 and 61.8% retracement of 3.248 to 0.398 at 2.159. But then, a strong break there would indicate some substantial underlying development is underway.
WTI oil hits 7-yr high, EUR/CAD downside breakout
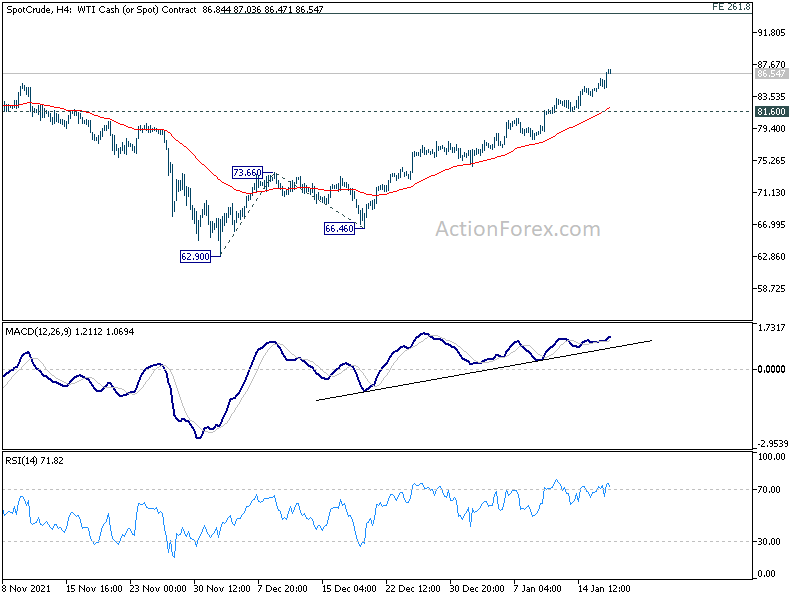
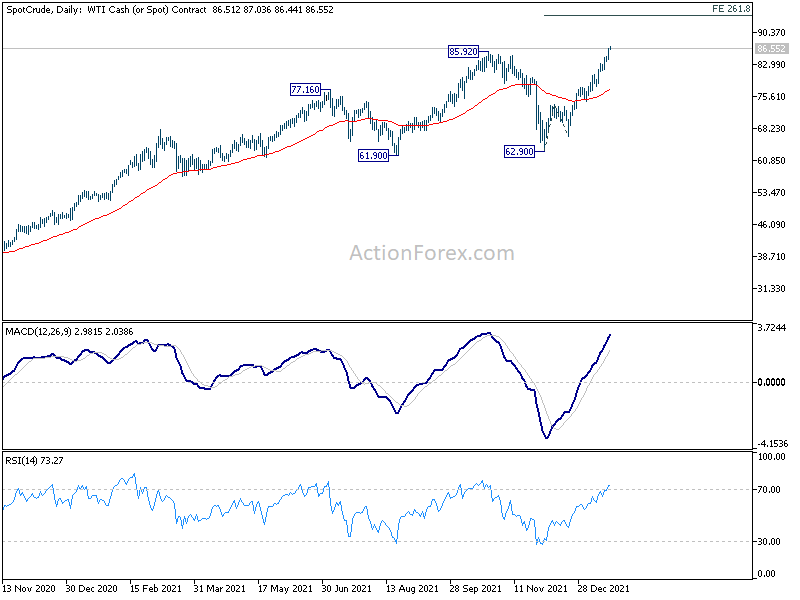
WTI crude oil surged through a key resistance overnight and hit the highest level since 2014. The outage of Turkey's Kirkuk-Ceyhan pipeline after an explosion was a factor causing concerns over supplies. In the background, there are also geopolitical issues surrounding Russia.
With 85.92 resistance taken out, WTI crude oil is resuming up trend from the 2020 spike low. For the near term, further rally is expected as long as 81.60 support holds. Next target 90 handle. But WTI could try to hit 261.8% projection of 62.90 to 73.66 from 66.46 at 94.62 before topping.
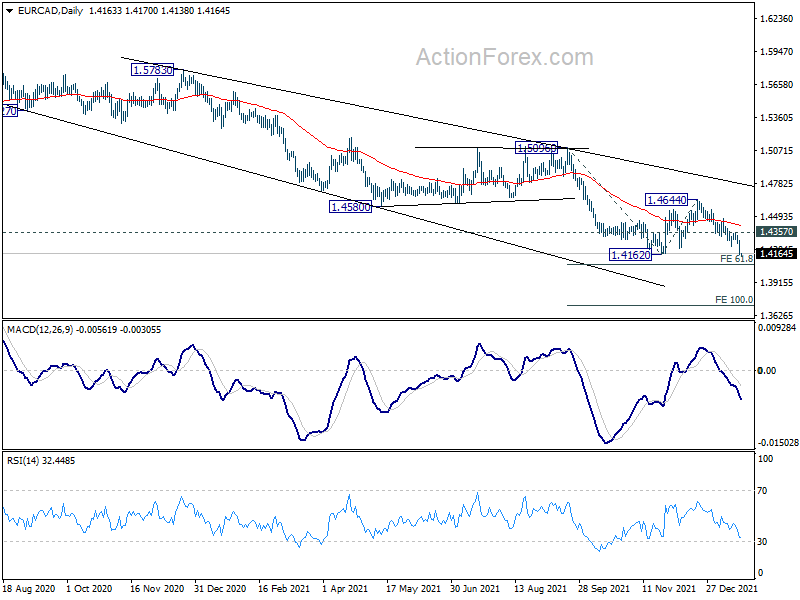
EUR/CAD followed and broke 1.4162 low to resume the down trend from 1.5991. Near term outlook will now stay bearish as long as 1.4357 resistance holds. Next target is 61.8% projection of 1.5096 to 1.4162 from 1.4644 at 1.4067. Firm break there could trigger downside acceleration to 100% projection at 1.3710.
Australia consumer sentiment dropped to 102.2 in Jan, cautiously pessimistic on economic conditions
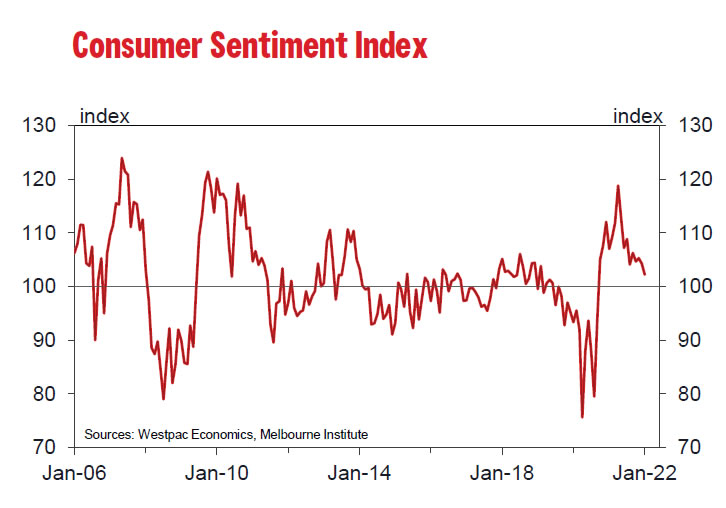
Australia Westpac-MI consumer sentiment index dropped from 104.3 to 102.2 in January. The -2% decline was much better than the -5.2% fall during the first month of the delta outbreak in New South Wales, the -6.1% drop in Victoria's second wave in 2020, not to mention the epic -17.7% collapse in early 2020.
The 'economic conditions, next 12 months' sub-index dropped -9.6% from 104.9 to 94.8, a swing from "cautious optimism to cautious pessimism". 55% of respondents, an outright majority, expected mortgage interest rates to rise over the next 12 months. Unemployment Expectations Index increased by 8.2% to 112.7, marking a significant deterioration.
RBA would make a decision on the bond purchases program at the February 1 meeting. Westpac expects the central bank to choose to "scale back rather than full wind down, in response to the sudden emergence of Omicron. But that would depend on the upcoming employment and inflation data.
Gold Price Holds Uptrend Support Above $1,800
Key Highlights
- Gold price is showing positive signs above the $1,785 and $1,800 support levels.
- A major bullish trend line is forming with support near $1,805 on the 4-hours chart.
- EUR/USD trimmed gains after it failed to clear the 1.1480 zone.
- GBP/USD corrected gains below 1.3650 and 1.3620.
Gold Price Technical Analysis
After another rejection near $1,830, gold price corrected lower against the US Dollar. The price declined below $1,800, but the bulls were active near $1,785.
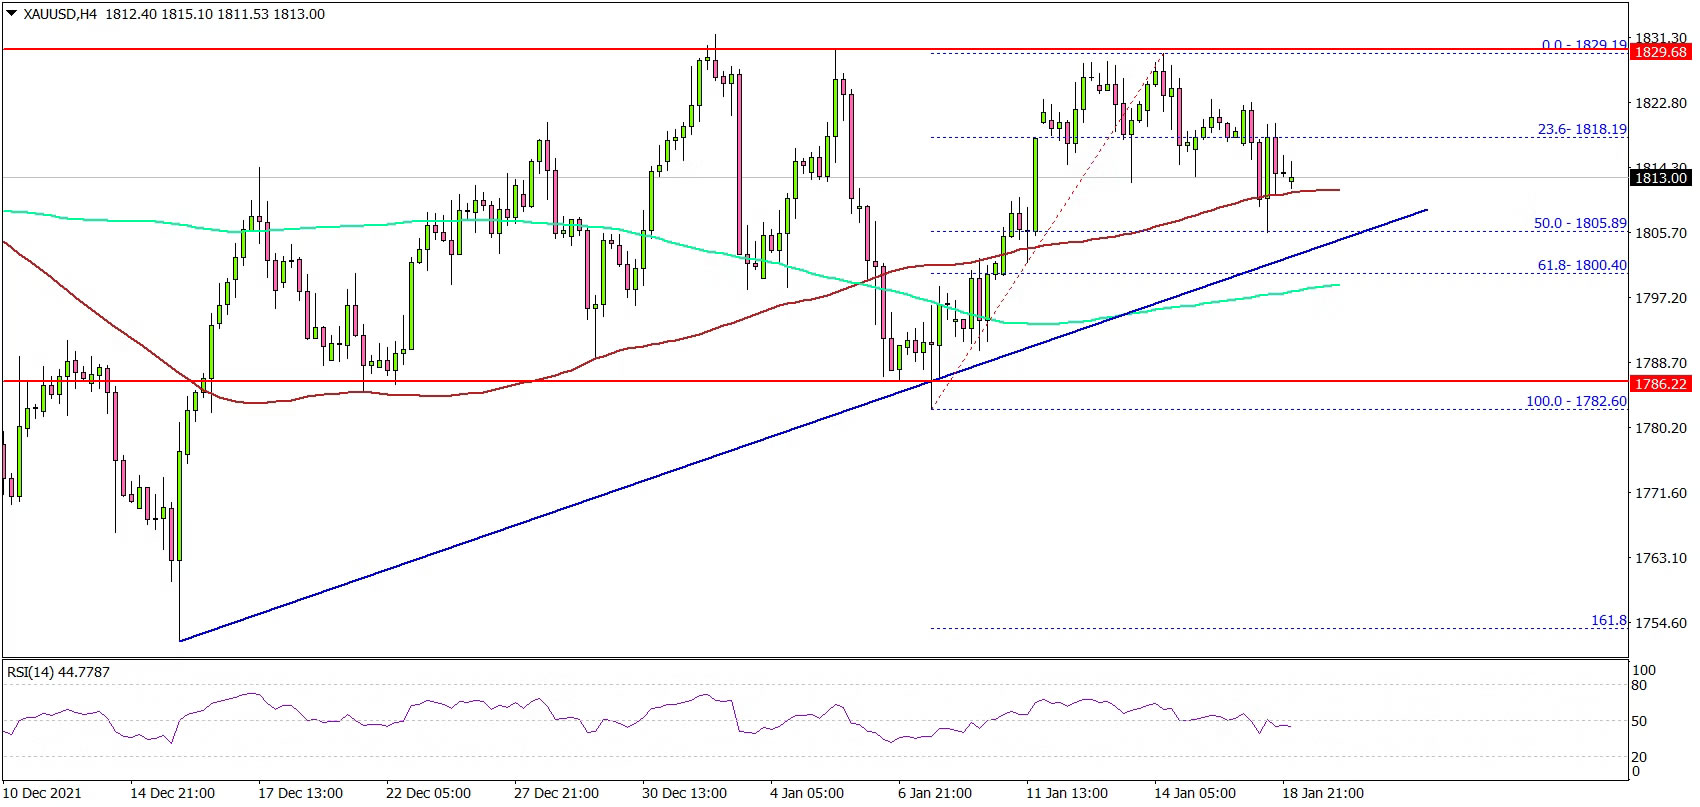
The 4-hours chart of XAU/USD indicates that the price traded as low as $1,782 before a fresh increase. The bulls again attempted an upside break above $1,830 but failed.
A high was formed near $1,829 and the price is now consolidating. On the downside, there is a key support forming near the $1,805 level. There is also a major bullish trend line forming with support near $1,805 on the same chart.
The main support is near $1,782, below which there is a risk of a move towards $1,760. Any more losses might send the price towards $1,750.
On the upside, the price is facing resistance near the $1,825 level. The main resistance is near the $1,830 level. A clear break above $1,830 could send the price toward the $1,850 resistance zone in the near term.
Looking at EUR/USD, the pair failed to clear the 1.1480 resistance zone and started a fresh decline below 1.1400. Similarly, GBP/USD trimmed gains and declined over 150 pips.
Economic Releases to Watch Today
- UK Consumer Price Index for Dec 2021 (YoY) – Forecast +5.2%, versus +5.1% previous.
- UK Core Consumer Price Index for Dec 2021 (YoY) – Forecast +3.9%, versus +4.0% previous.
- Canadian Consumer Price Index for Dec 2021 (MoM) – Forecast -0.1%, versus +0.2% previous.
- Canadian Consumer Price Index for Dec 2021 (YoY) – Forecast +4.8%, versus +4.7% previous.
US Stocks Drop But Not All Doom and Gloom
- Stocks drop, with GS down 8% on poor earnings
- US economic activity falls amid omicron and inflation
- M&A activity booms: Microsoft buys Activision
- WTI off best levels after hitting 7-year high
Following on the weaker performance in Europe, US markets fell sharply at the open. The Nasdaq was again leading the declines as yields rose and crude oil remained near 7-year high, keeping inflation worries supported. The drop of 8% for Goldman shares also weighed on the Dow, as it and other top US banks failed to live up to earnings expectations.
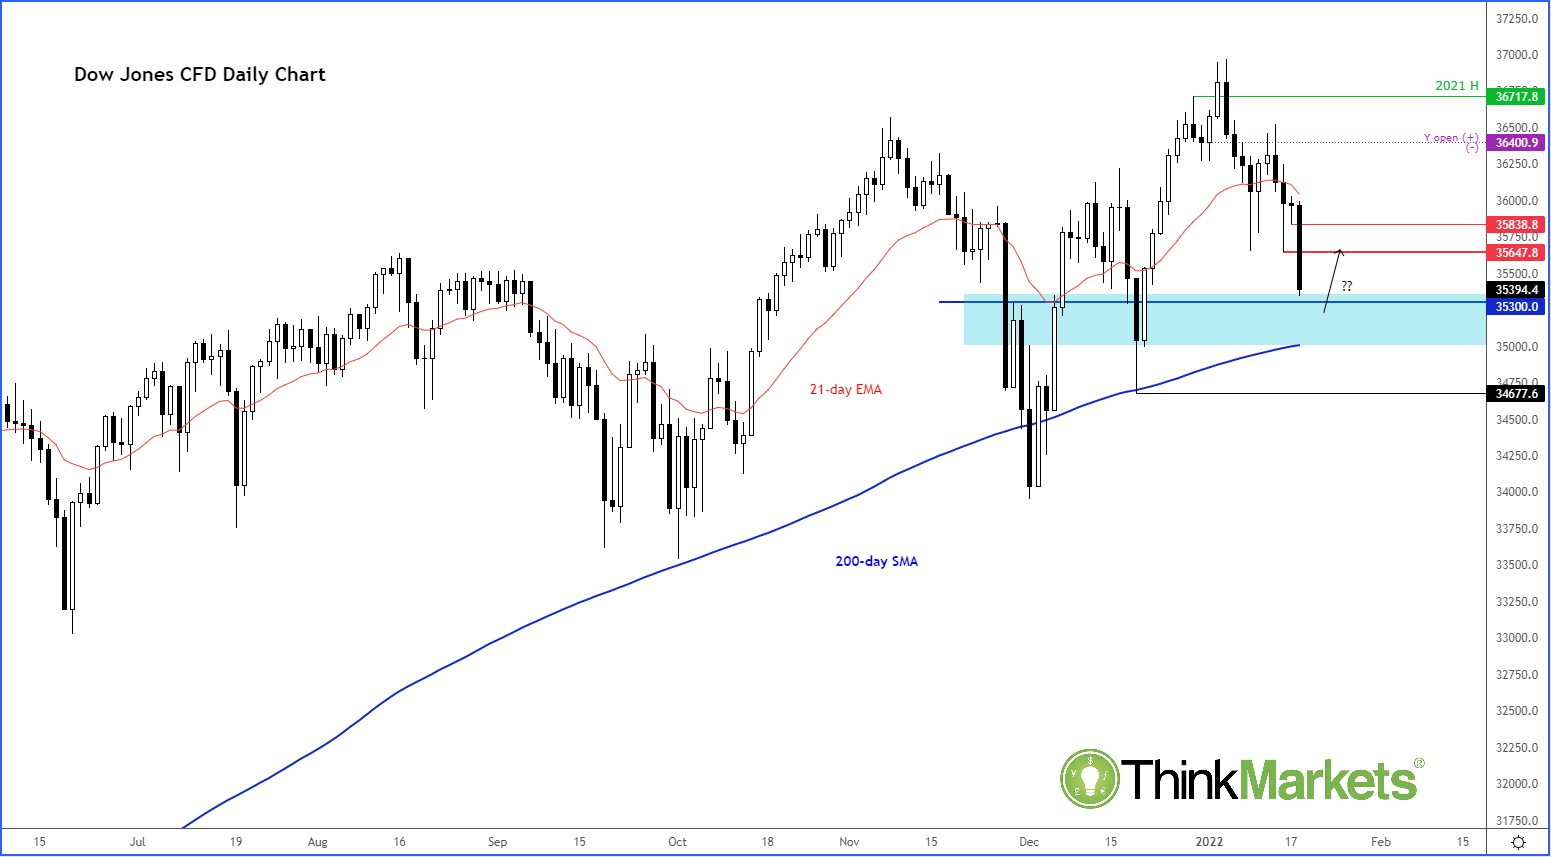
But it is not all doom and gloom out there, because M&A activity is going well, and the ongoing vaccination efforts by western governments means the soft patch in US and global data could be short-lived. Indeed, the UK government has indicated further easing of Covid measures as infections slow down. I continue to favour the attractiveness of European equities over the US, as a result.
We saw further evidence of the US economy slowing down, although it didn’t stop the dollar rally as yields refused to move lower with investors convinced it will not deter the Fed from tightening monetary policy aggressively. The latest sign of weakness came from the Empire State Manufacturing Index which showed a BIG miss: -0.7 vs. +25 expected, with all its sub-indices also disappointing. It has NOT been a good period for US data. We have also seen Retail Sales, Industrial production, University of Michigan Consumer Sentiment, Jobless Claims, and Non-Farm Payrolls all disappointing.
The soft US data clearly suggests economic recovery has slowed down, because of omicron while soaring inflation is also eating into consumers’ disposable incomes. Last week, we found out that consumer prices rose to their highest level since the 80s at a whopping 7.0%, while producer prices also remained near 10% year-over-year. But with WTI crude climbing to $86, gasoline prices should remain elevated and further underpin inflationary pressures and undermine disposable incomes.
On a micro level, Goldman Sachs shares dropped after disappointing with its quarterly results. Its earnings of $10.81 a share was short of $11.76 estimated as operating costs surged thanks to workers demanding higher wages because of surging inflationary pressures. But thanks to its investment banking and wealth management operations, the company saw its revenues rise to $12.64 billion compared to $12.08 expected. The earnings miss means GS has become the latest Wall Street giant to disappoint after JP Morgan and Citigroup produced poorly-received numbers on Friday.
But it is not all doom and gloom. M&A activity, which hit a record volume of more than $5 trillion in 2021, looks unlikely to slowdown. Microsoft announced today that it will buy Activision Blizzard, best known for popular games like “Call of Duty,” in a $68.7 billion deal. The easy availability of cheap financing and booming stock markets should keep deal making underpinned for as long as yields don’t rise too much.
Economic and earnings highlights coming up later in the week
Wednesday
- UK CPI and speech by BOE Governor Bailey
- Canadian CPI
- Earnings: Morgan Stanley, P&G, Alcoa, Just Eat
- Australia employment report
- US jobless claims, existing home sales and
- Philly Fed Manufacturing Index
- Earnings: Netflix, American Airline
Gold Traders Eyeing Economic Developments Around the World
Gold closed the previous week in positive territory, yet did not manage to break outside the sideways motion it has been trading in, for most of the past month. In the current week, Gold is marginally lower yet traders seem to remain excited as a sentiment for stabilization at higher grounds may be in the market’s focus. This report will present an overview of the key matters currently driving the Gold market, from our perspective. Our aim is to provide a brief but analytical presentation to traders, enabling them to trade the gold market successfully. Our closure will consist of Gold’s technical analysis, indicating important levels and possible trending scenarios.
At the moment the market’s concern turns the gloomy outlook for the first quarter of the current year. Some of the largest economies of the world like the US and China are still dealing with the spread of the omicron variant that is a great threat to consumer spending and business growth or investment. Yesterday, economic data from China indicated the Mainland’s yearly GDP rates for Q4 fell from previous 4.9% to 4.0%. Even though the figure remains comfortably high, the slowdown is significant and could be preparing the ground for what can follow in the first part of 2022. However, the most important development in China came unexpectedly on Monday when China’s central bank cut the borrowing costs of its medium-term loans by 10 basis points to 2.85% from 2.95% for the first time since April 2020. China’s unexpected rate cut tends to signal some uncertainty for its future growth. This can also be a confirmation that circumstances in the Chinese economy may have worsened recently leaving the central bank with no other option. Gold’s price received some support during the Asian session on Monday, possibly as a result of this development.
In the US, Inflationary pressures are still very strong and investors are possibly making adjustments to their strategy to cover for possible losses. In the previous week the US weekly CPI rate was just at 0.5%, while the yearly headline and Core rates ticked higher and reached 7.0% and 5.5% accordingly. Higher inflation tends to add demand for Gold as the metal can be used as a source for hedging risks arising from higher prices. Upon release of the news Gold gained but in a rather controlled manner. At the same time, in the US, market participants are expecting the Federal Reserve to enact interest rate hikes in the near future. Rate hikes are a broad expectation of the market due to the fact that this tool can help counter the inflation pressures that are worrying at the moment. Yet if the market receives further information and was to price in a rate hike by the Fed anytime soon, then we expect Gold traders to take substantial action placing orders. Yet we expect Gold’s unpredictable nature to be more prone to developments on the pandemic at this stage.
As our final part of the fundamental analysis we note the upcoming US financial releases that can possibly move Gold’s price in the following days. On the 19th of January we get the US Housing Starts Number for December, while on the 20th we get the US Philly Fed Business Index for January, the weekly initial Jobless claims figure and the Existing Home Sales figure for December. In the next week on Monday the 24th we get the very important Flash Markit Manufacturing and Services figures for January. Finally, on the 25th we get the US Consumer Confidence figure for January.
Technical Analysis
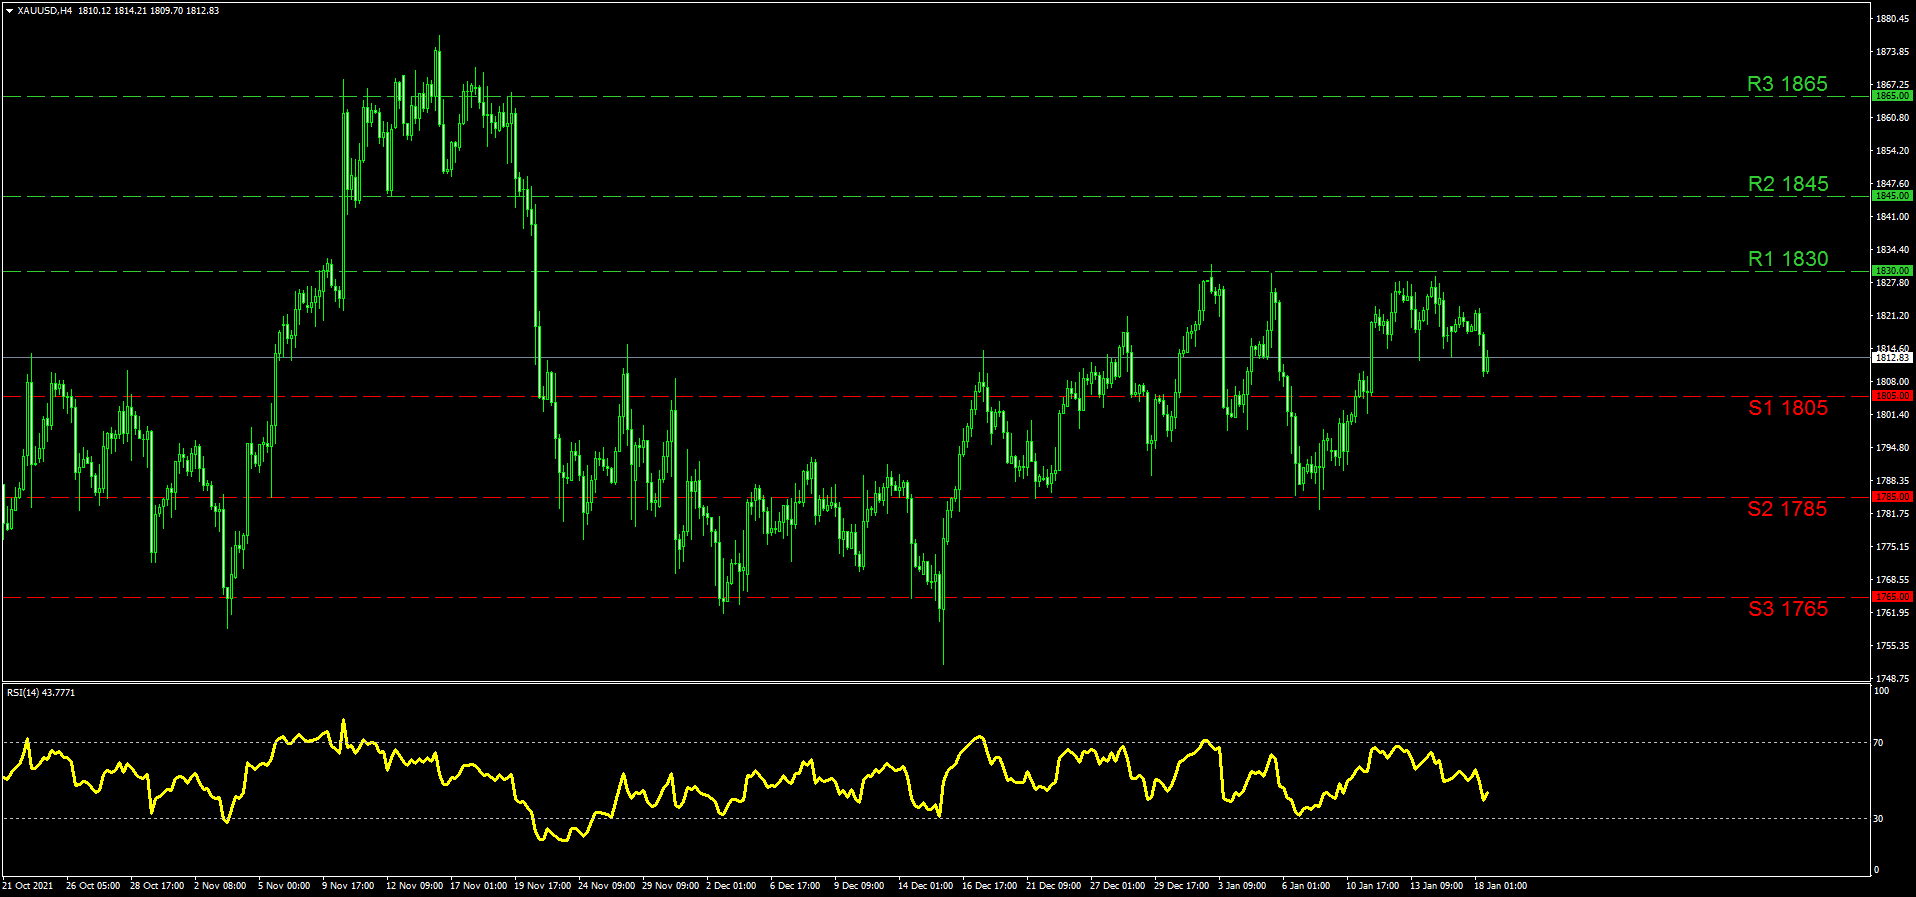
Gold continues to move in a wide sideways motion between the (R1) 1830 resistance and the (S2) 1785 support level. These levels have both been tested but not breached in January making them important for traders to keep in mind. The top, the (R1) has been tested clearly two times in January and was closely approached a third time on the 14th, making it a crucial barometer for Gold’s price further appreciation. If the price action does break above the (R1) then the (R2) 1845 level can be tested first. Our highest resistance line is noted at the (R3) 1865 level that was used as a high back in November. In the opposite direction, if a selling interest arises we could see Gold moving closer to the (S1) 1805 support level that was used previously as a resistance. The price action, has risen above and submerged below the (S1) various time since December thus traders may have to use it with alertness due to the fact that it may be ignored occasionally. Lower, as we noted stands the very distinguished (S2) 1785 level which has not been breached to the downside for more than a month. At the end we keep the (S3) 1765 line as our lowest support and can be used as a pending order or a target in an extensive selling strategy. The RSI indicator remains above 30 for the time being confirming the bearish tendencies in the short-term. Overall we tend to maintain a sideways bias yet a break above the (R1) could signal bullish tendencies for Gold while a move below the (S1) could invite bearish ones.
Brent Will Reach $95
What is happening?
The global energy crisis spreads around the globe. At the end of December, XBR/USD exceeded $80 per barrel for the first time since November, and in January, it even exceeded $85, also for the first time since November. On Friday, January 14, the price has reached $86, the highest point since October 2018.
Reasons for XBR/USD growth
It becomes evident that the possibility of additional supply of oil on the market in the short term may be less than previously thought due to significant underinvestment in the sector over the past six years.
At the end of last year, Russian oil companies stated that they were operating at the limit of their production. Moreover, OPEC + potential for production increase could be much less than the 4 million barrels per day growth planned in 2022.
According to the International Energy Agency data, the current shortage of supply in the oil market is 3 million barrels per day, and the expected growth in demand this year is 3.4 million barrels per day.
The second factor is that the Omicron strain is much milder despite being more contagious and may not lead to severe and long-term lockdowns.
According to these facts, there is a high probability that the deficit will remain in the short term.
Technical analysis
XBR/USD daily chart
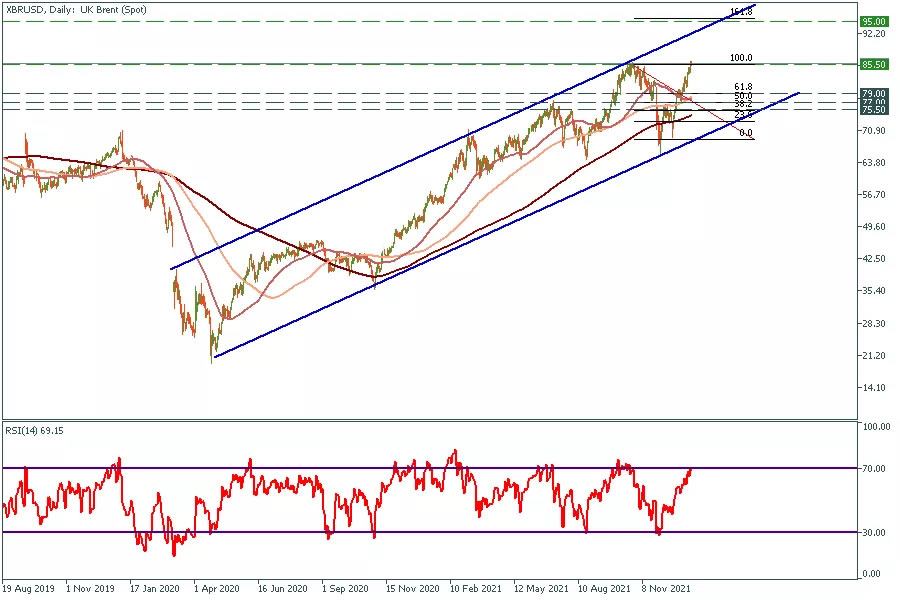
XBR/USD has been moving in the ascending channel since March 2020. At the moment, it is a moment of truth for XBR/USD. If the price manages to hold above $85.5 for at least two days, it will reach the channel's upper border at $95, which is 161.8 Fibonacci level, without any resistance.
Otherwise, the price might head towards the bottom border of the channel. In this case, targets will be at $79, $77, and $75.5, which are 61.8, 50.0, 38.2 Fibonacci levels, respectively.
Gold Struggling to Withstand Market Pressure
Gold is trading near $1819 an ounce, unable to take advantage of a spike in geopolitical risks due to an environment of rising interest rates. Two-year US government bond yields have reached 1.06%, pre-pandemic levels.
Rising yields on expectations of a sharp Fed key rate hike this year (compared to the previous tightening cycle) are putting pressure on the stock market, where Nasdaq futures are losing 1.3% since the start of the day and 9% from their late November peak.
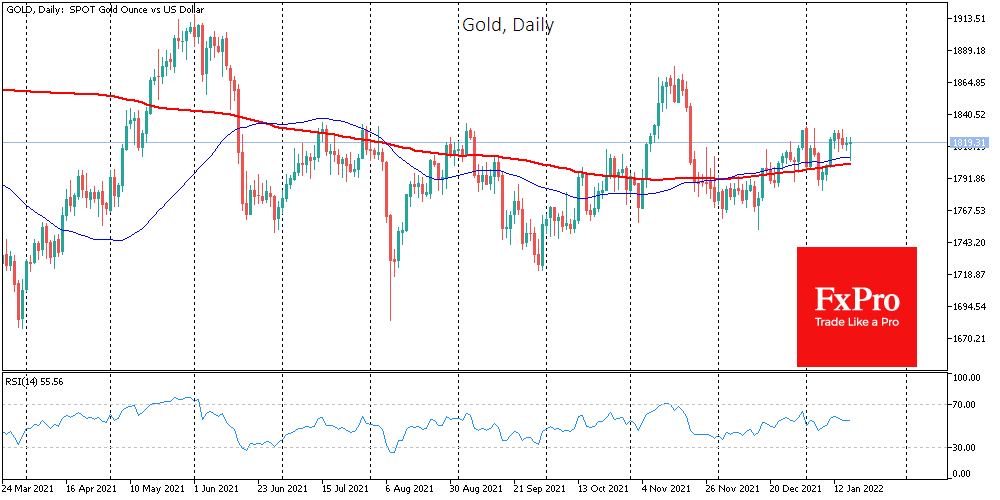
The debt market’s continued reassessment of the outlook for monetary policy is a serious threat to gold. Its price is now above the 50- and 200-day moving averages, reflecting the strength of buyers in previous months.
We have also previously noted a sequence of increasingly higher local lows. But as the market enters higher levels of volatility, previous local support levels might not hold.
While in previous days we could see gold strengthening along with growth stocks falling, there are now increasing signs that the sell-off in the markets is taking on a global nature, affecting almost all asset classes. In this environment, a break of the upward support line (now around $1800) can only further increase the volatility of gold prices. Further sell-offs in equities could send gold to retest the $1760-1770 area before the end of the week. If it fails as well, we could see a very quick dip towards $1730 or even $1680.
Where is Bitcoin’s bottom?
The cryptocurrency market lost 2% of its capitalisation in the past day to $2.0trn. Buyers stepped up in the market between 8-11 January, soon after a dip to this round level. But as we can see, the bulls’ strength was not prolonged enough.
The Crypto Fear and Greed Index added 2 points to 24. The 18th of November was the last time we saw levels above 50. Since then, the cryptocurrency market has been steadily in a downtrend, with the overall crypto market capitalisation down 30%.
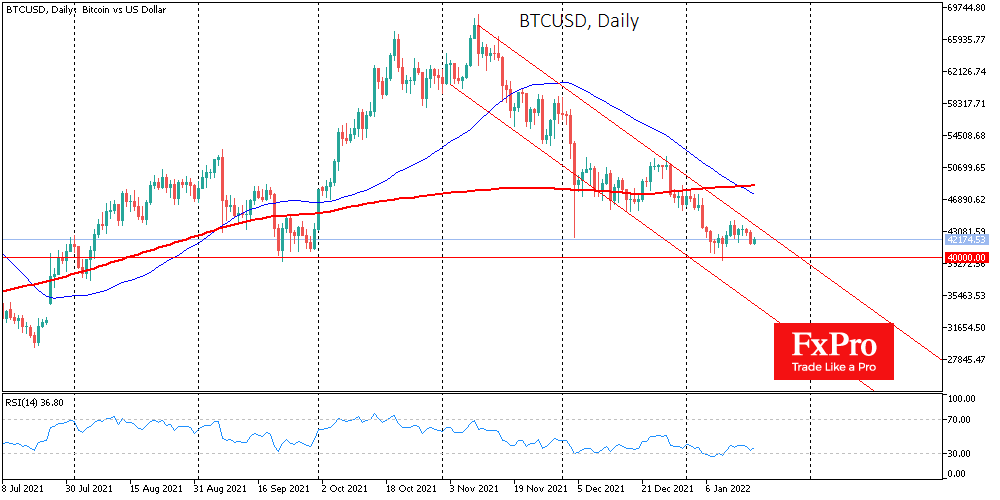
Bitcoin is losing 2% overnight, retreating to the $42K mark, returning to an area of local lows before last week’s rebound. Wariness prevails in traditional financial markets on Tuesday morning, so a fall under $42K could quickly turn into a test of the $40K level.
The bitcoin chart is increasingly clearly showing a downward reversal with a continuation within the three-month down channel. The RSI index on the daily charts remains in neutral territory, meaning there is still room for a decline. The 50-day moving average is deeper under the 200-day moving average, indicating that the pair is in a bearish trend.
Ether pulled back to $3180 from the region of $3500, and it is sinking under the bears’ pressure.
The methodical selloffs are exhausting market participants, where the feedback loop is solid: price increases spur purchases, pushing prices up even more. Downturns or a prolonged period of sideways trading causes disappointment and waning interest. After all, many people come to cryptocurrencies looking for a quick buck. They are willing to take high risks, but the lack of momentum dampens the excitement. After rapid growth in 2020 and 2021, we should not be surprised to see the market cool down.
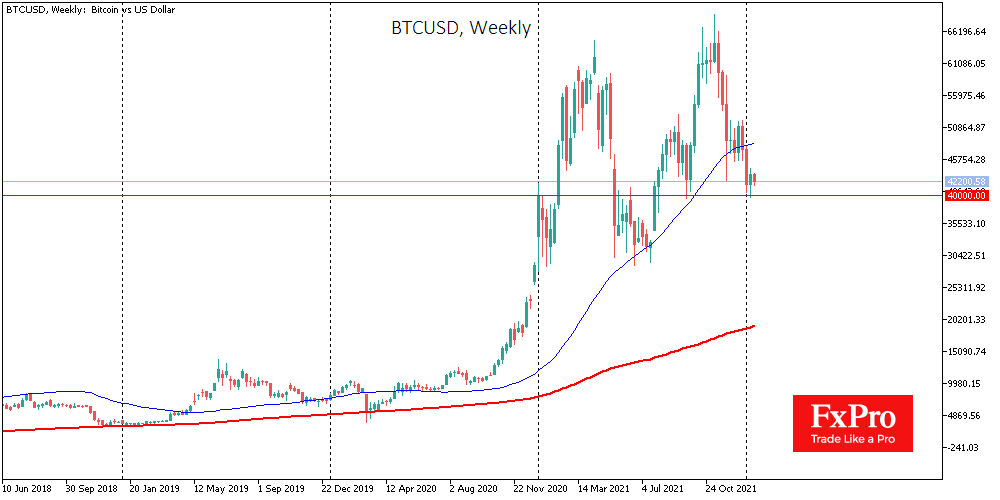
The long-term weekly candlestick chart of Bitcoin shows that over the past seven years, support turns the market around, even during a depression, it passes through the 200-week moving average. This line is now near 19k, and by the end of the year, it will be slightly above 20K.
A bear market development for cryptocurrencies could push Bitcoin back to 20 before the end of 2022 in a pessimistic scenario. These levels could be the best prices to buy, although experience suggests it could take another year of sluggish growth before seeing a new powerful uptrend and FOMO.
EURUSD Wave Analysis
- EURUSD reversed from resistance level 1.1470
- Likely to fall to support level 1.13
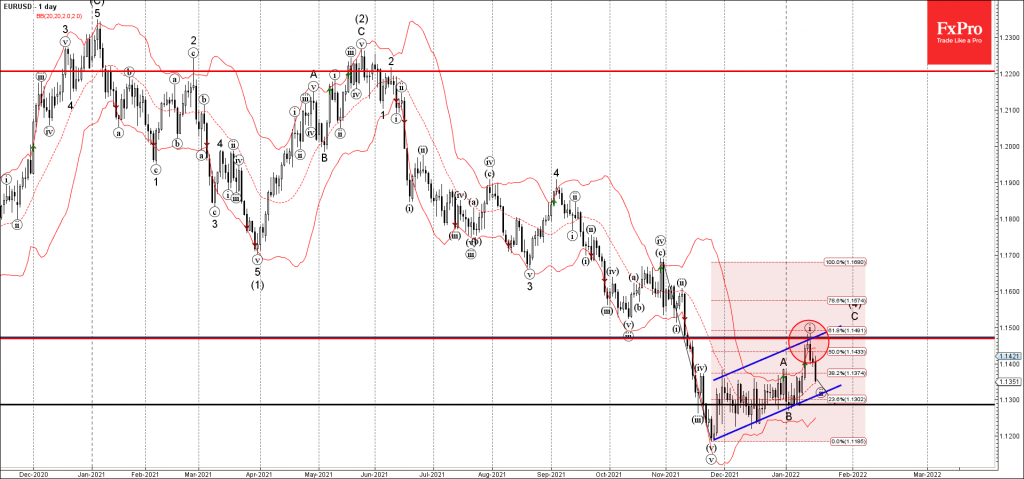
EURUSD currency pair recently reversed down from the resistance level 1.1470, intersecting with the upper daily Bollinger Band and the daily up channel from November.
The downward reversal from the resistance level 1.1470 is aligned with the clear daily downtrend.
EURUSD currency pair can be expected to fall further toward the next support level 1.13 (which has been reversing the pair from the end of December).