

Sample Category Title
EUR/CHF Daily Outlook
Daily Pivots: (S1) 1.0368; (P) 1.0403; (R1) 1.0426; More....
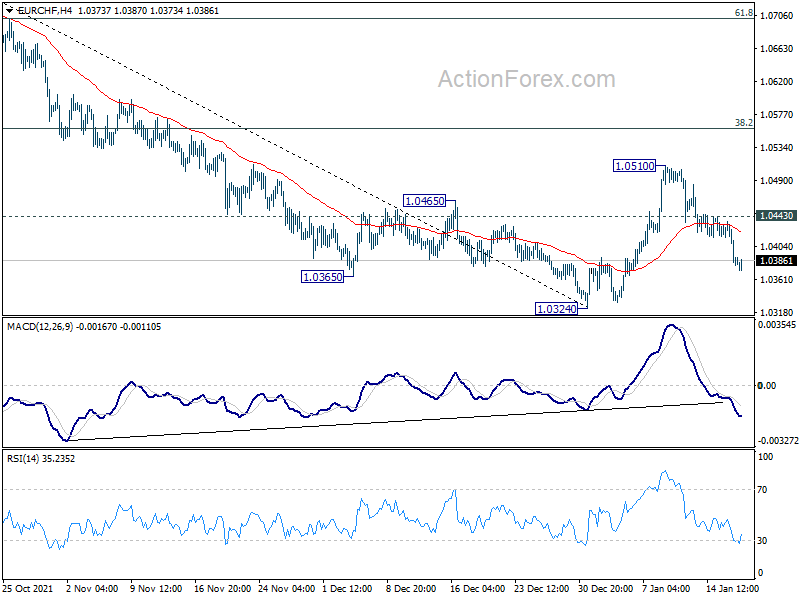
Intraday bias in EUR/CHF is back on the downside for 1.0324 low, as corrective rebound from there should have completed at 1.0510. Firm break of 1.0324 will resume larger down trend from 1.1149, and target 161.8% projection of 1.1149 to 1.0694 from 1.0936 at 1.0200 next. On the upside, above 1.0443 minor resistance will extend the corrective pattern with another rise leg. But upside should be limited by 38.2% retracement of 1.0936 to 1.0324 at 1.0558.
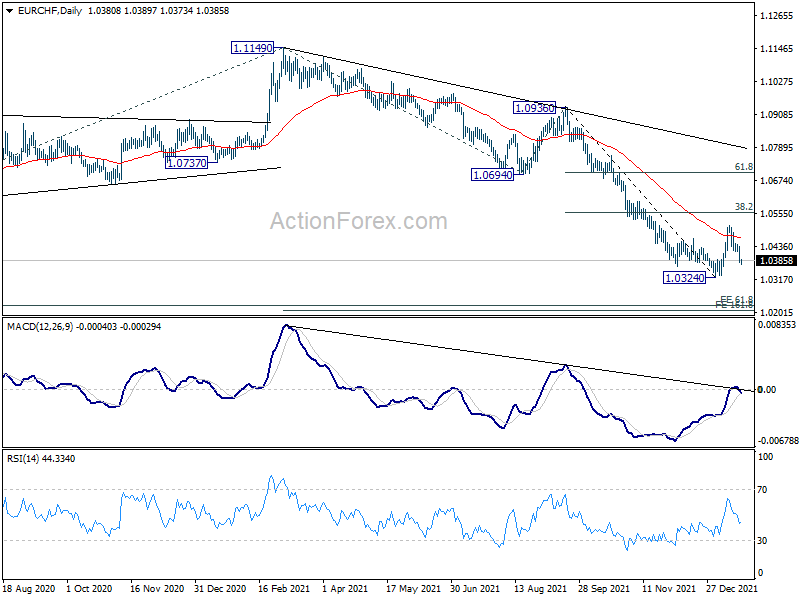
In the bigger picture, long term down trend from 1.2004 (2018 high) is now extending. Next target is 61.8% projection of 1.2004 to 1.0505 to 1.1149 at 1.0223. On the upside, firm break of 1.0505 support turned resistance is needed to be the first sign of medium term bottoming. Otherwise, outlook will remain bearish even in case of rebound.
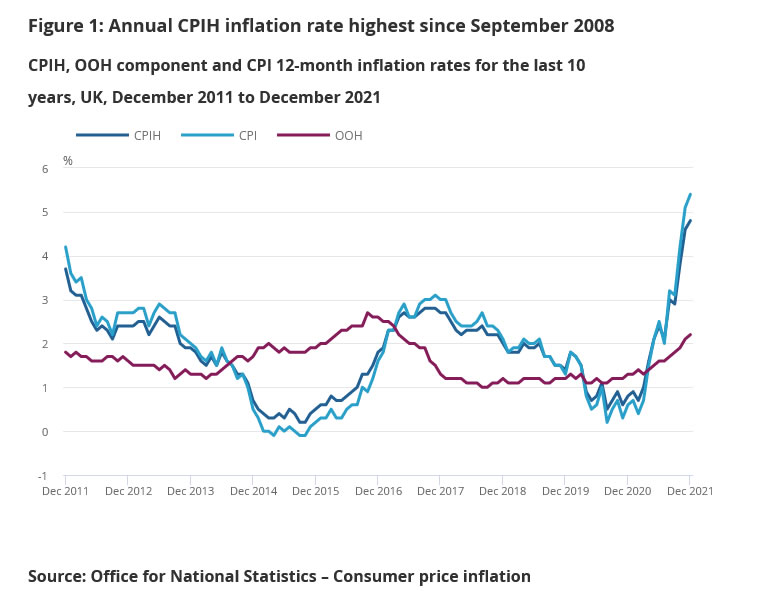
UK CPI accelerated to 5.4% yoy in Dec, core CPI rose to 4.2% yoy
UK CPI accelerated to 5.4% yoy in December, up from 5.1%, above expectation of 5.2% yoy. This is the highest reading since record began in 1997. CPI core rose to 4.2% yoy, up from 4.0% yoy, above expectation of 4.0% yoy.
Also released, PPI input came in at -0.2% mom, 13.5% yoy, versus expectation of 0.7% mom, 13.7% yoy. PPI output was at 0.3% mom, 0.6% yoy, versus expectation of 0.6% mom, 9.4% yoy. PPI output core was at 0.5% mom, 8.7% yoy, versus expectation of 0.8% mom, 8.6% yoy.
Technical Outlook and Review
DXY:
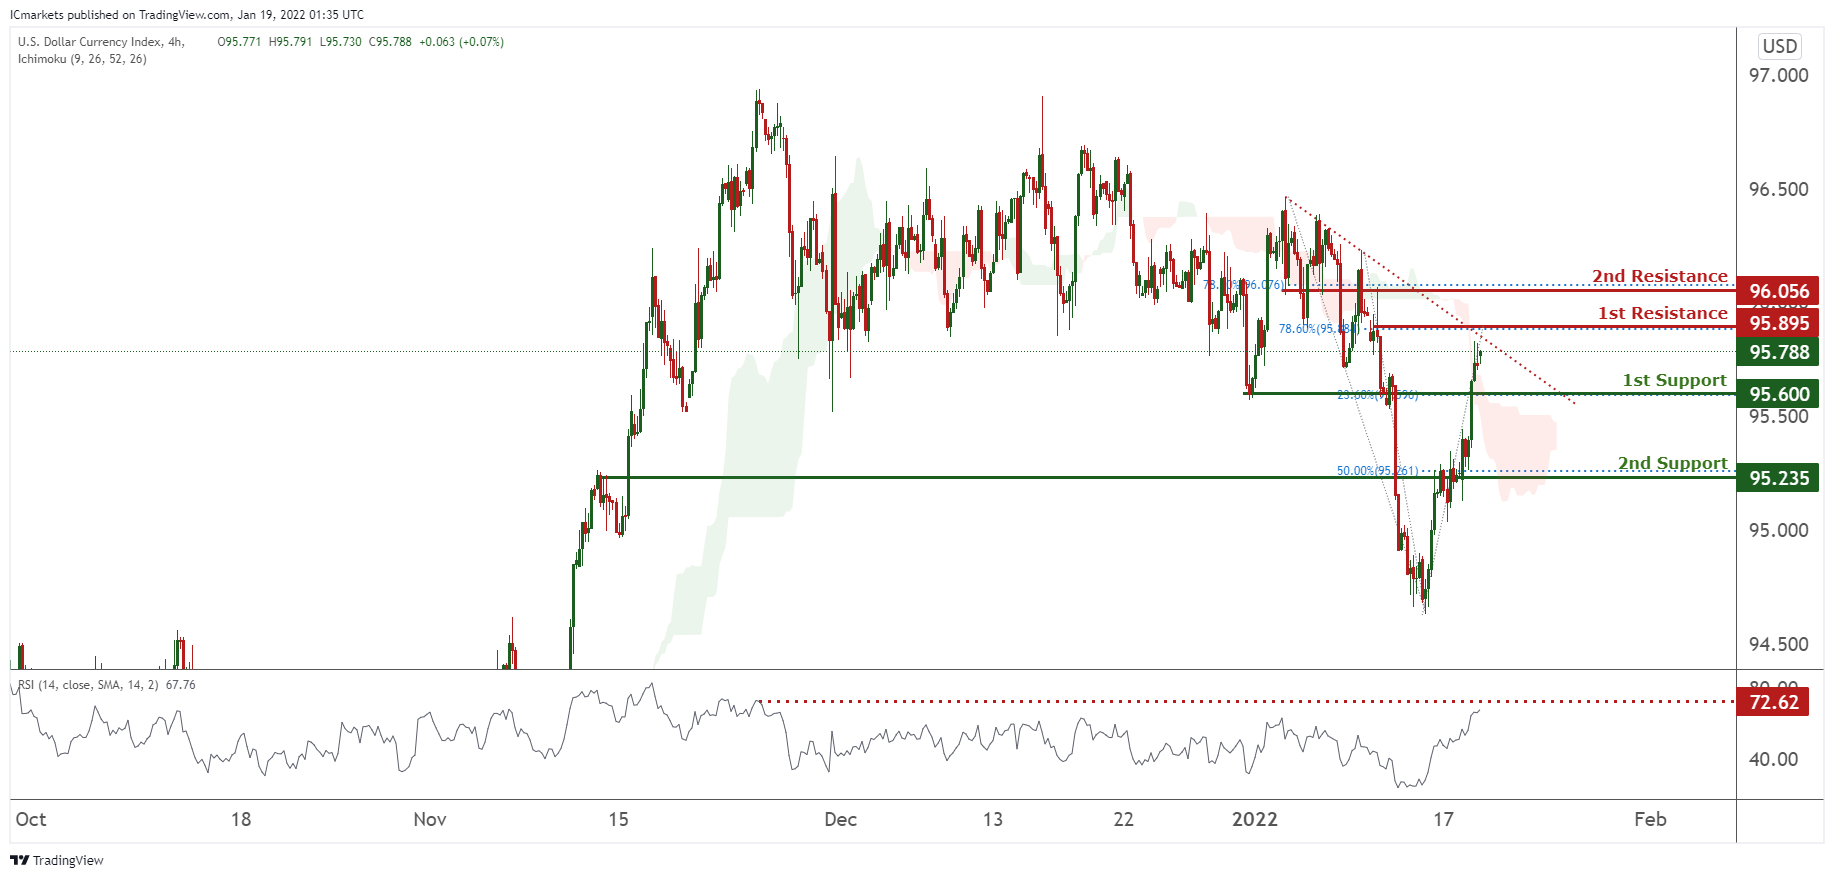
On the H4 timeframe, prices are abiding to a bearish trendline and are on bearish momentum. We expect a dip from our 1st resistance at 95.895 towards our 1st support at 95.6 in line with 23.6% Fibonacci retracement. RSI is at levels where dips previously occurred and ichimoku clouds are further supporting our bearish bias.
Areas of consideration:
- H4 time frame, 1st resistance at 95.895
- H4 time frame, 1st support at 95.6
XAU/USD (GOLD):
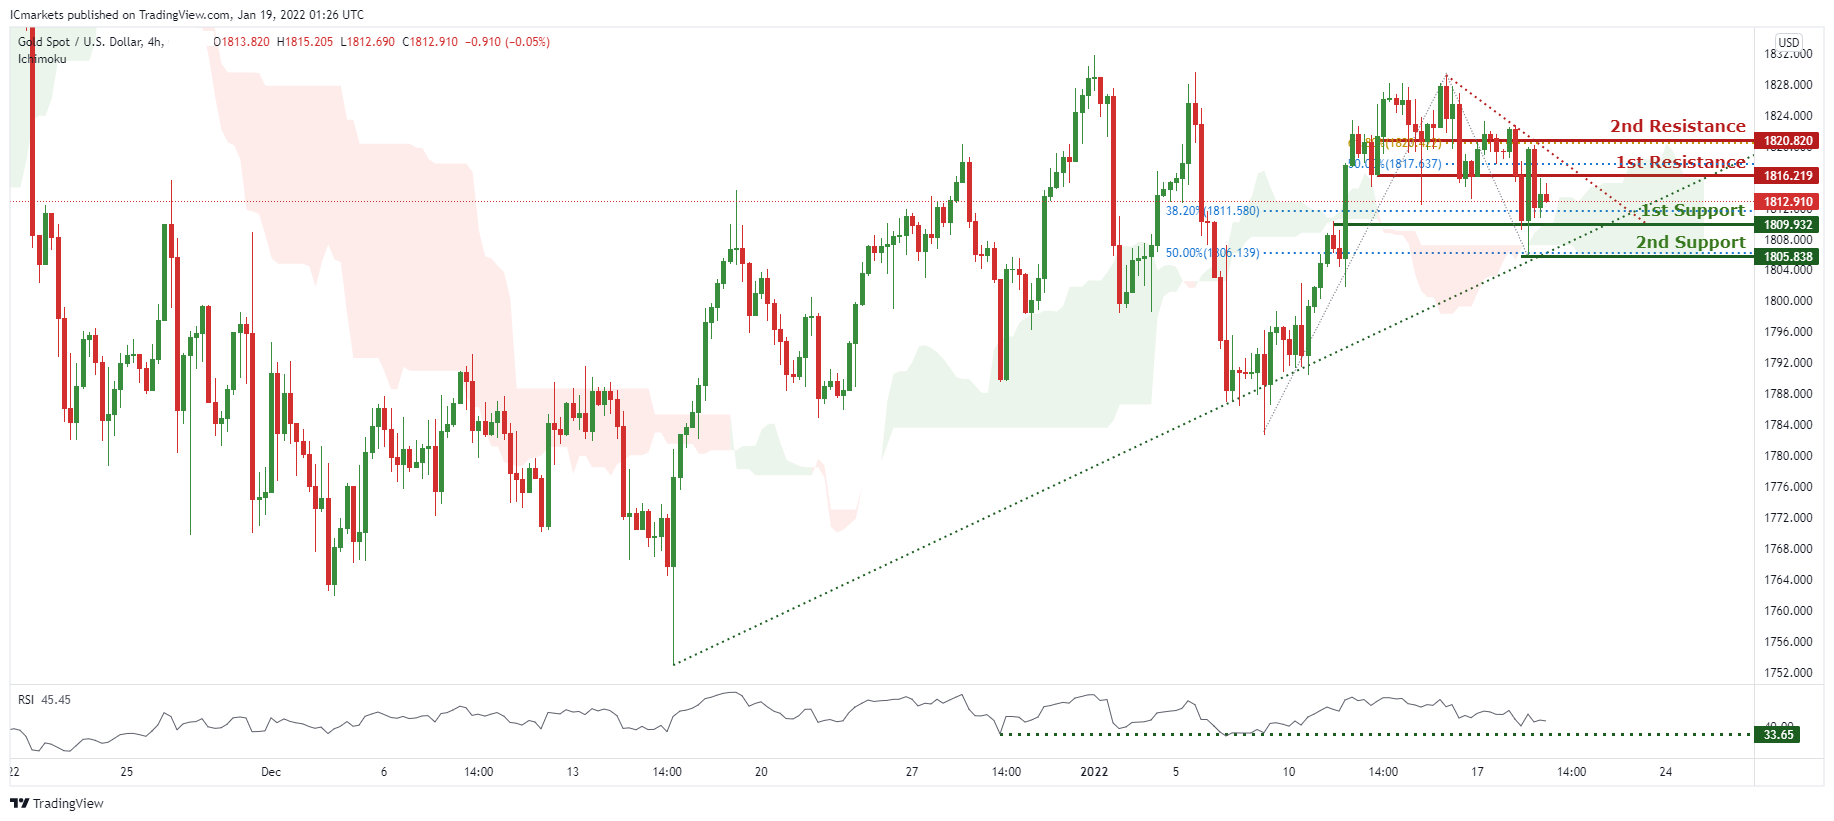
On the H4, prices are consolidating in a triangle. We see the potential for a bounce from our 1st support at 1809.932 in line with 38.2% Fibonacci retracement towards our 1st resistance at 1816.219 in line with 50% Fibonacci retracement. Prices are trading above ichimoku clouds and RSI are at levels where bounces occurred previously, further supporting our bullish bias.
Areas of consideration:
- 4h 1st support at 1809.932
- 4h 1st resistance at 1805.838
GBP/USD
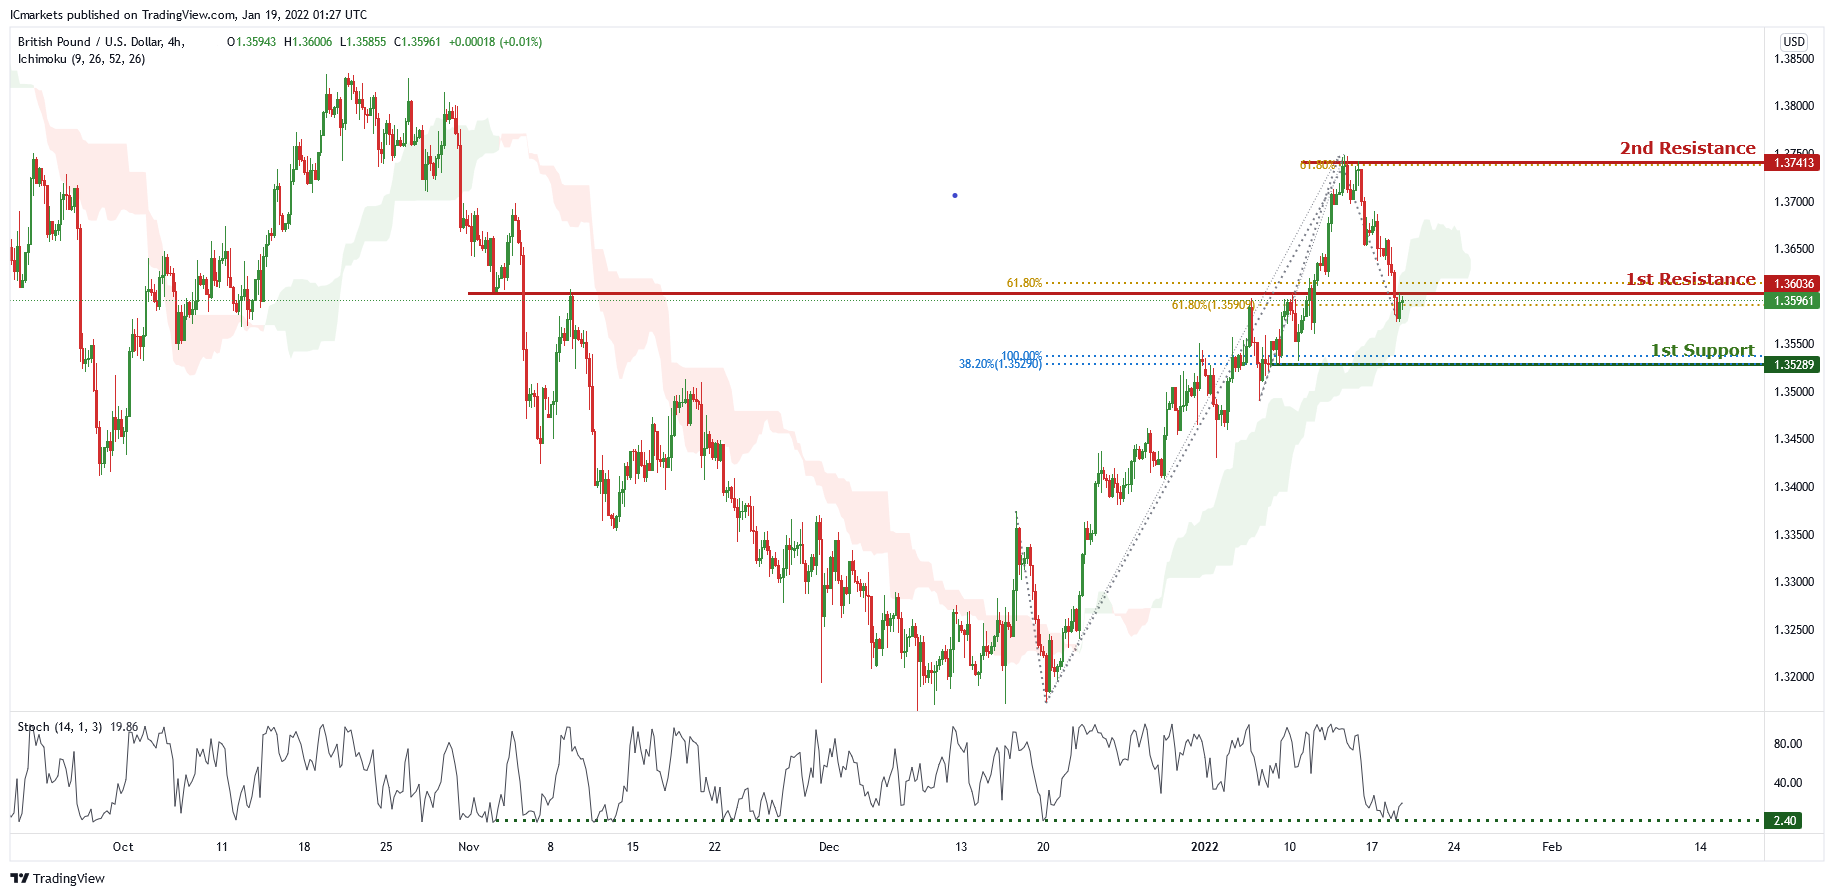
On the H4 chart, price is near 1st resistance level of 1.36036 which is also 61.8% Fibonacci retracement and 61.8% Fibonacci projection. Price can potentially go to the 2nd resistance level of 1.37413 which is also 61.8% Fibonacci projection and graphical swing high level. Our bullish bias is supported by the stochastic indicator as it is near support level.
Areas of consideration
- 1st resistance at 1.36036
- 1st support at 1.35289
USD/CHF
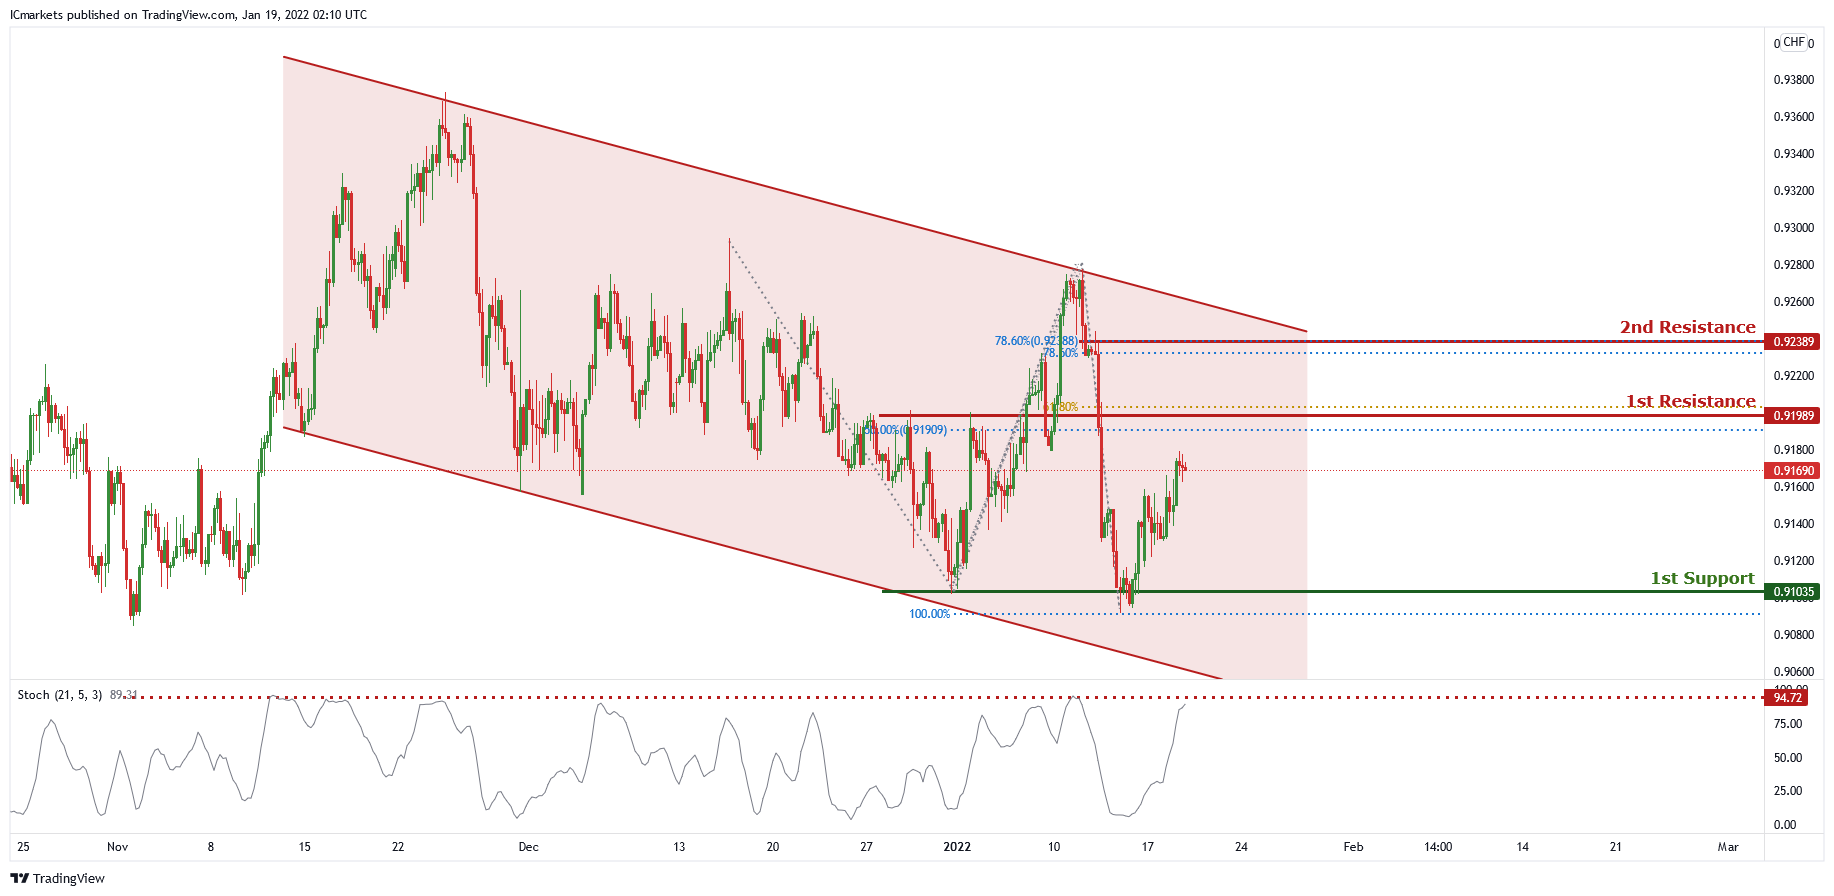
On the H4 timeframe, price is abiding to a descending channel, signifying a bearish momentum. Price is approaching the 1st resistance level of 0.91989, we can expect price to make a short-term bearish drop to the 1st support level of 9.91035 which is in line with our 100% Fibonacci projection and graphical swing low. Our bearish bias is supported by the stochastic indicator as it is at resistance level.
Areas of consideration:
- Watch 1st Support at 0.91035
- Watch 1st Resistance at 0.91989
EUR/USD :
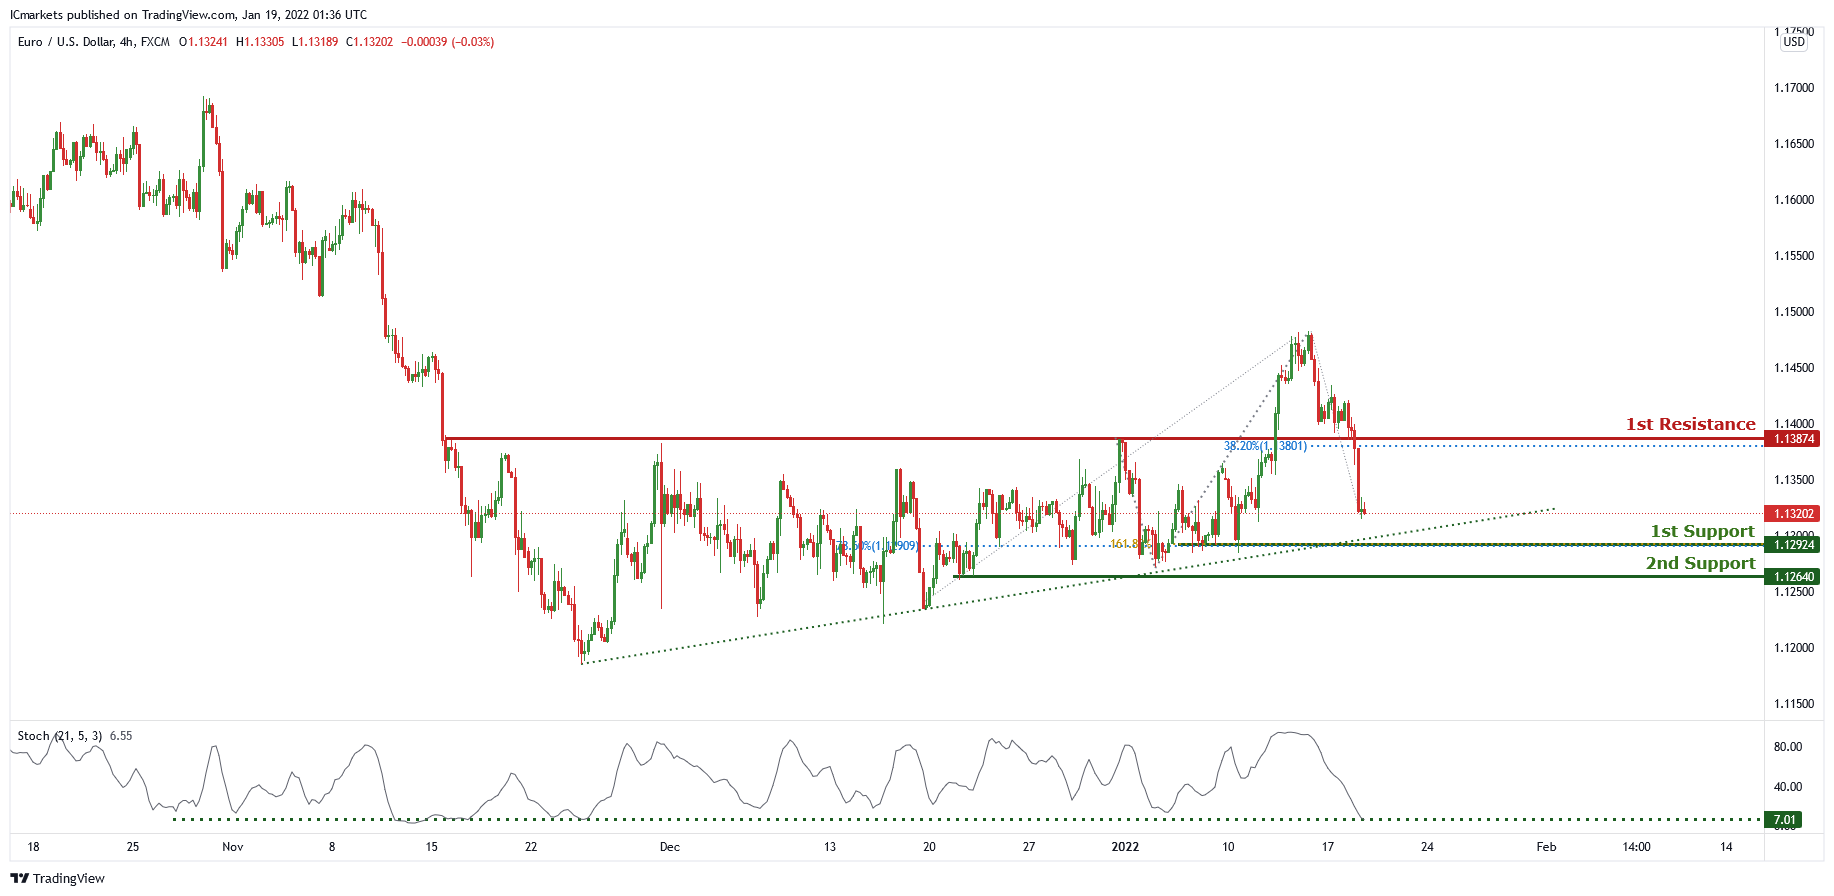
On the H4 chart , price is abiding by an ascending trendline and is near 1st support level of 1.12924 which is also 78.6% Fibonacci retracement and 161.8% Fibonacci projection. Price can potentially go to the 1st resistance level of 1.13874 which is also 38.2% Fibonacci retracement. Our bullish bias is supported by the stochastic indicator as it is at support level
Areas of consideration:
- H4 1st resistance at 1.13874
- H4 1st support at 1.12924
USD/JPY
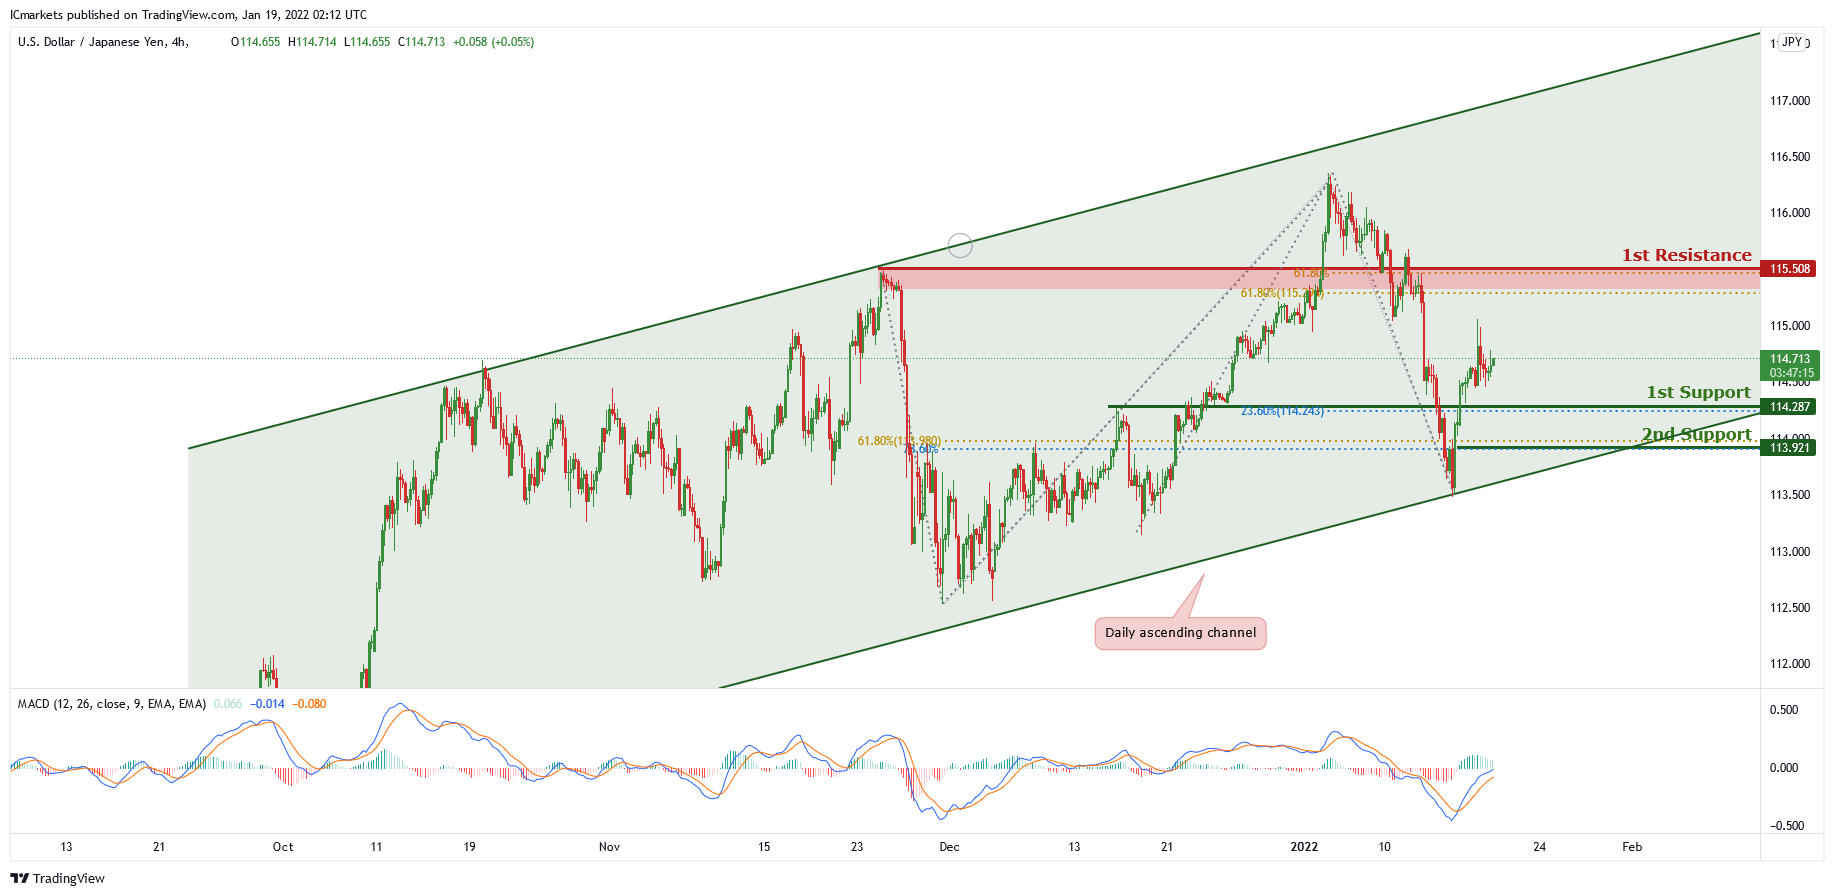
On the H4 timeframe, is abiding to the ascending channel on the daily, signifying an overall bullish momentum. We can now expect price to push higher from 1st Support in line with 23.6% Fibonacci retracement and graphical overlap support towards 1st Resistance in line with 61.8% Fibonacci projection and 61.8% Fibonacci retracement. Our bullish bias is further supported by the MACD indicator where the MACD line crossed above the signal line and both lines are in the oversold area.
Areas of consideration:
- H4 1st resistance level 115.508
- H4 1st support level 114.287
AUD/USD:
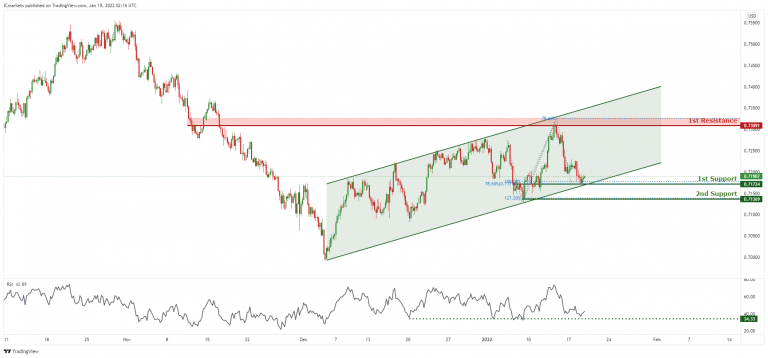
In reference to last week’s analysis, price indeed dropped to 1st Support @ 0.72023. On the H4, price is reacting within the ascending channel, signifying an overall bullish momentum. Price is approaching the 1st Support, we can expect to see price make a bullish bounce from 1st Support in line with 100% Fibonacci projection, 78.6% Fibonacci retracement and ascending channel support towards 1st Resistance in line with previous swing high and 78.6% Fibonacci projection. Our short-term bearish bias is further supported by the RSI indicator where it is approaching the support level.
Areas of consideration:
- H4 1st Support level 0.71724
- H4 1st resistance level 0.73091
NZD/USD:
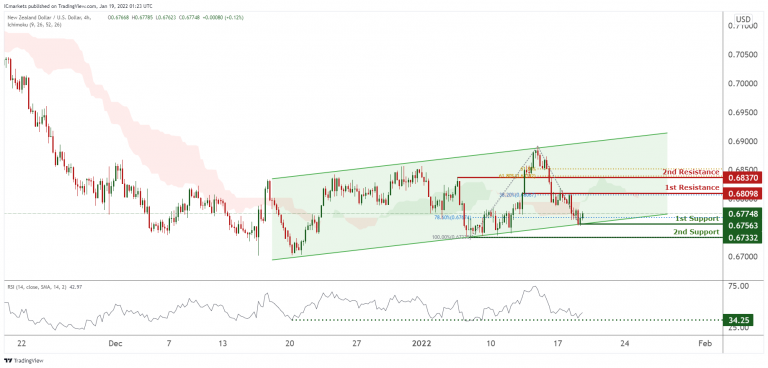
On the H4, prices are consolidating in an ascending channel and on bullish momentum. We see the potential for a bounce from our 1st support at 0.67563 towards our 1st resistance at 0.68098 in line with 38.2% Fibonacci retracement. RSI is at levels where bounces occurred previously, further supporting our bullish bias.
Areas of consideration:
- H4 time frame, 1st resistance at 0.68098
- H4 time frame, 1st support at 0.67563
USD/CAD:
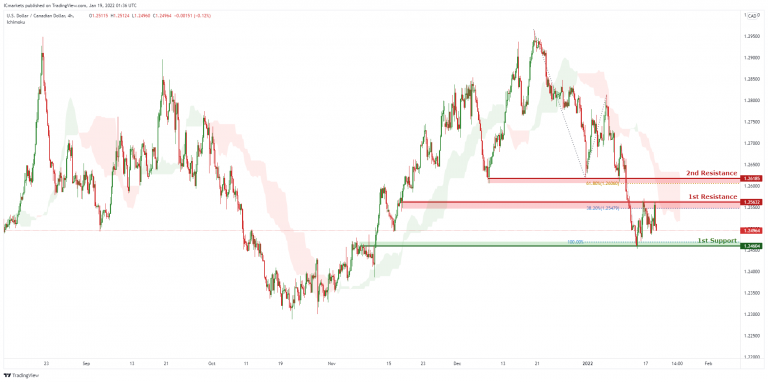
On the H4, with price moving below the ichimoku cloud, we have a bearish bias that price will from from our 1st resistance at 1.25632 which is in line with horizontal overlap resistance and 38.2% Fibonacci retracement to 1st support at 1.24604, which is in line with horizontal overlap support and 100% Fibonacci projection level. Alternatively, price may break 1st resistance structure and head for 2nd resistance at 1.26185, which coincides with horizontal overlap resistance and 61.8% Fibonacci retracement.
Areas of consideration:
- H4 time frame, 1st support at 1.24604
- H4 time frame, 1st resistance at 1.25479
OIL:
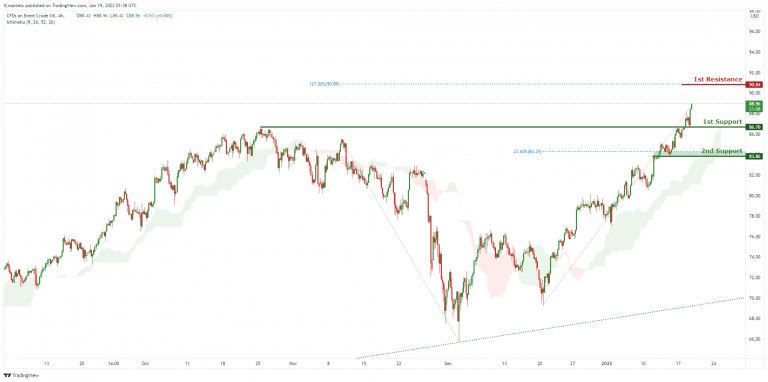
On the H4, with price moving above the ichimoku cloud, we have a bullish bias that price will rise to our 1st resistance at 90.84 which is in line with horizontal swing high resistance and 127.2% Fibonacci extension level from 1st support at 86.7, which is in line with horizontal overlap support. Alternatively, price may break 1st support structure and head for 2nd support at 83.86, which coincides with horizontal overlap support and 23.6% Fibonacci retracement.
Areas of consideration:
- H4 time frame, 1st resistance of 90.84
- H4 time frame, 1st support of 86.7
Dow Jones Industrial Average:
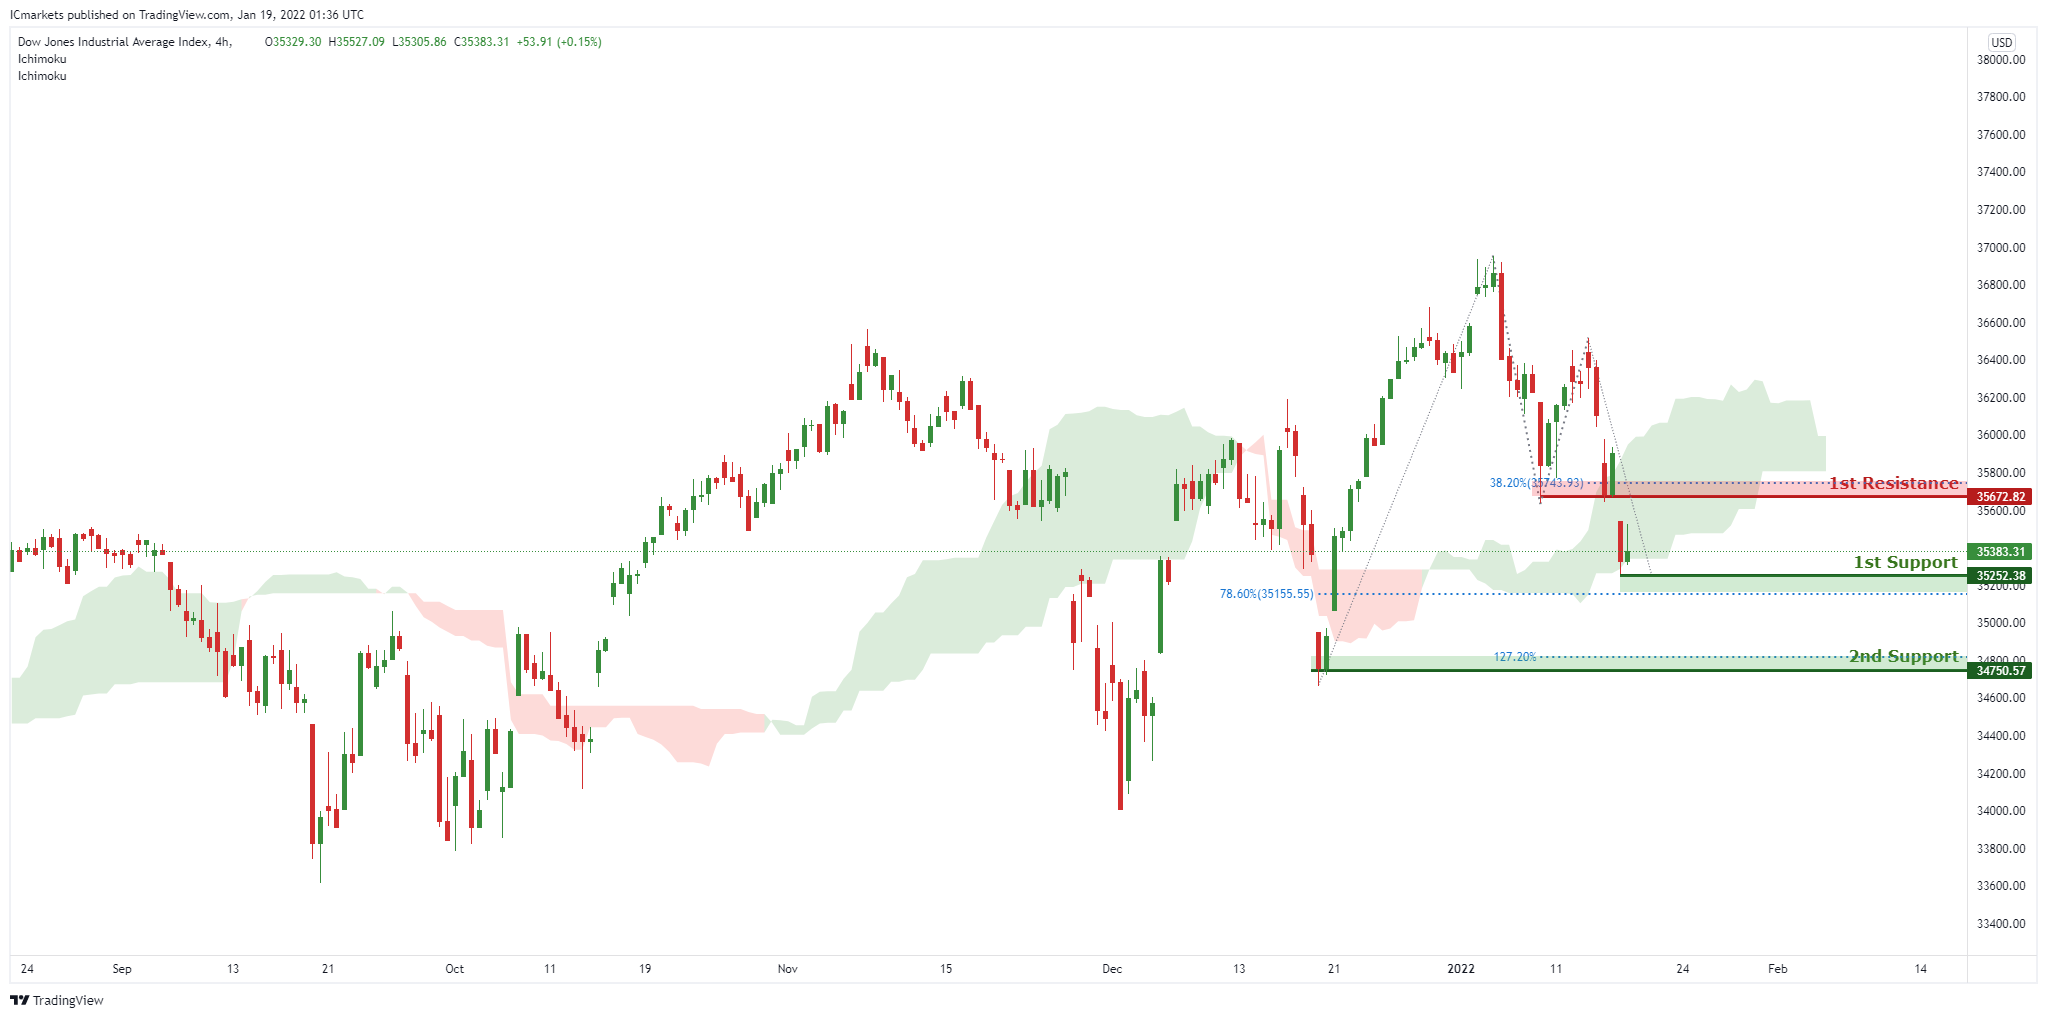
On the H4, with price approaching the support of the ichimoku cloud, we have a bullish bias that price will rise to our 1st resistance at 35672 which is in line with horizontal overlap resistance and 38.2% Fibonacci retracement level from 1st support at 35252, which is in line with horizontal swing low support and 78.6% Fibonacci retracement level. Alternatively, price may break 1st support structure and head for 2nd support at 34750, which coincides with horizontal swing low support level and 127.2% Fibonacci extension.
Areas of consideration:
- H4 time frame, 1st resistance of 35672
- H4 time frame, 1st support of 35252
AUD/USD Daily Report
Daily Pivots: (S1) 0.7161; (P) 0.7195; (R1) 0.7219; More...
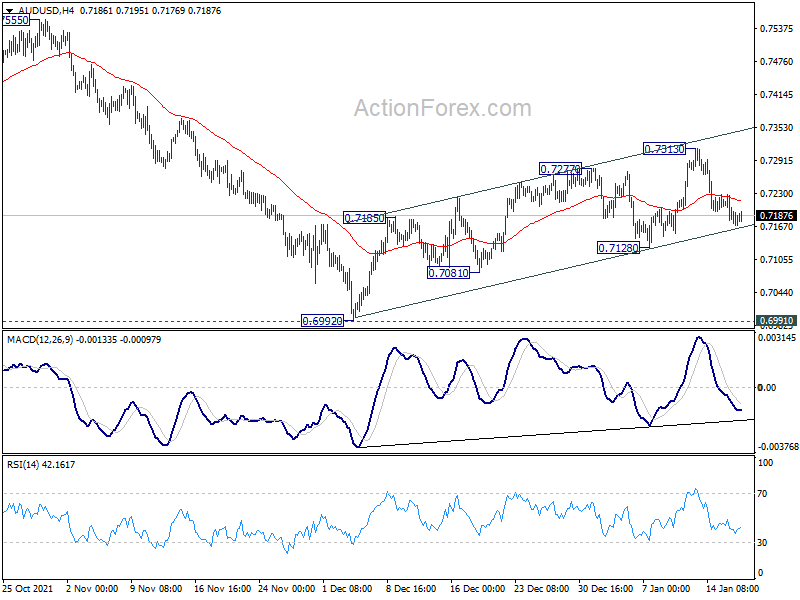
Intraday bias in AUD/USD stays neutral and outlook is unchanged. We're still slightly favoring the case that correction from 0.8006 is complete after defending 0.6991. Above 0.7313 will extend the rise from 0.6992 to 0.7555 resistance. However, break of 0.7128 support will dampen this bullish case and bring retest of 0.6991/2 instead.
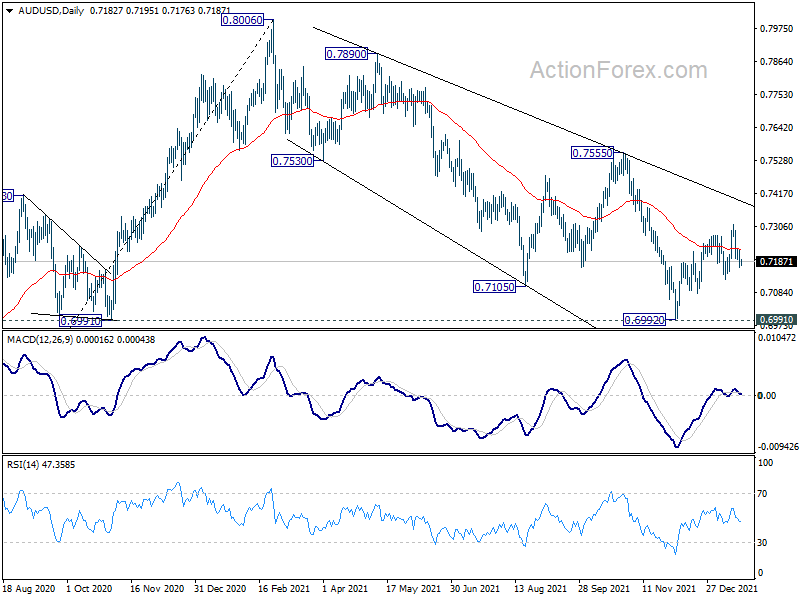
In the bigger picture, strong rebound from 0.6991 key structural support will retain medium term bullishness. That is, whole up trend from 0.5506 is still in progress. Firm break of 0.7555 resistance will target 0.8006 high and above. However, sustained break of 0.6991 will argue that the whole up trend from 0.5506 might be finished at 0.8006, after rejection by 0.8135 long term resistance. Deeper decline would then be seen back to 61.8% retracement of 0.5506 to 0.8006 at 0.6461.
USD/CAD Daily Outlook
Daily Pivots: (S1) 1.2478; (P) 1.2521; (R1) 1.2556; More...
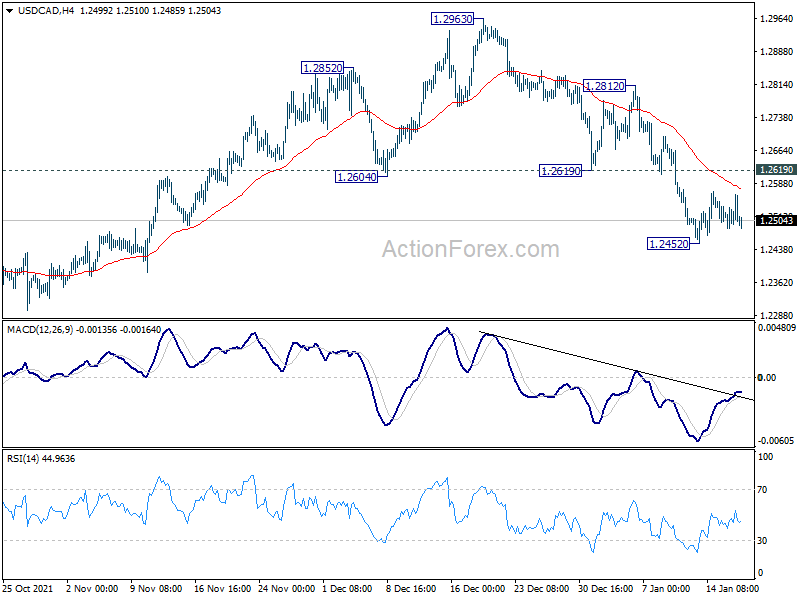
Intraday bias in USD/CAD remains neutral and outlook is unchanged. Further fall is expected as long as 1.2619 support turned resistance holds. Current development argues that whole pattern from 1.2005 has completed with three waves to 1.2963. Below 1.2452 will target 1.2286 support, and possibly further to retest 1.2005 low. Nevertheless, firm break of 1.2619 will bring stronger rebound back to 1.2812 resistance.
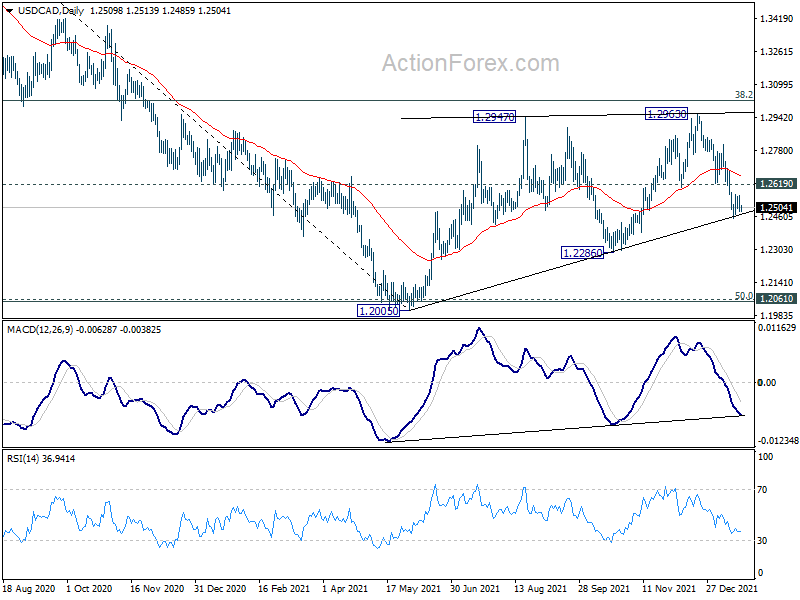
In the bigger picture, focus will be on 38.2% retracement of 1.4667 (2020 high) to 1.2005 (2021 low) at 1.3022. Sustained break there should confirm that the down trend from 1.4667 has completed after defending 1.2061 long term cluster support. Further rise would then be seen towards 61.8% retracement at 1.3650. However, rejection by 1.3022 will maintain medium term bearishness. Break of 1.2005 will resume the down trend form 1.4667 and that carries larger bearish implications too.
USD/JPY Daily Outlook
Daily Pivots: (S1) 114.34; (P) 114.70; (R1) 114.95; More...
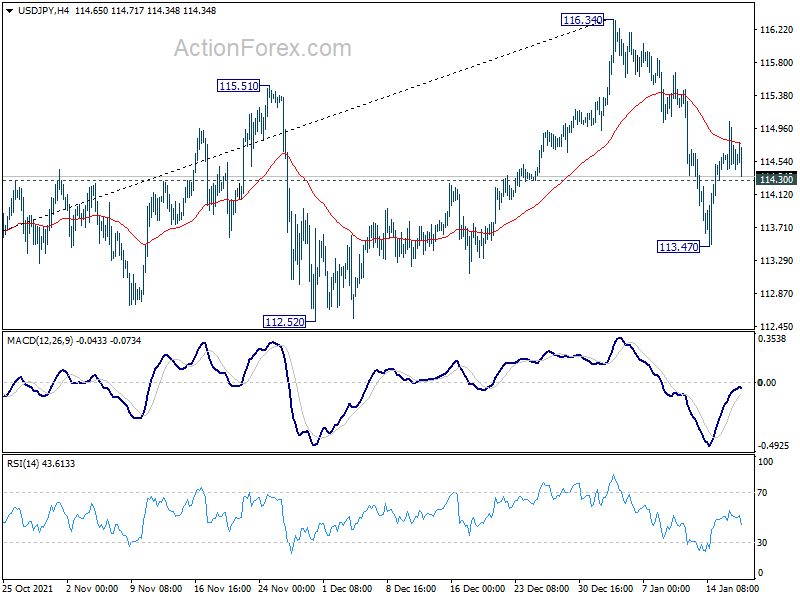
Intraday bias in USD/JPY remains neutral at this point. Corrective pattern from 116.34 is expected to extend with at least another falling leg. On the downside, break of 114.30 minor support will turn bias to the downside for 113.47. Break there will target 112.52 structural support. Considering bearish divergence condition in in daily MACD, further break of 112.52 will confirm that it's already in correction to the up trend from 102.58. Deeper decline would be seen to 38.2% retracement of 102.58 to 116.34 at 111.08.
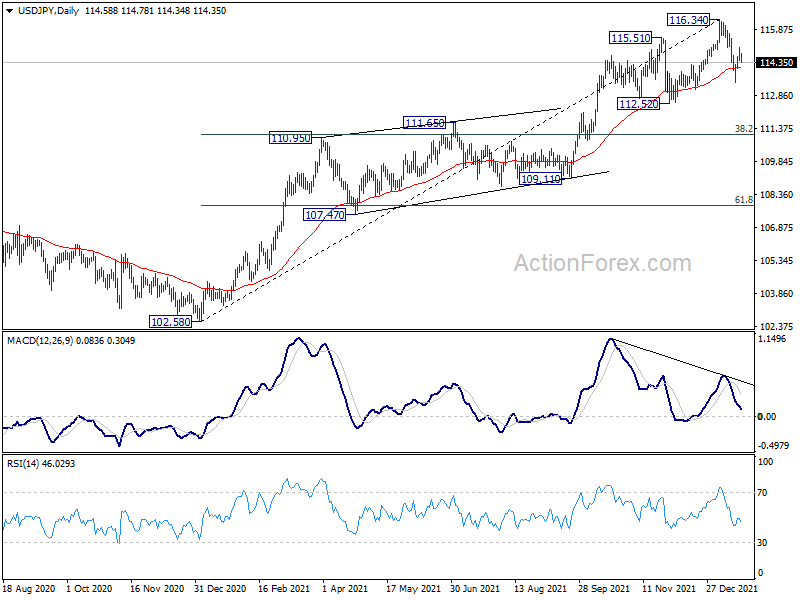
In the bigger picture, no change in the view that rise from 102.58 is the third leg of the up trend from 101.18 (2020 low). Such rally should target a test on 118.65 (2016 high). Sustained break there will pave the way to 120.85 (2015 high) and raise the chance of long term up trend resumption. However, firm break of 112.52 support will dampen this bullish case and we'll assess the outlook based on subsequent price actions later.
USD/CHF Daily Outlook
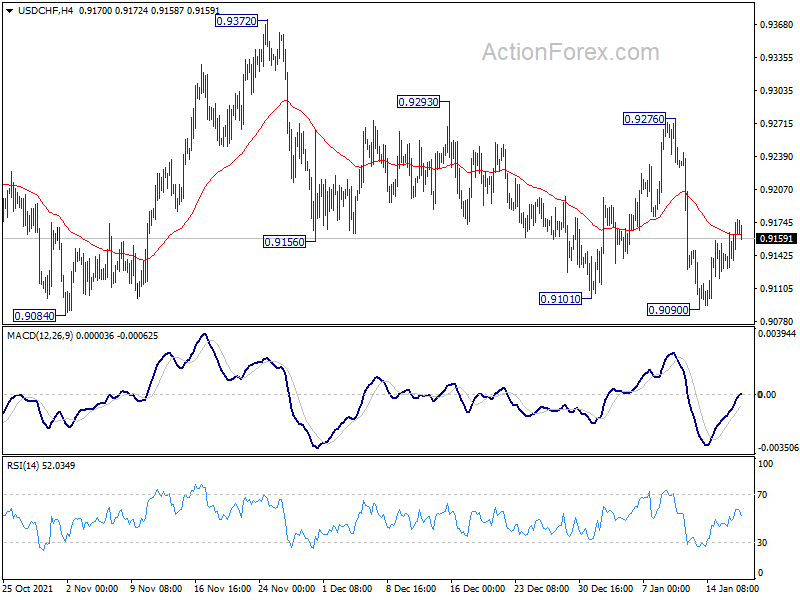
Daily Pivots: (S1) 0.9144; (P) 0.9161; (R1) 0.9191; More....
Intraday bias in USD/CHF remains neutral for the moment. On the downside, firm break of 0.9084 support will argue that choppy rise from 0.8925 has completed. Fall from 0.9471 might be ready to resuming. Further decline would be seen back to 0.8925 support first. On the upside, above 0.9276 will target 0.9372 resistance instead.
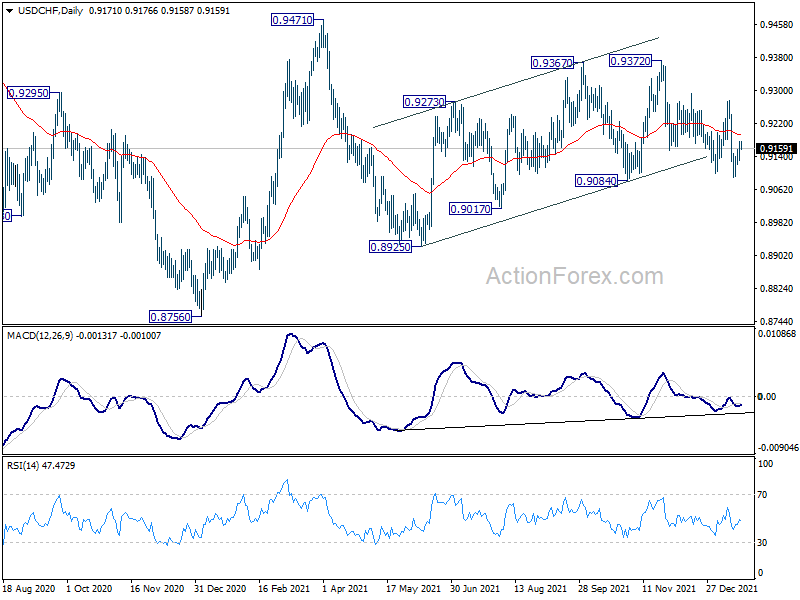
In the bigger picture, the corrective structure of the rebound from 0.8925 argues that fall from 0.9471 is not complete yet. It could either be the second leg of pattern from 0.8756 (2021 low), or resuming larger down trend from 1.0237 (2018 high). We'd pay attention to the downside momentum and assess the odds later. But for now, medium term outlook will be neutral at best as long as 0.9471 resistance holds.
GBP/USD Daily Outlook
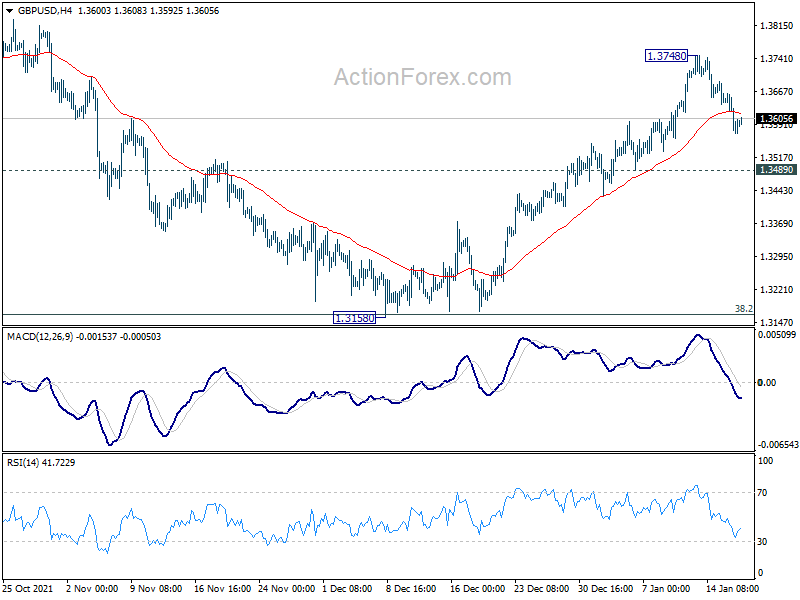
Daily Pivots: (S1) 1.3561; (P) 1.3611; (R1) 1.3650; More...
GBP/USD is still in the pull back from 1.3748 and intraday bias remains neutral for the moment. While deeper fall cannot be ruled out, downside of retreat should be contained by 1.3489 support to bring another rally. As noted before, corrective fall from 1.4282 should have completed with three waves down to 1.3158, after hitting 1.3164 medium term fibonacci level. Above 1.3748 will target 1.3833 first. Sustained break of 1.3833 will pave the way back to retest 1.4248 high.
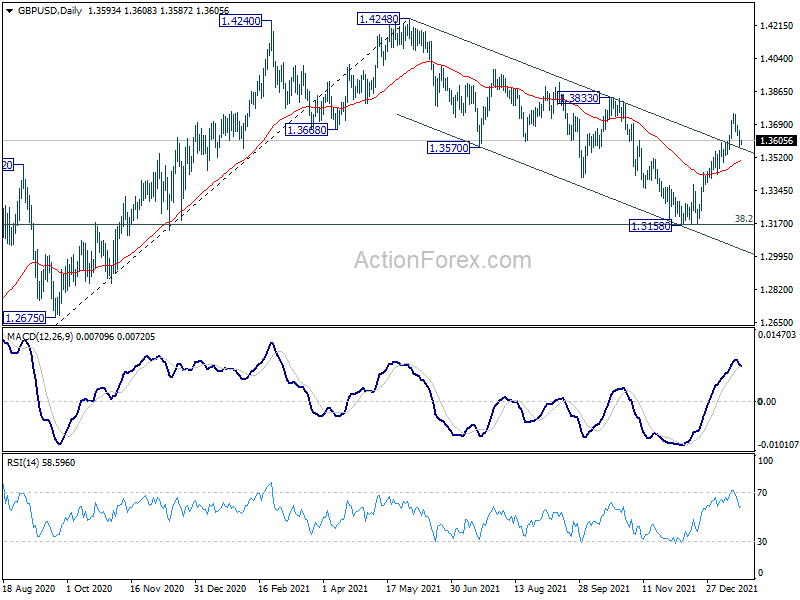
In the bigger picture, strong support was seen from 38.2% retracement of 1.1409 to 1.4248 at 1.3164. The development suggests that up trend from 1.1409 (2020 low) is still in progress. On resumption, next target will be 38.2% retracement of 2.1161 to 1.1409 at 1.5134. Nevertheless sustained break of 1.3164 will argue that whole rise from 1.1409 has completed and bring deeper fall to 61.8% retracement at 1.2493.
EUR/USD Daily Outlook
Daily Pivots: (S1) 1.1288; (P) 1.1355; (R1) 1.1394; More...
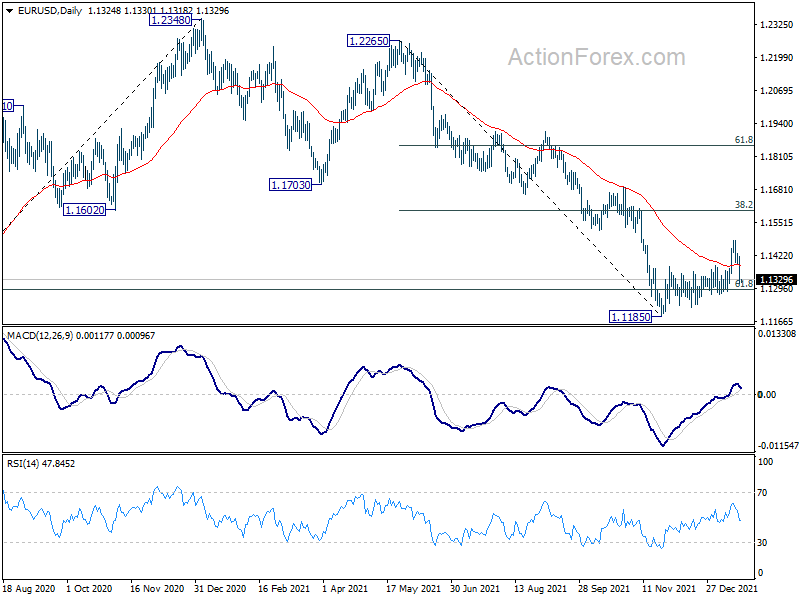
EUR/USD's fall from 1.1482 accelerates lower today and focus is now on 1.1284 support. Outlook is unchanged that rebound from 1.1185 is seen as corrective move. Break of 1.1284 will argue that larger down trend from 1.2348 is ready to resume. Intraday bias will be back on the downside for retesting 1.1185 low first. Also, in case of another rise, upside should be limited by 38.2% retracement of 1.2265 to 1.1185 at 1.1598 eventually.
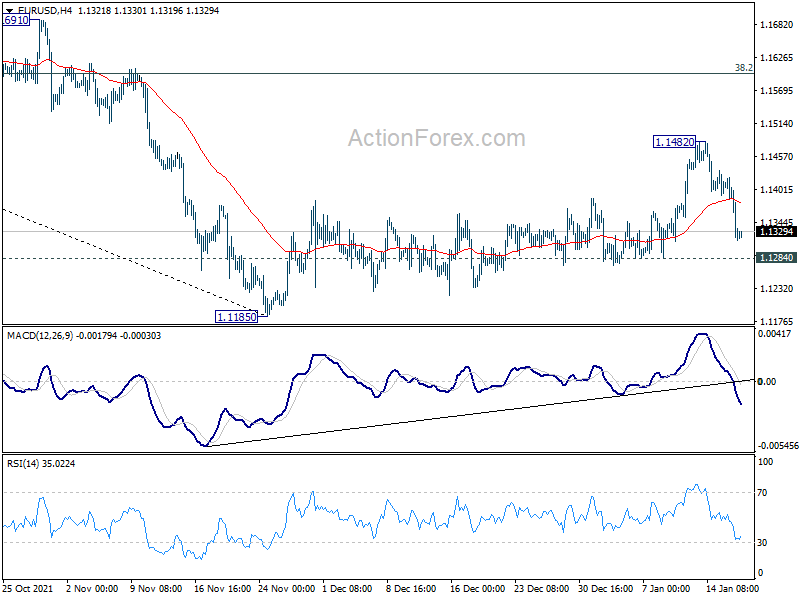
In the bigger picture, there are various ways of interpreting the fall from 1.2348 (2021 high). It could be a correction to rise from 1.0635 (2020 low), the fourth leg of a sideway pattern from 1.0339 (2017 low), or resuming long term down trend. In any case, outlook will now stay bearish as long as 1.1703 support turned resistance holds. Sustained break of 61.8% retracement of 1.0635 to 1.2348 at 1.1289 would pave the way back to 1.0635.
Dollar Extending Rebound on Yields and Risk Aversion, Canadian Stronger
Dollar is trying to extend near term rebound with help from surging treasury yields and risk-off sentiments in stocks. But Canadian Dollar is still outshining slightly, as support by oil price rally. Aussie and Kiwi are soft, but selloffs are mainly centered around European majors. Euro is particularly weak as it looks set to resume recent down trend against Sterling and Swiss Franc too.
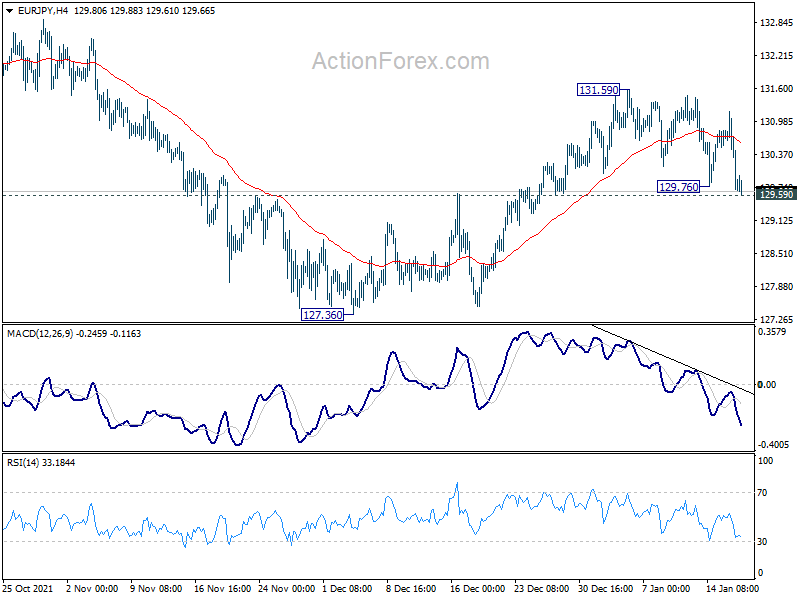
Technically, Yen is also trying to firm up too, even though it's lagging behind the greenback and Loonie. A focus will be on 129.59 support in EUR/JPY. Sustained break there will dampen our original bullish view of near term reversal. That would indicate that rebound form 127.26 has completed at 131.59 already, and bring deeper fall back to this low. That could be a prelude to more Yen strength elsewhere.
In Asia, at the time of writing, Nikkei is down -2.26%. Hong Kong HSI is up 0.02%. China Shanghai SSE is down -0.29%. Singapore Strait Times is down -0.01%. 10-year JGB yield is down -0.0026 at 0.149. Overnight, DOW dropped -1.51%. S&P 500 dropped -1.84%. NASDAQ dropped -2.60%. 10-year yield rose 0.093 to 1.865.
NASDAQ lost -2.6% while 10-yr yield extends up trend
Major US stock indexes, particularly the NASDAQ tumbled sharply overnight, while benchmark treasury yields surged. Investors are still in the process of adjusting to the evolution of a more aggressive Fed in terms of stimulus withdrawal. At the same time, it's unsure when the no-longer-transitory inflation would start easing down, and Fed's response to that.
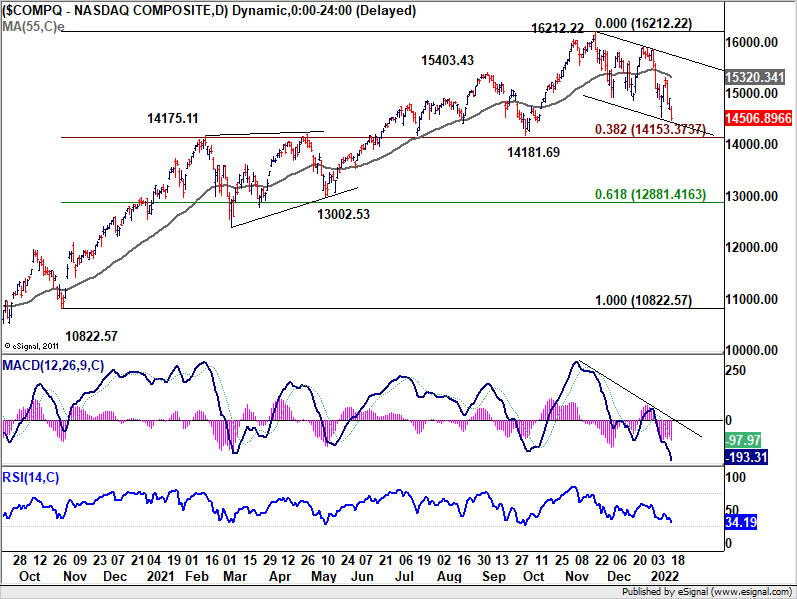
NASDAQ dropped -2.6% to close at 14506.89. The development is not a surprise as price actions from 16212.22 are seen as correcting the up trend from 10822.57 to 16212.22. Deeper fall could be seen. But we'd expect strong support around 14100/14200 to contain downside to bring rebound. The support zone coincides with 14715.11 resistance turned support, 14181.69 structural support, and 38.2% retracement of 10822.57 to 16212.22 at 14153.37. However, sustained break of this level will argue that NASDAQ is already in a larger scale correction.
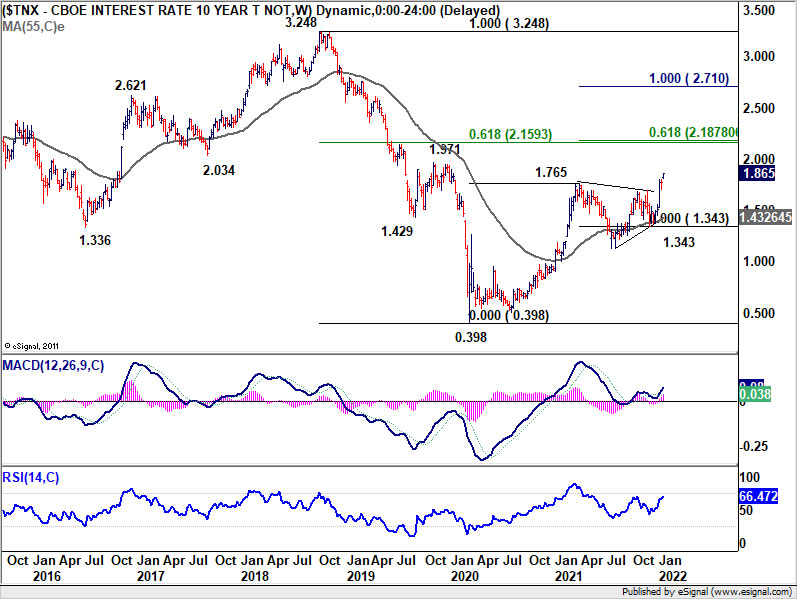
10-year yield rose 0.093 to close at 1.865. The medium term up trend is back in full force. 2% handle now looks rather approachable. But TNX should start to feel heavy above there. There should be strong resistance from 2.16/18 zone to repel the rally. This is a cluster level of 61.8% projection of 0.398 to 1.765 from 1.343 at 2.187 and 61.8% retracement of 3.248 to 0.398 at 2.159. But then, a strong break there would indicate some substantial underlying development is underway.
WTI oil hits 7-yr high, EUR/CAD downside breakout
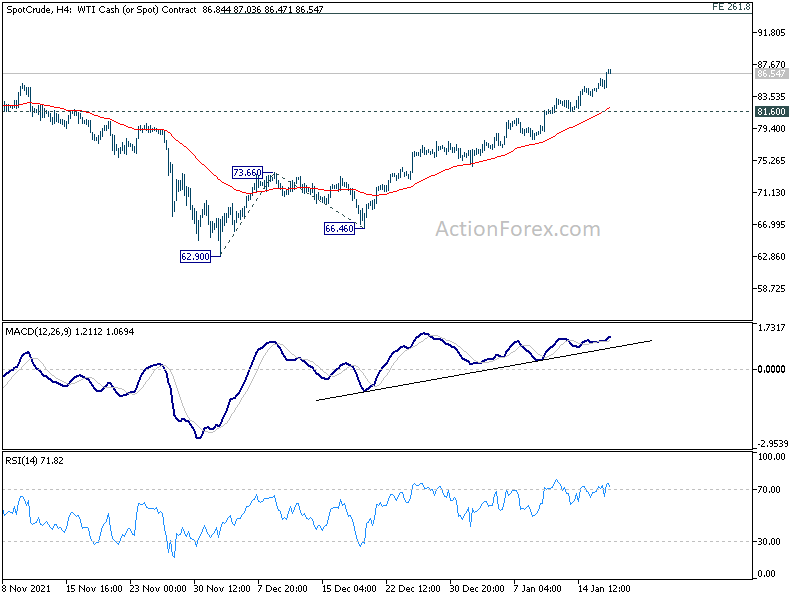
WTI crude oil surged through a key resistance overnight and hit the highest level since 2014. The outage of Turkey's Kirkuk-Ceyhan pipeline after an explosion was a factor causing concerns over supplies. In the background, there are also geopolitical issues surrounding Russia.
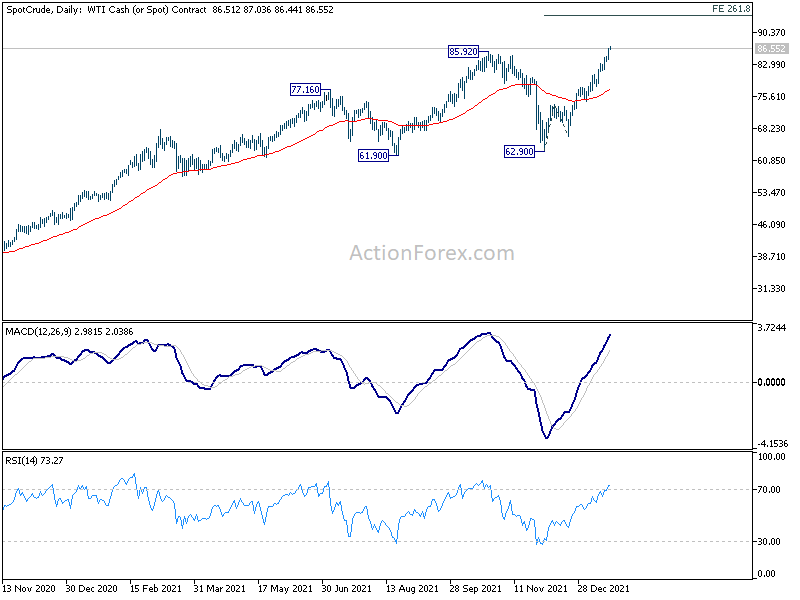
With 85.92 resistance taken out, WTI crude oil is resuming up trend from the 2020 spike low. For the near term, further rally is expected as long as 81.60 support holds. Next target 90 handle. But WTI could try to hit 261.8% projection of 62.90 to 73.66 from 66.46 at 94.62 before topping.
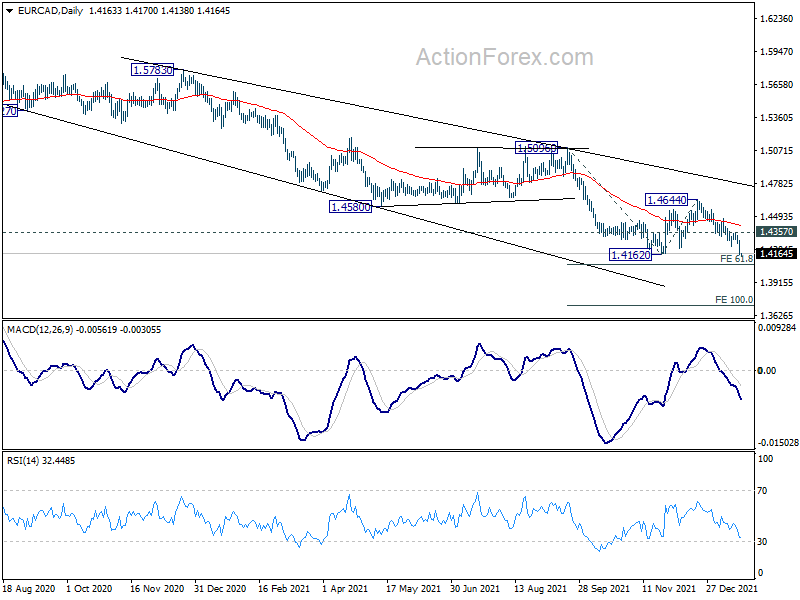
EUR/CAD followed and broke 1.4162 low to resume the down trend from 1.5991. Near term outlook will now stay bearish as long as 1.4357 resistance holds. Next target is 61.8% projection of 1.5096 to 1.4162 from 1.4644 at 1.4067. Firm break there could trigger downside acceleration to 100% projection at 1.3710.
Australia consumer sentiment dropped to 102.2 in Jan, cautiously pessimistic on economic conditions
Australia Westpac-MI consumer sentiment index dropped from 104.3 to 102.2 in January. The -2% decline was much better than the -5.2% fall during the first month of the delta outbreak in New South Wales, the -6.1% drop in Victoria's second wave in 2020, not to mention the epic -17.7% collapse in early 2020.
The 'economic conditions, next 12 months' sub-index dropped -9.6% from 104.9 to 94.8, a swing from "cautious optimism to cautious pessimism". 55% of respondents, an outright majority, expected mortgage interest rates to rise over the next 12 months. Unemployment Expectations Index increased by 8.2% to 112.7, marking a significant deterioration.
RBA would make a decision on the bond purchases program at the February 1 meeting. Westpac expects the central bank to choose to "scale back rather than full wind down, in response to the sudden emergence of Omicron. But that would depend on the upcoming employment and inflation data.
Looking ahead
UK inflation data are the main focuses in European session, with CPI and PPI featured. Germany will release CPI final. Eurozone will release current account. Later in the day, attention will be on Canada inflation data and wholesale sales. US will release housing starts and building permits.
EUR/USD Daily Outlook
Daily Pivots: (S1) 1.1288; (P) 1.1355; (R1) 1.1394; More...
EUR/USD's fall from 1.1482 accelerates lower today and focus is now on 1.1284 support. Outlook is unchanged that rebound from 1.1185 is seen as corrective move. Break of 1.1284 will argue that larger down trend from 1.2348 is ready to resume. Intraday bias will be back on the downside for retesting 1.1185 low first. Also, in case of another rise, upside should be limited by 38.2% retracement of 1.2265 to 1.1185 at 1.1598 eventually.
In the bigger picture, there are various ways of interpreting the fall from 1.2348 (2021 high). It could be a correction to rise from 1.0635 (2020 low), the fourth leg of a sideway pattern from 1.0339 (2017 low), or resuming long term down trend. In any case, outlook will now stay bearish as long as 1.1703 support turned resistance holds. Sustained break of 61.8% retracement of 1.0635 to 1.2348 at 1.1289 would pave the way back to 1.0635.
Economic Indicators Update
| GMT | Ccy | Events | Actual | Forecast | Previous | Revised |
|---|---|---|---|---|---|---|
| 07:00 | EUR | Germany CPI M/M Dec F | 0.50% | 0.50% | ||
| 07:00 | EUR | Germany CPI Y/Y Dec F | 5.30% | 5.30% | ||
| 07:00 | GBP | CPI M/M Dec | 0.30% | 0.70% | ||
| 07:00 | GBP | CPI Y/Y Dec | 5.20% | 5.10% | ||
| 07:00 | GBP | Core CPI Y/Y Dec | 4.00% | 4.00% | ||
| 07:00 | GBP | PPI Input M/M Dec | 0.70% | 1.00% | ||
| 07:00 | GBP | PPI Input Y/Y Dec | 13.70% | 14.30% | ||
| 07:00 | GBP | PPI Output M/M Dec | 0.60% | 0.90% | ||
| 07:00 | GBP | PPI Output Y/Y Dec | 9.40% | 9.10% | ||
| 07:00 | GBP | PPI Core Output M/M Dec | 0.80% | 0.80% | ||
| 07:00 | GBP | PPI Core Output Y/Y Dec | 8.60% | 7.90% | ||
| 09:00 | EUR | Eurozone Current Account (EUR) Oct | 20.3B | 18.1B | ||
| 13:30 | USD | Housing Starts Dec | 1.65M | 1.68M | ||
| 13:30 | USD | Building Permits Dec | 1.71M | 1.71M | ||
| 13:30 | CAD | Wholesale Sales M/M Nov | 2.80% | 1.40% | ||
| 13:30 | CAD | CPI M/M Dec | 0.20% | 0.20% | ||
| 13:30 | CAD | CPI Y/Y Dec | 4.70% | 4.70% | ||
| 13:30 | CAD | CPI Common Y/Y Dec | 2.10% | 2.00% | ||
| 13:30 | CAD | CPI Median Y/Y Dec | 2.90% | 2.80% | ||
| 13:30 | CAD | CPI Trimmed Y/Y Dec | 3.40% | 3.40% |