Sample Category Title
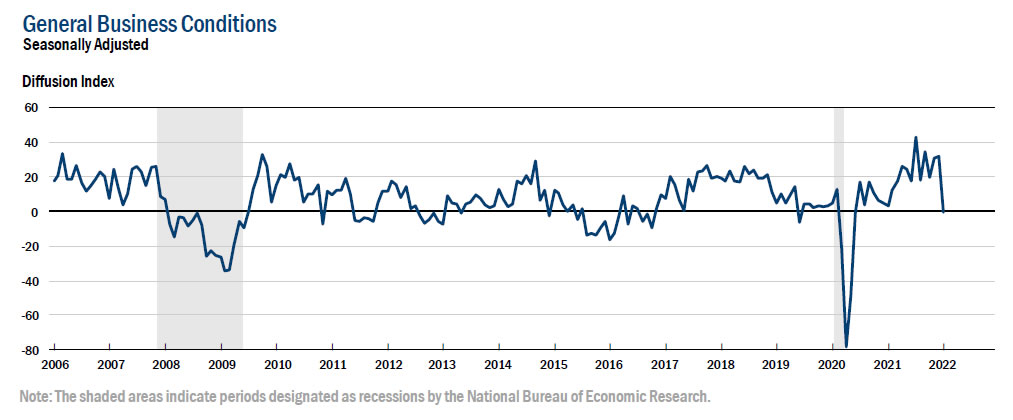
US Empire state manufacturing dived to -0.7, expectations firm
US Empire State Manufacturing Survey general business conditions index dropped sharply from 31.9 to -0.7 in January. Twenty-two percent of respondents reported that conditions had improved over the month, while 23 percent reported that conditions had worsened. Expectations for the six months ahead ticked down from 36.4 to 35.1.
Looking at some details, new orders dropped from 27.1 to -5.0. Shipments dropped from 27.1 to 1.0. Delivery times dropped slightly from 23.1 to 21.6. Price paid eased from 80.2 to 76.6. Prices received also dropped from 44.6 to 37.1.
GBP/USD Looks for a Correction: Elliott Wave Analysis
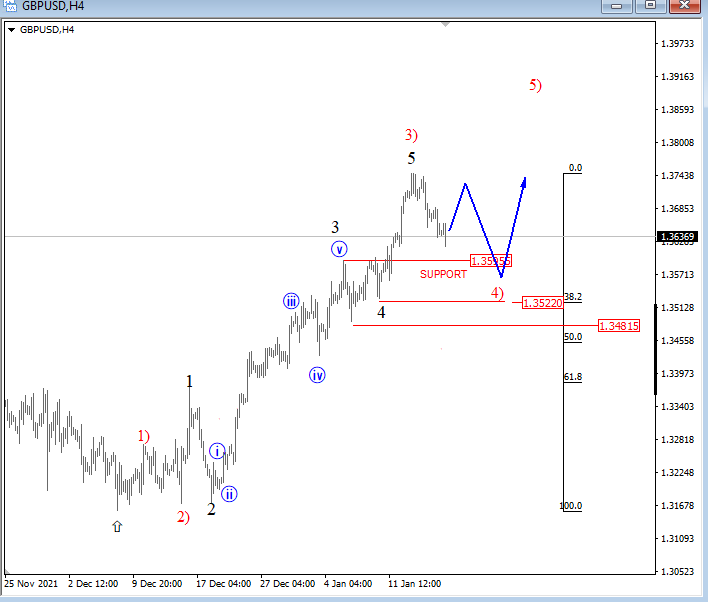
GBPUSD was even higher last week after a break above the channel resistance line on the daily chart, so we believe that the pound has bottomed at 1.3130 area, and that we are going to see more upside after any corrective retracement.
Price has an extended structure in the middle, so it's worth being patient and waiting on pullbacks if you want to participate within an uptrend. Ideally the fourth wave is now in play with wave 4) support at 1.3590 followed by 1.3500 area, from where uptrend may resume when looking at the 4h time frame.
GBP/USD 4h Elliott Wave analysis
Pound Edges Lower as US Treasuries Jump
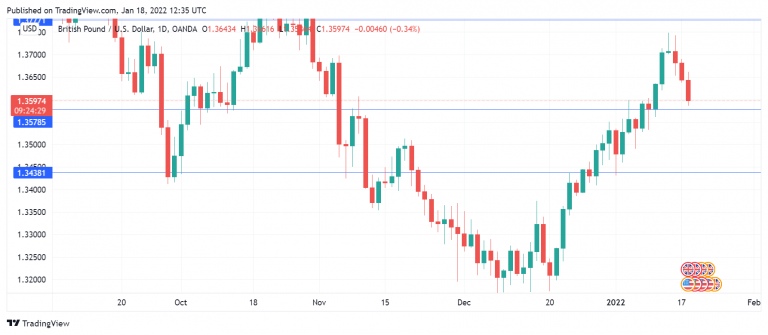
The British pound has extended its losses as GBP/USD has fallen for a third successive day. The pair has fallen below the 1.35 line in the European session.
US yields hit 2-year high
The US dollar has received a boost as 10-year yields have pushed above the 1.80% and touched a 2-year high. The 2-year yield also touched a 2-year high when it rose above 1% earlier in the day. The upswing is a reflection of market concern that the Fed will be more aggressive in its tightening. FOMC member Patrick Harker said last week that the Fed could raise rates three or four times this year, adding that inflation has been more persistent than previously expected. The CEO of JP Morgan, Jamie Dimon, went even further, saying that we could see six or seven rate hikes in 2022, due to surging inflation. The Fed is now in a no-comment “blackout” period ahead of next week’s policy meeting, so it will be interesting to see if yields continue to move towards the psychologically important 2% level.
The UK posted strong employment numbers, but the pound was unable to capitalize and move higher. Payrolls rose in December by 184 thousand m/m and wage growth came in at 4.2%, matching the estimate. Although wage growth remains strong, it has been overtaken by inflation, which hit 5.1% in November and could climb to 6% in the spring. Job vacancies continue to rise as businesses are short-staffed and are finding it difficult to find enough workers. Still, the latest job numbers show that the labour market is performing well and is a key driver of the UK recovery.
GBP/USD Technical Analysis
- 1.3560 is under pressure in support. Below, there is support at 1.3438
- GBP/USD faces resistance at 1.3776 and 1.3870
Yen Steady after BoJ Meeting
The US dollar has posted small gains, as USD/JPY briefly punched above the 115 line in the Asian session. The yen looked golden last week with gains of 1.15%, but has given up half of those gains so far this week.
BoJ revises inflation forecast
The Bank of Japan’s policy meeting are generally uneventful affairs, with the bank reaffirming its monetary policy. The bank did maintain policy, keeping interest rates at -0.1% and maintaining bond yield targets and asset purchases. But there was a difference at this meeting, with the bank revising upwards its inflation forecast, for the first time since 2014. This is significant because the BoJ is acknowledging that inflation could overshoot its projections, something we never saw in the years of deflation.
Inflation in Japan is much lower than in the US or UK, where the central banks have had to tighten policy in order to deal with what has inflation, which has become Enemy Number One. The global wave of inflation, which has seen energy and raw material costs soar, has also reached Japan, and the increase in inflation has forced the BoJ to pay attention to the new phenomenon of rising inflation. For the fiscal year starting in April, the BoJ is projecting inflation of 1.1% up from 0.9% gain it forecast in October. Last week, Reuters reported that the BoJ is considering the eventuality of having to raise interest rates even if inflation does not reach the bank’s two percent target.
The BoJ’s ultra-accommodative policy won’t be changed anytime soon and inflation still remains below 2%. Still, it is noteworthy that for the first time in years the BoJ is addressing inflation concerns, and that could eventually lead to a shift in policy.
USD/JPY Technical
- There is resistance at 115.54, followed by 116.88
- There is support at 113.18 and 112.16
Fed: End of Money Printing Brrrrr – (At Least) Four 25bp Rate Hikes this Year and QT in September
Key takeaways
At the upcoming January meeting, we expect the Fed to indicate that the first rate hike is likely in March if the economy develops in line with expectations, supported by the tight labour market and still very high inflation.
It is one of the interim meetings without updated projections or dots.
We have changed our Fed call now expecting four 25bp rate hikes this year (in March, June, September and December, up from three previously) and still four rate hikes in 2023. We expect the Fed to start reducing the balance sheet from September.
Given the combination of a strong economy and high underlying inflation, we see risks as skewed towards more, not less, tightening. If this scenario plays out, the Fed is likely to hike 25bp at each meeting, not skipping interim meetings.
Fixed Income: We have lifted our target to 2.25% for 10Y UST.
WTI Futures Breach 7-Year High, Uptrend Intact
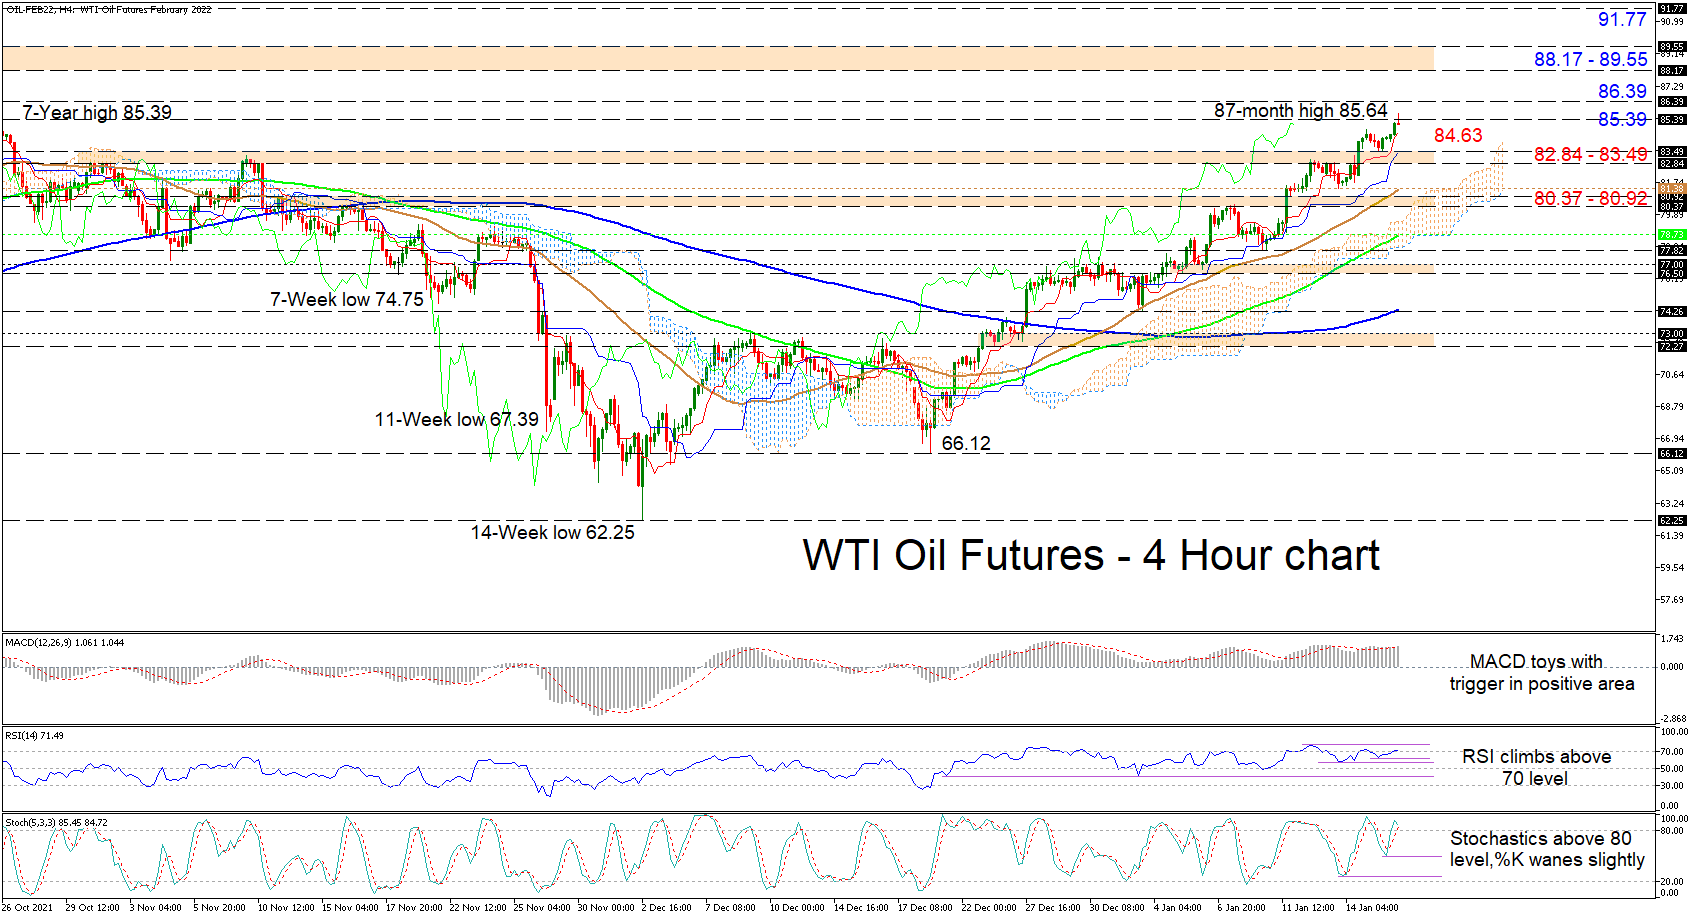
WTI oil futures are struggling to some extent to boost the one-month uptrend, which began from the 66.12 level, even after ticking slightly above the 7-year high of 85.39. That said, a price close north of the 7-year high would be the fuel required to reinforce upside momentum. Furthermore, the climbing simple moving averages (SMAs) are nurturing the positive structure.
The rising Ichimoku lines are implying that bullish forces remain robust, while the short-term oscillators are promoting a positive preference in the commodity. The MACD, some distance north of the zero mark, has nudged back above its relatively flattened red trigger line, while the RSI is improving over its 70 level. The stochastic oscillator is on the bullish camp and the current dip in the %K line is reflecting buyers’ efforts to overcome the 7-year high.
In the positive scenario, a definitive price close north of the 7-year high of 85.39 could bring the 86.39 resistance barrier into play. If the price advances further, resistance may show face between the 88.17-89.55 region, which formed over September and November 2014. Overcoming this boundary too, the price could then propel for the 91.77 high, identified in the early part of October 2014.
If the 7-year high curbs improvements, downside friction may emanate from the red Tenkan-sen line at 84.63 and the nearby 82.84-83.49 support border. If a stronger price pullback unfolds, the price may then target the 50-period SMA at 81.38, adjacent to the Ichimoku cloud’s upper surface and the 80.37-80.92 obstacle. Sinking further, traders’ attention may then shift toward the 100-period SMA at 78.73, overlapping the cloud’s lower band.
Summarizing, WTI oil futures are sustaining a bullish bias above the 82.84-83.49 support band and the SMAs. For negative tendencies to spark concerns about the latest uptrend, the price would need to slide beneath the cloud.
USDCAD Marks Yet More Lower Highs as Bearish Forces Linger
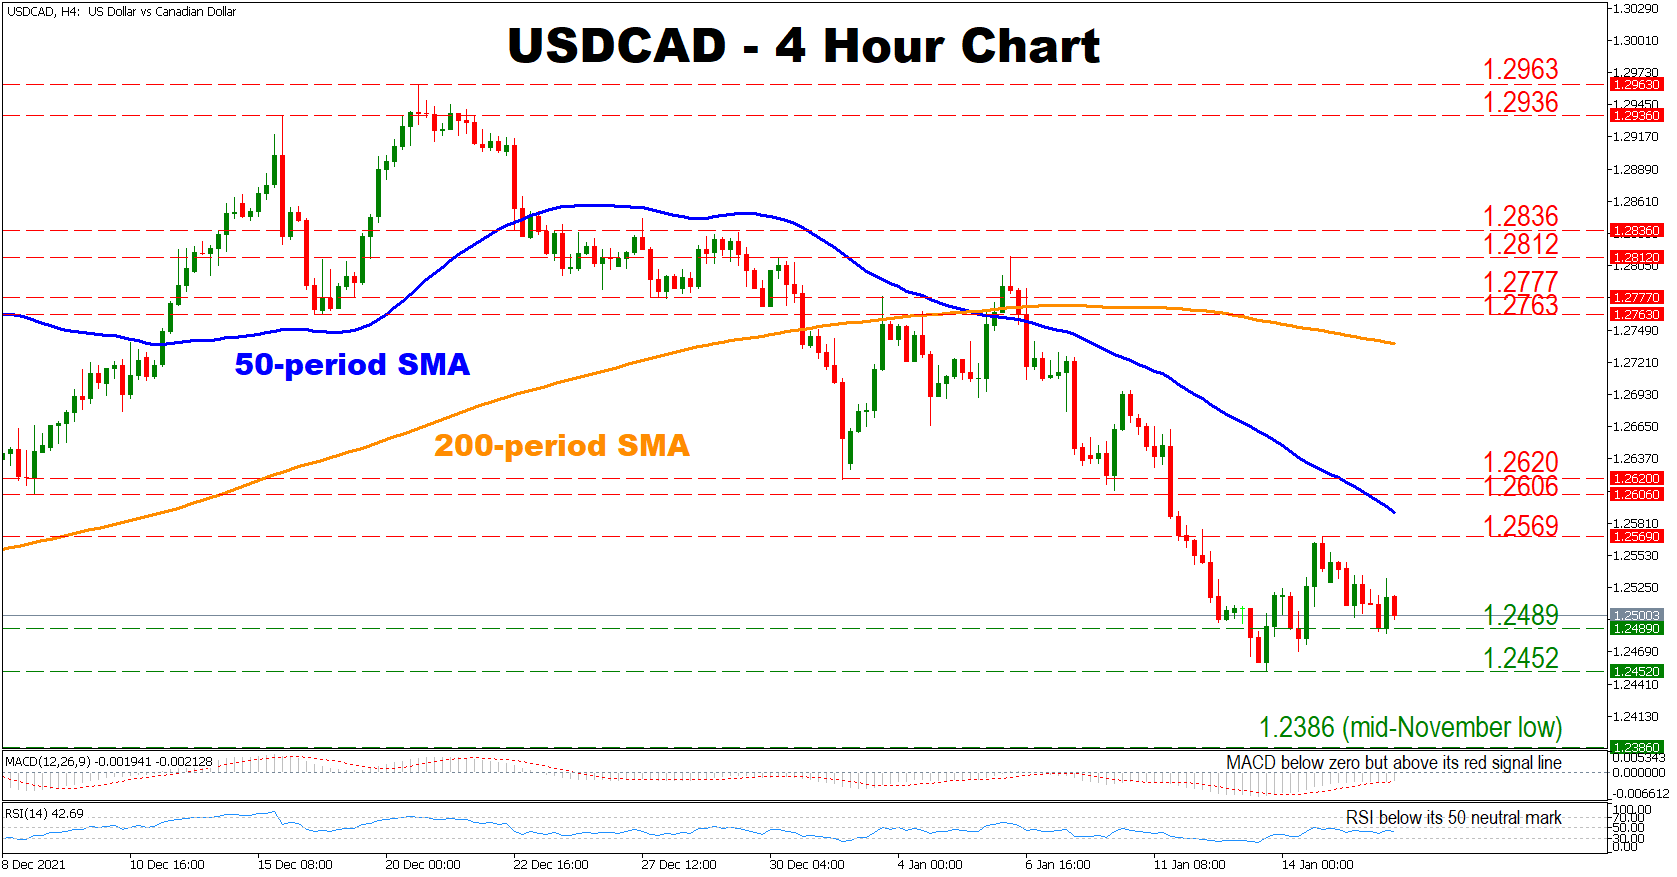
USDCAD has marked yet more lower highs and lower lows due to lingering negative forces. Moreover, the pair is also trading well below its 50- and 200-period simple moving average (SMA), and has recently completed a ‘death cross’ where the 50-period SMA has crossed below the 200-period SMA, increasing fears of a sustained bearish outlook.
Short-term momentum indicators are supporting a mixed picture as the RSI is located below its 50 neutral mark. However, despite the MACD being below zero, it is found above its red signal line, indicating that the negative bias might be fading.
Should the bears remain in charge, initial support might be found at the 1.2489 hurdle. A decisive move below this point could send the price to test the 1.2452 level. A break below the latter could increase selling pressures, shifting sellers attention towards the mid-November low at 1.2386.
On the flip side, should buyers regain control, initial resistance might be found at the 1.2569 barrier before shifting their attention towards the 50-period SMA currently at 1.2596. Crossing above the latter, the pair could test the congested region which includes the 1.2606 and the 1.2620 obstacles. A break above that area could induce further buying activity, opening the door towards the 200-period SMA currently at 1.2738.
In brief, the overall outlook for the bear is bearish. For sentiment to change, sellers would need to break above the 50-period SMA.
Stocks Roll Over, Dollar Steady, Oil Storms Higher
- Markets fully price in four Fed rate hikes for this year, lifting yields
- Stocks under pressure, dollar recovers, gold surprisingly resilient
- Oil hits new highs, yen retreats after BoJ does nothing
Fed worries hit stocks
It has been a stormy couple of weeks for financial markets, with almost every asset class getting rocked by expectations that the Fed will need to normalize monetary policy more aggressively to cool inflation. The US labor market is so tight that wage growth has started to fire up, igniting worries of a wage-price spiral and by extension leading market participants to fully price in four rate increases for this year.
This has propelled US Treasury yields much higher, and when the bond market begins to rumble, it feels like an earthquake for assets such as equities. This is especially true for the riskiest corners of the stock market, for example companies without consistent cash flows whose valuation can change dramatically if interest rates move higher.
As such, global equity markets are a sea of red on Tuesday, feeling the heat of higher rates as the yield on 10-year Treasury bonds continues to ascend beyond pre-pandemic levels. The tech-heavy Nasdaq is leading the way lower, with futures pointing to losses of around 1.5% when US markets open today after a long weekend.
Currencies cautious, but oil defies the gloom
This sense of caution has spilled over into the FX arena as well. The US dollar is naturally outperforming, enjoying the perks of widening rate differentials between America and the rest of the world. Meanwhile, commodity-linked currencies like the Australian dollar are trading heavy.
The yen has been unable to capitalize on the gloomy mood and is under pressure instead, suffering a double whammy from rising foreign yields and the Bank of Japan’s reluctance to provide any signals that policy normalization is on the cards.
But oil prices apparently didn’t get the memo. Despite all the risk aversion, crude prices briefly touched new seven-year highs today, drawing power from renewed tensions in the Middle East and a rosier outlook for demand amid hopes that Omicron could be the beginning of the end for the pandemic.
Loonie in focus, gold holds its ground
With oil prices roaring back, the Canadian dollar has staged a powerful rally in recent weeks, turbocharged by expectations that the Bank of Canada will raise rates next week to counter inflationary pressures. The economy has improved at such a dramatic pace that markets are currently pricing in an 80% probability for a hike this month, in defiance of the BoC’s latest guidance that April is the earliest possible date.
However, that seems like a bridge too far considering that wage growth is not impressive and that many provinces recently reintroduced tough restrictions to fight Omicron. Hence, the risk-to-reward profile for the loonie heading into next week's decision doesn't seem very attractive. The picture will become clearer tomorrow with the release of the nation's latest inflation data.
Finally, gold prices have shown remarkable resilience in the face of ‘bad news’ lately. Even though both nominal and real US yields have stormed higher, bullion has remained unfazed within a narrow range, which is an achievement in itself. If intensifying speculation for Fed rate hikes and soaring yields are not enough to sink gold, most of the negativity might be priced in already.
Germany ZEW surged to 51.7, economic outlook improved considerably
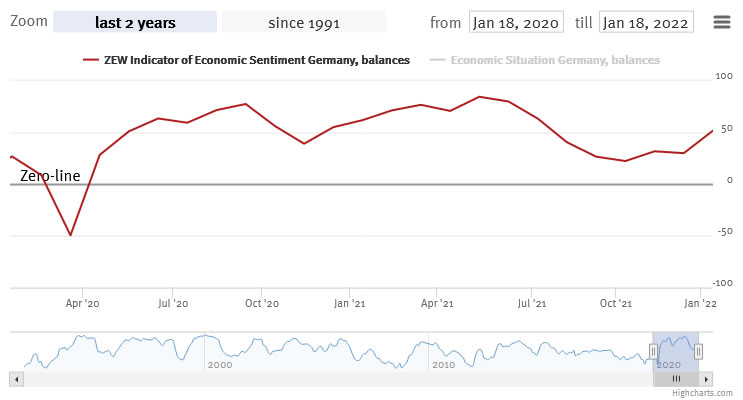
Germany ZEW Economic Sentiment rose sharply from 29.9 to 51.7 in January, well above expectation of 32.7. Current Situation index deteriorated from -7.4 to -10.2, missed expectation of -7.5.
Eurozone ZEW Economic Sentiment jumped from 26.8 to 49.4, well above expectation of 29.2. Current Situation index dropped -3.9 pts to -6.2.
ZEW President Achim Wambach said: "The economic outlook has improved considerably with the start of the new year. The majority of financial market experts assume that economic growth will pick up in the coming six months. It is likely that the phase of economic weakness from the fourth quarter of 2021 will soon be overcome.
"The main reason for this is the assumption that the incidence of COVID-19 cases will fall significantly by early summer. The more positive economic expectations include the consumer-related and export-oriented sectors and thus a large part of the German economy."
GBPUSD Turns South after Reaching 200-Day SMA
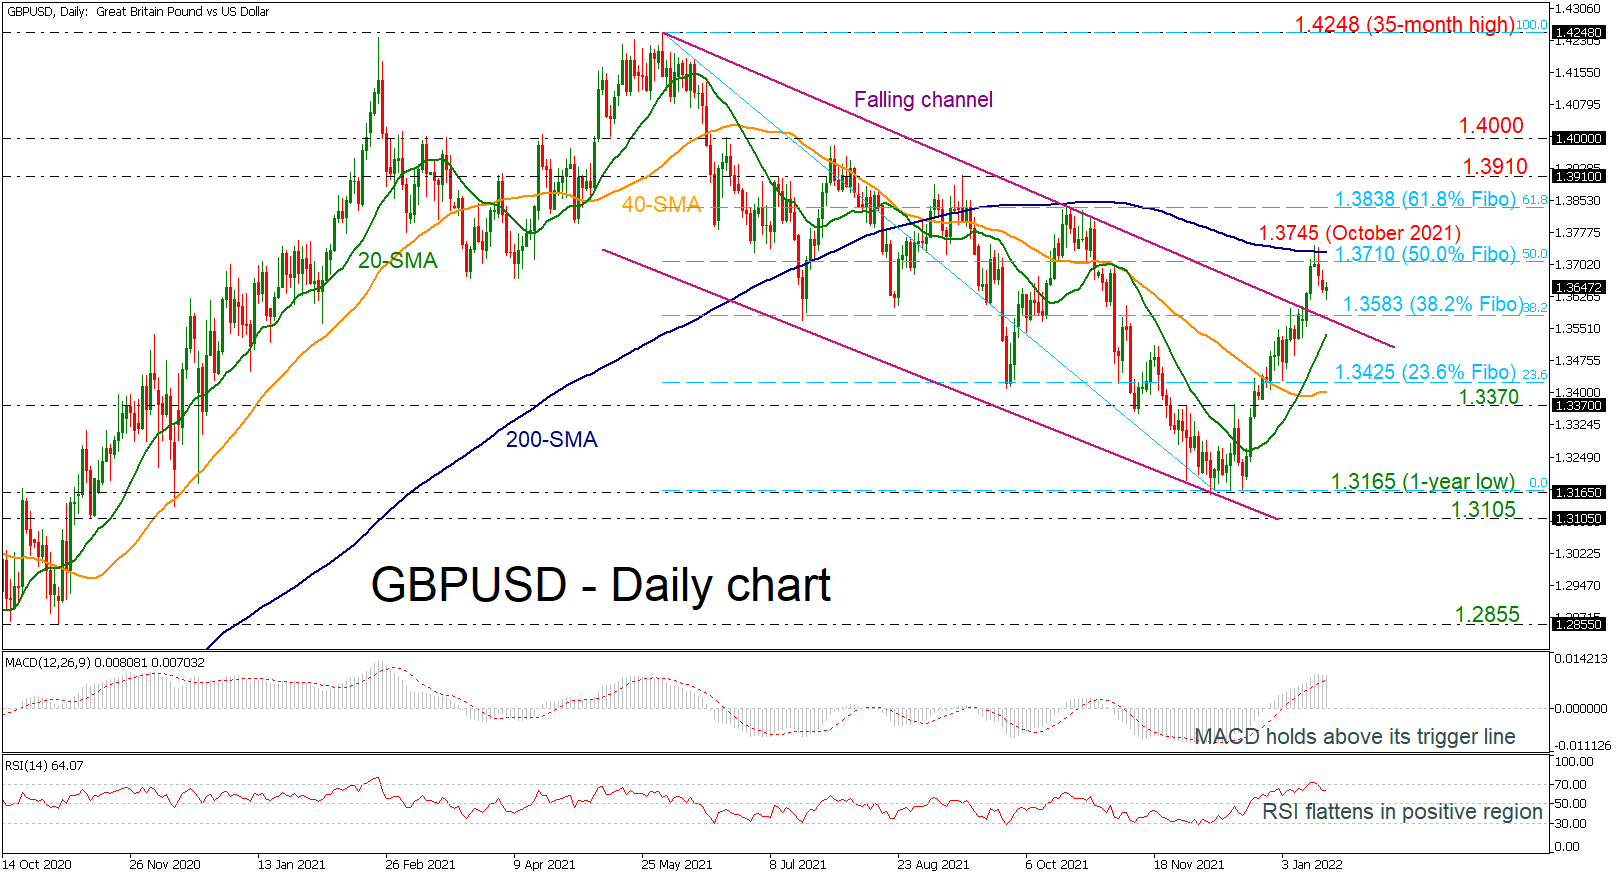
GBPUSD is reversing following the advance to the 1.3745 level, which represents a nearly three-month high. Although the price declined following the touch of the 200-day simple moving average (SMA), it remains above the long-term declining channel. The MACD oscillator is still holding above its trigger line in the positive region with weak momentum, while the RSI is flattening above the neutral threshold of 50.
If the pair continues to fall, immediate support might be found near the 38.2% Fibonacci retracement level of the decline from 1.4248 to 1.3165 at 1.3583, before meeting the 20-day SMA at 1.3535. If selling pressure remains, traders may consider the 23.6% Fibonacci level of 1.3425, which is located above the inside swing high of 1.3370 and the one-year low of 1.3165.
In the alternative scenario, a rally above recent highs could take the currency to the 61.8% Fibonacci level of 1.3838 and then to the 1.3910 barrier. Even higher, the psychological number of 1.4000 may put an end to bullish moves.
All in all, GBPUSD has largely maintained a bullish bias since the bounce from 1.3165, although the recent bearish days may portend a negative correction.