Sample Category Title
EUR/USD Daily Outlook
Daily Pivots: (S1) 1.1387; (P) 1.1410; (R1) 1.1429; More...
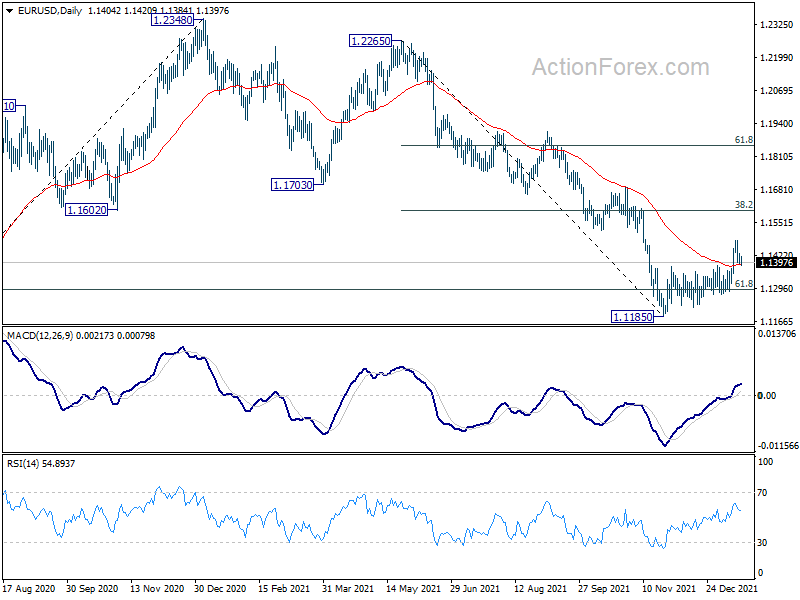
Intraday bias in EUR/USD remains neutral for the moment. Rebound from 1.1185 is seen as a corrective move. Above 1.1482 will extend the rebound but upside should be limited by 38.2% retracement of 1.2265 to 1.1185 at 1.1598. On the downside, below 1.1284 support will bring retest of 1.1185 low. However, sustained break of 1.1598 will argue that the trend is reversing already.
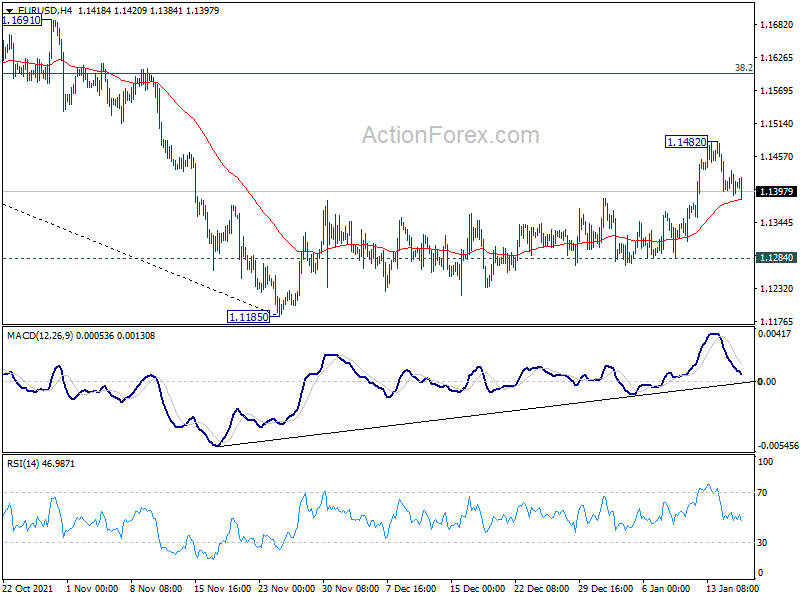
In the bigger picture, there are various ways of interpreting the fall from 1.2348 (2021 high). It could be a correction to rise from 1.0635 (2020 low), the fourth leg of a sideway pattern from 1.0339 (2017 low), or resuming long term down trend. In any case, outlook will now stay bearish as long as 1.1703 support turned resistance holds. Sustained break of 61.8% retracement of 1.0635 to 1.2348 at 1.1289 would pave the way back to 1.0635.
GBP/USD Daily Outlook
Daily Pivots: (S1) 1.3624; (P) 1.3657; (R1) 1.3676; More...
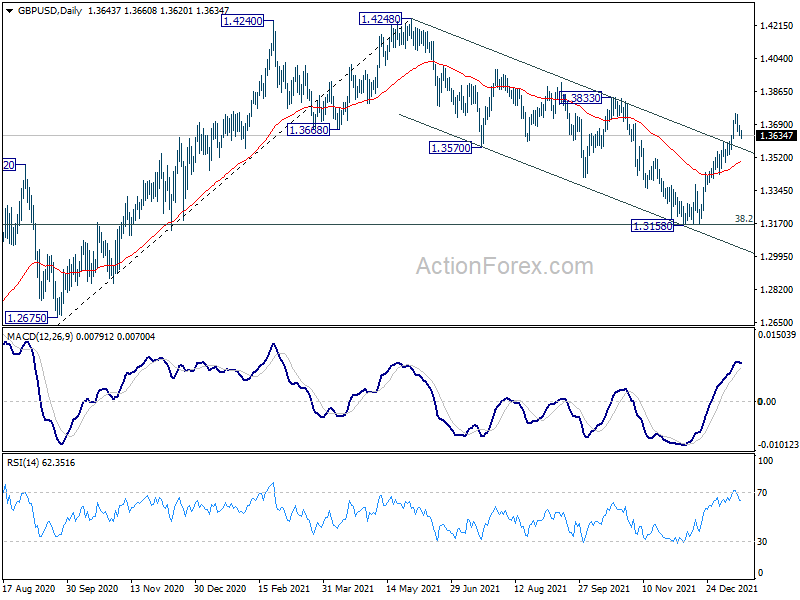
GBP/USD is staying in consolidation below 1.3748 and intraday bias remains neutral first. Downside of retreat should be contained by 1.3489 support to bring another rally. As noted before, corrective fall from 1.4282 should have completed with three waves down to 1.3158, after hitting 1.3164 medium term fibonacci level. Above 1.3748 will target 1.3833 first. Sustained break of 1.3833 will pave the way back to retest 1.4248 high.
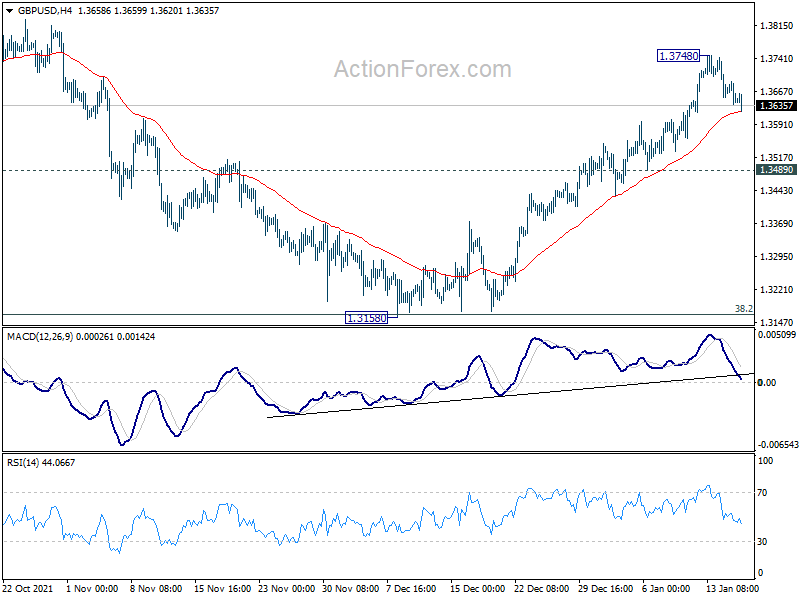
In the bigger picture, strong support was seen from 38.2% retracement of 1.1409 to 1.4248 at 1.3164. The development suggests that up trend from 1.1409 (2020 low) is still in progress. On resumption, next target will be 38.2% retracement of 2.1161 to 1.1409 at 1.5134. Nevertheless sustained break of 1.3164 will argue that whole rise from 1.1409 has completed and bring deeper fall to 61.8% retracement at 1.2493.
USD/CHF Daily Outlook
Daily Pivots: (S1) 0.9124; (P) 0.9141; (R1) 0.9161; More....
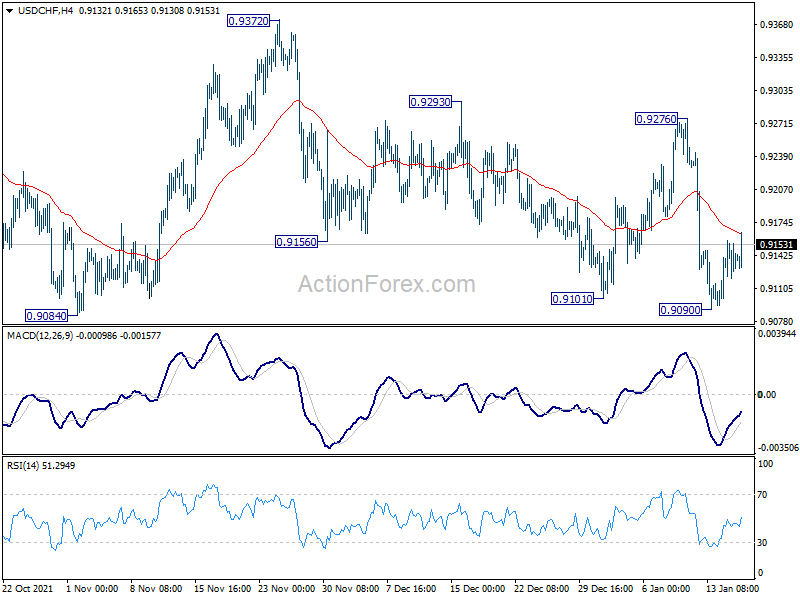
Intraday bias in USD/CHF as consolidation from 0.9090 is still in progress. On the downside, firm break of 0.9084 support will argue that choppy rise from 0.8925 has completed. Fall from 0.9471 might be ready to resuming. Further decline would be seen back to 0.8925 support first. On the upside, above 0.9276 will target 0.9372 resistance instead.
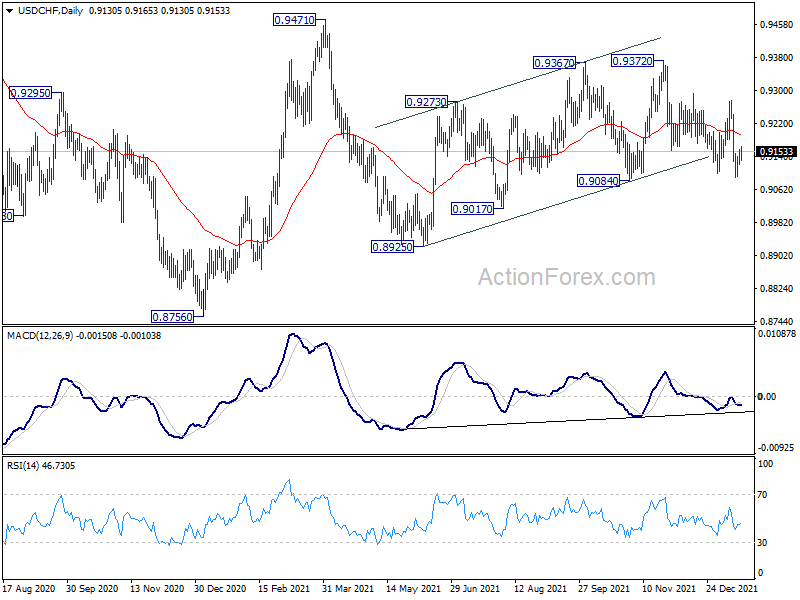
In the bigger picture, the corrective structure of the rebound from 0.8925 argues that fall from 0.9471 is not complete yet. It could either be the second leg of pattern from 0.8756 (2021 low), or resuming larger down trend from 1.0237 (2018 high). We'd pay attention to the downside momentum and assess the odds later. But for now, medium term outlook will be neutral at best as long as 0.9471 resistance holds.
Technical Outlook and Review
DXY:
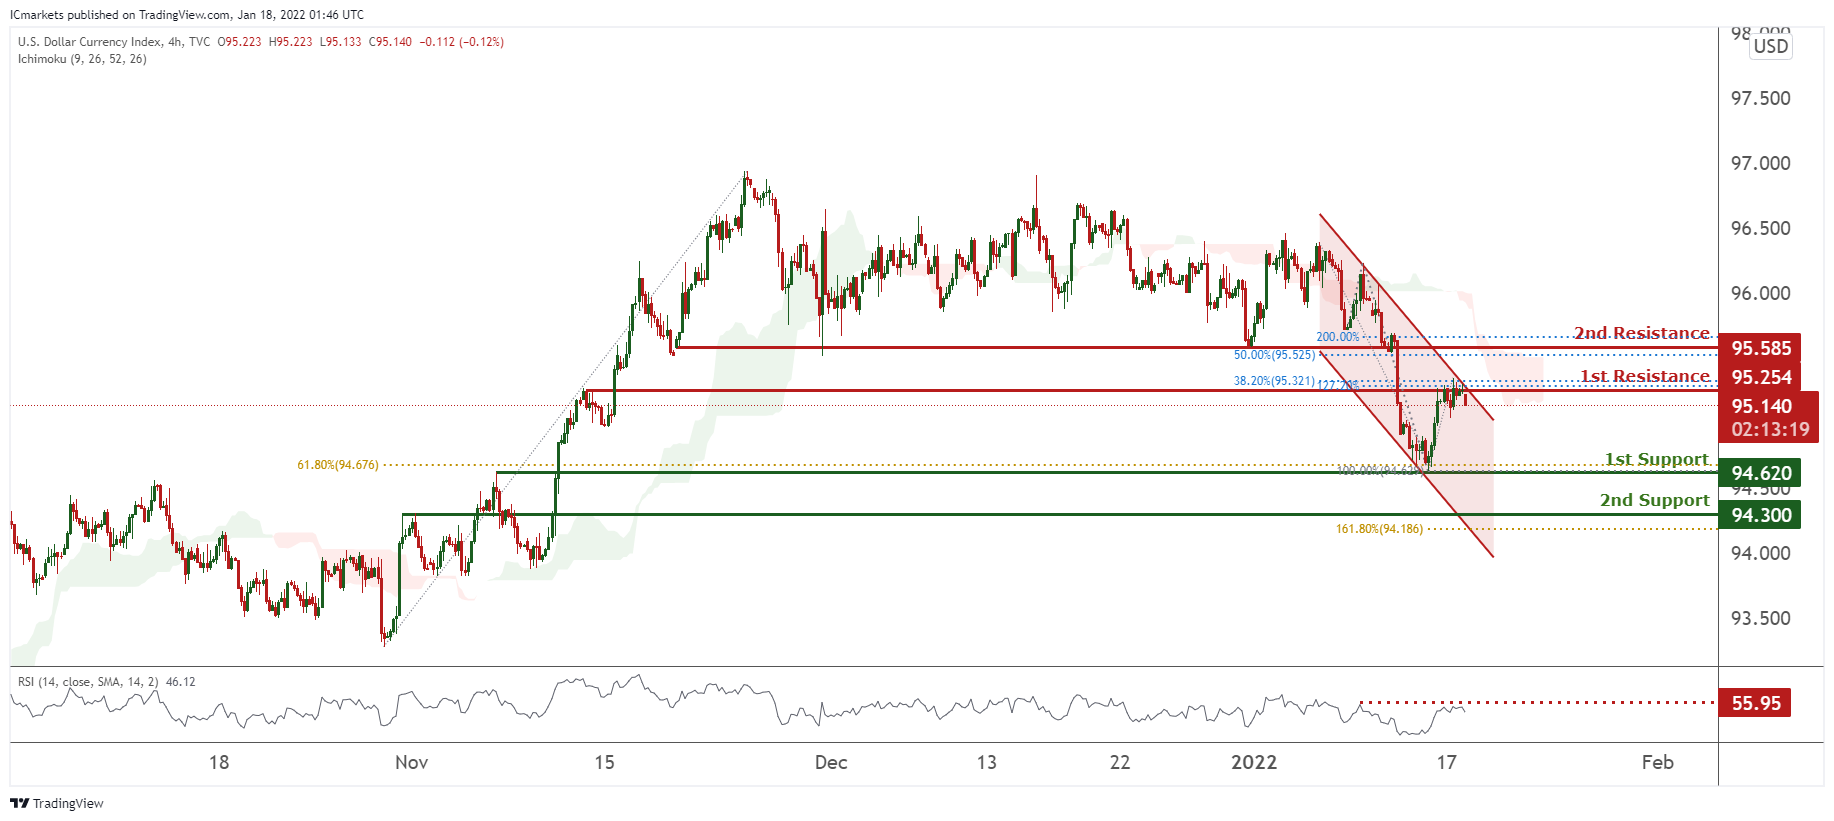
On the H4 timeframe, price is consolidating in a descending channel and is on bearish momentum. We expect a dip from our 1st resistance at 95.254 towards our 1st support at 94.620 in line with 100% Fibonacci retracement and 61.8% Fibonacci retracement. RSI is at a level where dips previously occurred and prices are trading below ichimoku clouds, further supporting our bearish bias.
Areas of consideration:
- H4 time frame, 1st resistance at 95.254
- H4 time frame, 1st support at 94.620
XAU/USD (GOLD):
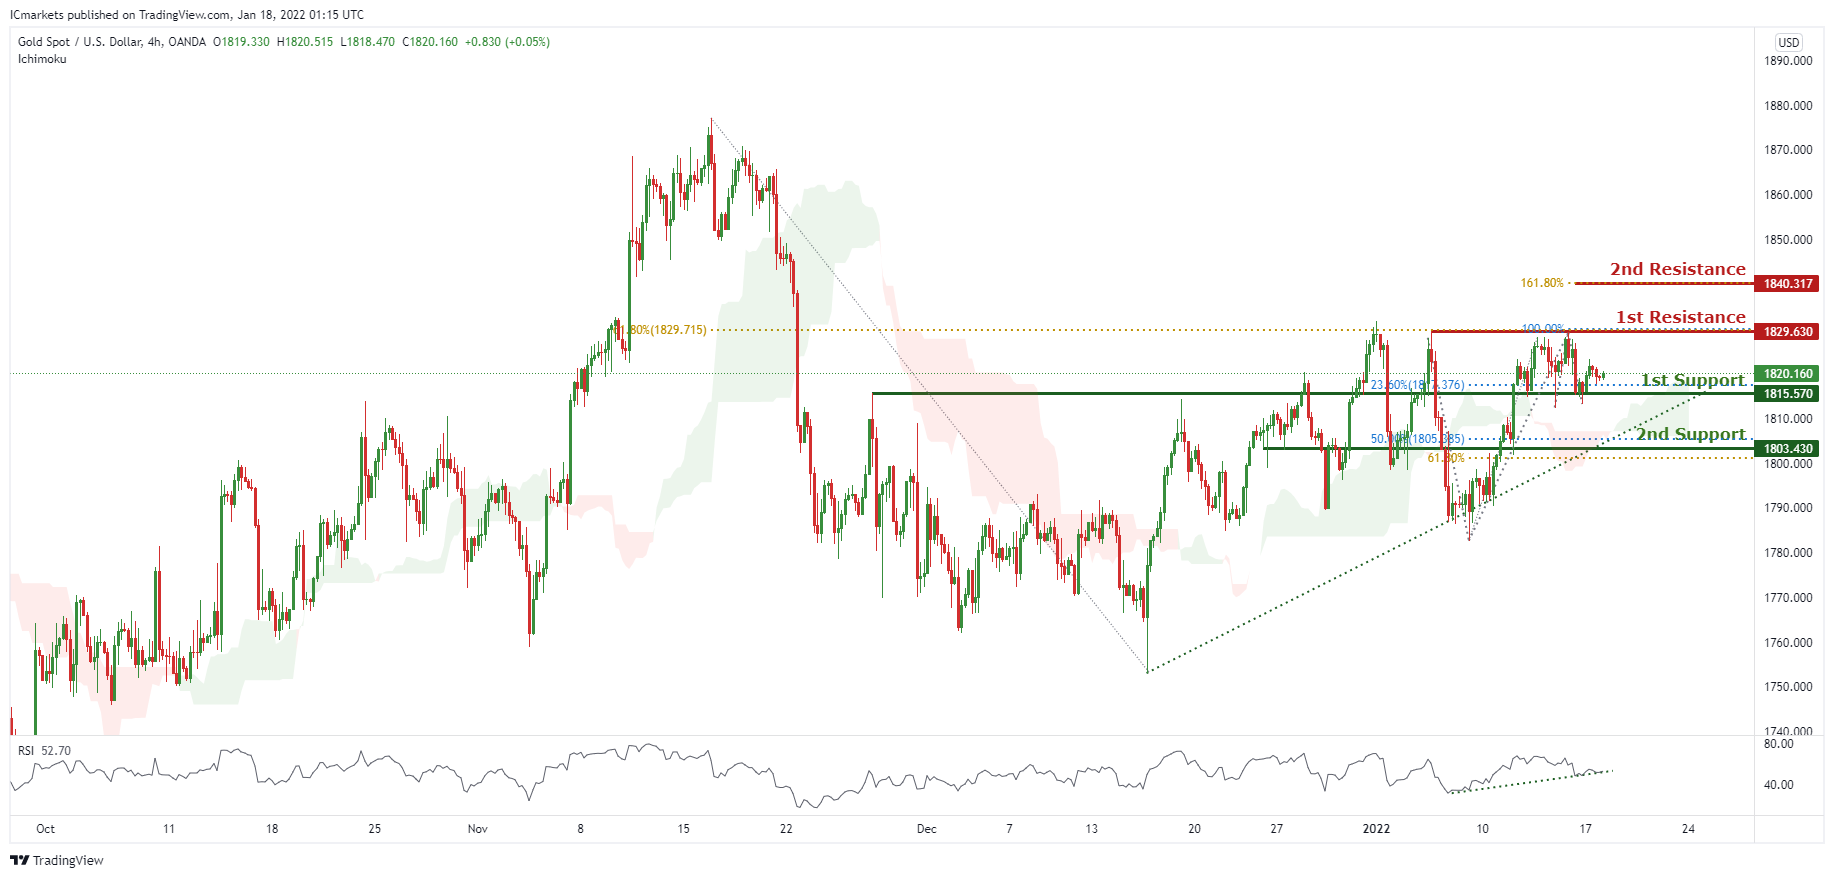
On the H4, prices are on bullish momentum and abiding to our ascending trendline. We see the potential for a bounce from our 1st support at 1815.570 in line with 23.6% Fibonacci retracement towards our 1st resistance at 1829.630 in line with 100% Fibonacci extension and 61.8% Fibonacci retracement. Prices are trading above ichimoku clouds and RSI are showing bullish momentum, further supporting our bullish bias.
Areas of consideration:
- 4h 1st support at 1815.570
- 4h 1st resistance at 1829.63
GBP/USD
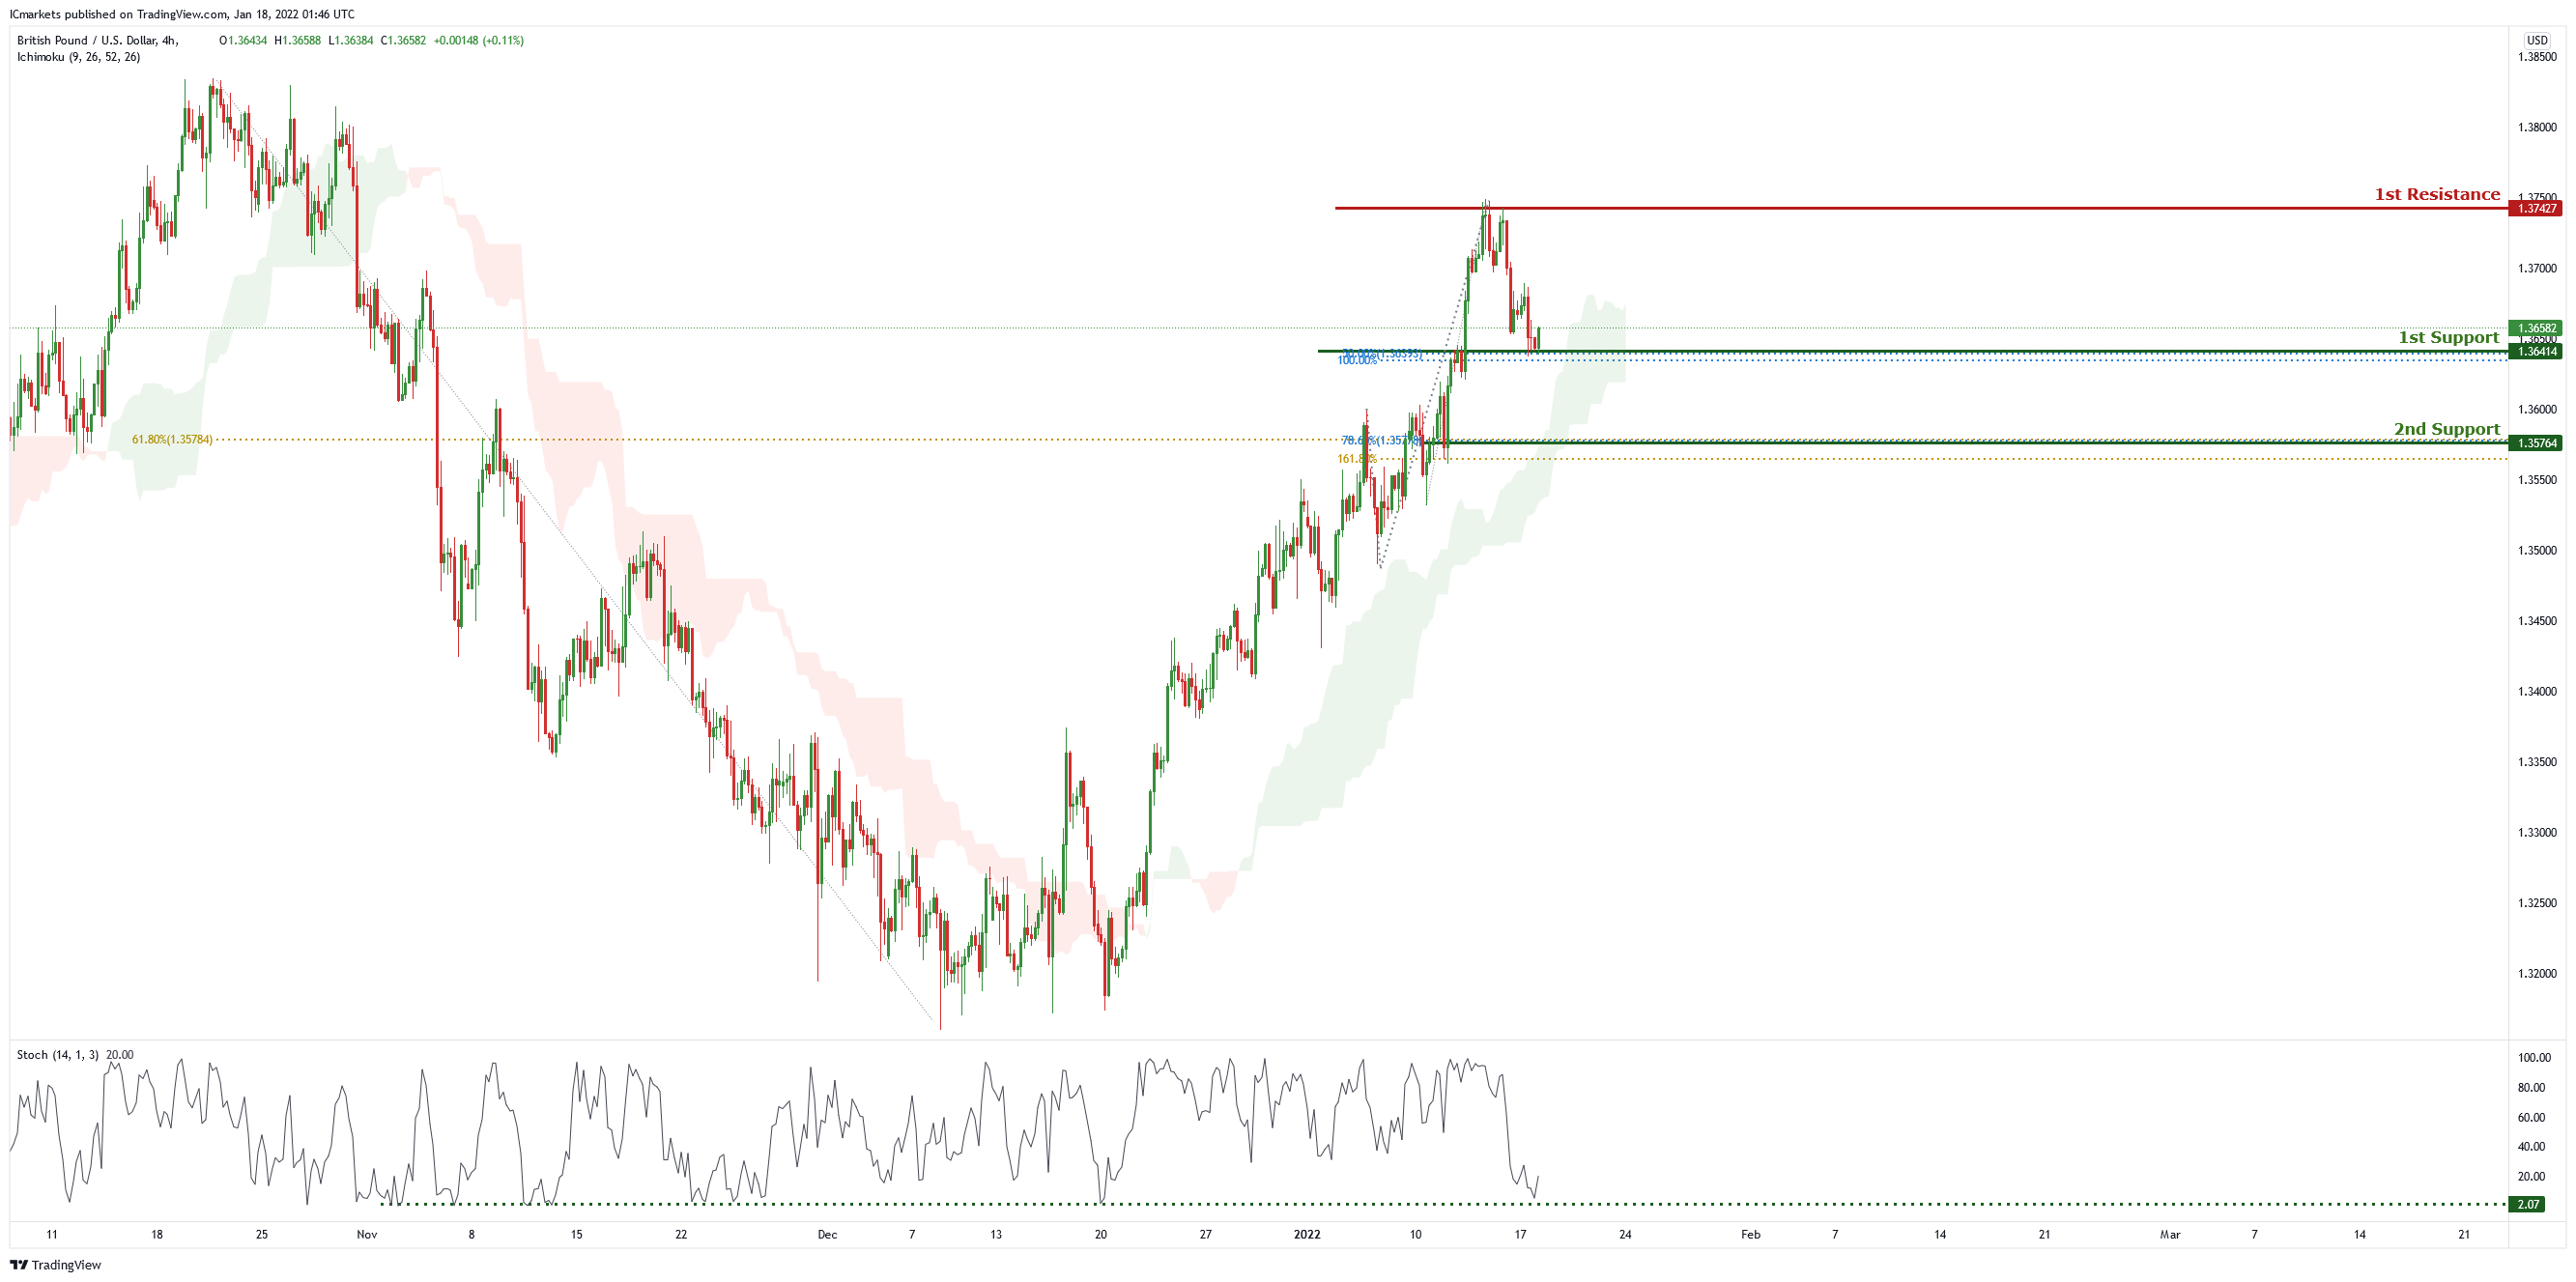
On the H4 chart price and near the first support level of 1.36414 which is also 50% Fibonacci retracement and 100% Fibonacci projection . Price can potentially go to the 1st resistance level of 1.37427 which is the graphical swing high level. Our bullish bias is supported by the ichimoku cloud indicator as price is trading above it and stochastic indicator as it is at support level.
Areas of consideration:
- H4 1st resistance at 1.37427
- H4 1st support 1.36414
USD/CHF
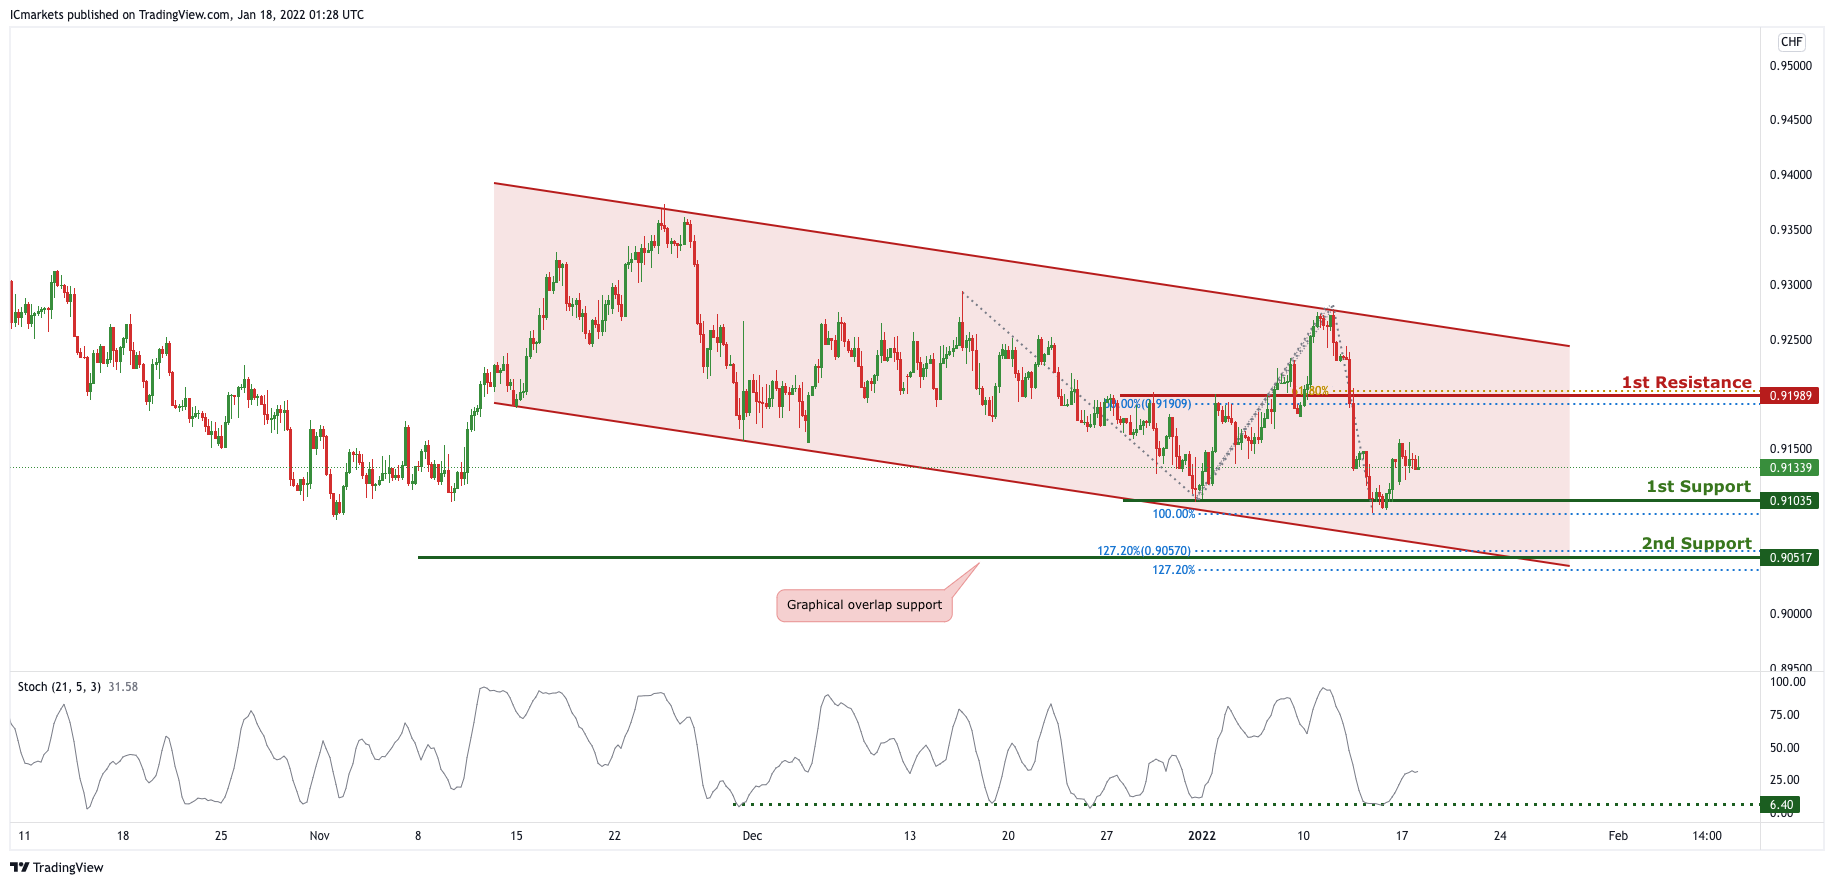
On the H4 timeframe, price is abiding to a descending channel, signifying a bearish momentum. Price is approaching a support level, we can expect price to make a short-term bullish bounce in line with 78.6% Fibonacci Projection and 161.8% Fibonacci retracement towards 1st Resistance in line with 78.6% Fibonacci projection. Our short-term bullish bias is further supported by the stochastic indicator where the %K line is approaching the support level.
Areas of consideration:
- Watch 1st Support at 0.91113
- Watch 1st Resistance at 0.92698
EUR/USD :
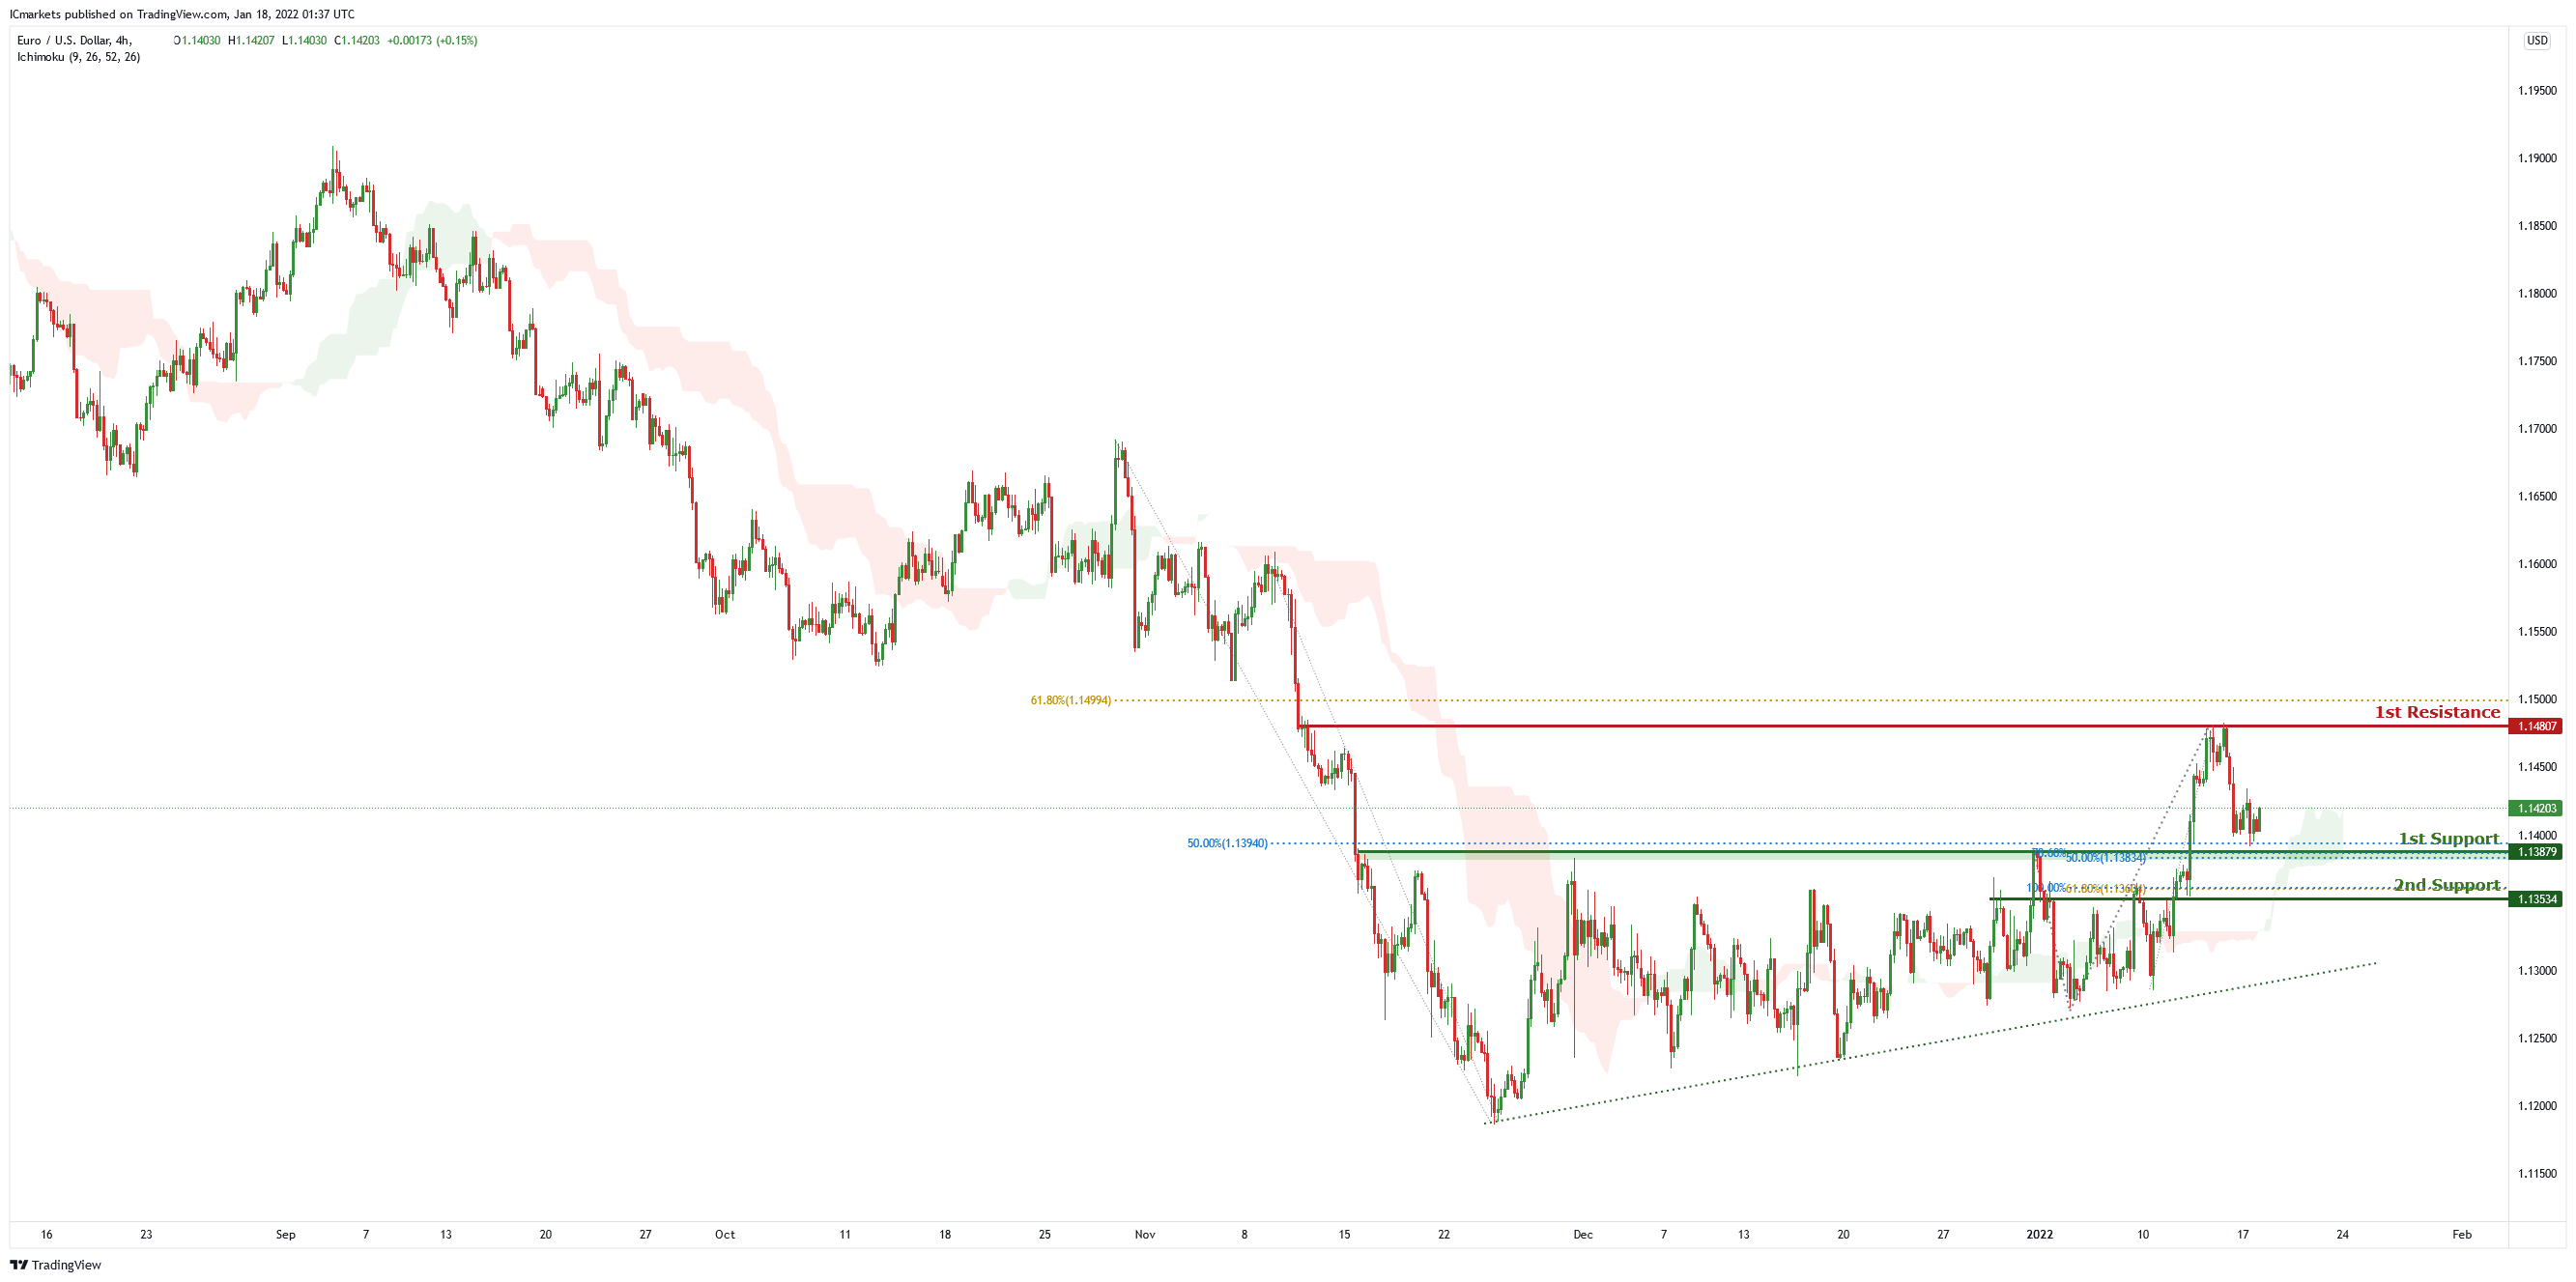
On the H4 chart , price is abiding by an ascending trendline and is near 1st support level of 1.13879 which is also 78.6% Fibonacci projection and 50% Fibonacci retracement. Price can potentially go to the 1st resistance level of 1.14807 which is also 61.8% Fibonacci retracement. Our bullish bias is supported by the ichimoku cloud indicator as price is trading above it.
Areas of consideration:
- H4 1st resistance at 1.14807
- H4 1st support at 1.13879
USD/JPY
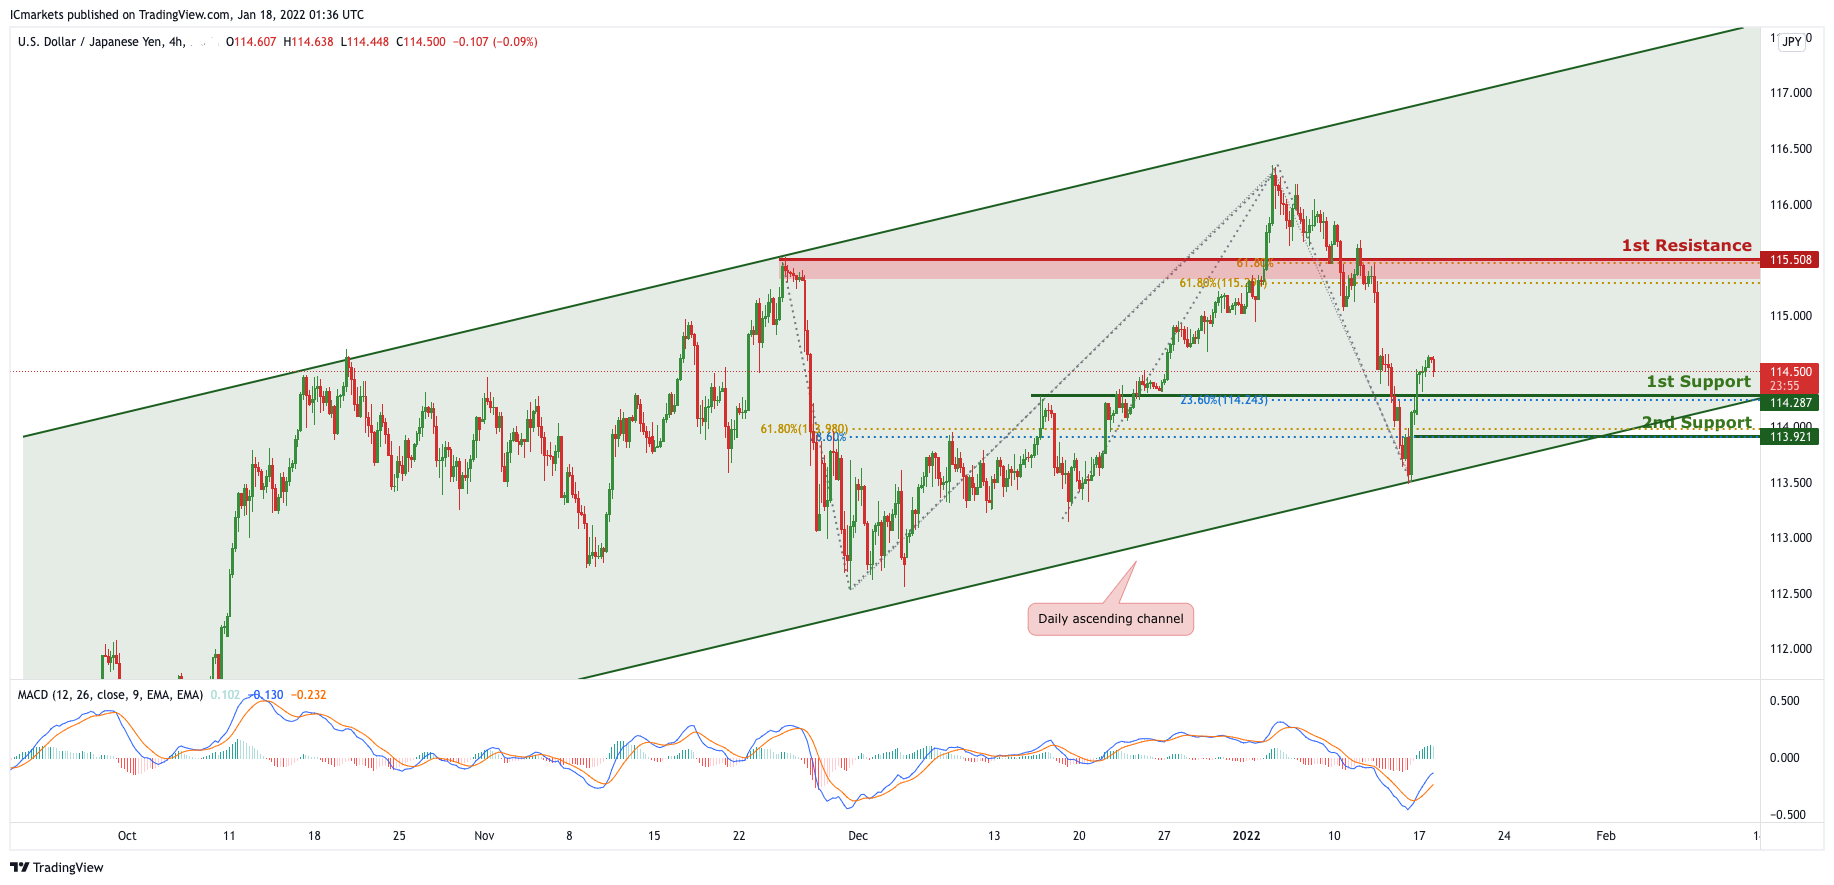
On the H4 timeframe, is abiding to the ascending channel on the daily, signifying an overall bullish momentum. We can now expect price to push higher from 1st Support in line with 23.6% Fibonacci retracement and graphical overlap support towards 1st Resistance in line with 61.8% Fibonacci projection and 61.8% Fibonacci retracement. Our bullish bias is further supported by the MACD indicator where the MACD line crossed above the signal line and both lines are in the oversold area.
Areas of consideration:
- H4 1st resistance level 115.508
- H4 1st support level 114.287
AUD/USD:
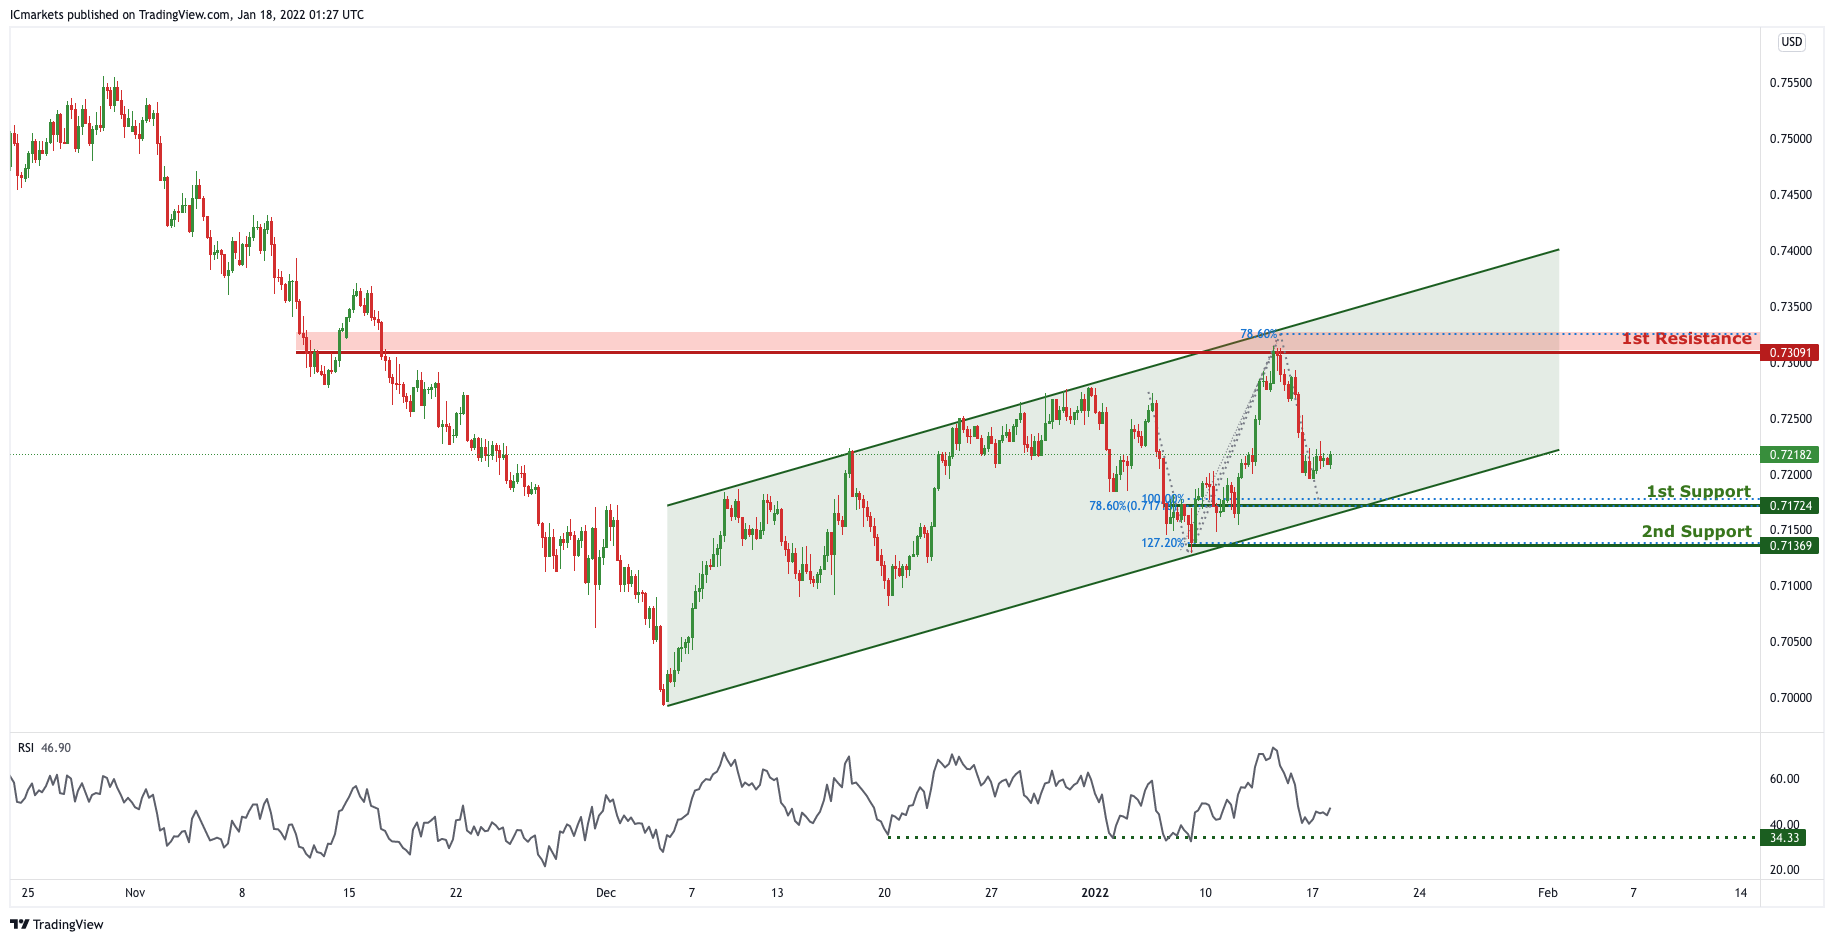
In reference to last week’s analysis, price indeed dropped to 1st Support @ 0.72023. On the H4, price is reacting within the ascending channel, signifying an overall bullish momentum. Price is approaching the 1st Support, we can expect to see price make a bullish bounce from 1st Support in line with 100% Fibonacci projection, 78.6% Fibonacci retracement and ascending channel support towards 1st Resistance in line with previous swing high and 78.6% Fibonacci projection. Our short-term bearish bias is further supported by the RSI indicator where it is approaching the support level.
Areas of consideration:
- H4 1st Support level 0.71724
- H4 1st resistance level 0.73091
NZD/USD:
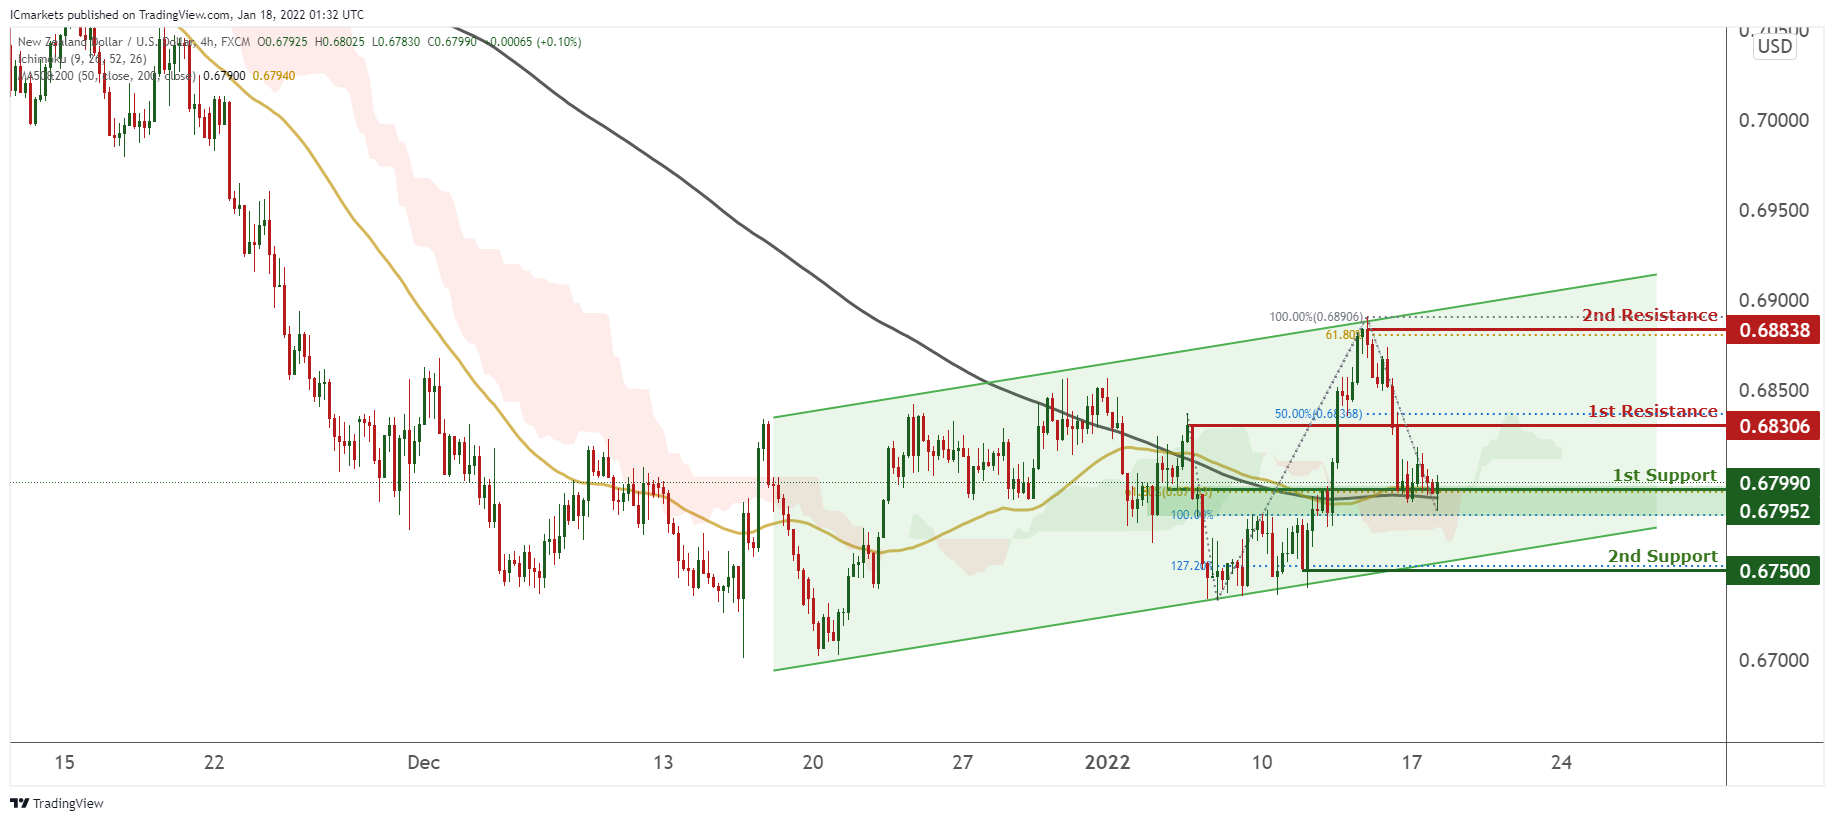
On the H4, prices are consolidating in an ascending channel and on bullish momentum. We see the potential for a bounce from our 1st support at 0.6799 towards our 1st resistance at 0.68306 in line with 50% Fibonacci retracement. Prices are trading above our MA 200 and MA 50, and also Ichimoku clouds, further supporting our bullish bias.
Areas of consideration:
- H4 time frame, 1st resistance at 0.68306
- H4 time frame, 1st support at 0.67990
USD/CAD:
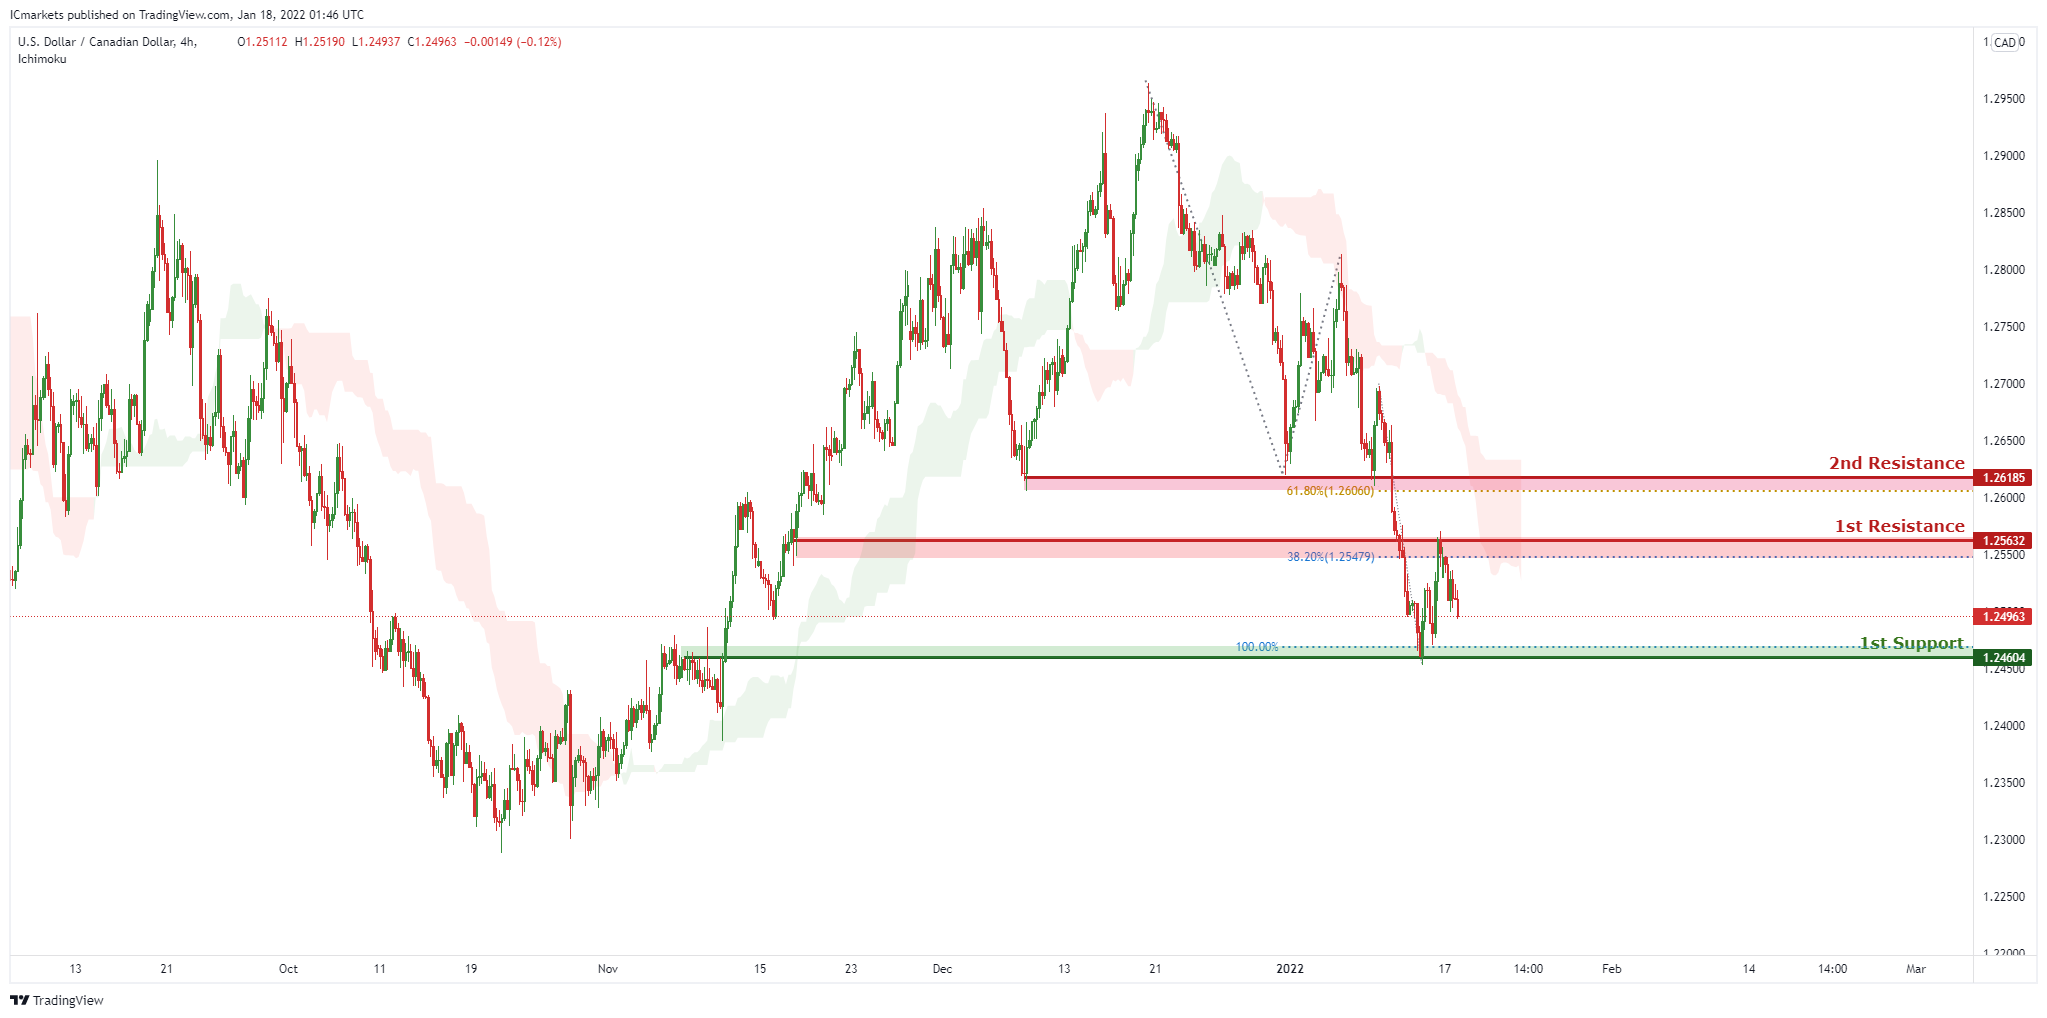
On the H4, with price moving below the ichimoku cloud, we have a bearish bias that price will from from our 1st resistance at 1.25632 which is in line with horizontal overlap resistance and 38.2% Fibonacci retracement to 1st support at 1.24604, which is in line with horizontal overlap support and 100% Fibonacci projection level. Alternatively, price may break 1st resistance structure and head for 2nd resistance at 1.26185, which coincides with horizontal overlap resistance and 61.8% Fibonacci retracement.
Areas of consideration:
- H4 time frame, 1st support at 1.24604
- H4 time frame, 1st resistance at 1.25479
OIL:
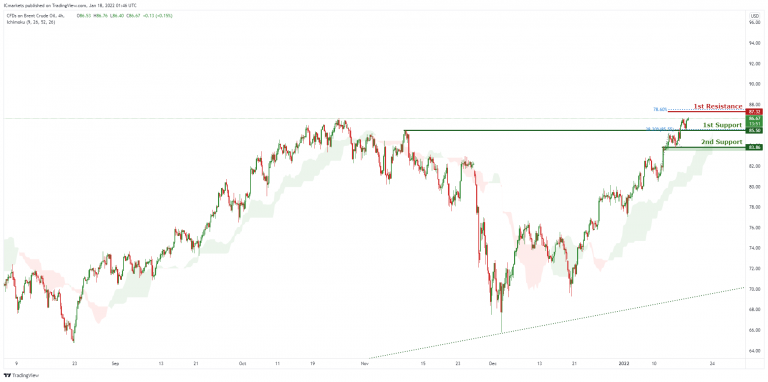
On the H4, with price moving above the ichimoku cloud, we have a bullish bias that price will rise to our 1st resistance at 87.32 which is in line with horizontal swing high resistance and 78.6% Fibonacci projection level from 1st support at 85.5, which is in line with horizontal overlap support and 38.2% Fibonacci retracement level. Alternatively, price may break 1st support structure and head for 2nd support at 83.86, which coincides with horizontal overlap support.
Areas of consideration:
- H4 time frame, 1st resistance of 87.32
- H4 time frame, 1st support of 85.5
Dow Jones Industrial Average:
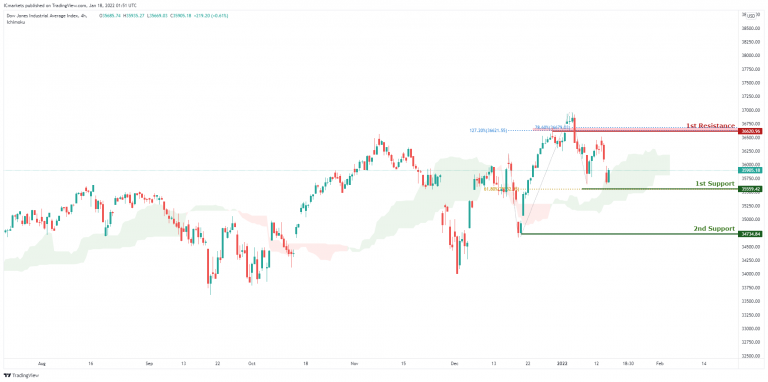
On the H4, with price moving above the ichimoku cloud, we have a bullish bias that price will rise to our 1st resistance at 36620 which is in line with horizontal swing high resistance and 78.6% Fibonacci retracement level and the 127.2% Fibonacci extension level from 1st support at 35559, which is in line with horizontal swing low support and 61.8% Fibonacci retracement level. Alternatively, price may break 1st support structure and head for 2nd support at 34734, which coincides with horizontal swing low support level.
Areas of consideration:
- H4 time frame, 1st resistance of 36620
- H4 time frame, 1st support of 35559
USD/JPY Daily Outlook
Daily Pivots: (S1) 114.29; (P) 114.47; (R1) 114.79; More...
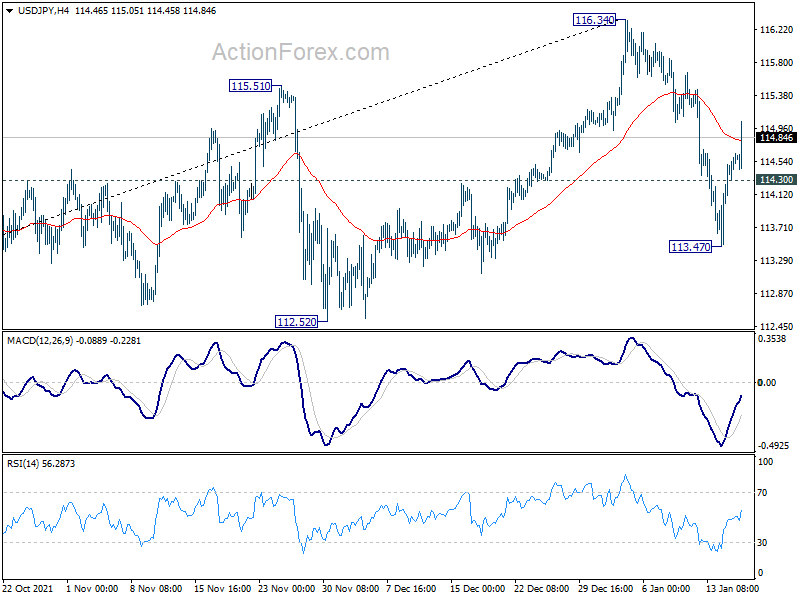
USD/JPY's rebound from 113.47 accelerated higher today. While further rise cannot be ruled out, we're not expecting a break of 116.34 for now. Instead, the corrective pattern from there should extend with another falling leg. On the downside, break of 114.30 minor support will turn bias to the downside for 113.47. Break there will target 112.52 structural support.
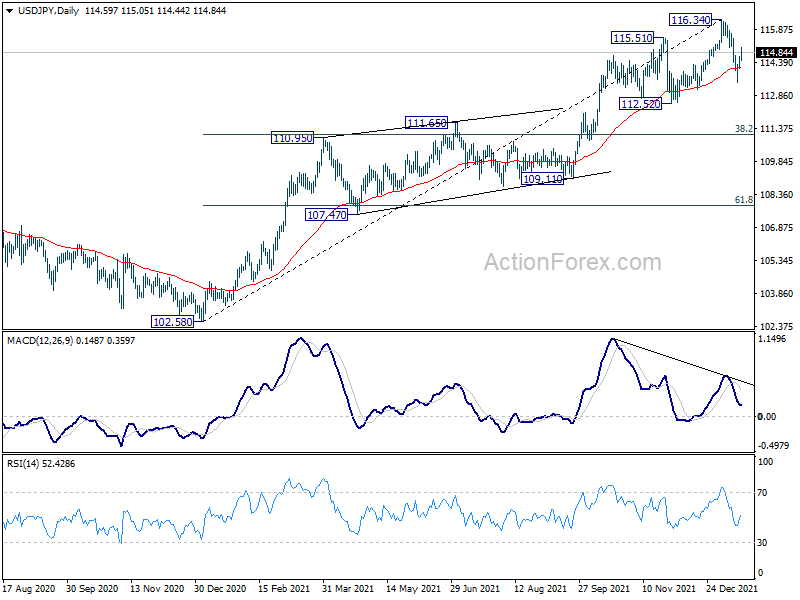
In the bigger picture, no change in the view that rise from 102.58 is the third leg of the up trend from 101.18 (2020 low). Such rally should target a test on 118.65 (2016 high). Sustained break there will pave the way to 120.85 (2015 high) and raise the chance of long term up trend resumption. However, firm break of 112.52 support will dampen this bullish case and we'll assess the outlook based on subsequent price actions later.
Dollar Surges on Rising Yield, Yen Dips after BoJ
Dollar is making a strong come back in Asian session today, as 10-year yield powers up to 1.85 level. Yen is under some selling pressure after BoJ stood pat as expected, and delivered little surprise other than upgrades in inflation forecasts. But Aussie and Kiwi are currently the weakest one. Canadian Dollar, on the other hand, in the second strongest, with WTI crude oil extending recent rise to 85 handle. European majors are mixed with Sterling having a slight upper hand.
Technically, Yen crosses are displaying a mixed picture. AUD/JPY and NZD/JPY look rather weak after initial post-BoJ spike. EUR/JPY and GBP/JPY also lack momentum to get through 131.39 and 157.74 resistance levels respectively. While USD/JPY's rebound from 113.47 accelerated, we're not expecting a break of 116.34 high soon. So, it looks like Yen crosses are to be avoided for now.
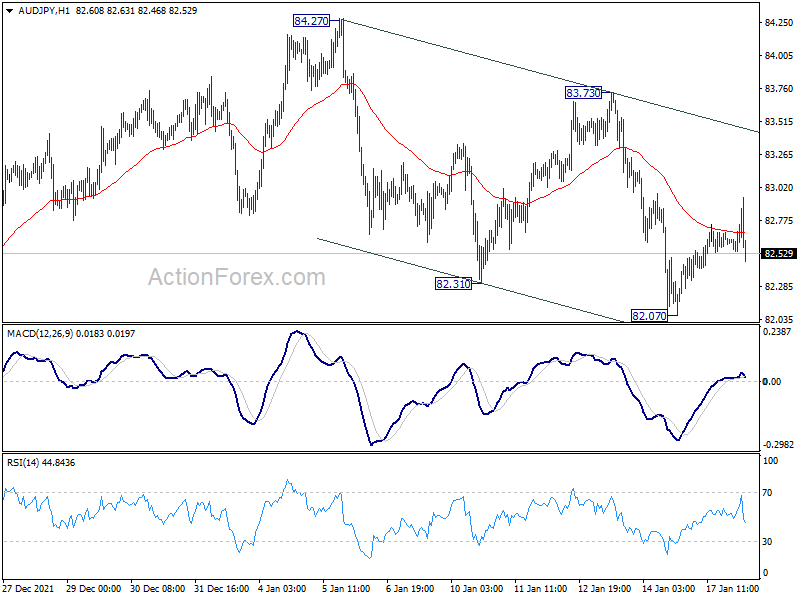
In Asia, at the time of writing, Nikkei is up 0.45%. Hong Kong HSI is down -0.14%. China Shanghai SSE is up 0.94%. Singapore Strait Times is up 0.22%. Japan 10-year JGB yield is up 0.0051 at 0.151. US 10-year yield is up 0.051 at 1.843.
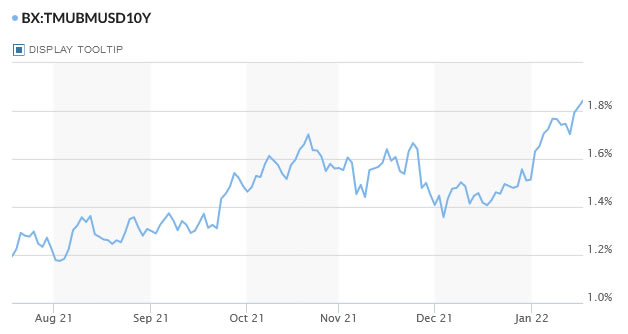
BoJ stands pat, upgrades 2022, 2023 inflation forecasts
BoJ left monetary policy unchanged. Under the yield curve control, short-term policy interest rate is held unchanged at -0.1%. BoJ will also buy a "necessary amount" of JGB bonds to keep 10-year yield at around 0%.
BoJ maintained the pledge to continue with QQE with yield curve control, "aiming to achieve the price stability target of 2 percent, as long as it is necessary for maintaining that target in a stable manner". It will also continue expanding the monetary base "until the year-on-year rate of increase in the observed consumer price index (CPI, all items less fresh food) exceeds 2 percent and stays above the target in a stable manner."
In the new economic projections, comparing to October forecasts:
- Fiscal 2021 real GDP growth downgraded from 3.4% to 2.8%.
- Fiscal 2022 real GDP growth upgraded from 2.9% to 3.8%
- Fiscal 2023 real GDP growth downgraded from 1.3% to 1.1%.
- Fiscal 2021 core CPI unchanged at 0.0%.
- Fiscal 2022 core CPI upgraded from 0.9% to 1.1%.
- Fiscal 2023 core CPI upgraded from 1.0% to 1.1%.
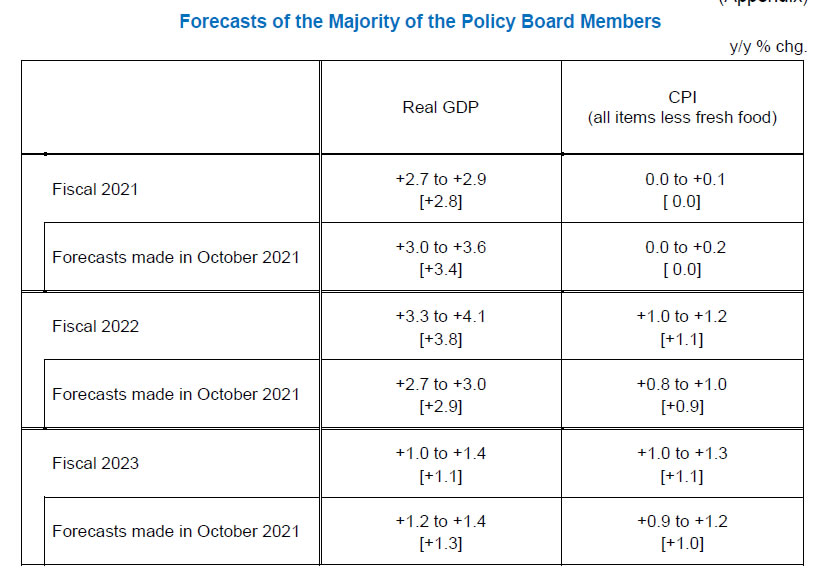
Downbeat New Zealand business confidence, strong inflation pressures
In the The latest NZIER Quarterly Survey of Business Opinion, a net 34.4% of New Zealand businesses expect a deterioration in general economic conditions over the coming months, much worse than prior quarter's 11.1%. Trading activity for the next three months dropped slightly from 8.7 to 8.3.
Regarding inflation, a net 61% reported increased costs in Q4, highest since 2008. A net 65% expect further increase in prices in the next quarter. NZIER said, "these results point to inflation pressures in the New Zealand economy remaining strong over the coming year."
Looking ahead
UK employment data will be a focus in European session while Germany ZEW economic sentiment is another. Swiss will release PPI while Italy will release trade balance. Later in the day, Canada housing starts, US Empire state manufacturing and NAHB housing index will be featured.
USD/JPY Daily Outlook
Daily Pivots: (S1) 114.29; (P) 114.47; (R1) 114.79; More...
USD/JPY's rebound from 113.47 accelerated higher today. While further rise cannot be ruled out, we're not expecting a break of 116.34 for now. Instead, the corrective pattern from there should extend with another falling leg. On the downside, break of 114.30 minor support will turn bias to the downside for 113.47. Break there will target 112.52 structural support.
In the bigger picture, no change in the view that rise from 102.58 is the third leg of the up trend from 101.18 (2020 low). Such rally should target a test on 118.65 (2016 high). Sustained break there will pave the way to 120.85 (2015 high) and raise the chance of long term up trend resumption. However, firm break of 112.52 support will dampen this bullish case and we'll assess the outlook based on subsequent price actions later.
Economic Indicators Update
| GMT | Ccy | Events | Actual | Forecast | Previous | Revised |
|---|---|---|---|---|---|---|
| 21:00 | NZD | NZIER Business Confidence Q4 | -28 | -11 | ||
| 03:00 | JPY | BoJ Rate Decision | -0.10% | -0.10% | -0.10% | |
| 04:30 | JPY | Industrial Production M/M Nov F | 7.00% | 7.20% | 7.20% | |
| 07:00 | GBP | ILO Unemployment Rate (3M) Nov | 4.20% | 4.20% | ||
| 07:00 | GBP | Average Earnings Including Bonus 3M/Y Nov | 4.20% | 4.90% | ||
| 07:00 | GBP | Average Earnings Excluding Bonus 3M/Y Nov | 3.80% | 4.30% | ||
| 07:00 | GBP | Claimant Count Change Dec | -38.6K | -49.8K | ||
| 07:30 | CHF | Producer and Import Prices M/M Dec | 0.40% | 0.50% | ||
| 07:30 | CHF | Producer and Import Prices Y/Y Dec | 5.80% | |||
| 09:00 | EUR | Italy Trade Balance (EUR) Nov | 4.23B | 3.89B | ||
| 10:00 | EUR | Germany ZEW Economic Sentiment Jan | 32.7 | 29.9 | ||
| 10:00 | EUR | Germany ZEW Current Situation Jan | -7.5 | -7.4 | ||
| 10:00 | EUR | Eurozone ZEW Economic Sentiment Jan | 29.2 | 26.8 | ||
| 13:15 | CAD | Housing Starts Dec | 234K | 301K | ||
| 13:30 | USD | Empire State Manufacturing Index Jan | 28 | 31.9 | ||
| 15:00 | USD | NAHB Housing Market Index Jan | 84 | 84 |
BoJ stands pat, upgrades 2022, 2023 inflation forecasts
BoJ left monetary policy unchanged. Under the yield curve control, short-term policy interest rate is held unchanged at -0.1%. BoJ will also buy a "necessary amount" of JGB bonds to keep 10-year yield at around 0%.
BoJ maintained the pledge to continue with QQE with yield curve control, "aiming to achieve the price stability target of 2 percent, as long as it is necessary for maintaining that target in a stable manner". It will also continue expanding the monetary base "until the year-on-year rate of increase in the observed consumer price index (CPI, all items less fresh food) exceeds 2 percent and stays above the target in a stable manner."
In the new economic projections, comparing to October forecasts:
- Fiscal 2021 real GDP growth downgraded from 3.4% to 2.8%.
- Fiscal 2022 real GDP growth upgraded from 2.9% to 3.8%
- Fiscal 2023 real GDP growth downgraded from 1.3% to 1.1%.
- Fiscal 2021 core CPI unchanged at 0.0%.
- Fiscal 2022 core CPI upgraded from 0.9% to 1.1%.
- Fiscal 2023 core CPI upgraded from 1.0% to 1.1%.
Downbeat New Zealand business confidence, strong inflation pressures
In the The latest NZIER Quarterly Survey of Business Opinion, a net 34.4% of New Zealand businesses expect a deterioration in general economic conditions over the coming months, much worse than prior quarter's 11.1%. Trading activity for the next three months dropped slightly from 8.7 to 8.3.
Regarding inflation, a net 61% reported increased costs in Q4, highest since 2008. A net 65% expect further increase in prices in the next quarter. NZIER said, "these results point to inflation pressures in the New Zealand economy remaining strong over the coming year."
GBP/USD Corrects Lower, UK Employment Report Next
Key Highlights
- GBP/USD rallied after it broke the 1.3500 resistance zone.
- A crucial bullish trend line is forming with support near 1.3610 on the 4-hours chart.
- EUR/USD corrected lower from the 1.1480 resistance zone.
- The UK ILO Unemployment rate could remain at 4.2% in Nov 2021 (3M).
GBP/USD Technical Analysis
This past week, the British Pound started a major increase after it cleared the 1.3500 resistance against the US Dollar. GBP/USD rallied above 1.3550 to move into a positive zone.
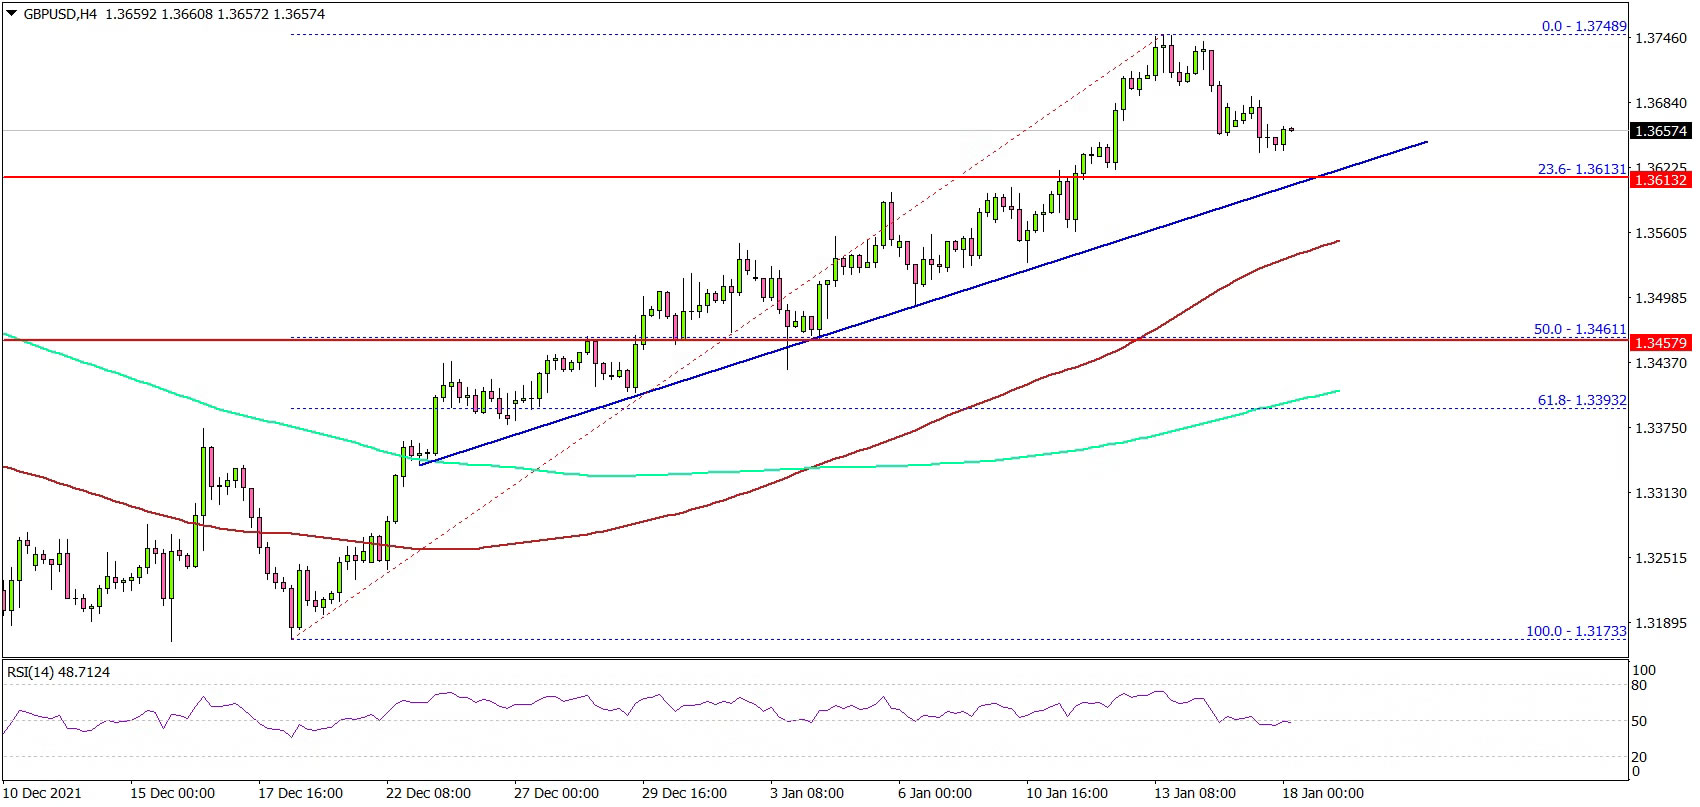
Looking at the 4-hours chart, the pair even gained pace above the 1.3650 level. There was a close above the 1.3600 level, the 100 simple moving average (red, 4-hours), and the 200 simple moving average (green, 4-hours).
The pair climbed above the 1.3700 level and traded as high as 1.3748. It is now correcting gains below 1.3700. It is now approaching the 23.6% Fib retracement level of the upward move from the 1.3173 low to 1.3748 high.
On the downside, an immediate support is near the 1.3620 level. There is also a crucial bullish trend line forming with support near 1.3610 on the same chart.
If there is a downside break, the pair could test the 1.3460 support. It is near the 50% Fib retracement level of the upward move from the 1.3173 low to 1.3748 high.
On the upside, the pair is facing resistance near 1.3700 level. The next major resistance is near the 1.3750 level, above which the pair could test 1.3880. Any more gains could send GBP/USD towards 1.4000.
Looking at EUR/USD, the pair gained strength above the 1.1450 level, but it faced sellers near 1.1480 and started a downside correction.
Economic Releases
- UK Claimant Count Change for Dec 2021 – Forecast -20K, versus -49.8K previous.
- UK ILO Unemployment Rate for Nov 2021 (3M) – Forecast 4.2%, versus 4.2% previous.
- German ZEW Business Economic Sentiment Index for Jan 2022 – Forecast 32.7, versus 29.9 previous.
3 Forex Pairs to Trade Right Now
The year started only a couple of weeks ago, but we already have a lot of fascinating movements in various trading instruments. To help you in trading, we choose several forex pairs that may surprise you and plunge greatly in a short period.
GBP/JPY
Japanese Yen is a haven asset, that’s no doubt. As a result, the currency strengthened amid omicron spread as investors have been trying to locate their funds in the most stable currencies, usually the Yen and Swiss Frank. As a result, the currency gained almost 2000 points against the GBP over the last week, but now we see bearish figures both technically and fundamentally.
From the fundamental side, Japan has around 0.5% inflation rate. It is much higher than a year ago (Japan is one of the countries with deflation, which means that the Yen tends to become more expensive with time). Nevertheless, 0.5% in Japan is hard to compare with almost 7% in the US or 5% in the EU. As a result, the Bank of Japan will likely keep its dovish tones. Add this to hawkish tones from other countries’ central banks, and you will get the idea. Fundamentally, without rates hikes, JPY looks weaker against other currencies.
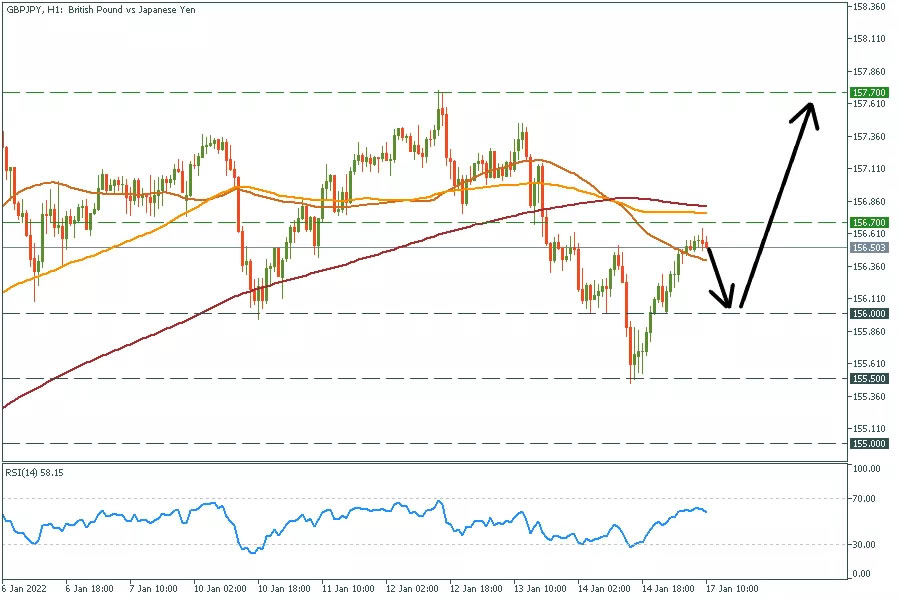
Technically we have an unfinished inversed head&shoulders pattern in GBP/JPY. It is a reversal pattern. Thus, we expect the GBP to rise against the Yen and reach 157.7 in the short term.
GBP/JPY H1 chart
Resistance: 156.70; 157.70
Support: 156.00; 155.50; 155.00
GBP/USD
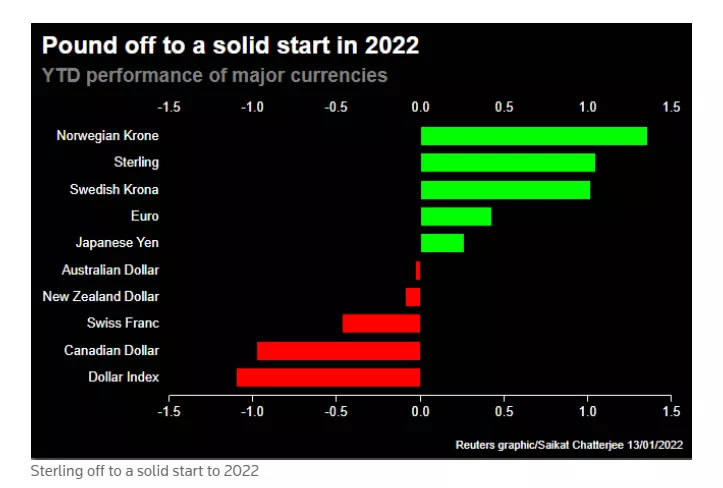
Not only is the Yen weak, but British Pound is solid this year. The currency shows incredible performance against other currencies year-to-date, and amid the weak dollar, we expect a surge in the GBP/USD.
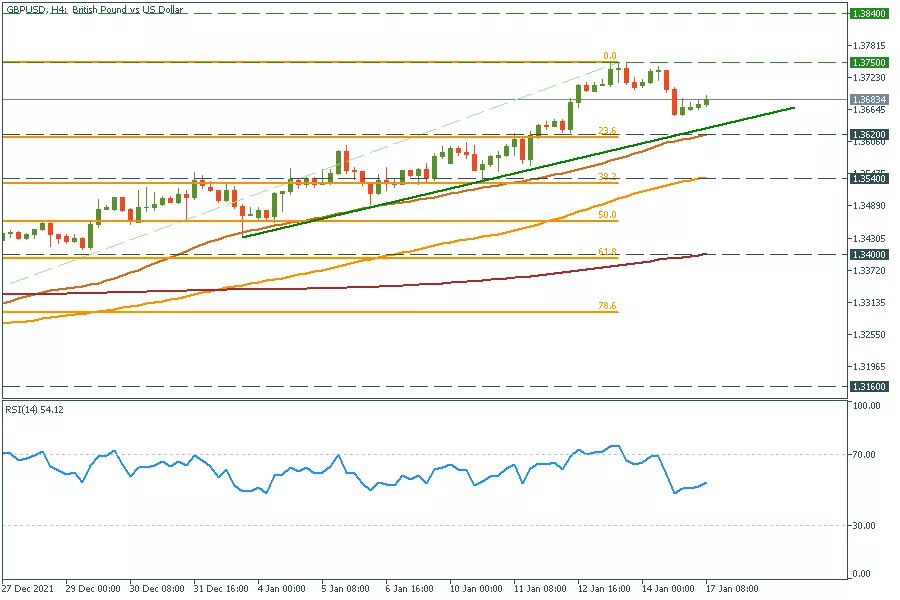
The rally in the pair needs some consolidation. However, technically we have no sell signals except for the RSI divergence. Thus, 1.3620 is a perfect place to put your buy orders.
GBP/USD H4 chart
Resistance: 1.3750; 1.3840
Support: 1.3620; 1.3540; 1.3400; 1.3160
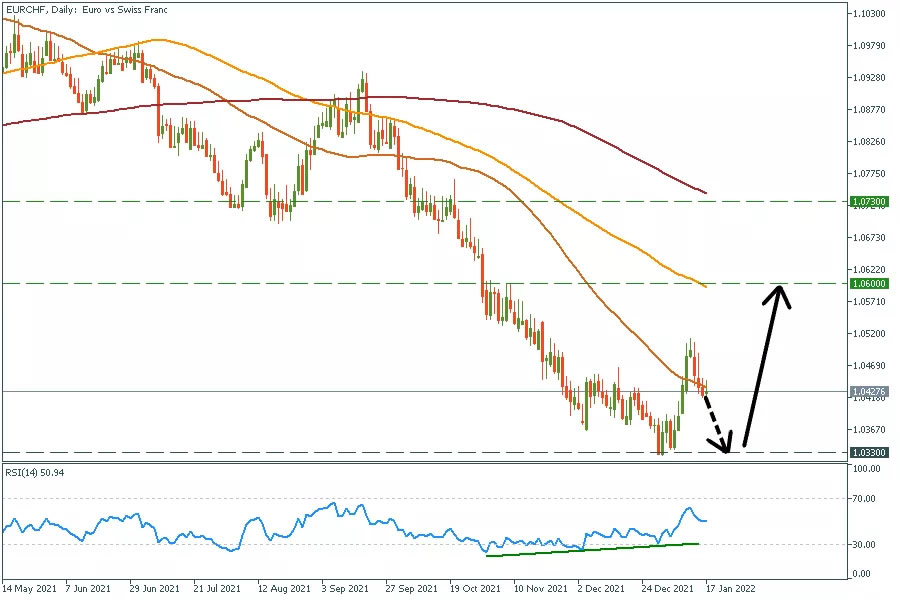
EUR/CHF
First, it is better to wait for ZEW economic sentiment on January 18, 12:00 GMT+2. This index represents the view of institutional investors and analysts on the current economic conditions. Thus, it will help the pair to determine the direction more accurately.
Despite the upcoming news, the Swiss Franc is another haven asset and tends to be weaker amid hawkish tones from the ECB. Technically we see multiple divergences on the RSI and a breakthrough of the 50-daily MA from below. The pair is now at its lowest from 2015. Thus, 1.0330 is the most solid resistance over there. We may see a double bottom reversal pattern and further bullish movement to at least 1.0600.
Resistance: 1.0600; 1.0730
Support: 1.0330