Sample Category Title
Crude Oil Prices Soar as Demand and Supply Imbalance Continues
The price of crude oil held steady close to a seven-year high as investors remained optimistic about the rising demand. Brent rose to $86.71, meaning that it has jumped by 10% this year. WTI, the American benchmark, rose to $84.78, which is 12% above where it started the year at. Some analysts believe that oil prices will rise to about $100 this year considering that demand is expected to rise at a faster pace than supplies. Therefore, there are concerns that rising oil prices will lead to higher inflation. Worse, the ongoing tensions between Russia and Western countries has led to higher natural gas prices also.
US futures rose slightly on Monday as the country’s market remained closed for the Martin Luther King holiday. Futures tied to the Dow Jones, S&P 500, and Nasdaq 100 index rose by about 0.15%. The same performance happened in Europe, where the DAX and CAC 40 indices turned higher. The biggest catalyst for these indices will be the latest corporate earnings. Some of the top companies that will publish their results today are Charles Schwab, Goldman Sachs, PNC Financial, Bank of New York, Interactive Brokers, and JB Hunt, among others.
The British pound declined slightly ahead of the important economic data from the United Kingdom. The Office of National Statistics (ONS) will publish the latest UK employment numbers. Economists polled by Reuters expect the data to show that the country’s unemployment rate declined to 4.1% in November while the number of claimant counts declined by over 38k in December. These numbers will come a few days after the ONS published strong GDP and manufacturing and industrial production data. On Wednesday, the UK will deliver the latest consumer inflation data.
GBPUSD
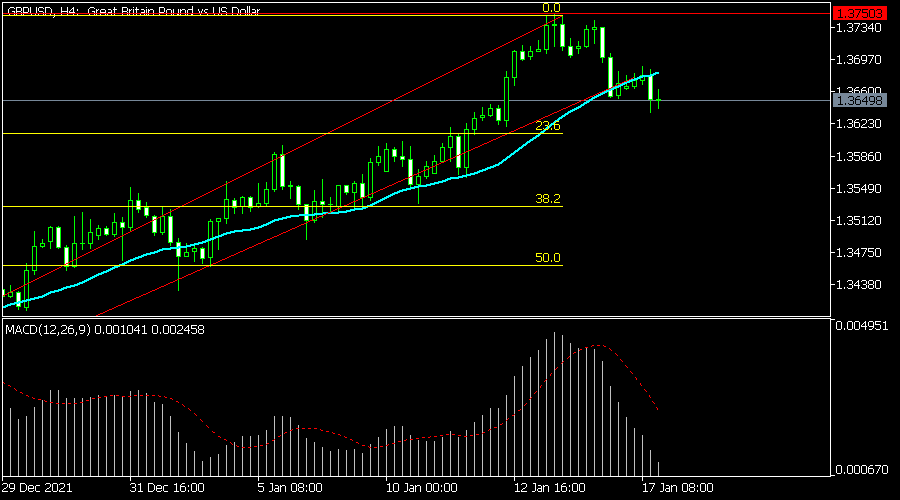
The GBPUSD pair continue falling in the overnight session ahead of important economic data from the UK. It is trading at 1.3645, which was a few pips below this year’s high of 1.3750. It managed to move below the ascending trendline shown in red. Most importantly, it declined below the 25-day moving average while the MACD has formed a bearish crossover pattern. Therefore, the pair will likely keep falling as bears target the 23.6% retracement level at 1.3600.
EURUSD
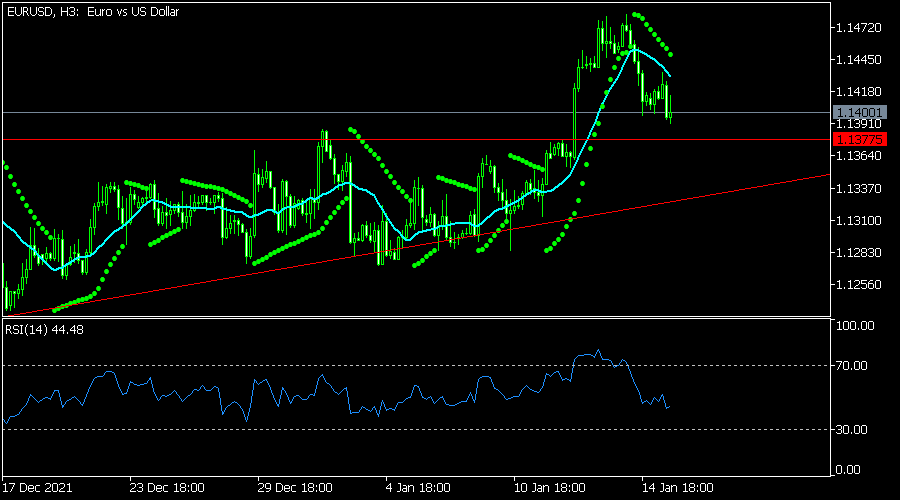
The EURUSD pair also turned lower as US dollar strength accelerated. On the three-hour chart, the pair moved below the 25-day moving average. It is slightly above the key support level at 1.1377, which it struggled moving above earlier this month. It also moved slightly below the dots of the parabolic SAR. Therefore, the pair will likely keep falling as bears target the support at 1.1377.
XBRUSD
The XBRUSD bullish trend accelerated as investors predicted the rising demand. The pair is trading at 85.47, which was the highest level since November last year. It moved above the 25-day and 50-day moving averages. The Relative Strength Index (RSI) continued rising and is now approaching its overbought level. The MACD has also kept rising. Therefore, the pair will likely keep rising as bulls target the key resistance at 90.

Oil Reaches the Highest Level Since 2014
Market movers today
On the data front we look for German ZEW for January, which could very well slip further due to the triple headwinds from COVID, eroding real income and supply side bottlenecks.
UK releases employment report where focus is on wage growth.
In Sweden, the Riksbank arranges an open forum on the relation between the inflation target and wage formation, where representatives from the labour union, employers union, researchers and, from the Riksbank, Per Jansson will participate. This is a very interesting and relevant topic, also for the financial markets, given the upcoming wage negotiations. Separately, Stefan Ingves is scheduled for a panel discussion on digital currencies, where he will probably not touch upon issues related to monetary policy.
This afternoon the US releases the first regional business survey for January with the Empire index.
The 60 second overview
Markets: After a quiet start to the week with US bond and equity markets closed yesterday this morning we have seen a renewed upward pressure on global yields driven by the USD curve. Most prominently the 2Y US Treasury yield has moved above 1% for the first time during the COVID-19 crisis as markets adjust to a base case of four 25bp rate hikes from the Fed this year. The big developed market equity indices are trading in red this morning with technology heavy indices such as the Nasdaq underperforming peers.
Oil price: While negative risk appetite and a stronger USD tends to be negative for commodities, this morning we have seen the Brent crude oil price move above USD 87/bbl. This is the highest level since 2014. Restricted global supply, renewed optimism on the mildness of Omicron and recent geopolitical tensions have been the primary drivers for the move higher in oil in recent weeks. Our base remains that the oil price will stabilise and eventually move lower later this year on a stronger USD, OPEC+ normalising supply and on the global economic policy tightening weighing on demand.
Steady Bank of Japan: As expected, there were no changes to the Bank of Japan policies this morning. They did, however, change the risk assessment on the outlook for prices from "skewed to the downside" to "balanced" for the first time since 2014 and revised up their inflation forecast to 1.1% for the fiscal year 2022 from 0.9%. We see no signs of discussions of a rate hike before the 2% inflation target is reached, as rumoured on Friday, something that could however also be addressed at the press conference (post the deadline of this report). With at least some of the risk of early tightening removed, JPY weakened somewhat around the time the BoJ decision was announced.
Equities: Equities started the week on a higher note in a relatively quiet session as US was closed for Martin Luther King Day. Some of the health care and tech stocks that have been lagging in the first two weeks of 2022 got a lift as US bond market also was closed yesterday. Asian markets are lower this morning just as US and Europe futures are pointing lower led by growth stocks.
Fixed income: There has been a modest rise in European bond yields on the back of the rising US yields, the curves flattened modestly between 10Y and 30Y and steepened modestly between 2Y and 10Y.
FX: It has been a quiet start to the week in FX markets with moves limited to less than 1 historical standard deviation across majors. Overnight the USD has rebounded with US markets returning from holiday while NZD, AUD and NOK have posted losses just shy of 0.5% vs the greenback.
Credit: Yesterday we saw continued modest widening in the synthetic indices, with iTraxx main some 0.6bp wider to 52.7bp and Xover 2.1bp wider to 259.2bp. The primary markets remain wide open exemplified by Heimstaden Bostad doing a two-trance EUR benchmark deal with a combined size of EUR1.2bn.
Energy Stocks Show Off as Oil Extends Rally
It was quiet session yesterday as the US stock and bond markets remained closed for bank holiday, while the European equities kicked off the week mostly in the positive, especially with the FTSE 100 leading gains in Europe thanks to the rising oil prices.
US crude advanced to the $85pb mark having gained close to 12% just since the start of the year. Supply struggles in some important oil producer countries like Angola, Nigeria and Libya, combined with exceptionally high natural gas prices continue pressuring crude prices higher. Meanwhile, the fact that the Covid-19 pandemic is now being labelled ‘endemic’ throws light to the end of the tunnel and gets the reopening-investors’ hopes up that the restrictions will soon be lifted, leaving the world economy with plenty of more room to recover.
So, the news is good for oil and energy stocks, whereas the steep and sustained rally in prices paves the way toward the $86pb, October and 7-year high, then to the $90pb.
In this respect, the reopening-focused FTSE 100 is now surfing on the positive energy vibe and is finally back to its pre-pandemic levels. The British energy stocks gained near 2.50% yesterday, although the banks were in the red due to the warnings that the rising inflation would eat into their profits even in an appetizing environment of higher interest rates.
Chicken & egg
And equities, especially the cyclical sectors, are the best place to seek a solid hedge against inflation, as they are partly responsible for the rising consumer prices.
Gold?
Rising inflation indirectly weakens the gold’s capacity of hedging against inflation, as it makes it a costly hedge due to the rising real yields. And the higher the inflation, the more aggressive the Fed hawks, and the steeper the rise in inflation.
The yellow metal is hovering a touch above its 50, 100 and 200-DMA zone, between the $1795 and $1810 band and could find it hard to sprint too high from here, as I also believe that the upside potential is somewhat seen capped by the $2000 mark, which also gives cold feet to those who seek safety in unnavigated waters, which makes the concept of safety a bit less safe, probably.
In the FX, well we all have been quite destabilized seeing the US dollar tank, while the expectation was a shiny, glorious year for the dollar. But the abnormally elevated level of long speculative positions is likely responsible for the latest dollar crash. The fundamentals remain supportive of a strong US dollar against most major peers, as the rifts open between an increasingly hawkish Fed and the others.
BoJ: A dream come true
The Bank of Japan raised its price outlook at today’s meeting, but the Japanese officials are rather happy that the global inflationary pressures will finally pull Japan out of a decades-long deflationary cycle. This is almost a dream coming true for Japan, which also means that the BoJ has no rush towards the easy-money policy exit.
The USDJPY should safely continue trending higher, even though the historical data shows that the USDJPY tends to move lower in periods of Fed tightening due to a broad ‘buy the rumour, sell the fact’ behaviour that flips the price action and leads to a softer dollar versus the yen when the tightening actually starts. But for now, the USDJPY is preparing an attempt toward the 116-118 region, with a solid positive trailing 100-dma support, that is near the 113 mark.
GBP/JPY Daily Outlook
Daily Pivots: (S1) 156.07; (P) 156.39; (R1) 156.70; More...
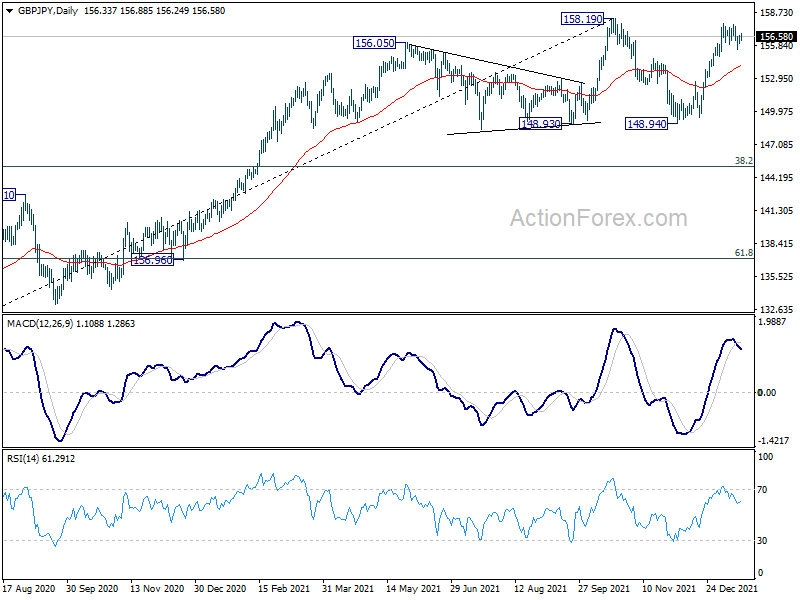
GBP/JPY is staying in consolidation from 157.74 and intraday bias remains neutral. Overall, further rise is still expected with 154.86 support intact. On the upside, decisive break of 158.19 high will resume larger up trend to 167.93 long term fibonacci level. On the downside, below 154.86 minor support will turn intraday bias back to the downside for deeper pull back.
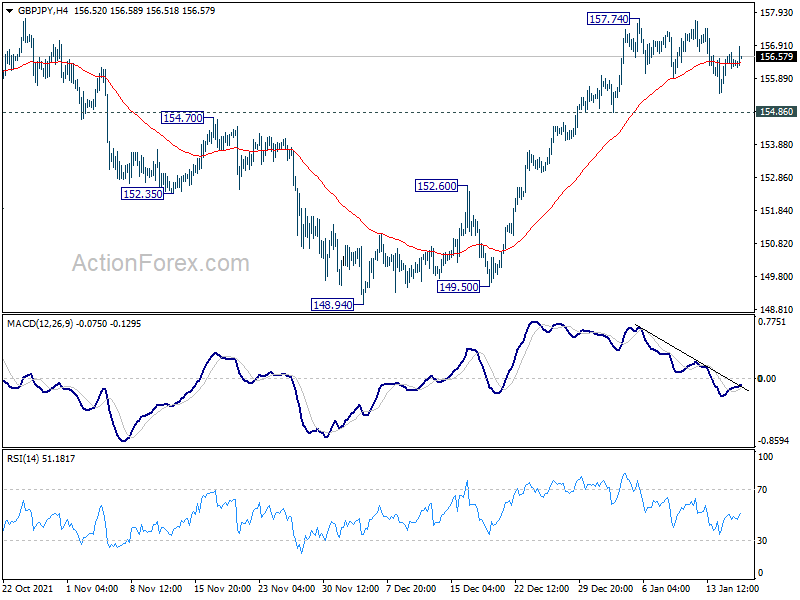
In the bigger picture, strong rebound from 148.93 key structural support retains medium term bullishness. Firm break of 158.19 high will resume whole up trend from 123.94 (2020 low), to 61.8% retracement of 195.86 to 122.75 at 167.93. Nevertheless, firm break of 148.93 will bring deeper correction to 38.2% retracement of 123.94 to 158.19 at 145.10, and possibly further lower, as a correction to up trend from 123.94 at least.
EUR/JPY Daily Outlook
Daily Pivots: (S1) 130.41; (P) 130.62; (R1) 130.92; More....
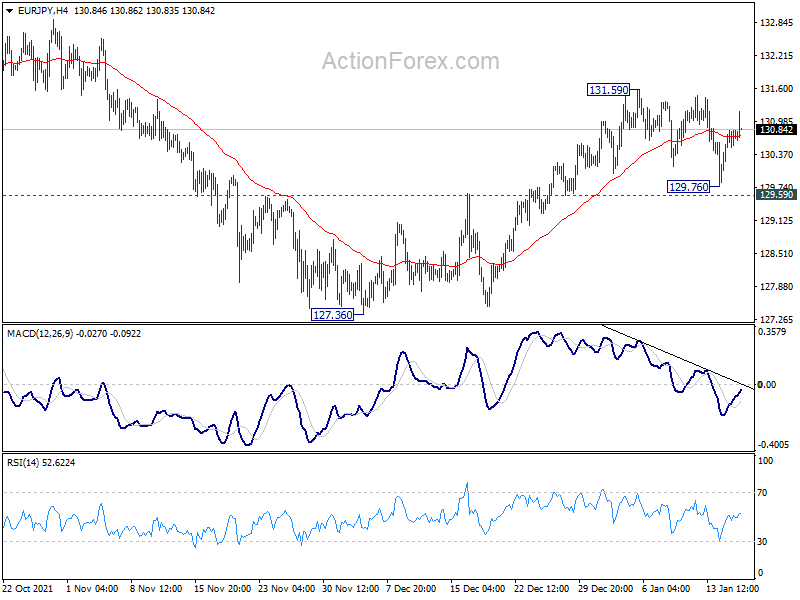
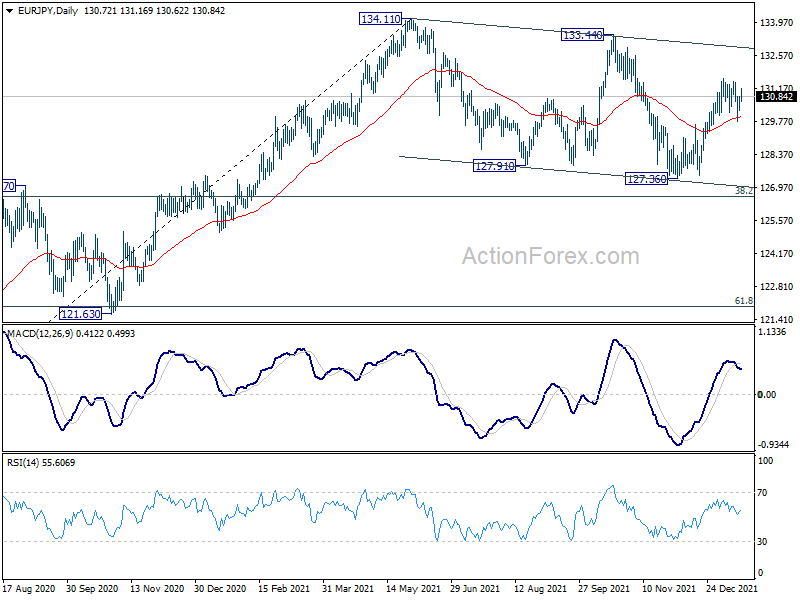
EUR/JPY is staying in consolidation form 131.59 and intraday bias remains neutral first. On the upside, break of 131.59 resistance will reaffirm the bullish case that consolidation from 134.11 could have completed with three waves down to 127.36, ahead of 126.58 medium term fibonacci level. Further rally would then be seen to retest 133.44/134.11 resistance zone. On the downside break of 129.59 minor support will argue that rebound from 127.36 has completed and turn bias back to the downside for this support.
In the bigger picture, as long as 38.2% retracement of 114.42 (2020 low) to 134.11 at 126.58 holds, up trend from 114.42 is still in favor to continue. Break of 134.11 will target long term resistance at 137.49 (2018 high). However, sustained break of 126.58 will raise the chance of medium term bearish reversal. In this case, deeper decline would be seen to 61.8% retracement at 121.94, and possibly below.
EUR/GBP Daily Outlook
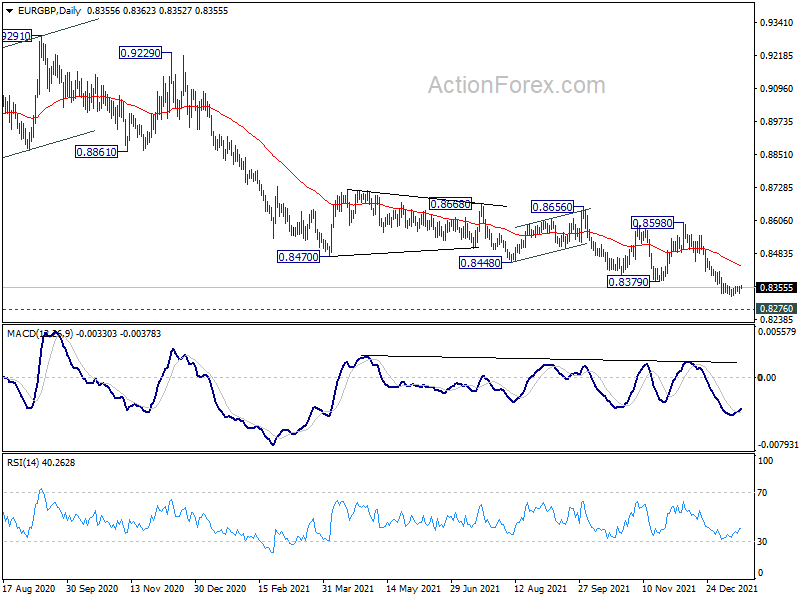
Daily Pivots: (S1) 0.8347; (P) 0.8355; (R1) 0.8367; More...
EUR/GBP is staying in consolidation from 0.8322 and intraday bias remains neutral first. Upside of recovery should be limited by 0.8417 resistance to bring another decline. On the downside, break of 0.8322 will resume recent down trend to 0.8276 key long term support. On the upside, however, above 0.8417 will turn bias back to the upside for stronger rebound.
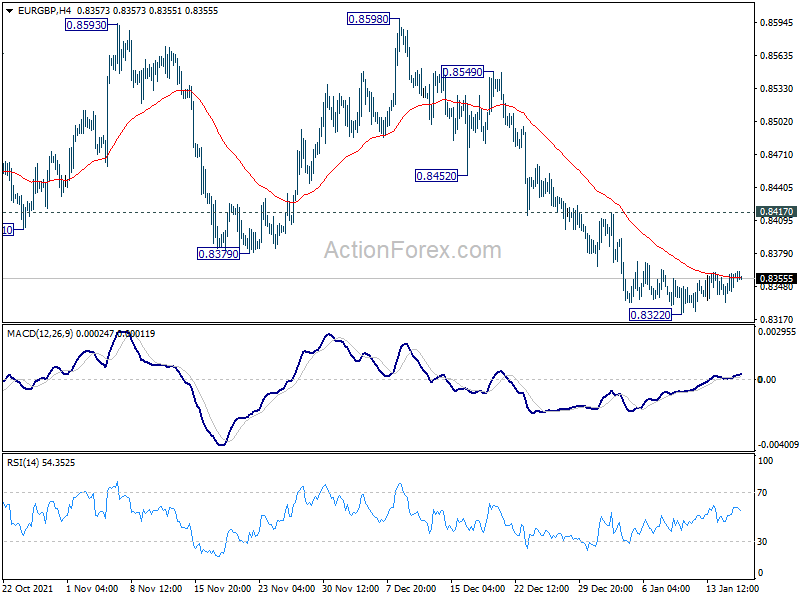
In the bigger picture, price actions from 0.9499 (2020 high) are still seen as developing into a corrective pattern. Deeper fall could be seen as long as 0.8598 resistance holds, towards long term support at 0.8276. We'd look for bottoming signal around there to bring reversal. Meanwhile, firm break of 0.8598 will now be an early sign of medium term bottoming and bring stronger rebound. However, sustained break of 0.8276 will argue that the long term trend has reversed.
EUR/AUD Daily Outlook
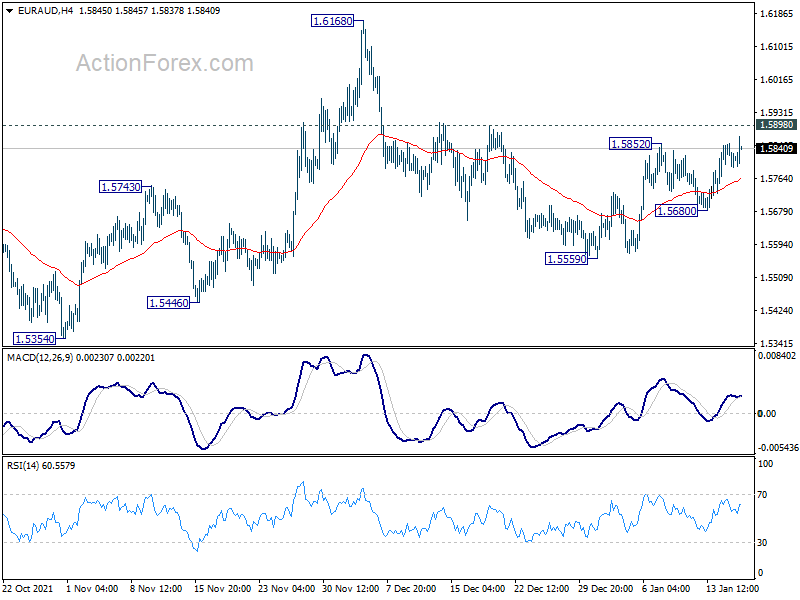
Daily Pivots: (S1) 1.5790; (P) 1.5823; (R1) 1.5851; More...
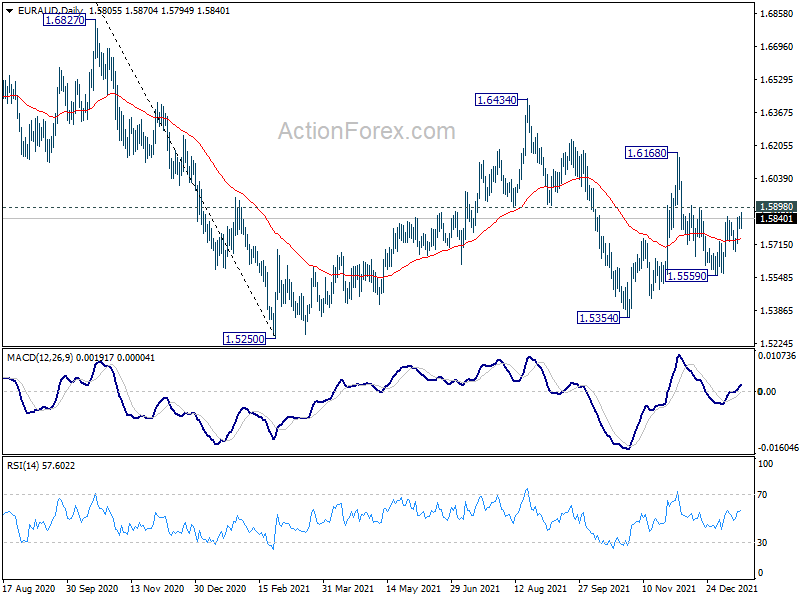
Outlook in EUR/AUD is unchanged and intraday bias stays neutral first. On the downside, break of 1.5559 will resume the fall from 1.6168 to retest 1.5250/5354 support zone. On the upside, however, break of 1.5898 will argue that pull back from 1.6168 has completed. Intraday bias will be back to the upside for 1.6168 resistance.
In the bigger picture, rise from 1.5354 is seen as the third leg of the corrective pattern from 1.5250 low. Further rise cannot be ruled out, but even in that case, strong resistance should be seen at 38.2% retracement of 1.9799 to 1.5250 at 1.6988. Larger down trend from 1.9799 is in favor to extend through 1.5250 at a later stage.
EUR/CHF Daily Outlook
Daily Pivots: (S1) 1.0416; (P) 1.0431; (R1) 1.0442; More....
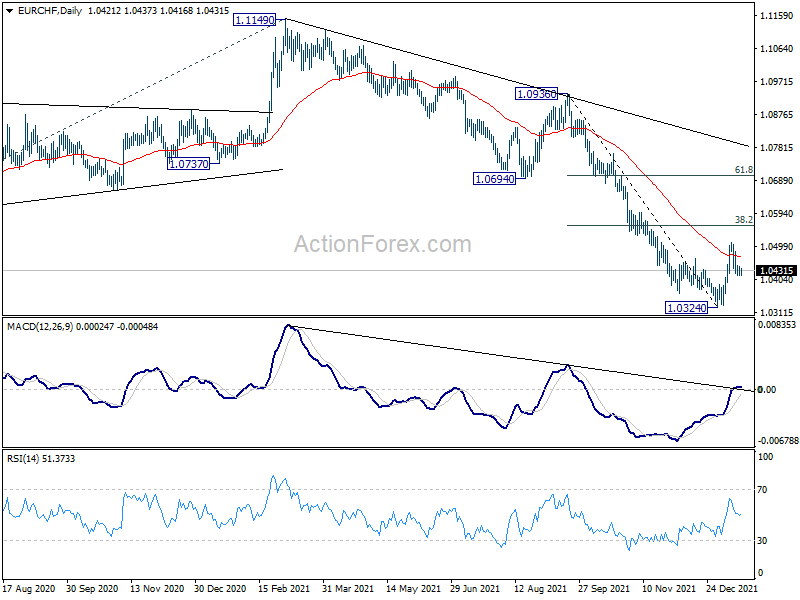
Intraday bias in EUR/CHF stays neutral and outlook is unchanged. Rebound from 1.0324 could still extend higher. But upside should be limited by 38.2% retracement of 1.0936 to 1.0324 at 1.0558. On the downside, firm break of 1.0423 will bring retest of 1.0324 low. Break there will resume larger down trend from 1.1149.
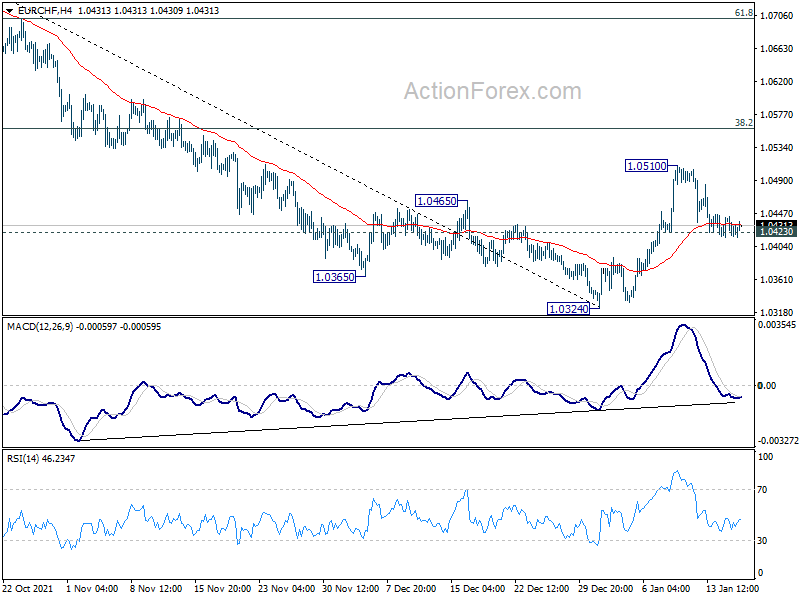
In the bigger picture, long term down trend from 1.2004 (2018 high) is now extending. Next target is 61.8% projection of 1.2004 to 1.0505 to 1.1149 at 1.0223. On the upside, firm break of 1.0505 support turned resistance is needed to be the first sign of medium term bottoming. Otherwise, outlook will remain bearish even in case of rebound.
USD/CAD Daily Outlook
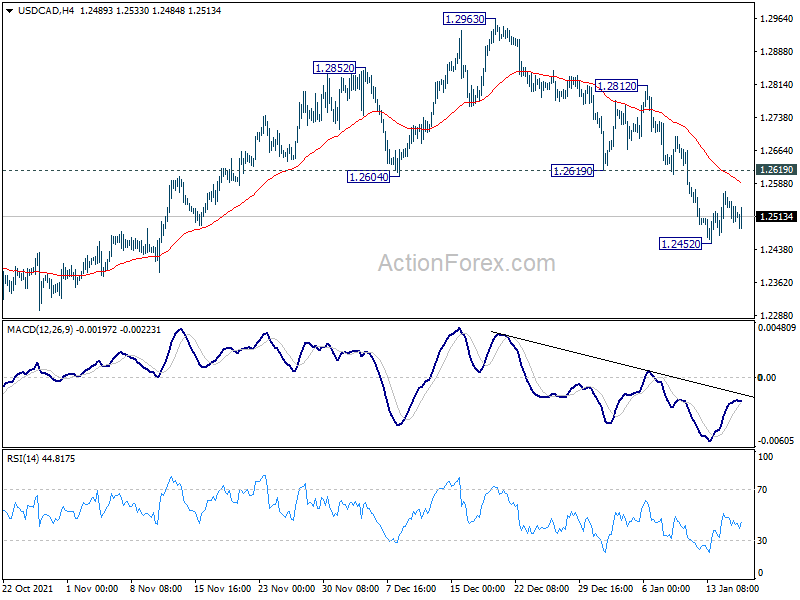
Daily Pivots: (S1) 1.2493; (P) 1.2525; (R1) 1.2550; More...
USD/CAD is staying in consolidation from 1.2452 and intraday bias remains neutral first. Further fall is expected as long as 1.2619 support turned resistance holds. Current development argues that whole pattern from 1.2005 has completed with three waves to 1.2963. Below 1.2452 will target 1.2286 support, and possibly further to retest 1.2005 low. Nevertheless, firm break of 1.2619 will bring stronger rebound back to 1.2812 resistance.
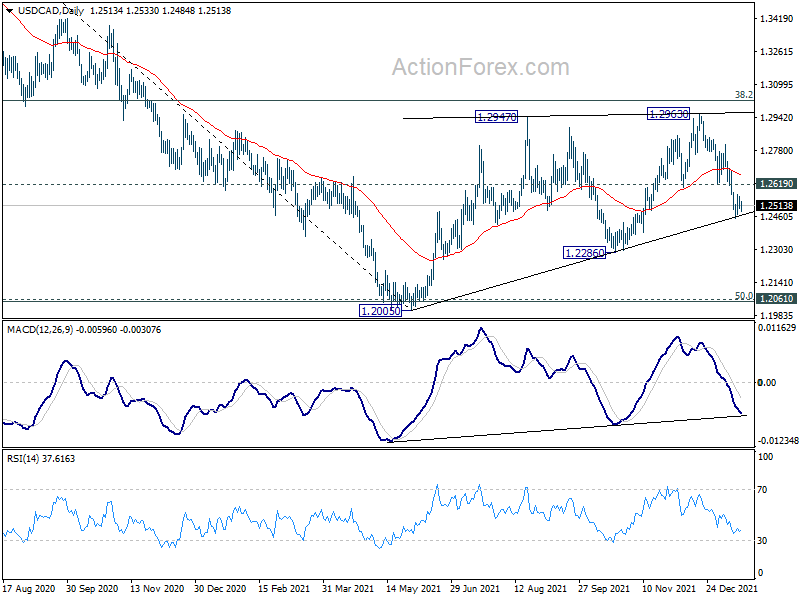
In the bigger picture, focus will be on 38.2% retracement of 1.4667 (2020 high) to 1.2005 (2021 low) at 1.3022. Sustained break there should confirm that the down trend from 1.4667 has completed after defending 1.2061 long term cluster support. Further rise would then be seen towards 61.8% retracement at 1.3650. However, rejection by 1.3022 will maintain medium term bearishness. Break of 1.2005 will resume the down trend form 1.4667 and that carries larger bearish implications too.
AUD/USD Daily Report
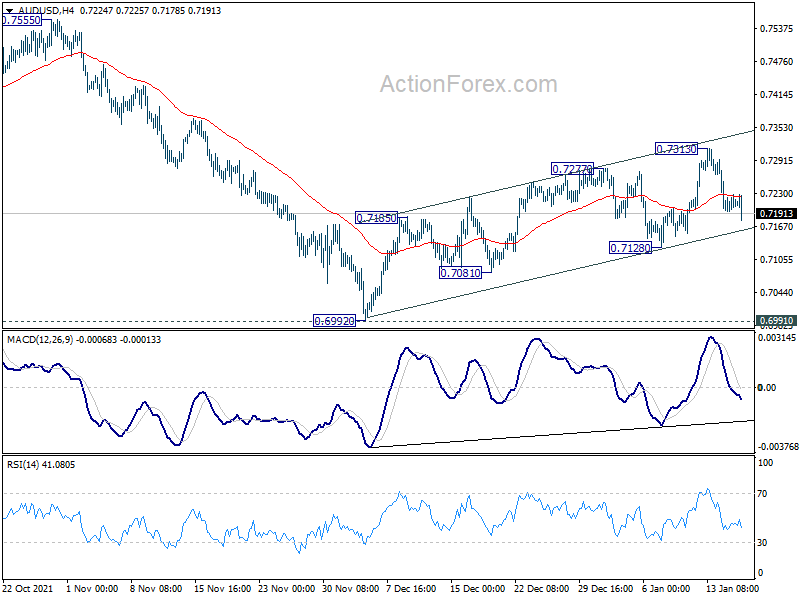
Daily Pivots: (S1) 0.7194; (P) 0.7212; (R1) 0.7228; More...
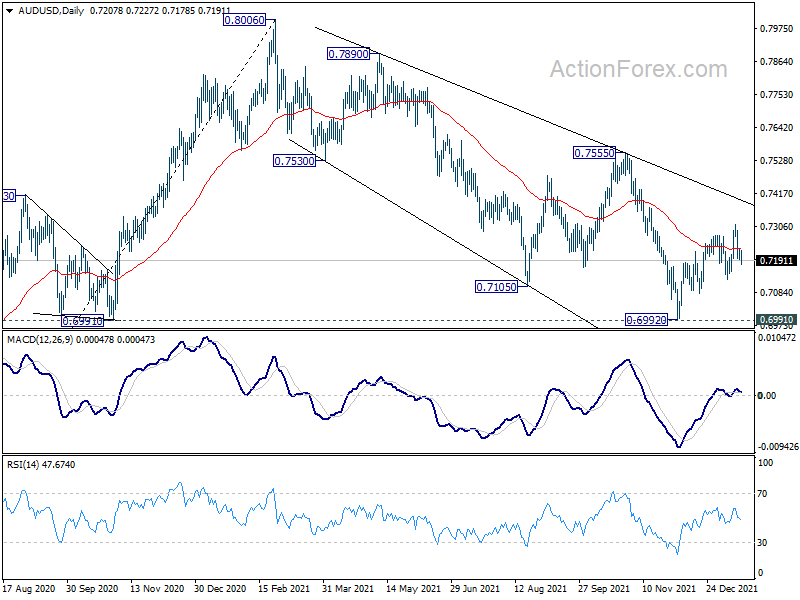
Intraday bias in AUD/USD remains neutral first. We're still slightly favoring the case that correction from 0.8006 is complete after defending 0.6991. Above 0.7313 will extend the rise from 0.6992 to 0.7555 resistance. However, break of 0.7128 support will dampen this bullish case and bring retest of 0.6991/2 instead.
In the bigger picture, strong rebound from 0.6991 key structural support will retain medium term bullishness. That is, whole up trend from 0.5506 is still in progress. Firm break of 0.7555 resistance will target 0.8006 high and above. However, sustained break of 0.6991 will argue that the whole up trend from 0.5506 might be finished at 0.8006, after rejection by 0.8135 long term resistance. Deeper decline would then be seen back to 61.8% retracement of 0.5506 to 0.8006 at 0.6461.